28
M.J. Bradley & Associates LLC (978) 369 5533 / www.mjbradley.com EPA’s Clean Power Plan Summary of IPM Modeling Results JANUARY 13, 2016 Last updated: January 14, 2016 7:10 AM

M.J. Bradley & Associates LLC
(978) 369 5533 / www.mjbradley.com
EPA’s Clean Power Plan
Summary of IPM Modeling Results
J A N U A R Y 1 3 , 2 0 1 6
Last updated: January 14, 2016 7:10 AM

M.J. Bradley & Associates LLC
(978) 369 5533 / www.mjbradley.com2
Acknowledgments
The following analysis of EPA’s final Clean Power Plan (CPP) is based on Integrated Planning Model (IPM®) runs conducted by ICF International, and assumptions developed by M.J. Bradley & Associates (MJB&A). IPM® is a detailed model of the electric power system that is used routinely by industry and regulators to assess the effects of environmental regulations and policy. It integrates extensive information on power generation, fuel mix, transmission, energy demand, prices of electricity and fuel, environmental policies, and other factors.
These model runs are illustrative and not intended to be a prediction of the future; rather, the modelling is intended to assist stakeholders in understanding the implications of key policy decisions and assumptions, such as the form of the standards, the level of energy efficiency, and the degree of compliance flexibility (i.e., trading).
This report and the assumptions and scenarios for this analysis were developed by M.J. Bradley & Associates (MJB&A).
We would also like to acknowledge the valuable insights and constructive feedback of the following individuals in preparing this analysis: Derek Murrow, Starla Yeh, and Kevin Steinberger (Natural Resources Defense Council); Derek Furstenwerth (Calpine Corporation); Kathleen Robertson (Exelon Corporation); Ray Williams, Jeff Brown, and Xantha Bruso (PG&E Corporation); Michael Goggin (American Wind Energy Association); Jennifer Macedonia (Bipartisan Policy Center); Nicholas Bianco (Environmental Defense Fund); Rick Umoff (Solar Energy Industries Association); and Noah Kaufman and Kevin Kennedy (World Resources Institute).
For questions or comments about this report, please contact:
Christopher Van AttenM.J. Bradley & Associates, LLCE-mail: [email protected]: 978-369-5533

M.J. Bradley & Associates LLC
(978) 369 5533 / www.mjbradley.com3
Executive Summary
The following report summarizes the results of 16 IPM model runs, evaluating two Reference Cases (business-as-usual
scenarios) and 14 alternative Clean Power Plan (CPP) regulatory scenarios. For example, several of the cases assume
that states adopt EPA’s mass-based emissions goals. The cases also assume varying levels of demand-side energy
efficiency. Based on the model runs completed to date, we offer the following observations and insights:
• Across a wide range of scenarios and assumptions, the results show that CPP targets are very achievable.
• The ability for power producers to trade leads to significant cost savings and flexibility for power producers.
• Increasing investment in energy efficiency programs reduces overall compliance costs because plants purchase less
fuel and fewer new plants need to be built.
• States can meet the Clean Power Plan’s emissions goals while relying on a diverse mix of supply- and demand-side
resources, including energy efficiency, renewables, nuclear, natural gas and coal.
• EPA requires that mass-based state plans address the potential for “emissions leakage." Leakage results from the
incentives under a mass-based plan to shift generation and emissions to new fossil-fired power plants outside the
program. Our analysis shows that CO2 emissions would increase with an “existing only” mass-based program versus
an “existing plus new” source program. The most straightforward approach to address this issue is to adopt the
“existing plus new” source mass limits, which is an option available to the states under the CPP. In addition, in the
proposed model rule and federal plan, EPA has proposed a method for allocating allowances within an existing-only
program to mitigate leakage. Although our modeling indicates the particular method proposed would have a minor
impact on emissions leakage, EPA is taking comment on other approaches that could be more effective.
• There are additional sensitivity runs that were not evaluated as part of this study, which we hope to continue
evaluating over the coming months, including: potential retirement of existing nuclear units; low gas prices; California’s
participation in trading systems with other states; additional “patchwork” policy and trading scenarios.
• This analysis was designed prior to Congressional approval of the phase-down of the Production Tax Credit (PTC) for
wind energy and the extension of the Investment Tax Credit (ITC) for solar energy. We will plan to include these tax
extensions in future model runs.

M.J. Bradley & Associates LLC
(978) 369 5533 / www.mjbradley.com4
Methodology

M.J. Bradley & Associates LLC
(978) 369 5533 / www.mjbradley.com5
Assumptions
• This analysis was based on IPM runs conducted by ICF International. M.J. Bradley & Associates relied on the
assumptions from EPA’s Base Case 5.15 implementation of IPM® as the starting the point for the assumptions that
were used for this analysis. These assumptions are detailed here: http://www2.epa.gov/airmarkets/power-sector-
modeling-platform-v515.
• EPA’s Base Case (5.15) relies on AEO 2015 Demand Growth assumptions, updated cost and performance
assumptions for renewable technologies, updated gas supply assumptions, and existing regulatory requirements
(e.g., CSAPR and MATS). The PTC and ITC were assumed to expire as previously required by law.
• Consistent with EPA’s modeling of the Clean Power Plan, this analysis does not assume banking of allowances and
ERCs.
• In addition, M.J. Bradley & Associates made several modifications to EPA’s assumptions, as detailed below.
• Some additional firm fossil unit retirements (17 units; 5.6 GW) were added, based on public announcements.
• Energy efficiency adoption was modeled in the policy cases based on a simplified “supply curve” of program costs
developed from a comprehensive Lawrence Berkeley National Laboratory (LBNL) cost study.
• AB 32 CO2 Allowance Prices were based on the California Energy Commission (CEC) IEPR “High Energy
Consumption Case” through 2020; prices were held constant at 2020 levels (in real terms) post-2020. This is
higher than the allowance prices that EPA had used in its CPP modeling.
• California’s SB 350 RPS policy was implemented in the model.
• The carbon emissions charge on electricity imports to California was removed in 2022 and beyond in the CPP
policy cases based on the logic that the country has transitioned to a national CO2 program for the power sector.
• RGGI was assumed to remain at its 2020 goal in the Reference Case and Policy Cases.

M.J. Bradley & Associates LLC
(978) 369 5533 / www.mjbradley.com6
Scenarios Evaluated
• The modeling included two Reference Case scenarios (no CPP) and 14 Policy Case scenarios:
• Two Reference Case scenarios: (1) “RCa” assumes no additional energy efficiency savings beyond what is
reflected in EIA’s AEO 2015 demand forecast; and (2) “RCb” assumes our “business-as-usual” level of energy
efficiency savings described below (what we call the “current EE” savings levels)
• Seven mass-based scenarios (both “Existing Only” and “Existing plus New”)
• Three blended rate scenarios (these are the state-specific fossil rates in the final rule)
• Two dual rate scenarios (steam and NGCC)
• One patchwork scenario that combined mass-based and rate-based standards
• The Policy Case scenarios are based on EPA’s final rule published in the Federal Register on October 23, 2015.
• The modeling varied the extent of allowance/ERC trading across the Policy Cases to reflect the choices that states
have in implementing the rule (see slide 12).
• The modeling varied the amount of energy efficiency available in our “supply curve” across the cases (see appendix
for more detail):
• Current EE (CEE): States can achieve savings up to their current (2013) annual savings rates between 2018
and 2030. This results in the lowest total energy efficiency savings among the three approaches.
• Modest EE (EE1): States achieve up to a 1% annual savings rate (the same levels assumed by EPA in its RIA
modelling). Nineteen states either have achieved, or have established requirements that will lead them to
achieve, this rate of incremental electricity demand reduction on an annual basis.
• Significant EE (EE2): States achieve up to a 2% annual savings rate.
• Most of the mass-based scenarios assumed that allowances would be auctioned; one of the scenarios modeled
EPA’s proposed Federal Plan allocation methodology.

M.J. Bradley & Associates LLC
(978) 369 5533 / www.mjbradley.com7
Mass-Based Scenarios
Case No. Assumptions Key
for Charts
Sources Allocation EE Levels Trading Zones
■ MB01 e+n state ee1 Existing + New Auction Modest (1%) State-by-state compliance
(except RGGI)
■ MB02 e+n national cee Existing + New Auction Current (Historic
Savings Rates)
Nationwide (except
California)
■ MB03 e+n national ee1 Existing + New Auction Modest (1%) Nationwide (except
California)
■ MB04 e+n national ee2 Existing + New Auction Significant (2%) Nationwide (except
California)
■ MB05 e national cee Existing Only Auction Current (Historic
Savings Rates)
Nationwide (except
California)
■ MB06 e national ee1 Existing Only Auction Modest (1%) Nationwide (except
California)
■ MB07 e national ee1 oba Existing Only Federal Plan Modest (1%) Nationwide (except
California)
Key: MB = mass based, e+n = existing + new, e = existing only, state = no trading, national = nationwide trading (except Cal.), cee = current EE, ee1 = modest EE
levels, ee2 = significant EE levels, oba = output based allocation (federal plan proposed allocation methodology)
Note: In all cases, we assume CEC-projected carbon prices in California—not the CPP mass goals for the state—and the RGGI states are assumed to comply
with a region-wide, mass-based target equal to the 2020 RGGI cap, except in MB02, MB03 and MB04, where RGGI states trade these allowances nationally.
These assumptions result in compliance with the CPP mass goals for California and the RGGI states under all cases except for MB03.
M.J. Bradley & Associates LLC
(978) 369 5533 / www.mjbradley.com8
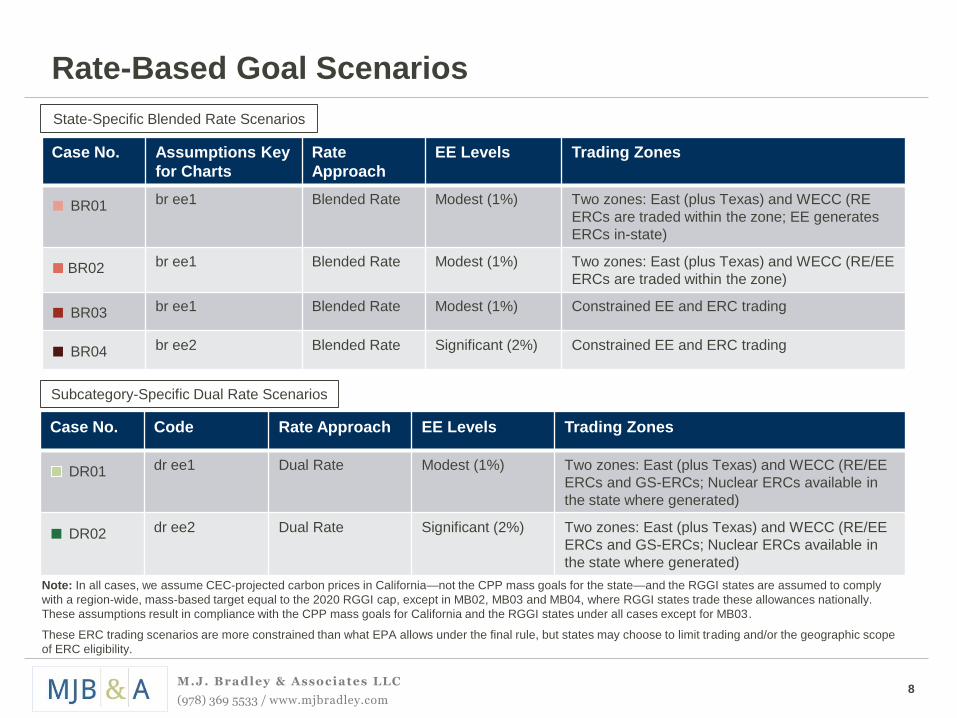
Rate-Based Goal Scenarios
Case No. Assumptions Key
for Charts
Rate
Approach
EE Levels Trading Zones
■ BR01 br ee1 Blended Rate Modest (1%) Two zones: East (plus Texas) and WECC (RE
ERCs are traded within the zone; EE generates
ERCs in-state)
■ BR02 br ee1 Blended Rate Modest (1%) Two zones: East (plus Texas) and WECC (RE/EE
ERCs are traded within the zone)
■ BR03 br ee1 Blended Rate Modest (1%) Constrained EE and ERC trading
■ BR04 br ee2 Blended Rate Significant (2%) Constrained EE and ERC trading
Case No. Code Rate Approach EE Levels Trading Zones
DR01 dr ee1 Dual Rate Modest (1%) Two zones: East (plus Texas) and WECC (RE/EE
ERCs and GS-ERCs; Nuclear ERCs available in
the state where generated)
■ DR02 dr ee2 Dual Rate Significant (2%) Two zones: East (plus Texas) and WECC (RE/EE
ERCs and GS-ERCs; Nuclear ERCs available in
the state where generated)
Subcategory-Specific Dual Rate Scenarios
State-Specific Blended Rate Scenarios
Note: In all cases, we assume CEC-projected carbon prices in California—not the CPP mass goals for the state—and the RGGI states are assumed to comply
with a region-wide, mass-based target equal to the 2020 RGGI cap, except in MB02, MB03 and MB04, where RGGI states trade these allowances nationally.
These assumptions result in compliance with the CPP mass goals for California and the RGGI states under all cases except for MB03.
These ERC trading scenarios are more constrained than what EPA allows under the final rule, but states may choose to limit trading and/or the geographic scope
of ERC eligibility.

M.J. Bradley & Associates LLC
(978) 369 5533 / www.mjbradley.com9
Patchwork Scenario
Case No. Code Regulatory Approach EE Levels Trading Zones
■ PW01 MB/EN/DR ee1 Mix of rate and mass Modest (1%) See map
Assumes multiple mass-based
trading zones with the exception of
the Southeast and Florida, which is
assumed to adopt a dual rate
approach. Mass-based states are
assumed to regulate both existing
and new sources. There is no
trading of allowances across zones.
Also, mass-based states do not
generate ERC credits for use in the
Southeast region.
Key: PW = Patchwork, MB/EN/DR = Combination of Mass Based (Existing plus New) and Dual Rate, ee1 = modest EE
Note: In all cases, we assume CEC-projected carbon prices in California—not the CPP mass goals for the state—and the RGGI states are assumed to comply
with a region-wide, mass-based target equal to the 2020 RGGI cap, except in MB02, MB03 and MB04, where RGGI states trade these allowances nationally.
These assumptions result in compliance with the CPP mass goals for California and the RGGI states under all cases except for MB03.
RGGI
Southeast
South Central and Texas
North Central
Northwest
California
East Central
West

M.J. Bradley & Associates LLC
(978) 369 5533 / www.mjbradley.com10
ERC Modeling
Blended Rate Scenarios
• Under the Blended Rate scenarios, the geographic scope of ERC crediting and trading varied across the cases:
• Option1. EE and RE projects can apply for ERCs in any other rate-based state (within each trading zone) – BR02
• This option represents the flexibility inherent in the final rule
• Option 2. Only RE projects can apply for ERCs in any other rate-based state; EE ERCs are only available for compliance in the state where they are generated – BR01
• Option 3. EE and RE projects can apply for ERCs within each market region, to mimic deliverability (i.e., PPA) requirements – BR03 and BR04
• This scenario may be more likely to occur in practice
• Additionally, existing NGCCs are credited at the difference between the plant emissions rate and the state blended rate; these ERCs are only available in the state where they are generated
Dual Rate Scenarios
• Under the Dual Rate scenarios, ERCs were credited and traded within two zones to reduce the computational burden on the model: East (plus Texas) and WECC.
• The model credits incremental renewable generation, energy efficiency, and under construction nuclear generation. The model also credits existing NGCC with GS-ERCs. As required by the rule, GS-ERCs can only be used by steam generating units; however, there are always sufficient steam MWhs within each of the trading zones to consume all of the GS-ERCs.
• Nuclear ERCs were only available for compliance in the state where they were generated.

M.J. Bradley & Associates LLC
(978) 369 5533 / www.mjbradley.com11
Results
M.J. Bradley & Associates LLC
(978) 369 5533 / www.mjbradley.com12
2.65
2.24RCa: 2.20
MB01: 1.79
MB03: 1.83
BR01: 1.76
DR01: 1.76
PW01: 1.88
0.0
0.5
1.0
1.5
2.0
2.5
3.0
2000 2005 2010 2015 2020 2025 2030
Historic
Reference Case [RCa]
MB01 [e+n state ee1]
MB03 [e+n national ee1]
BR01 [br ee1]
DR01 [dr ee1]
PW01 [MB/EN/DR ee1]
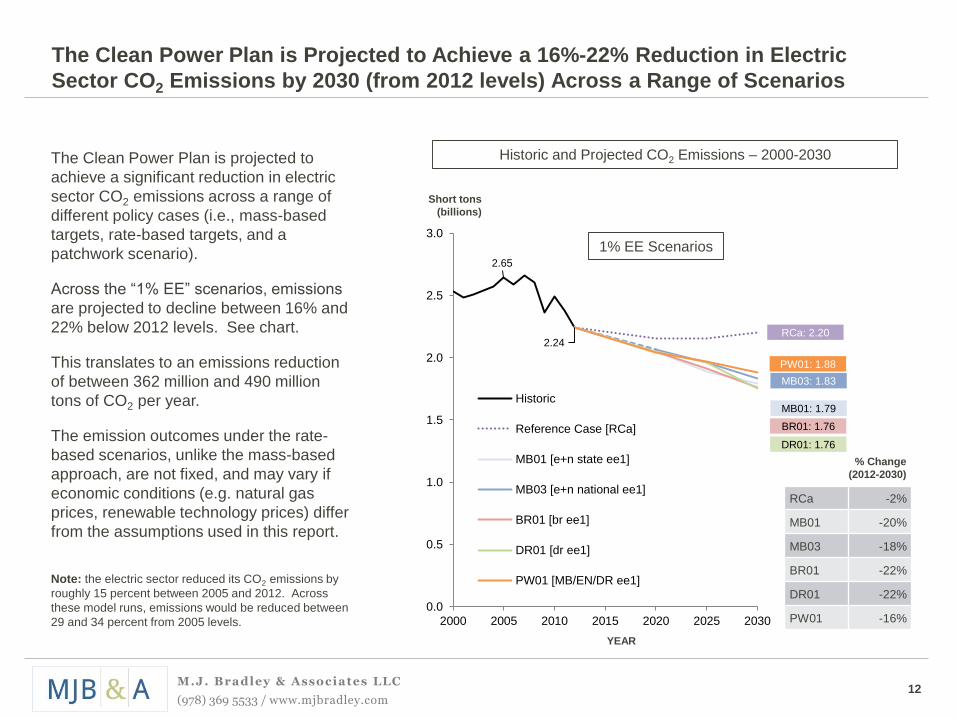
The Clean Power Plan is Projected to Achieve a 16%-22% Reduction in Electric
Sector CO2 Emissions by 2030 (from 2012 levels) Across a Range of Scenarios
Short tons
(billions)
Historic and Projected CO2 Emissions – 2000-2030
1% EE Scenarios
YEAR
RCa -2%
MB01 -20%
MB03 -18%
BR01 -22%
DR01 -22%
PW01 -16%
% Change
(2012-2030)
The Clean Power Plan is projected to
achieve a significant reduction in electric
sector CO2 emissions across a range of
different policy cases (i.e., mass-based
targets, rate-based targets, and a
patchwork scenario).
Across the “1% EE” scenarios, emissions
are projected to decline between 16% and
22% below 2012 levels. See chart.
This translates to an emissions reduction
of between 362 million and 490 million
tons of CO2 per year.
The emission outcomes under the rate-
based scenarios, unlike the mass-based
approach, are not fixed, and may vary if
economic conditions (e.g. natural gas
prices, renewable technology prices) differ
from the assumptions used in this report.
Note: the electric sector reduced its CO2 emissions by
roughly 15 percent between 2005 and 2012. Across
these model runs, emissions would be reduced between
29 and 34 percent from 2005 levels.

M.J. Bradley & Associates LLC
(978) 369 5533 / www.mjbradley.com13
1,528 1,404 1,371 1,375
1,020 1,080 1,069 983
194
769779 775 764
276304 335 335
160
415 453 48372 165 225
0
1,000
2,000
3,000
4,000
5,000
'12 '20 '25 '30
1,528 1,430 1,399 1,414
1,020 1,115 1,112 1,009
326
769 789 791 780
276 305 334 334
160
418457 487
0
1,000
2,000
3,000
4,000
5,000
'12 '20 '25 '30
The Reference Case Projects an Increase in Total Electricity Generation (from 2012
to 2030) with Increases in Renewable and Natural Gas-Fired Generation
Assumes existing power
sector regulations (MATS,
CSAPR, 316(b), AB 32,
RGGI, state RPS)
No Clean Power Plan
AEO 2015 demand growth
Henry Hub Gas price =
$5.14 to $6.00 ($/mmBtu)*
PTC and ITC were assumed
to expire
80 GW of coal retirements
by 2030, including 17 GW of
firm (announced)
retirements after 2016.
5.5 GW of nuclear
retirements by 2030,
including 3 GW of firm
(announced) retirements
after 2016.
RCa Generation – 2012-2030
*Natural gas prices were projected based on ICF’s Integrated Gas Module, a component of the IPM model that models the natural gas
market in the U.S. based on resource cost curves, pipeline data, and storage facilities consistent with EPA IPM v5.15 assumptions.
TWh
Reference Case Highlights
RCb Generation – 2012-2030
Note: RCb assumes additional energy efficiency savings beyond what is reflected in the AEO 2015
demand growth forecast. States are assumed to achieve their current (2013) annual savings rates
between 2018 and 2030.
1,528 1,404 1,371 1,375
1,020 1,080 1,069 983
194
769779 775 764
276304 335 335
160
415 453 48372 165 225
0
1,000
2,000
3,000
4,000
5,000
'12 '20 '25 '30
Coal NGCC (Existing) NGCC (New) O/G Steam Other CT Nuclear Hydro Renewable Energy Efficiency

M.J. Bradley & Associates LLC
(978) 369 5533 / www.mjbradley.com14
1,528 1,330 1,266 1,180
1,0201,091 1,026
910
769783
775768
276304 333
331
160
413 449479
117 324 587
0
1,000
2,000
3,000
4,000
5,000
'12 '20 '25 '30
1,528 1,336 1,249 1,113
1,0201,112 1,068
938
319
769806 802 794
276 304 334 331
160
433 458 497
25 206 347
0
1,000
2,000
3,000
4,000
5,000
'12 '20 '25 '30
1,528 1,314 1,239 1,068
1,0201,092 1,068
928
467
769808 804 797
276304 334 332
160
430 463 517
72 165 225
0
1,000
2,000
3,000
4,000
5,000
'12 '20 '25 '30
Total Generation and the Generation Mix Varies Across the Policy Cases Depending
on the Level of Energy Efficiency Deployed (Current, Modest, Significant)
MB03 – Modest EEMB02 – Current EE
TWh TWh
Existing + New, Current EE, Nationwide Trading Existing + New, 1% EE, Nationwide Trading
YEAR YEAR
MB04 – Significant EE
TWh
Existing + New, 2% EE, Nationwide Trading
YEAR
1,528 1,404 1,371 1,375
1,020 1,080 1,069 983
194
769779 775 764
276304 335 335
160
415 453 48372 165 225
0
1,000
2,000
3,000
4,000
5,000
'12 '20 '25 '30
Coal NGCC (Existing) NGCC (New) O/G Steam Other CT Nuclear Hydro Renewable Energy Efficiency

M.J. Bradley & Associates LLC
(978) 369 5533 / www.mjbradley.com15
27%
25%
24%
24%
23%
24%
24%
28%
28%
28%
27%
25%
24%
24%
31%
32%
22%
22%
24%
23%
26%
25%
25%
21%
21%
21%
21%
21%
21%
22%
22%
23%
5%
2%
3%
2%
4%
3%
3%
6%
6%
8%
2%
7%
11%
8%
4%
7%
18%
17%
18%
17%
18%
18%
18%
18%
18%
18%
17%
18%
18%
18%
17%
18%
8%
8%
8%
7%
8%
8%
8%
8%
8%
8%
7%
8%
8%
8%
8%
8%
12%
11%
15%
11%
13%
13%
14%
11%
11%
11%
11%
11%
12%
11%
11%
11%
8%
13%
8%
13%
8%
8%
8%
8%
8%
5%
13%
8%
5%
8%
5%
0% 20% 40% 60% 80% 100%
PW01 [MB/EN/DR ee1]
DR02 [dr ee2]
DR01 [dr ee1]
BR04 [br ee2]
BR03 [br ee1]
BR02 [br ee1]
BR01 [br ee1]
MB07 [e national ee1 oba]
MB06 [e national ee1]
MB05 [e national cee]
MB04 [e+n national ee2]
MB03 [e+n national ee1]
MB02 [e+n national cee]
MB01 [e+n state ee1]
Reference Case [RCb]
Reference Case [RCa]
The Clean Power Plan’s Emissions Goals Are Achievable While Relying on a
Diverse Mix of Resources
Across all of the model runs, there is
variability in the projected generation
mix.
Relative to the Reference Case, coal
generation declines, on average, by
21% in 2030 (averaging across all of
the scenarios), but continues to supply
between 23% and 28% of electricity,
across all of the cases evaluated.
Natural gas (NGCC) is projected to
supply between 25% and 32% of
electricity in 2030, across all of the
cases evaluated.
Renewable energy is projected to
supply between 11% and 15% of
electricity in 2030, across all of the
cases evaluated.
Percent Generation by Fuel Type - 2030
27%
25%
24%
24%
23%
24%
24%
28%
28%
28%
27%
25%
24%
24%
31%
32%
27%
24%
27%
25%
30%
28%
28%
27%
27%
29%
23%
29%
32%
30%
27%
30%
18%
17%
18%
17%
18%
18%
18%
18%
18%
18%
17%
18%
18%
18%
17%
18%
8%
8%
8%
7%
8%
8%
8%
8%
8%
8%
7%
8%
8%
8%
8%
8%
12%
11%
15%
11%
13%
13%
14%
11%
11%
11%
11%
11%
12%
11%
11%
11%
8%
13%
8%
13%
8%
8%
8%
8%
8%
5%
13%
8%
5%
8%
5%
0% 20% 40% 60% 80% 100%
PW01 [MB/EN/DR 1 pct]
DR02 [dr 2pct]
DR01 [dr 1pct]
FR04 [fr 2pct]
FR03 [fr 1pct]
FR02 [fr 1pct]
FR01 [fr 1pct]
MB07 [e national 1 pct oba]
MB06 [e national 1pct]
MB05 [e national bau]
MB04 [e+n national 2pct]
MB03 [e+n national 1pct]
MB02 [e+n national bau]
MB01 [e+n state 1pct]
Reference Case [RCb]
Reference Case [RCa]
Coal NGCC (Existing) NGCC (New) O/G Steam CT Nuclear Hydro Renewable Other Energy Efficiency

M.J. Bradley & Associates LLC
(978) 369 5533 / www.mjbradley.com16
The Mass-Based Policy Runs Project Modest Allowance Prices in the Early Years of
the Program; Increasing the Level of EE Moderates the Prices Even Further.
Scenario Assumptions 2025 (2012$)
2030(2012$)
MB02 Existing + New, Current EE, Nationwide $0.76 $19.55
MB03 Existing + New, 1% EE, Nationwide $0 $16.37
MB04 Existing + New, 2.0% EE, Nationwide $0 $7.10
MB06 Existing Only, 1% EE, Nationwide, auction $0.69 $9.05
MB07 Existing Only, 1% EE, Nationwide, federal plan allocation $1.00 $8.80
Five model runs assumed mass-based, nationwide trading (except California), producing national allowance prices. The
allowance prices are relatively modest across the scenarios, particularly in the early years of the program.
As the level of energy efficiency increases, the model forecasts a reduction in allowance prices (see cases MB02, MB03,
and MB04 in the table below).
Note: this analysis does not assume banking of allowances and the CPP goals are assumed to remain constant post-2030.

M.J. Bradley & Associates LLC
(978) 369 5533 / www.mjbradley.com17
0
50
100
150
200
250
300
2010
2011
2012
2013
2014
2015
2020
2025
RC
a
RC
b
MB
01
MB
02
MB
03
MB
04
BR
01
BR
02
BR
03
BR
04
DR
01
DR
02
PW
01
Historic RCa BAU Mass-Based Blended Rates Dual Rates Mix
Renewable Energy is Projected to Continue to Expand in All Cases
The Reference Case and CPP Policy Cases project continued growth in solar and wind energy capacity.
Under the Clean Power Plan, incremental renewable energy capacity (post-2012) is eligible to generate “Emission Rate
Credits” (ERCs) under a rate-based trading program, and under a mass-based program renewables help to meet the
mass-based targets by providing a zero-emission source of energy.
Gigawatts
Note: The PTC and ITC are assumed to expire as previously required under federal law. Solar capacity is utility-scale only.
Historic data is from EIA’s AEO 2015 and AEO 2013.
Historic2010-2015
Renewable Capacity by Type (GW)
All Cases Projected: 2030
39
39
39
39
40
40
40
40
40
2012
Solar
Wind
RCaProjected:
‘20 and ‘25
Reference Case [RCa]
Reference Case [RCb]
MB01 [e+n state ee1]
MB02 [e+n national cee]
MB03 [e+n national ee1]
MB04 [e+n national ee2]
BR01 [br ee1]
BR02 [br ee1]
BR03 [br ee1]
BR04 [br ee2]
DR01 [dr ee1]
DR02 [dr ee2]
PW01 [MB/EN/DR ee1]
Key:

M.J. Bradley & Associates LLC
(978) 369 5533 / www.mjbradley.com18
0
5
10
15
20
25
30
35
40
MB
01
MB
02
MB
03
MB
04
BR
01
BR
02
BR
03
BR
04
DR
01
DR
02
PW
01
Mass-Based Blended Rates Dual Rates Mix
Compliance Flexibility Reduces the Level of Projected Coal Retirements
Trading and increasing the level of energy efficiency reduces incremental coal retirements:
• Coal retirements are reduced by 6 GW (-16%) between MB01 [e+n state ee1] and MB03 [e+n national ee1], which
assumes nationwide allowance trading (except California).
• Coal retirements are reduced by 14 GW (-38%) between MB02 [e+n national cee] and MB04 [e+n national ee2] .
The chart below summarizes the incremental coal retirements (above Reference Case levels) through 2030.
2030 Incremental Coal Retirements (GW)Gigawatts
MB01 [e+n state ee1]
MB02 [e+n national cee]
MB03 [e+n national ee1]
MB04 [e+n national ee2]
BR01 [br ee1]
BR02 [br ee1]
BR03 [br ee1]
BR04 [br ee2]
DR01 [dr ee1]
DR02 [dr ee2]
PW01 [MB/EN/DR ee1]
Key:
M.J. Bradley & Associates LLC
(978) 369 5533 / www.mjbradley.com19
2.65
2.24RCa: 2.20
MB03: 1.83
DR01: 1.76
MB05: 1.97
MB06: 1.93 MB07: 1.93
0.0
0.5
1.0
1.5
2.0
2.5
3.0
2000 2010 2020 2030
Historic
Reference Case [RCa]
MB03 [e+n national ee1]
DR01 [dr ee1]
MB05 [e national cee]
MB06 [e national ee1]
MB07 [e national ee1 oba]
RCa -2%
MB03 -18%
DR01 -22%
MB05 -12%
MB06 -14%
MB07 [oba] -14%
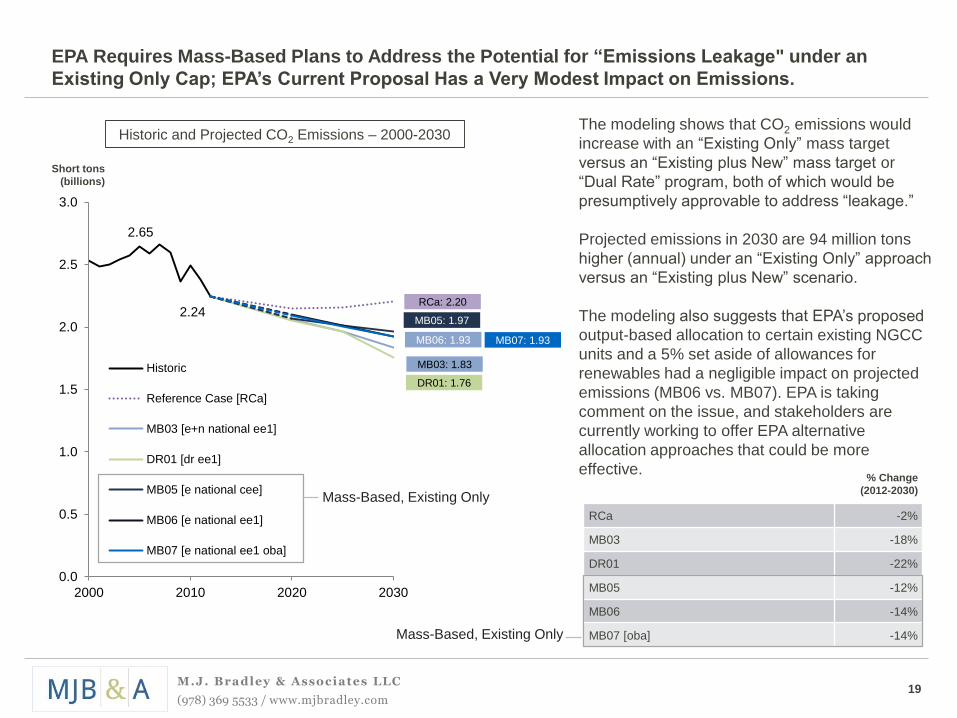
EPA Requires Mass-Based Plans to Address the Potential for “Emissions Leakage" under an
Existing Only Cap; EPA’s Current Proposal Has a Very Modest Impact on Emissions.
Short tons
(billions)
Historic and Projected CO2 Emissions – 2000-2030The modeling shows that CO2 emissions would
increase with an “Existing Only” mass target
versus an “Existing plus New” mass target or
“Dual Rate” program, both of which would be
presumptively approvable to address “leakage.”
Projected emissions in 2030 are 94 million tons
higher (annual) under an “Existing Only” approach
versus an “Existing plus New” scenario.
The modeling also suggests that EPA’s proposed
output-based allocation to certain existing NGCC
units and a 5% set aside of allowances for
renewables had a negligible impact on projected
emissions (MB06 vs. MB07). EPA is taking
comment on the issue, and stakeholders are
currently working to offer EPA alternative
allocation approaches that could be more
effective.
Mass-Based, Existing Only
% Change
(2012-2030)
Mass-Based, Existing Only

M.J. Bradley & Associates LLC
(978) 369 5533 / www.mjbradley.com20
-20
-15
-10
-5
0
5
10
15
20
RC
b
MB
01
MB
02
MB
03
MB
04
BR
01
BR
02
BR
03
BR
04
DR
01
DR
02
PW
01
RC Mass-Based Blended Rates Dual Rates Mix
-20
-15
-10
-5
0
5
10
15
20
RC
b
MB
01
MB
02
MB
03
MB
04
BR
01
BR
02
BR
03
BR
04
DR
01
DR
02
PW
01
RC Mass-Based Blended Rates Dual Rates Mix
The Analysis Projects Modest Impacts on Electric System Costs under the Clean
Power Plan Across a Wide Range of Scenarios
$ (billions)Incremental Costs (2012$) Relative to Reference Case: 2030Electric system costs include:
fuel, capital, O&M, and
energy efficiency program
costs (both utility and
participant costs).
IPM projects modest
increases in electric system
costs under the Clean Power
Plan based on the scenarios
evaluated. For example,
projected costs are 1.9%
higher in 2030 under
scenario MB03.
Based on the methodology
used by EPA in the final CPP
Regulatory Impact Analysis,
we estimate that the benefits
of reducing CO2 and other
pollutants (SO2 and NOx)
exceed the costs by $33
billion to $86 billion (2012$)
in 2030.
MB01 [e+n state ee1] 2.1%
MB02 [e+n national cee] 2.5%
MB03 [e+n national ee1] 1.9%
MB04 [e+n national ee2] 0.7%
BR01 [br ee1] 1.9%
% Change
(from Reference Case, RCa) BR02 [br ee1] 1.8%
BR03 [br ee1] 3.1%
BR04 [br ee2] 2.0%
DR01 [dr ee1] 1.3%
DR02 [dr ee2] 1.1%
PW01 [MB/EN/DR ee1] 0.4%
RCa = 0
Note: The existing only scenarios, MB05
and MB06, do not address leakage, so are
not included here.
1 2C C 1 1 2 EE Case1 1 1 2 1

M.J. Bradley & Associates LLC
(978) 369 5533 / www.mjbradley.com21
-13%
-12%
-14%
-20%
-8%
-5%
-8%
-17%
-25%
-20%
-15%
-10%
-5%
0%
MB01 MB02 MB03 MB04
The Analysis Projects Reductions in Monthly Household Electric Bills
Based on the methodology developed by
EPA using projected changes in electric
system costs, ICF International estimated
the resulting impact on sales-weighted
average retail bills for the continental U.S.
U.S. households would save between 5%
and 20% on their monthly electricity bills in
2030. The high range estimates assume
that revenue from auctioning allowances is
invested in bill assistance programs and/or
clean energy services that benefit electricity
customers. Conversely, the low estimates
assume auction revenue is utilized for other
purposes.
Increased investment in energy efficiency
also results in greater bill savings for
households; for example, savings (without
rebates) more than double between MB03
and MB04.
-13%
-12%
-14%
-20%
-8%
-5%
-8%
-17%
-25%
-20%
-15%
-10%
-5%
0%
MB01 MB02 MB03 MB04
% Change in Bills + Allowance Value % Change in Bills
-13%
-12%
-14%
-20%
-8%
-5%
-8%
-17%
-25%
-20%
-15%
-10%
-5%
0%
MB01 MB02 MB03 MB04
% Change in Bills + Allowance Value % Change in Bills
Percent Change in Retail Electric Bills
Note: Average retail bills are compared to Reference Case (RCa). The participant costs of energy efficiency programs are excluded from these retail bill estimates.
Instead, those costs are included in the calculation of incremental compliance costs, as shown on slide 20. Including participant costs would have a minimal impact
on the magnitude of these bill estimates.

M.J. Bradley & Associates LLC
(978) 369 5533 / www.mjbradley.com
Concord, MA
Headquarters
47 Junction Square Drive
Concord, Massachusetts
United States
Tel: 978 369 5533
Fax: 978 369 7712
www.mjbradley.com
Washington, DC
1225 Eye Street, NW, Suite 200
Washington, DC
United States
Tel: 202 525 5770
Contact MJB&A
22

M.J. Bradley & Associates LLC
(978) 369 5533 / www.mjbradley.com23
Appendix

M.J. Bradley & Associates LLC
(978) 369 5533 / www.mjbradley.com24
Run Year Structure
Model Year: Representative of:
2020 2019-2022
2025 2023-2027
2030 2028-2033
Note: throughout this summary report, when we refer to results in 2020, 2025, and 2030, we are referring to the
model years above.

M.J. Bradley & Associates LLC
(978) 369 5533 / www.mjbradley.com25
Demand-Side Energy Efficiency Assumptions
• Historic rates of energy efficiency savings differ for each state and were drawn from the data reported by utilities in
Energy Information Administration (EIA) Form 861, 2013, available at http://www.eia.gov/electricity/data/eia861/.
• In the “Current EE” scenario, the available supply of EE is calculated based on an extension of each state’s 2013
annual savings rate. The annual savings rate is held constant between 2018 and 2030 to derive incremental annual
savings and cumulative savings estimates for each state.
• In the “Modest EE” scenario, the available supply of EE is calculated based on the methodology in EPA’s Regulatory
Impact Analysis (RIA) for the Clean Power Plan. Cumulative efficiency savings are projected for each state for each
year by ramping up from historic savings levels to a target annual incremental demand reduction rate of 1.0 percent
of electricity demand over a period of years starting in 2020, and maintaining that rate throughout the modeling
horizon.
• Consistent with EPA’s approach, the pace of improvement from the state’s historical incremental demand reduction
rate is set at 0.2 percentage points per year, beginning in 2020, until the target rate of 1.0 percent is achieved.
• States already at or above the 1.0 percent target rate are assumed to achieve a 1.0 percent rate beginning in 2020
and sustain that rate thereafter.
• In the “Significant EE” scenario, the available supply of EE is calculated based on the same methodology as the
“Modest EE” scenario, but each state ramps up to a target annual incremental demand reduction rate of 2.0 percent
of electricity demand.
• In the “Modest EE” and “Significant EE” scenarios, adoption of efficiency was modeled endogenously using a supply
curve of program costs. In this simplified supply curve approach, the highest amount of savings assumed to be
available to states in the supply curve varies by scenario, as described in the methodology above. The costs are
based on LBNL’s comprehensive 2015 cost study, available at: https://emp.lbl.gov/sites/all/files/total-cost-of-saved-
energy.pdf.
• Participant costs are accounted for in the calculation of total system costs.

M.J. Bradley & Associates LLC
(978) 369 5533 / www.mjbradley.com26
ERC Background
Under the dual-rate structure in the proposed state model rule for rate-based trading,
ERCs can be created by three categories of activities:
Incremental Zero-
Emitting Energy and
Energy Efficiency
• Renewable & nuclear
capacity installed post-
2012
• Energy efficiency
projects begun post-
2012
• Each MWh generated /
saved creates one
ERC
• Any affected EGU that
emits at a rate below its
compliance target
• Number of ERCs
generated per MWh
based on difference
between EGU rate and
compliance rate
Affected EGUs
• All NGCCs earn partial
“Gas Shift ERCs” for
every MWh
• Provide credit for
increases in NGCC
generation projected to
displace coal-fired
generation
• GS-ERCs can only be
used by fossil steam
sources for compliance
Existing NGCC
1 2 3
Note: The proposed Federal Plan would not credit energy efficiency. The GS-ERC crediting formula is up for comment.

M.J. Bradley & Associates LLC
(978) 369 5533 / www.mjbradley.com27
ERC Background, continued
Dual Rate or
Blended Rate
Dual Rate
Location of
Generation/Savings
Project can apply for ERCs in any dual rate-based state. The ERCs can
then be sold to affected sources in any state with the same rate-based plan
type. The project cannot earn ERCs in both states.
Location of ERC
Credit Award
Blended Rate Project can apply for ERCs in any blended rate-based state. The ERCs
can then be sold to affected sources in that state (or region, if states agree to
a common blended rate). The project cannot earn ERCs in both states.
Mass Dual Rate Project can apply for allowances or ERCs in either state or another
rate-based state (as long as the application to a rate-based state is
accompanied by a PPA showing delivery to a rate-based state). The
allowances or ERCs can be used for compliance by affected sources
covered by the same plan type. In all cases, a project that applies for ERCs
cannot also apply for allowances from a set-aside in a mass-based state.
ERC Eligibility Under Clean Power Plan
Dual Rate or
Blended Rate
M.J. Bradley & Associates LLC
(978) 369 5533 / www.mjbradley.com28
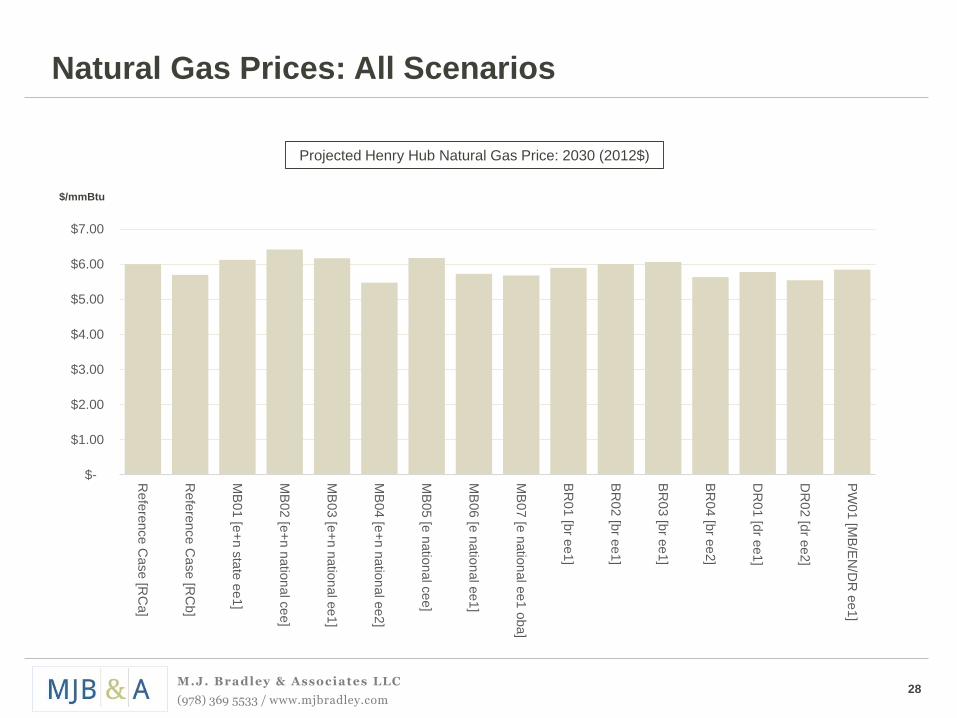
Natural Gas Prices: All Scenarios
$/mmBtu
Projected Henry Hub Natural Gas Price: 2030 (2012$)
$-
$1.00
$2.00
$3.00
$4.00
$5.00
$6.00
$7.00
Re
fere
nce C
ase [R
Ca]
Re
fere
nce C
ase [R
Cb]
MB
01
[e+
n s
tate
ee1]
MB
02
[e+
n n
atio
nal c
ee]
MB
03
[e+
n n
atio
nal e
e1
]
MB
04
[e+
n n
atio
nal e
e2
]
MB
05
[e n
atio
nal c
ee]
MB
06
[e n
atio
nal e
e1
]
MB
07
[e n
atio
nal e
e1
oba
]
BR
01 [b
r ee
1]
BR
02 [b
r ee
1]
BR
03 [b
r ee
1]
BR
04 [b
r ee
2]
DR
01 [d
r ee1
]
DR
02 [d
r ee2
]
PW
01 [M
B/E
N/D
R e
e1]


