DOEEIS-0217 July 1995 EPA(U.S. Environmental Protection Agency), 1993 b, Approval of Petition fora Treatability Variance from the Land Disposal Restrictions (LDR) Treatment Standards for In-Tank Precipitation Filters Submitted by the U.S. Department of Energy (DOE) Field Office, Savannah River, October 1, Harvey, S, A., 1994a, Bechtel Savmnah R]ver Incorporated, Aiken, South Carolina, Interoffice Memorandum to M. N. Hoganson, Hallibrrrton NUS Corporation, Aiken, South Carolina, “EIS Information,” September 19. Harvey, S, A., 1994b, Bechtel Savannah River Incorporated, Aiken, South Carolina, Interoffice Memorandum to M. N, Hoganson, Halliburton NUS Corporation, Aiken, South Carolina, “Waste Management EIS Information (Partial),” September 19. Hess, M, L., 1994a, Westinghouse Savannah River Company, Aiken, South Carolina, Interoffice Memorandum to H. L. Pope, U.S. Department of Energy, Savannah River Operations Office, Aiken, South Carolina, “Draft In-depth Option Analysis for Review and Comments,” ESH-NEP-94-O099, July 29. Hess, M. L., 1994b, Westinghouse Savannah R]ver Company, Aiken, South Carolina, Interoffice Memorandum to H. L. Pope, U.S. Department of Energy, Savannah River Operations Office, Aiken, South Carolina, “Waste Mirr/Decon Systems,” ESH-NEP-94-O 155, September 29. Hess, M. L,, 1994c, Westinghouse Savannah River Company, Aiken, South CarnIina, Interoffice Memorandum to H. L. Pope, U.S. Department of Energy, Savannah R]ver Operations Office, Aiken, South Carolina, “Tank Farm Volume Waste Forecast,” ESH-NEP-94-O 147, September 27. Hess M. L., 1994d, Westinghouse Savannah River Company, Aiken, South Carolina, Interoffice Memorandum to H. L. Pope, U.S. Department of Energy, Savannah River Operations Office, Aiken, South Carolina, “NMPD Liquid Waste Fnrecast,” ESH-NEP-94-O 150, September 28. Hess, M. L., 1994e, Westinghouse Savannah River Company, Aiken, South Carolina, Interoffice Memorandum to H. L. Pope, U.S. Department of Energy, Savannah River Operations Oftice, Aiken, South Carolina, “Complete Set of Flow Sheets,” ESH-NEP-94-0241, November 15. Hess, M. L., 1994f, Westinghouse Savannah River Company, Aiken, South Carolina, Interoffice Memorandum to H. L. Pope, U.S. Department of Energy, Savannah River Operations Office, Aiken, South Carolina, “Storage & Disposal Capabilities,” ESH-NEP-94-0226, October 28. 2-229
Transcript
DOEEIS-0217July 1995
EPA(U.S. Environmental Protection Agency), 1993 b, Approval of Petition fora Treatability Variance
from the Land Disposal Restrictions (LDR) Treatment Standards for In-Tank Precipitation Filters
Submitted by the U.S. Department of Energy (DOE) Field Office, Savannah River, October 1,
Harvey, S, A., 1994a, Bechtel Savmnah R]ver Incorporated, Aiken, South Carolina, Interoffice
Memorandum to M. N. Hoganson, Hallibrrrton NUS Corporation, Aiken, South Carolina, “EIS
Information,” September 19.
Harvey, S, A., 1994b, Bechtel Savannah River Incorporated, Aiken, South Carolina, Interoffice
Memorandum to M. N, Hoganson, Halliburton NUS Corporation, Aiken, South Carolina, “Waste
Management EIS Information (Partial),” September 19.
Hess, M, L., 1994a, Westinghouse Savannah River Company, Aiken, South Carolina, Interoffice
Memorandum to H. L. Pope, U.S. Department of Energy, Savannah River Operations Office, Aiken,
South Carolina, “Draft In-depth Option Analysis for Review and Comments,” ESH-NEP-94-O099,
July 29.
Hess, M. L., 1994b, Westinghouse Savannah R]ver Company, Aiken, South Carolina, Interoffice
Memorandum to H. L. Pope, U.S. Department of Energy, Savannah River Operations Office, Aiken,
South Carolina, “Waste Mirr/Decon Systems,” ESH-NEP-94-O 155, September 29.
Hess, M. L,, 1994c, Westinghouse Savannah River Company, Aiken, South CarnIina, Interoffice
Memorandum to H. L. Pope, U.S. Department of Energy, Savannah R]ver Operations Office, Aiken,
South Carolina, “Tank Farm Volume Waste Forecast,” ESH-NEP-94-O 147, September 27.
Hess M. L., 1994d, Westinghouse Savannah River Company, Aiken, South Carolina, Interoffice
Memorandum to H. L. Pope, U.S. Department of Energy, Savannah River Operations Office, Aiken,
South Carolina, “NMPD Liquid Waste Fnrecast,” ESH-NEP-94-O 150, September 28.
Hess, M. L., 1994e, Westinghouse Savannah River Company, Aiken, South Carolina, Interoffice
Memorandum to H. L. Pope, U.S. Department of Energy, Savannah River Operations Oftice, Aiken,
South Carolina, “Complete Set of Flow Sheets,” ESH-NEP-94-0241, November 15.
Hess, M. L., 1994f, Westinghouse Savannah River Company, Aiken, South Carolina, Interoffice
Memorandum to H. L. Pope, U.S. Department of Energy, Savannah River Operations Office, Aiken,
South Carolina, “Storage & Disposal Capabilities,” ESH-NEP-94-0226, October 28.
2-229
DOE/EIS-0217July I995
Hess, M. L., 1994g, Westinghouse Savannah River Company, Aiken, South Carolina, Interoffice
Memorandum to H. L. Pope, U.S. Department of Energy, Savannah River Operations Offme, A]ken,
South Carolina, “WSRC Data Transmittal - Revised Options Analysis Executive Summary,”
ESH-NEP-94-02 14, October21.
Hess, M. L., 1994h, Westinghouse SavanIlah River Company, Aiken, South Carolina, Interoffice
Memorandum to H. L. Pope, U.S. Department of Energy, Savannah River Operations Office, Aiken,
South Carolina, “Operational Scenarios for Experimental Transuranic Waste Assay Facility for
Waste Management Spreadsheets,” ESH-NEP-994-02 18, October 26.
Hess, M. L., 1994i, Westinghouse Savannah River Company, Aiken, South Cmolina, Interoffice
Memorandum to H. L. Pope, U.S. Department of Energy, Savannah River Operations OffIce, Aiken,
South Carolina, “Selection of Soil Technology,” ESH-NEP-94-0220, October 26.
Hess, M. L., 1994j, Westinghouse Savannah Mver Company, Aiken, South Carolina, Interoffice
Memorandum to H. L, Pope, U.S. Department of Energy, Savannah River Operations Office, Aiken,
South Carolina, “WSRC Data Transmittal - Use of TRUPACT-11 to Traasport Untreated Pu-23 8
Wastes (U),” ESH-NEP-95-OO02, January 5.
Hess, M. L., 1994k, Westinghouse Savannah River Company, Aiken, South Carolina, Interoffice
Memorandum to H, L. Pope, U.S. Department of Energy, Savannah River Operations Office, Aiken,
South Carolina, “Smelter Volume Reduction Factors,” ESH-NEP-94-O 185, Westinghouse Savannah
River Company, Aiken, South Carolina, October 10,
Hess, M. L., 199Sa, Westinghouse Savannah River Company, Aiken, South Carolina, Interoffice
Memorandum to H. L, Pope, U.S. Departmel~t of Energy, Savannah River Operations Office, A1ken,
South Carolina, “WSRC Data Transmittal - Summary of Changes BeWeen Drafi and Final WMEIS
Forecasts and Alternatives,” ESH-NEP-95-O084, May 15.
Hess, M. L., 1995b, Westinghouse Savannah River Company, Aiken, South Carolina, Interoffice
Memorandum to H. L, Pope, U.S. Department of Energy, Savannah River Operations Office, Alken,
South Carol ina, “WSRC Data Transmittal - Responses to BRE Questions on Vaults and CIF Fuel Oil
Utilization,” ESH-NEP-95-0076, May 4,
2-230
DOE/EIS-0217July 1995
Hess, M. L., 1995c, Westinghouse Savannah River Company, Aiken, South Carolina, Interoffice.
Memorandum to H. L, Pope, U.S. Department of Energy, Savannah R]ver Operations Office, Aiken,
South Carolina, “WSRC Data Transmittal - Spreadsheets for Final ElS,” ESH-NEP-95-O090,
May 17.
Hess, M, L., 1995d, Westinghouse Savannah River Company, Aiken, South Carolina, Interoffice
Memorandum to H. L. Pope, U.S. Department of Energy, Savannah River Operations Office, Aiken,
South Carolina, “WSRC Data Transmittal - Table 2,3-6 WMEIS Ranking of Various
Facilities/Technologies,” ESH-NEP-95-O079, May 5,
Hess, M. L,, 1995e, Westinghouse Savannah R]ver Company, Aiken, South Carolina, Interoffice
Memorandum to H, L. Pope, U.S. Department of Energy, Savannah River Operations Office, Aiken,
South Carolina, “WSRC Data Transmittal - Revised Facility Costs for the No-Action Alternative and
Revised Employees for Alternative A, Minimum Forecast (U),” ESH-NEP-95-O085, May 16.
Hess, M. L,, 1995f, Westinghouse Savannah River Company, Aiken, South Carolina, Interoffice
Memorandum to H, L. Pope, U.S. Department of Energy, Savannah River Operations Office, Aiken,
South Carolina, “WSRC Data Transmittal - Complete Copy of Cost Model for WMEIS,”
ESH-NEP-95-O078, May 5.
Larkin, G. F., 1994, Westinghouse Savannah River Company, Aike]l, South Carolina, Interoffice
Memorandum to M. N. Hoganson, Halliburton NUS Corporation, Aiken, South Carolina, “1994
WSRC (Westinghouse Savannah River Company), 1994g, DOE Directive Compliance Assessment and
Implementation Report, WSRC-RP-93-668-044, Revision 1, Aiken, South Carolina, September 20,
2-233
DoE/Els-021 7July 1995
WSRC(Westinghouse Savannah River Company), 1994tr, RCRAParl AApplicationfor a Hazardous
waste Permit, Tab AF, Mixed Waste Storage Building 3 16-M, Aiken, South Carolina.
WSRC(Westinghouse Savannah River Company), 1994i, Solvent Storage Tanh(S23-S30) Interim
Closure Plan, SWE-SWE-94-0279, Aiken, South Carolina.
WSRC (Westinghouse Savannah R\ver Company), 1994j, Strate~ Proposal for Interim Storage of
Hazardous, Mixed, and Non-Mixed TRU and Low-Level Mixed Wastes (U), WSRC-RP-94-767,
Revision O, Aiken, South Carolina, August.
WSRC(Westinghouse Savannah River Company), 1994k, Technology Selection MethodologYforthe
Waste Management EZS (U),WSRC-RP-94-1215, Revision O, Aiken, South Carolina, December.
WSRC(Westinghouse Savannah River Company), 1995, SRSProposed Site Treatment Plan,
WSRC-TR-94-0608, Aiken, South Carolina.
2-234
DoE/E1s-0217July 1995
CHAPTER 3. AFFECTED ENVIRONMENT
This chapter describes the existing environtnental and socioeconomic characteristics of the Savannah
River Site (SRS) and nearby region that could be affected by tbe proposed action or its alternatives, The
data presented in this chapter are required to assess the consequences of the proposed action and its
alternatives.
3.1 Introduction
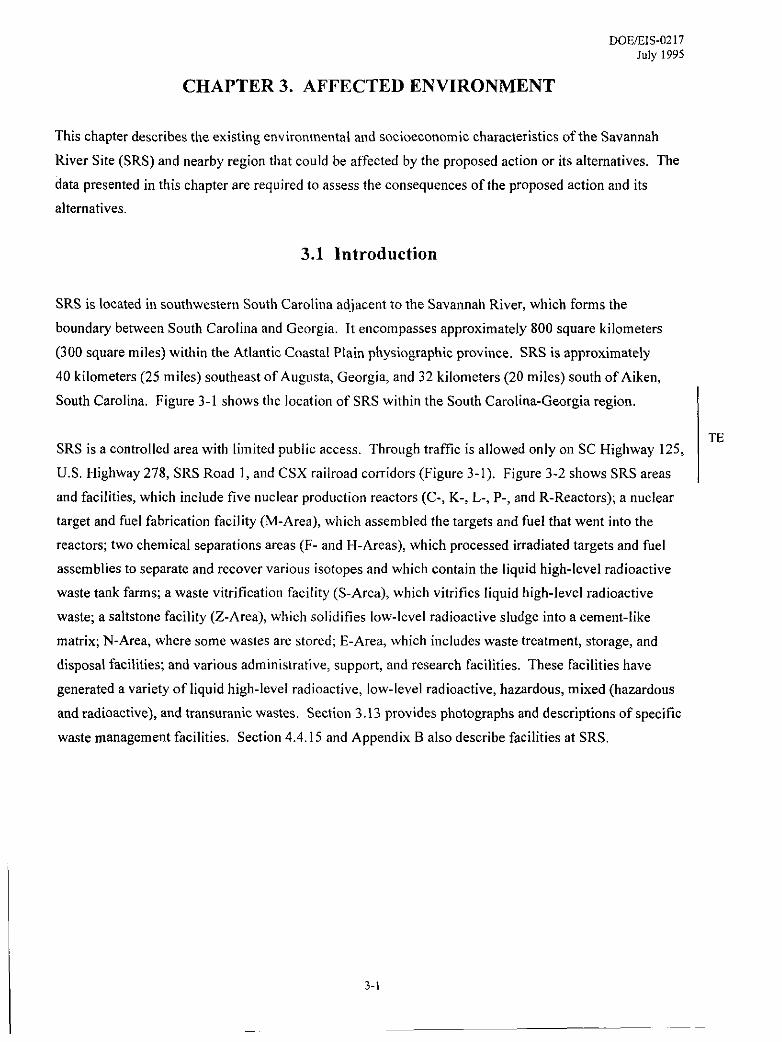
SRS is located in southwestern South Carolina adjacent to the Savannah River, which forms the
bomrdary between South Carolina and Georgia, Itencompasses approximately 800 square kilometers
(3 OOsquare miles) witI~in the Atlantic Coastal Plain physiographic province. SRSis approximately
40 kilometers (25 miles) southeast of Augllsta, Georgia, and 32 kilometers (20 miles) south of Aiken,
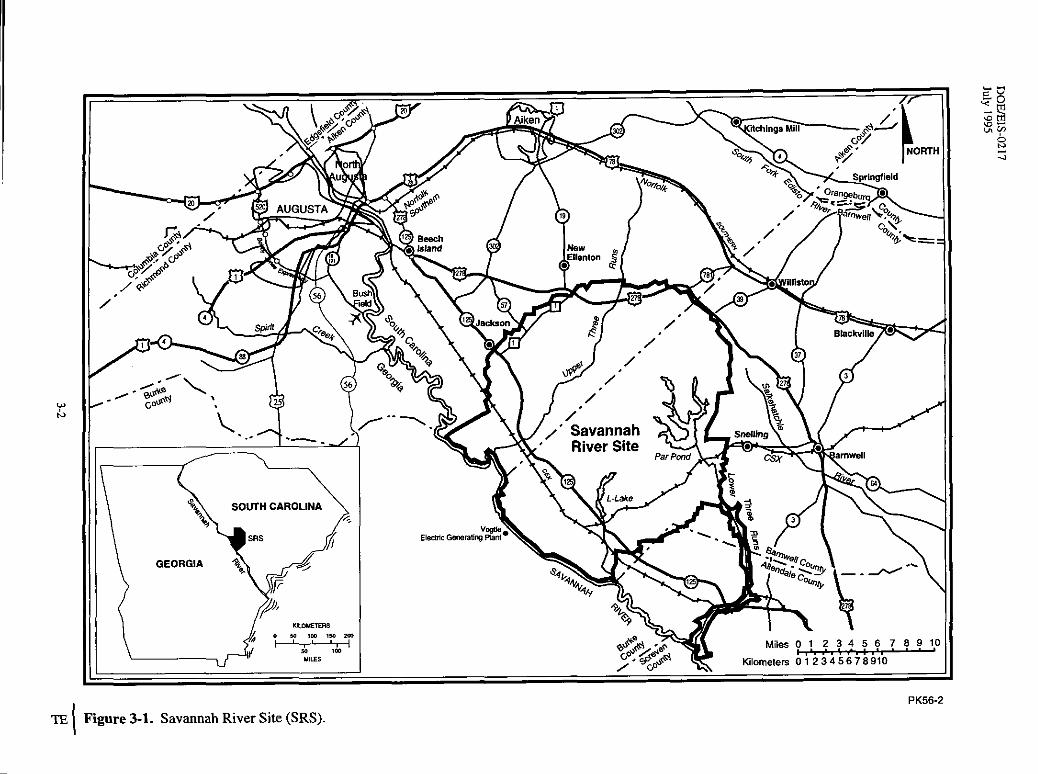
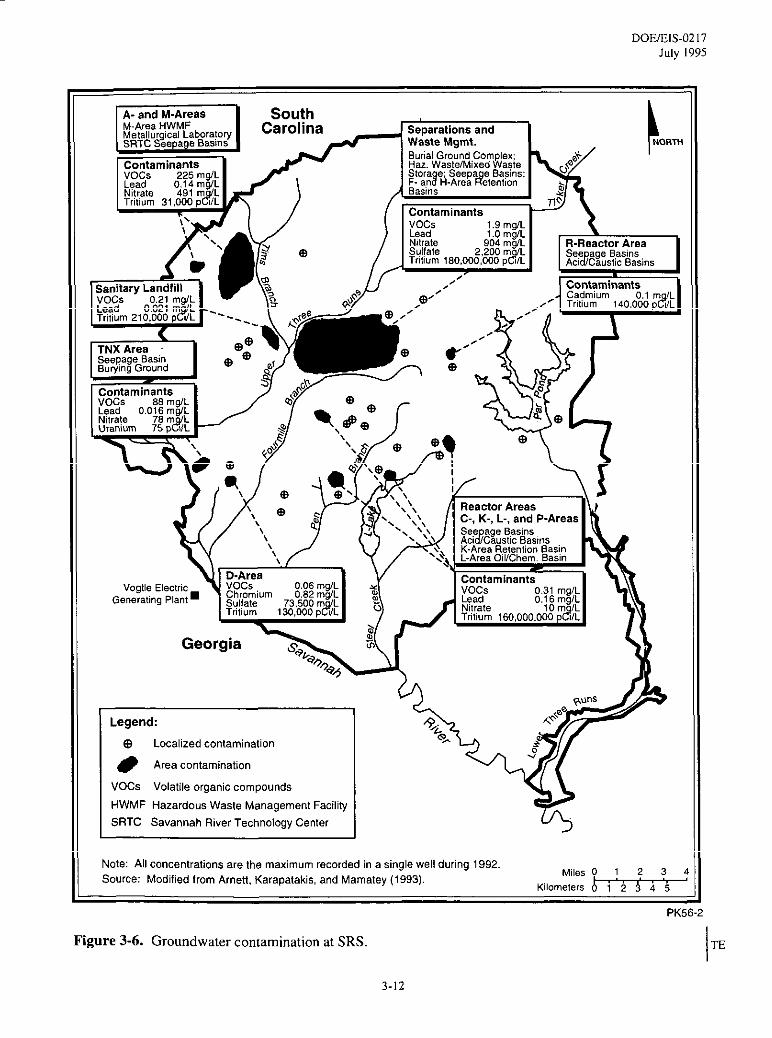
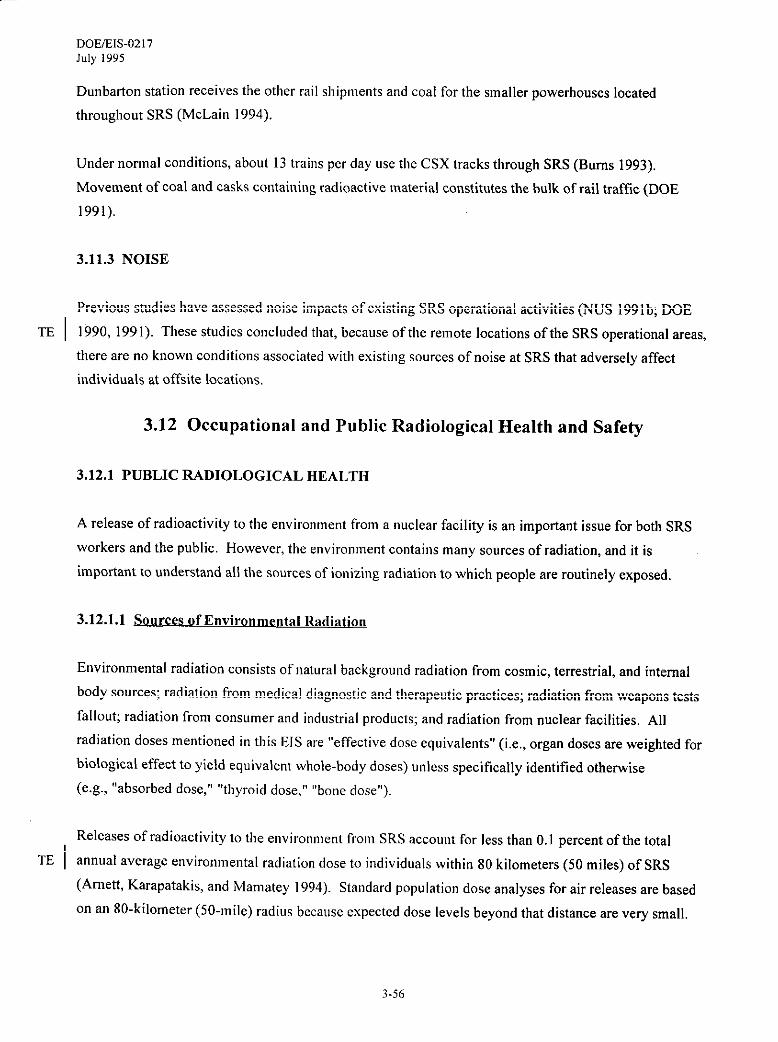
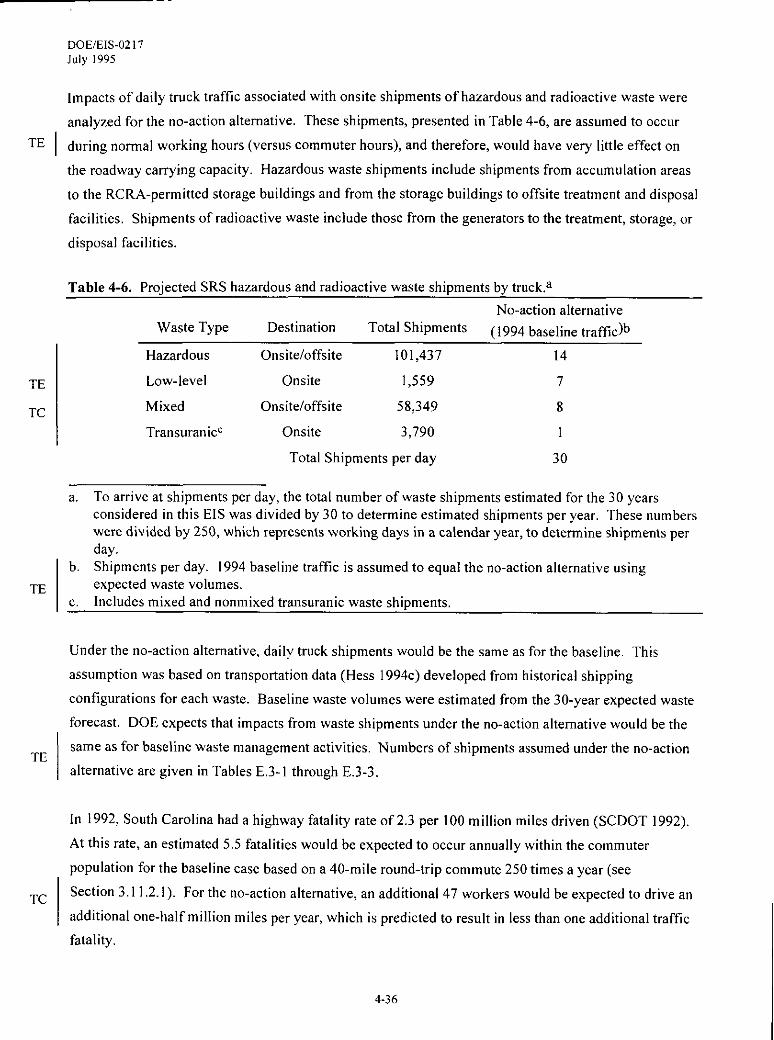
South Carolina, Figure 3-1 shows tllelocatioll of SRSwitl]in the South Carolina-Georgia region, ISRSisacontrolled areawith limited public access. Through traffic isallowed onlyon SC Higbway 125,
TE
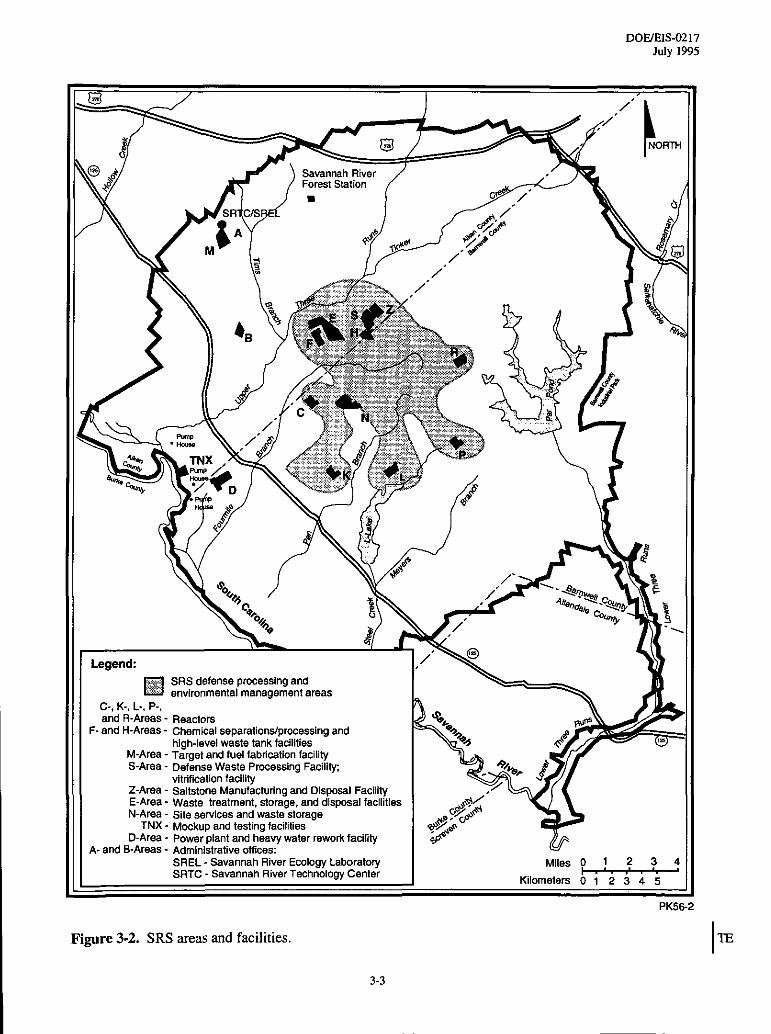
U. S, Highway 278, SRSRoad l,alld CSXrailroad corridors (Figure 3-l). Figure 3-2shows SRS areas
and facilities, which inchrde five nuclear production reactors (C-, K-, L-, P-, and R-Reactors); a nuclear
target and fuel fabrication facility (M-Area), which asselnbled the targets and fuel that went into the
reactors; two chemical separations areas (F- and H-Areas), which processed irradiated targets and fuel
assemblies toseparate and recover various isotopes and whicb contain the Iiquidhigh-level radioactive
waste tank farms; a waste vitrification facility (S-Area), whicbvitrifies liquid high-level radioactive
waste; a saltstone facility (Z-Area), which sol idities low-level radioactive sludge into a cement-like
matrix; N-Area, where some wastes are stored; E-Area, ~vhich includes waste treatment, storage, and
disposal facilities andvarious adlninistrative, suppofl, and research facilities. These facilities have
generated a variety of liquid high-level radioactive, low-level radioactive, hazardous, mixed (hazardous
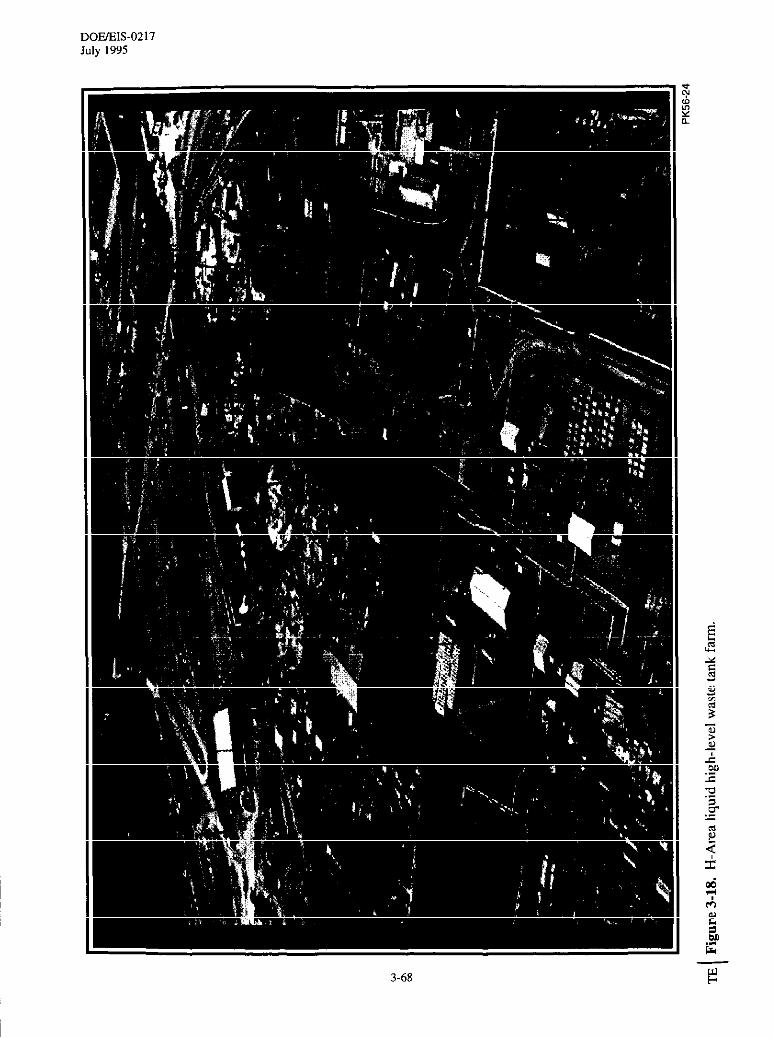
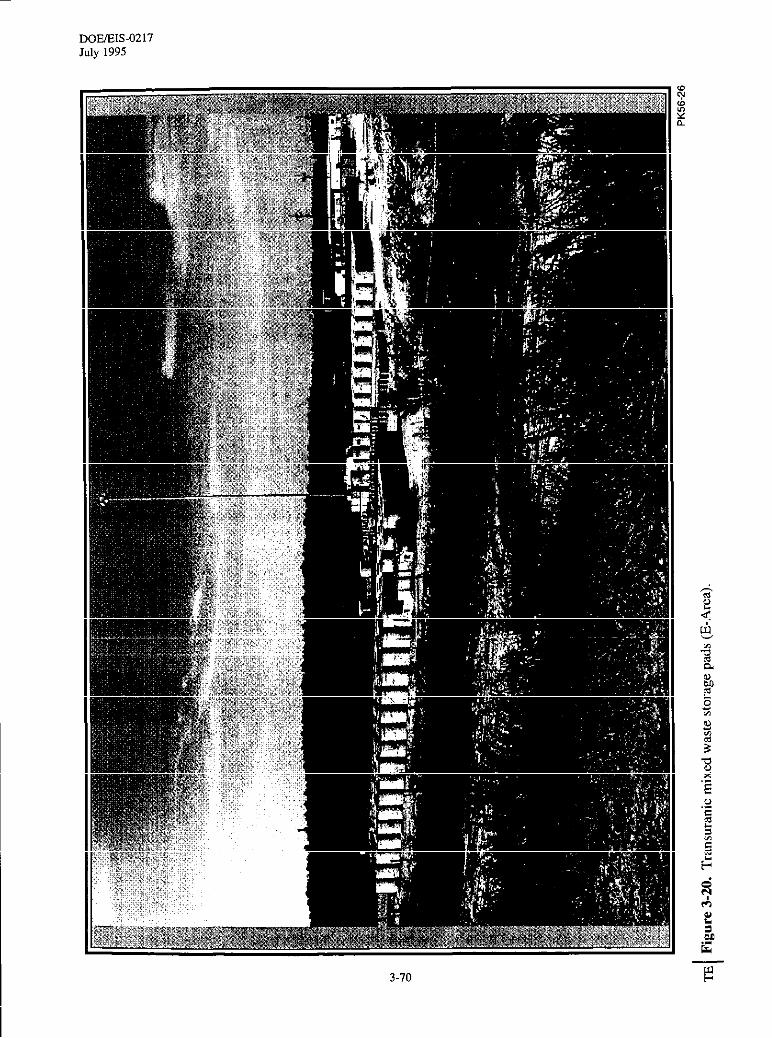
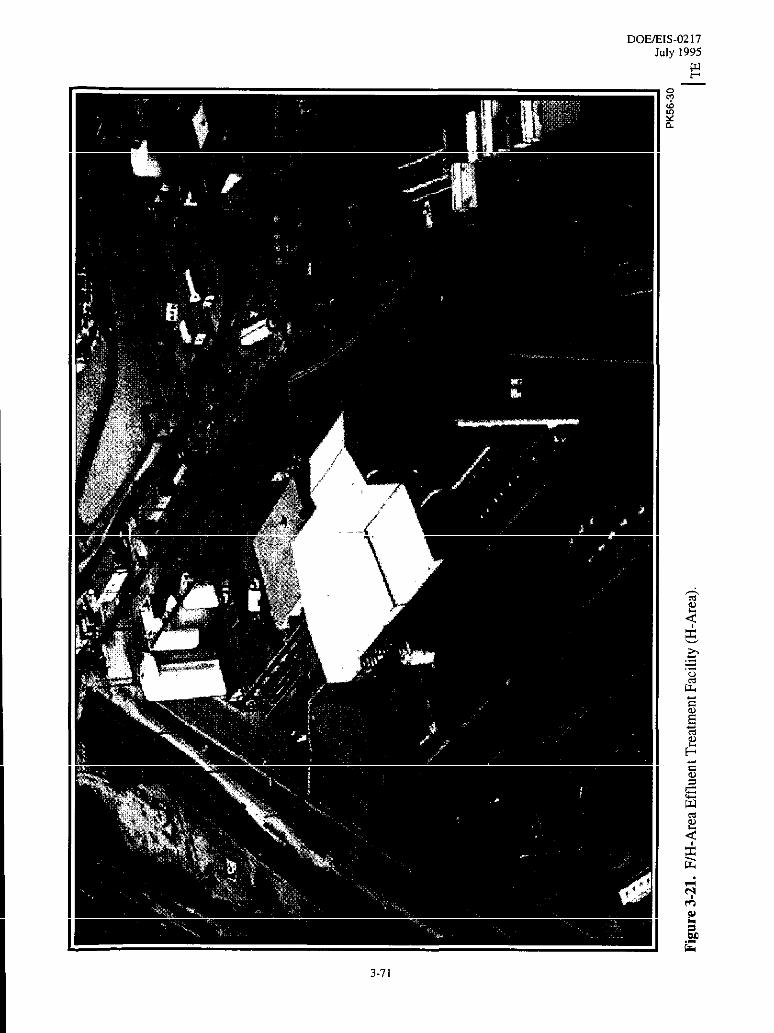
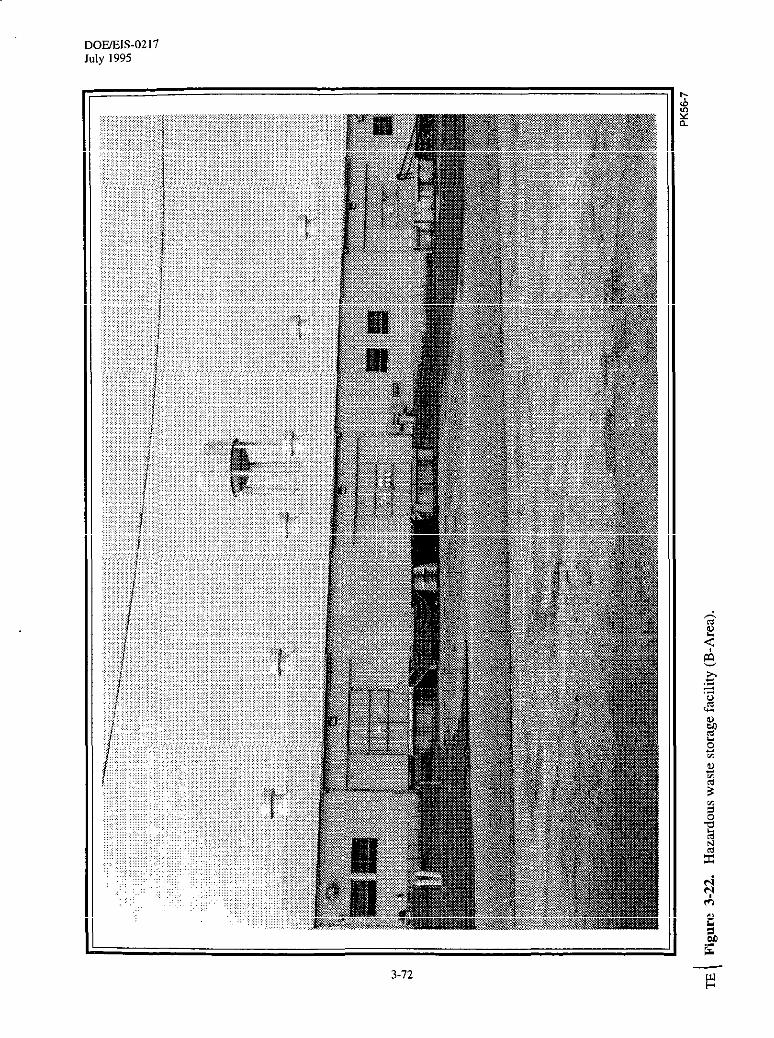
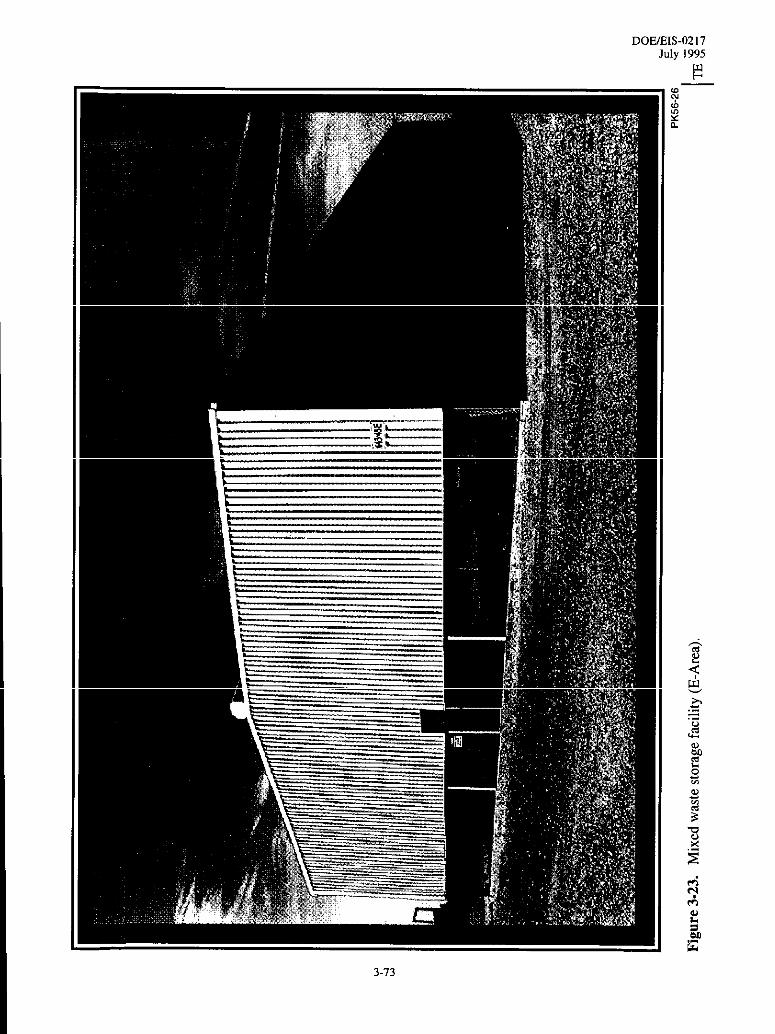
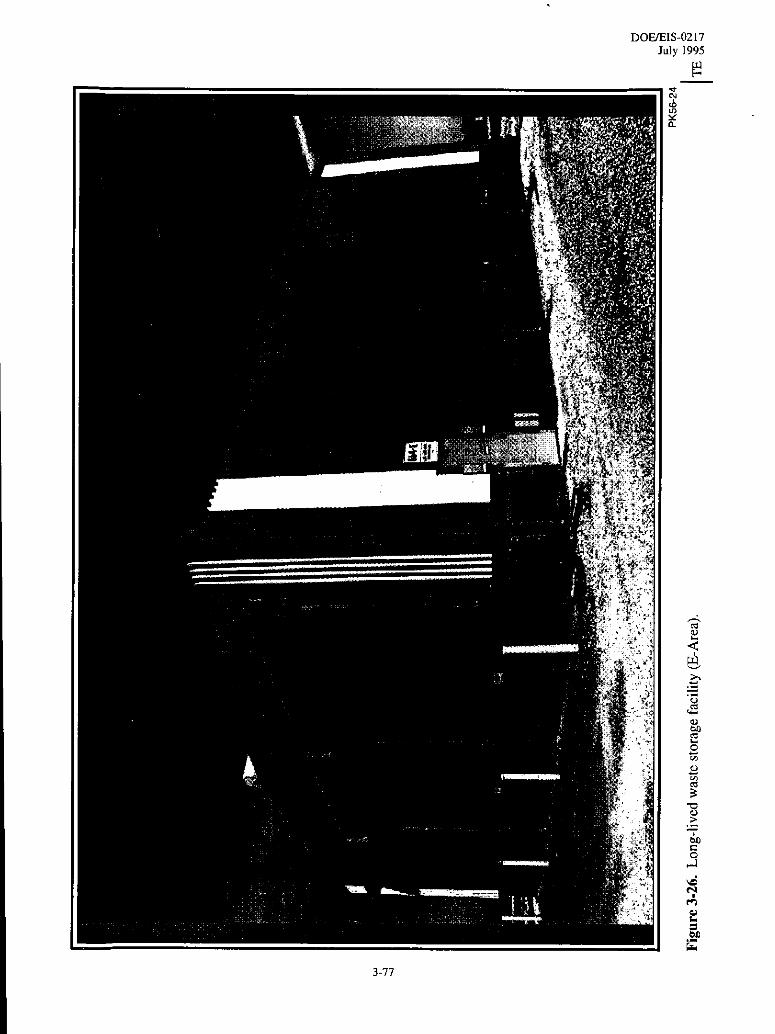
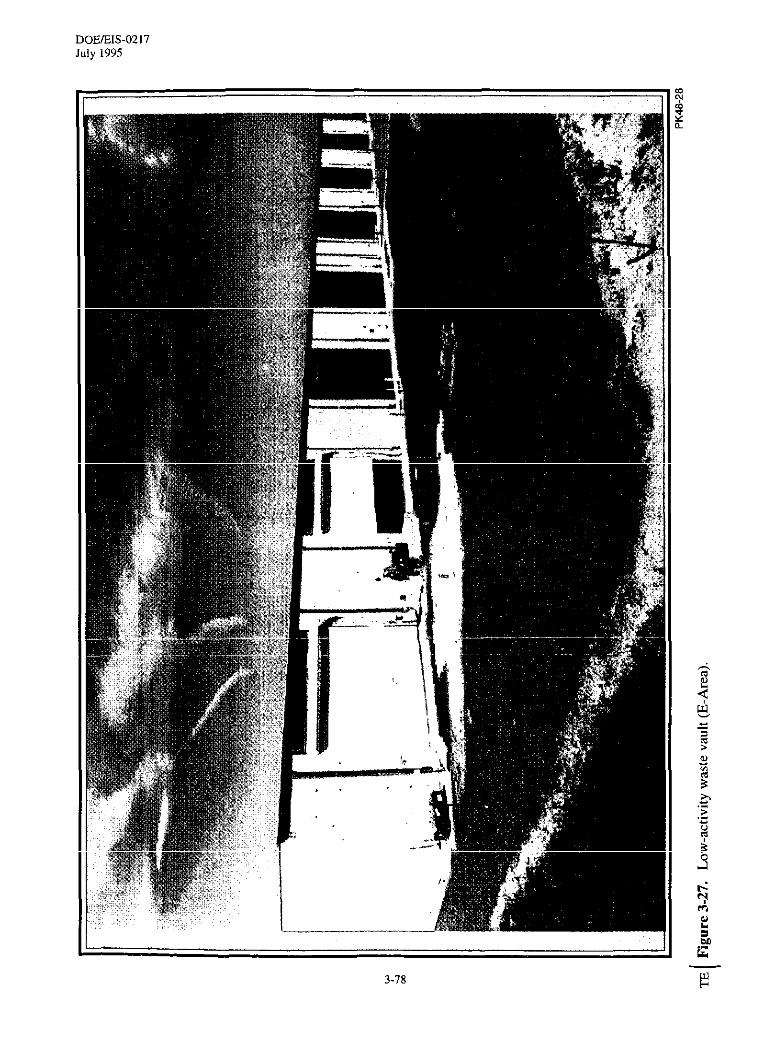
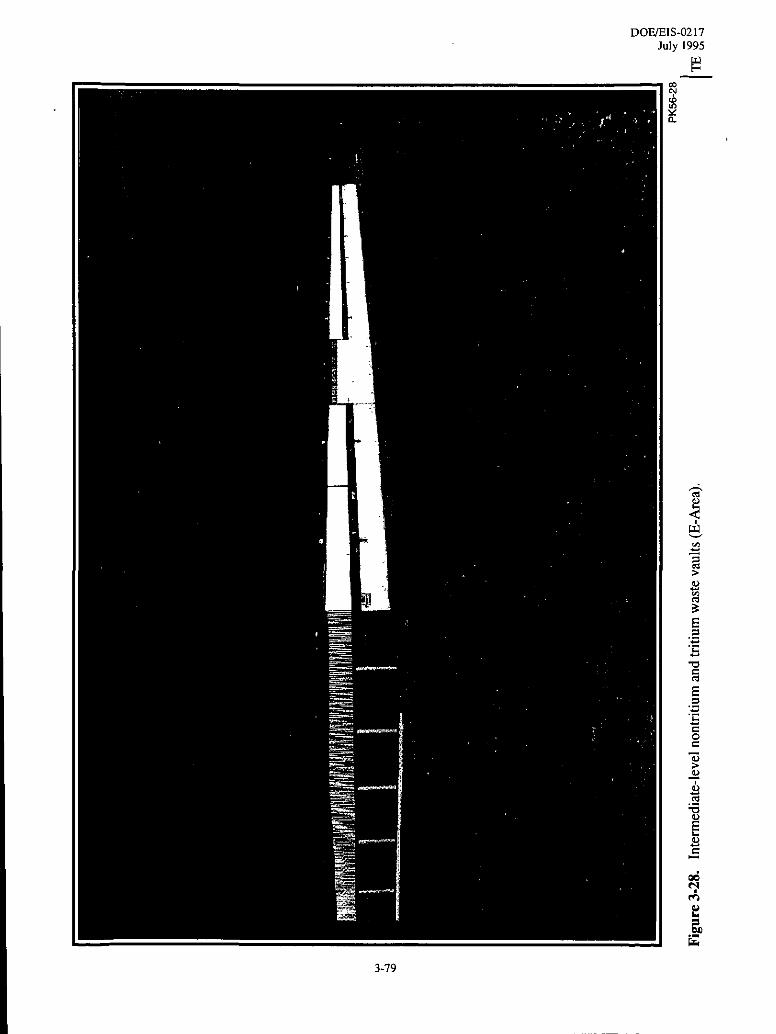
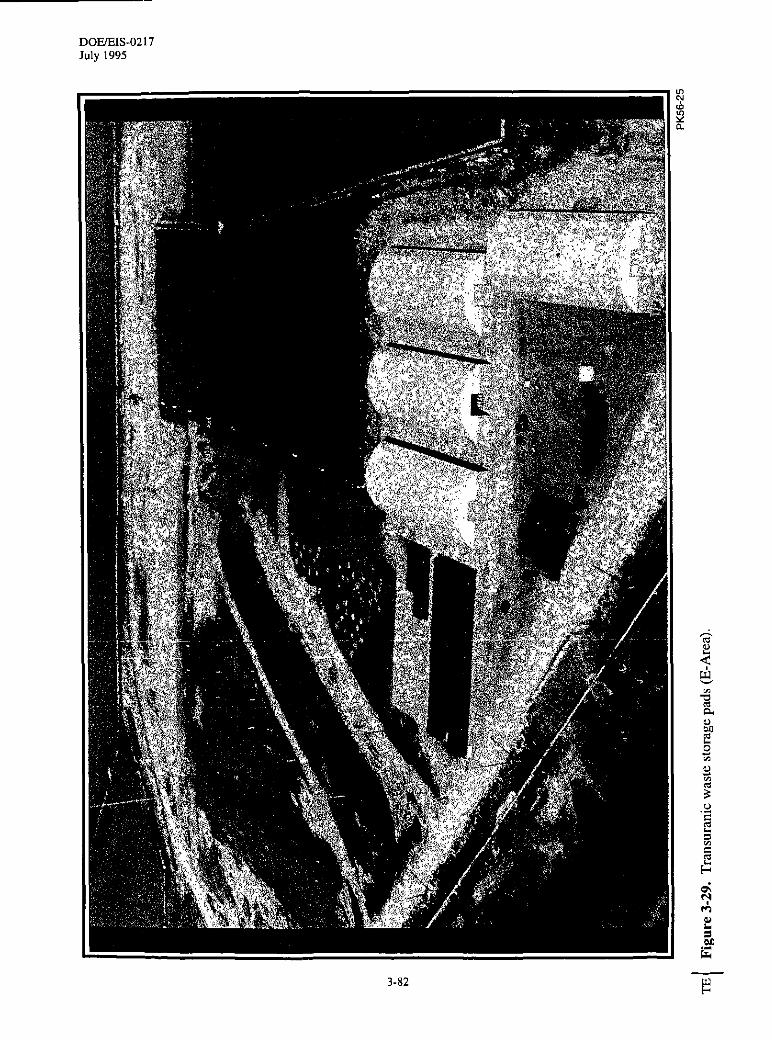
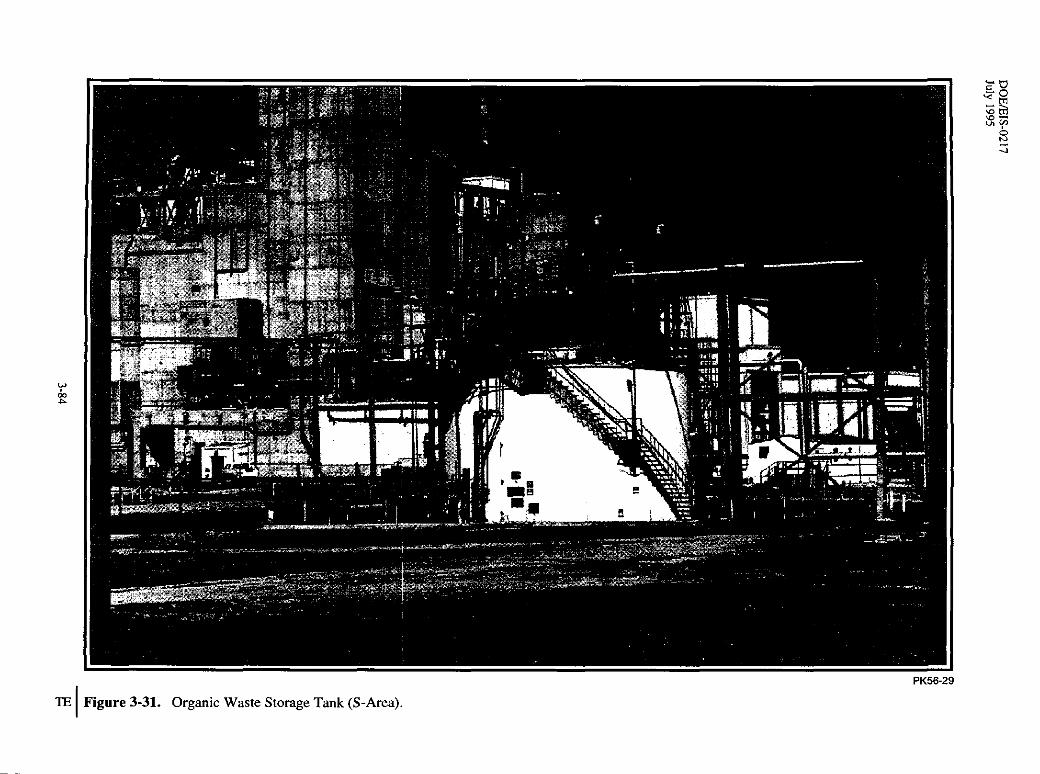
andradioactive), andtransuranic wastes. Section 3.13provides photographs anddescriptions of specific
waste management facilities. Sectio]l 4.4.15and Appendix Balsodescribe facilities at SRS,
3-1
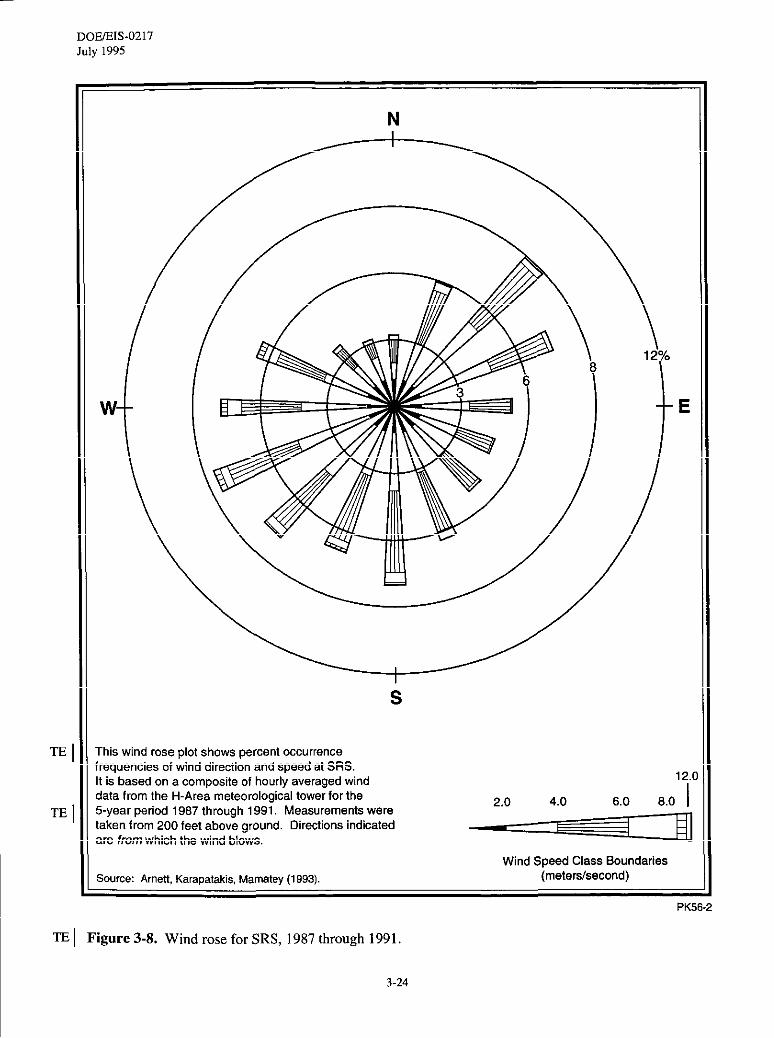
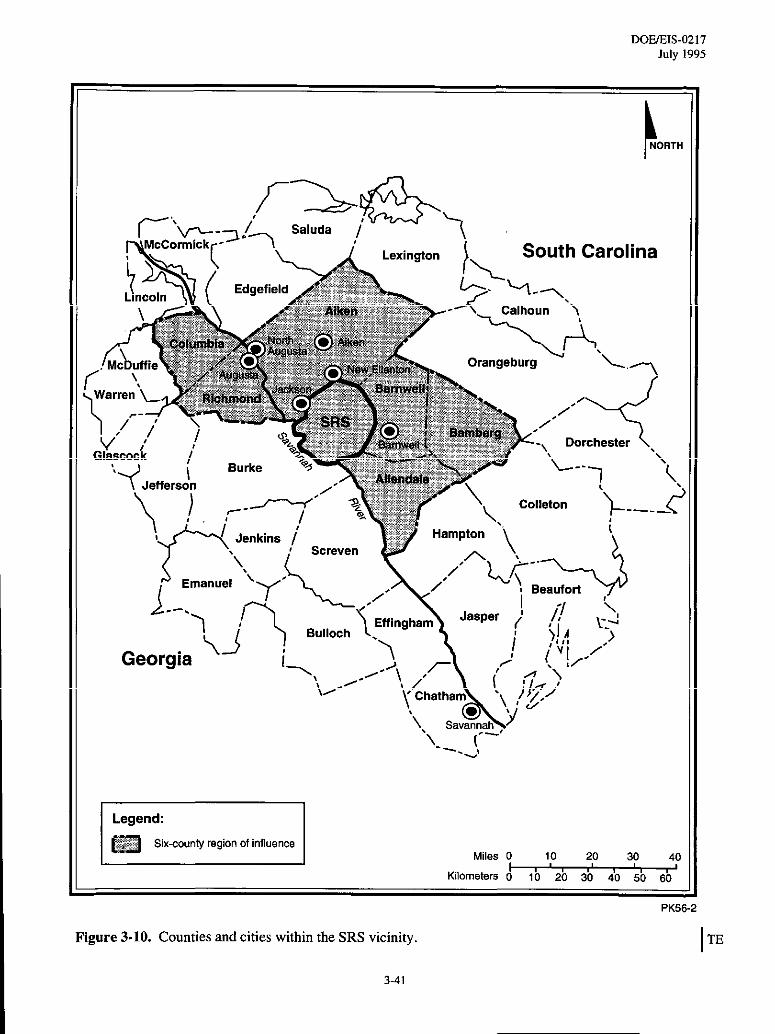
IPK56-2
TE Figure 3-1. Savannah River Site (SRS).
DO~IS-0217July 1995
II SREL- SavannahRiverEcologyLaboratov Miles O 1SRTC- Ssvannah RiverTechnologyC0nb3r -4
Wlometers 0 1 2 3 4 ~
PK51
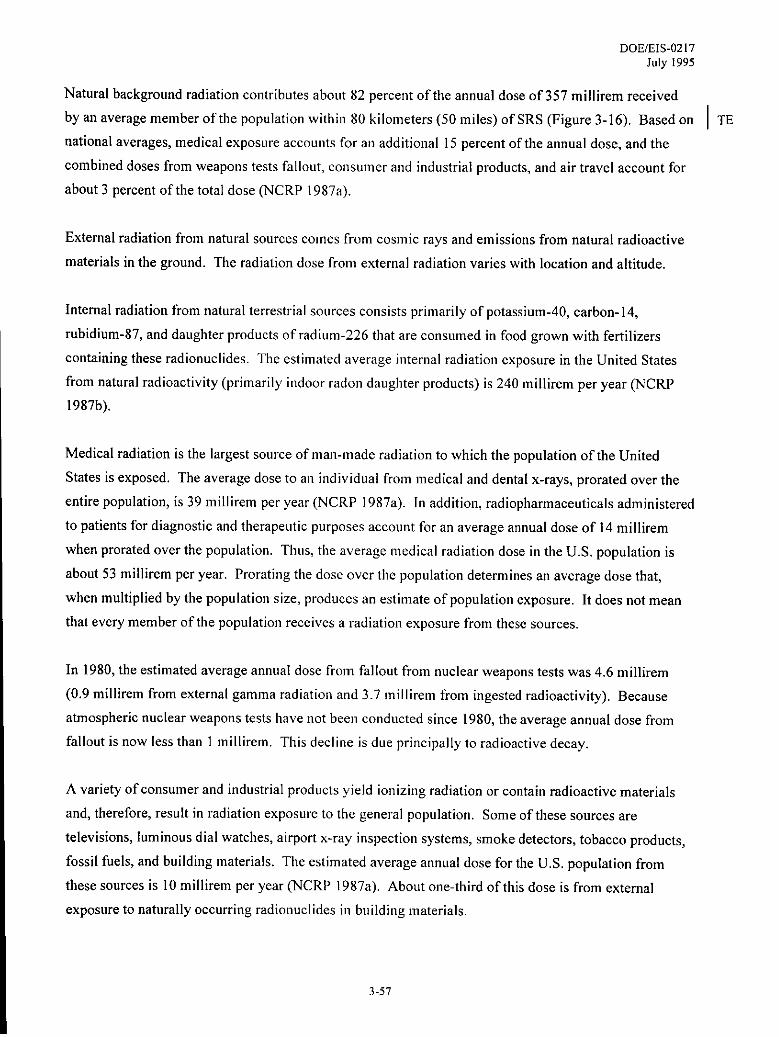
Figure 3-2. SRS areas and facilities.
3-3
m
DOE/’EIS-O2l7July 1995
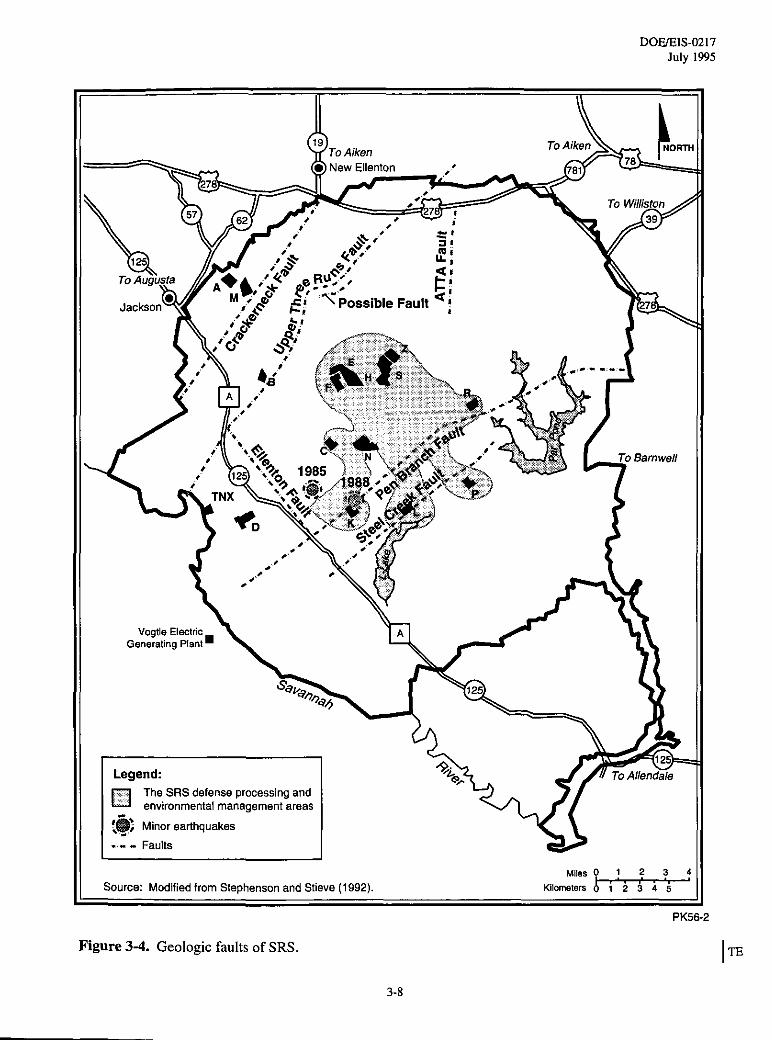
3.2 Geologic Resources
3,2.1 SOILS AND TOPOGRAPHY
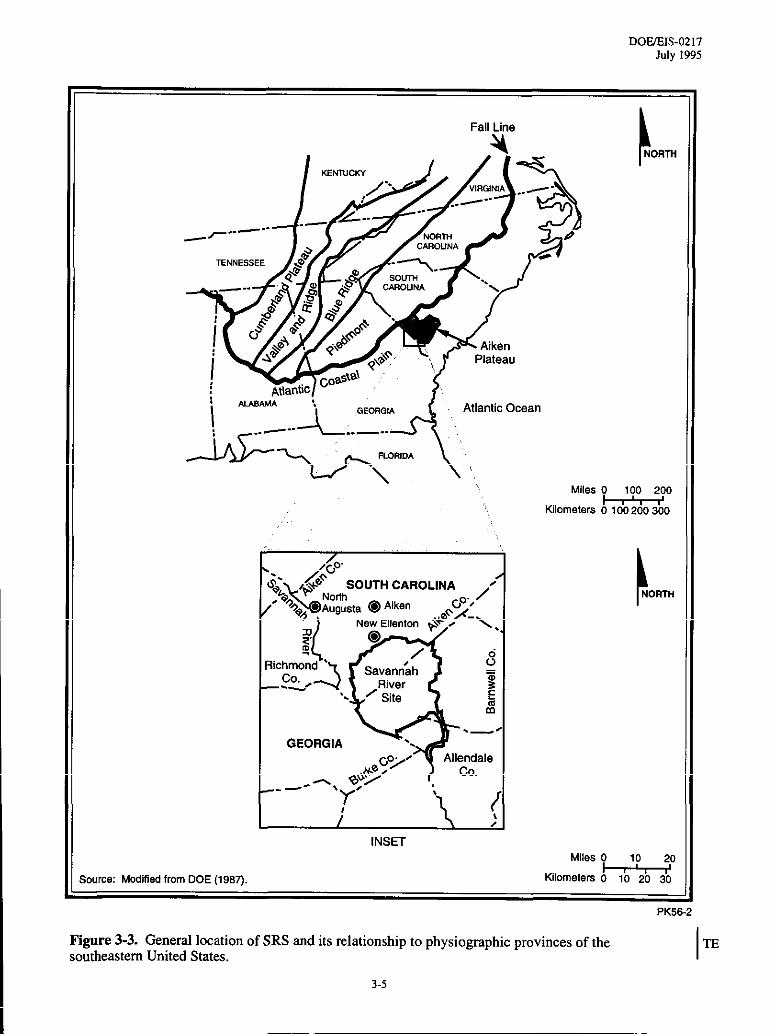
SRS is located on the Aiken Plateau of the Upper Atlantic Coastal Plain physiographic province about
40 kilometers (25 miles) southeast of the Fall Line that separates the Atlantic Coastal Plain from the
TE \ piedmontphysi0graphicprovilce(Figure3-3). The AikenPlatea”ishighly dissectedrmdcmr~istsof
broad, flat areas betieen streams and narrow, steep-sided valleys, It slopes from an elevation of
approximately 200 meters (650 feet) at the Fall Line to an elevation of about 75 meters (250 feet) on the
southeast edge of the plateau. Because of SRS’S proximity to the Piedmont province, it is somewhat
more hilly than the near-coastal areas, with on site elevations ranging from 27 to 128 meters (90 to 420
feet) above sea level, Relief on the Aiken Plateau is as much as 90 meters (300 feet) locally. The
TB I Plateau isgenerailYwe!l drained, altlougls]nallpo orlydraineddepressionsdooccur, The~;nal
Environmental Impact Statement, Continued Operation of K-j L-, and P-Reactors, Savannah River Site,
Aiken, Soutk Carolina (DOE 1990) contains a complete description of the geologic setting and the
stratigraphic sequences at SRS.
Previously disturbed soils are mostly well drained and were taken from excavated areas, borrow pits, and
other areas where major land-shaping or grading activities have occurred, These soils are found beside
and under streets, sidewalks, build ings, parking lots, and other structures. Much of the soil in the
existing waste management areas has been moved, so soil properties can vary within a few meters,
Slopes of soils generally range from Oto 10 percent and have a moderate erosion hazard. These
disturbed soils range from a consistency of sand to clay, depending on the source of the soil material
(USDA 1990).
Undisturbed soils at SRS generally consist of sandy surface layers above a subsoil containing a mixture
of sand, silt, and clay, These soils are gently sloping to moderatel y steep (O to 10 percent grade) and
have a slight erosion hazard (USDA 1990). Some soils on uplands are nearly level, and those on
bottomlands along the major streams are level. Soils in small, narrow drainage valleys are steep. Most
of the upland soils are well drained to excessively drained. The well-drained soils have a thick, sandy
surface layer that extends to a depth of 2 meters (7 feet) or more in some areas, The soils on bottomlands
range from well drained to very poorly drained, Some soils on the abrupt slope breaks have a dense,
brittle subsoil,
3-4
DO~IS-0217July 1995
Fall Line
4
Miles
,,,
Figure 3-3. General location of SRS and its relationship to physiographic provinces of the TEsoutheastern United States.
h.i.J.k.1.mn.o. Shall not exceed weekly average of 32,2°C (90°F) after mixing nor rise“morethan 2.g”C (5”F) in 1 week unlessappropriate
temperaturecriterion mixing zone hasbeen established.
Parametersare those DOE routi”cly measuresas a regulatory req”ircmcnt or as partof o“goi”g monitoring programs.
mti = milligr~s Per lite~ a measureof concentrationequivalent to the weightivolume ratio.pCi/L = picocuriesper !iteq a picoc”rie is a unit of radioactivity; one trillionth of a curie.Maximum Contaminant Level (MCL), EPA National Primary Drinking Water Standards(40 CFR Pm 141). See glossq.Maximum Contaminant Level (MCL): SCDHEC ( 1976a). See glossary,DOE Derived Concentration Guides (DCGS) for water (DOE Order 5400.5, ‘“RadiationProtectionfor the Public and theEnvironment”). DCG values are basedo“ committed effective doseof 100 millirem per yem for consistencywith drinking waterMCL of 4 millirem per year, See glossary.Minimumconce”tratiom of samples, The maximum listed concentrationis the highestsingle result found during one samplingevent.SecondaryMaimum Contami,,antLevel (SMCL). EPA Nfitional SecondaryDrinking Water Regulations(40 CFR Pafi 143),NA = none applicable.Dependent upon pH and temperature,ND= none detected.Action level for lead a“d copper.WQS = water quality standard. See glossary.Lessthan (<) indicatesconcentrationbelow analysesdetection timit (DL).
3-16
DO~IS-0217July 1995
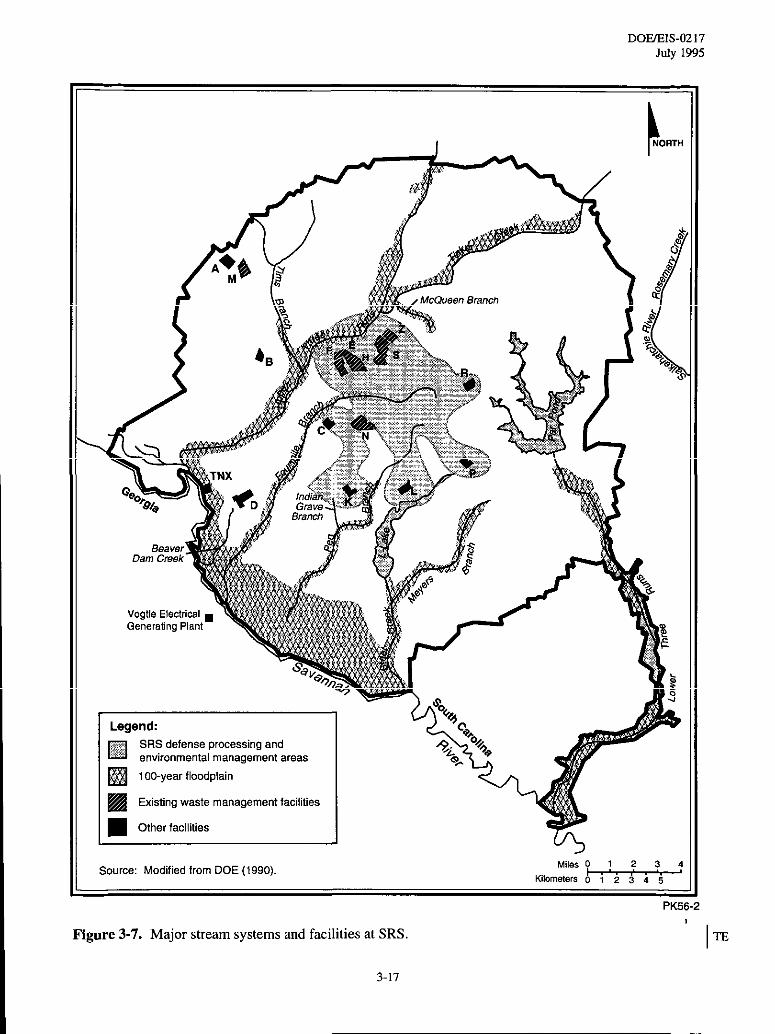
Legend:
H SRSdefenseprocessing andenvironmental management areas
❑ lf10-yearfloodplain
& Existingwaste managementfacilities
■ Crtherfacilities
Source: Modified from DOE (1990).
PK56
Figure 3-7. Major stream systems and facilities at SRS. Im
3-17
DOE/’E1S-O2l7July 1995
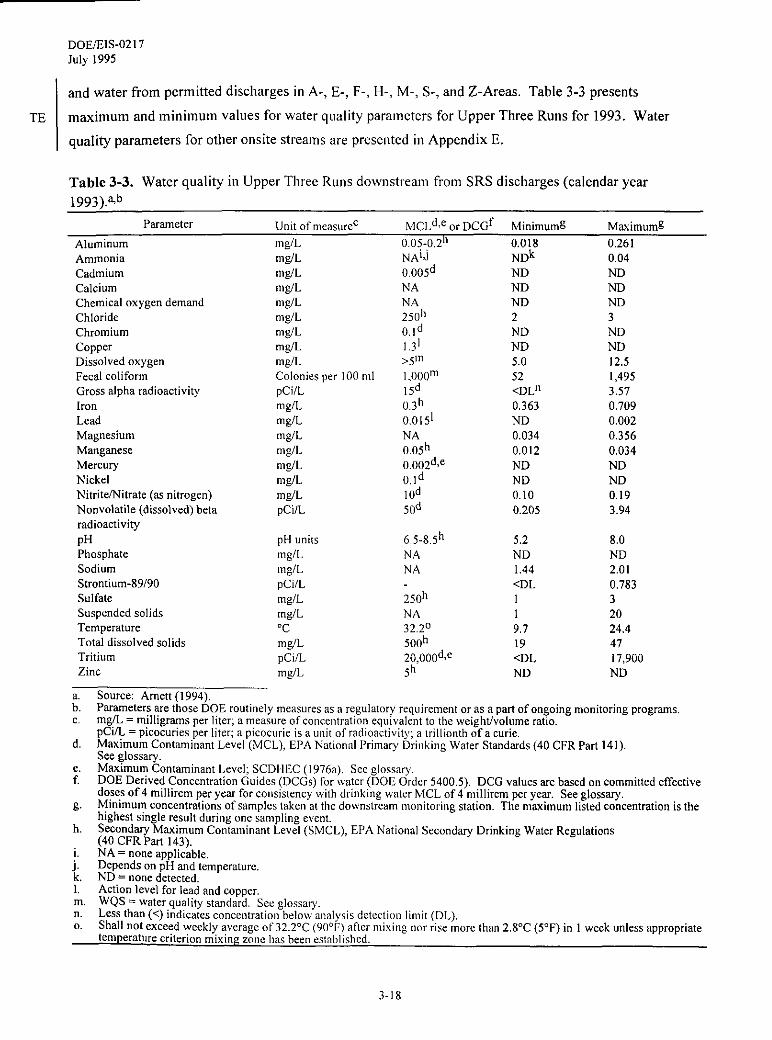
andwater from perrnhtedd ischargesi nA-,E-,F-, H-, M-, S-, and Z-Areas. Table 3-3 presents
TE maximum andminilnum values fOrwater qllality para]neters for Upper Three Runs for 1993. Water
quality parameters for other onsite streams are presented in Appendix E.
Table 3-3. Water quality ill Upper Three R~l!lsdowllstreatll froln SRSdischarges (calendar year
1993).~b
Parameter Unit of measurec MCLd,e or DCGf Minimumg Maximumg
a. Source: Amett (1994).b. PUmeters Uethose DOEroutinely measuresasarcgulatory reqllircment orasapti ofongoing monit0ringprogrms.c. mglL = milligrams per Ii<e< a measureof co[lccntration equivalent to the weightivolume ratio.
pCi~ = picocuries per Iiteh a picoc”ric is a unit of radioactivity; a trillionth of a curie.d. Maximum Contaminant Level (MCL), EPA Natio"al Primary l>ri,,king Water Sta"dards(40 CFRP@l4l).
See glossary.e, Maximum Contaminant Level; SCDHEC(1976a), See glossary,f. DOE Derived Co"ce"tration G"ides(DCGs) for\vatcr (DOE Ocdcr54OO,5). DCGvalues me baseduncommitted effective
j.k,1, Action level for lead &ndcopper,m. WQS = water quality standard. See glossary.n. Lessthan (<) indicatesconcentration,belo\\ analysisdetectio,, Iinlit (DL).o. Shall not exceed weekly average of 32.2°C (900F) after lmixingr,c>rrise more than 2,8°C (5°F) i“ I week unlessappropriate
a. Source: Arnett, Karapatakis, and Mamatey (1994),b. Kilometer toconvert tomiles, multip[yby O.621.
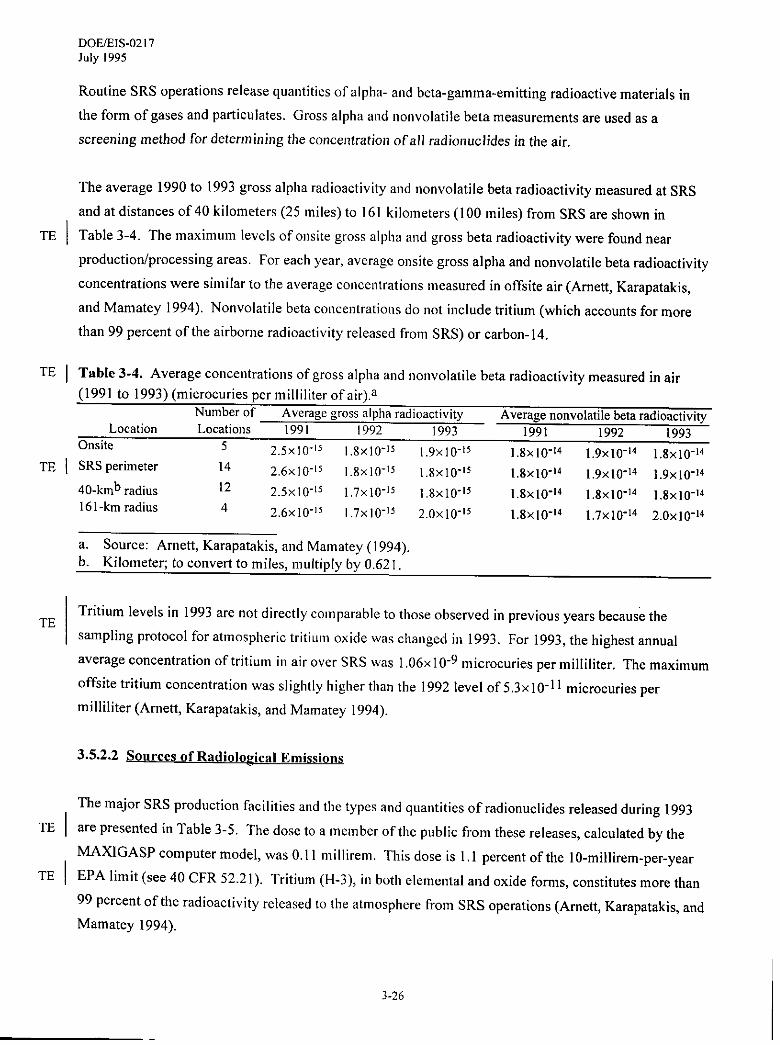
Tritium levelsin 1993are notdirectly colnparable totllose obsewed inprevious years because the
sampling protocol foratmospl]erict ritiLm) oxide wascbanged in 1993. For 1993, tbe highest annual
average concentration oftritiuln inairover SRS\vas l,06x10-9microcuries per milliliter. The maximum
offsitetritium concentration was slightly higher than tile 1992 level of5,3 x10-11 microcuries per
milliliter (Arnett, Karapatakis, and Ma!natey 1994).
3.5.2.2 Sources of Radiological Emissions
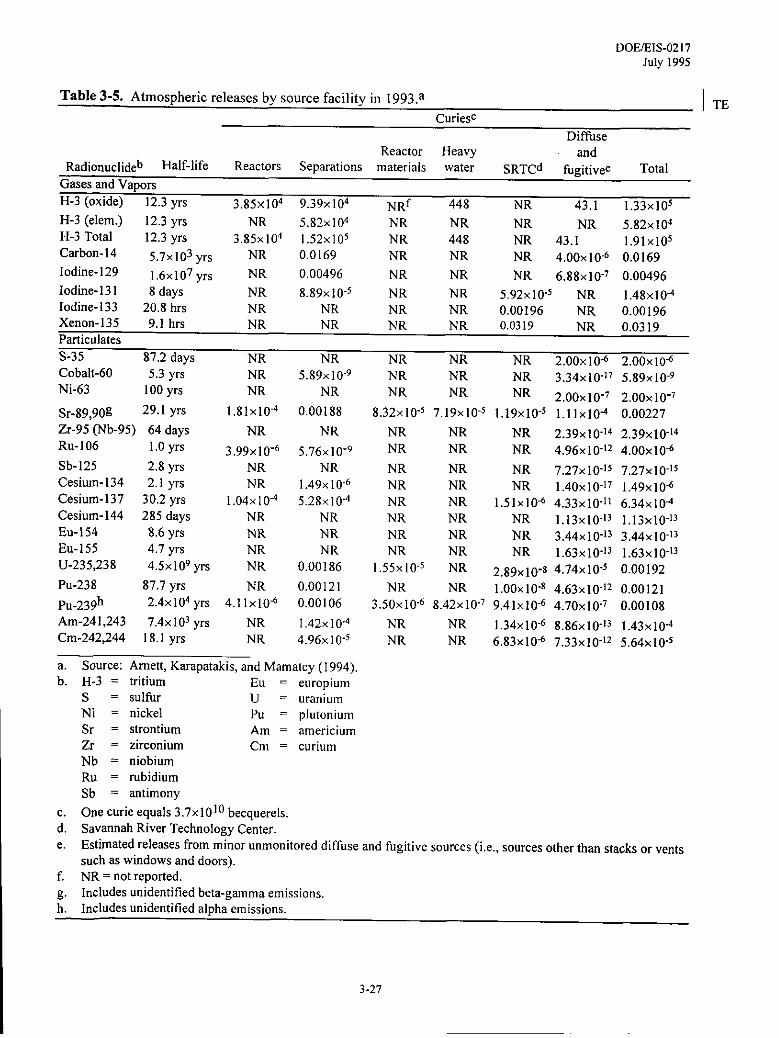
The major SRS production facilities and the types and quantities of radionuclides released during 1993
arepresented in Table 3-5, Thedose toatne(nber oftllepublic from tllesereleases, calculated by the
MAXIGASP computer model, was O,ll millirem, Tbisdoseisl,l percent of the 10-millirem-per-year
EPAlimit (see 40 CFR 52.21), TritiLlm (H-3), ill botllelemetltal andoxide fores, constitutes more than
99 percent of the radioactivity released to the atmosphere from SRS operations (Arnett, Karapatakis, and
Mamatey 1994).
3-26
DOE~IS-0217July 1995
Table 3-5. Atmospheric releases by source facil ity ill 1993a I ‘l-ECuriesc
DiffuseReactor Heavy md
Radionuclideb Half-life Reactors Separations materials water SRTCd fugitivee Total
Gases and VaporsH-3 (oxide) 12,3 yrs 3.85x10⁴ 9.39x 10⁴ ~~f 448 NR 43,1 1.33X10⁵
H-3 (elem,) 12.3 yrs NR 5.82x10⁴ “N-i NR NR NR 5.82x10⁴H-3 Total 12,3 ylS 3.85x 10⁴ 1.52x IOS NR 448 NR 43.1 1,91X10⁵Carbon-14 s.7x103 yrs NR 0.0169 NR NR NR 4.OOX1O-G0,0169Iodine- 129 l,6x107 yrs NR 0.00496 NR NR NR 6.88x10⁻⁷ 0.00496Iodine-13 I 8 days NR 8.89x I0-5 NR NR 5.92x10⁵ NR 1.48x 10⁴Iodine-133 20.8 hrs NR NR NR NR 0.00196 NR 0.00196Xenon- 135 9.1 hrs NR NR NR NR 0.0319 NRPtiiculates
0.0319
s-35 87.2 days NRCobalt-60 5.3 yrs NRNi-63 100 yrs NR
NR NR NR 2,00x10⁻⁶ 2.00X10⁴NR NR NR 3.34x10¹⁷ 5,89x1 O-9NR NR NR 2,00 X10⁻⁷ 2.00 X10⁻⁷
8.32x 10⁵ 7.19x10⁵ 1.19x10-S 1.11x10⁴ 0.00227
NR NR NR 2.39x10¹⁴ 2,39x 10⁻¹⁴NR NR NR 4.96x1oI2 4.00x 10<
NR NR NR 7.27x 10⁻¹⁵ 7.27x 1o-1$NR NR NR 1,4OX1O-171.49x10⁶NR NR 1.51x 10< 4.33x 1OII 6,34x10~NR NR NR 1.13XI0-13 1.13X1O-I3NR NR NR 3.44X10¹³ 3.44 X1O-I3NR NR NR 1.63x 10-]3 I.63x1013
1.55x I0-5 NR 2,89x1wS 4.74x10-S 0.00192NR NR 1.oox1o-8 4.63x10⁻¹² 0.00121
3.50x 10⁶ 8.42x l&7 9,41x10⁻⁶ 4.7ox1O7 0,00108
NR NR 1.34x10⁻⁶ 8,86x10⁻¹³ 1.43x10⁴NR NR 6,83x 10< 7.33x 10⁻¹² 5.64x10-$
a. Source: Amett, Ka.rapatakis, and Mamatey (1994),b. H-3 = tritium Eu = europium
s = sulfur u = uraniumNi = nickel Pu = plutoniumSr = strontium Am = americiumZr = zirconium Cm = curiumNb = niobiumRu = rubidiumSb = antimony
c. Onecurie equals 3.7x10¹⁰ becquerels,d. Savannah River Technology Center.e. Estimated releases from minor unmonitored diffuse and fugitive sources (i.e., sources other tiastacks orvents
such as windows and doors).f. NR=notreported.g. Inchrdes mridentified beta-gamma emissions.h. Includes unidentified alpha emissions.
3-27
DoE/EIs-02 17July I995
3.5.3 NONRADIOLOGICAL CONDITIONS
3.5.3.1 Back~rounrl Air Orrality
SRS is in an area that is designated all attai]llne!lt area becallse it complies with National Ambient Air
Quality Standards for criteria pollutants, i!lcludillg s,dfur dioxide, nitrogen oxides (reported as nitrogen
dioxide), particulate matter (less than or equal to 10 Inicrot)s in diameter), carbon monoxide, ozone, and
lead (see 40 CFR 8 1). The closest nollattailmlc!]t area (atl area that does not meet National Ambient Air
Quality Standards) to SRS is the Atlanta, Georgia, air q,[ality region, which is 233 kilometers (145 miles)
to the west.
Sources in attainment areas !rrust CO!lIPIYwith Prevention!] of Significant Deterioration regulations. Tbe
regulations apply to new and )rrodified sollrces of air pollution if the net increase in emissions from the
new or modified source is detemrined to exceed the Preve!ltioll of Significant Deterioration annual
threshold limit (see 40 CFR S2.21). Developllle!}t at SRS has not triggered Prevention of Significant
Deterioration permitting requirements, I]or is it expected to trigger such requirements in the future.
3.5.3.2 Air Pollutant Source Emissions
DOE has delrronstrated colrrpl iallce \vith state and Federal air quality standards by modeling ambient air
concentrations that would result from lnaxitn cun potetltial emission rates using the calendar year 1990
(most recent available) air etllissions iijvel~tory data as the baseline year. Tbe compliance demonstration
also included sources forecast for construct iot] or operatio(] through 1995 and permitted sources
supporting the Defense Waste Processi[lg Fac iIity (WSRC 1993b). SRS based its calculated emission
rates for the complia)]ce deulollstratio!l sollrces oil process knowledge, source testing, permitted
operating capacity, material bala!]ce, al]d EPA air pollution etl]issiojl factors (EPA 1985).
3.5.3.3 ,4mbient Air Monitoring
At present, SRS does not perfomr otlsite alllbie]lt air quality monitoring, State agencies operate ambient
air quality monitoring sites in Barllwell at]d Aikell Counties in South Carolina, and Richmond County in
Georgia. These coutlties, which are [Iear SRS, are it] compliaj]ce with National Ambient Air Quality
Standards for particulate matter, lead, ozo(le, slllftlr dioxide, Ilitrogen oxides, and carbon monoxide (see
40 CFR 50).
3-28
DoE/sIs-0217July 1995
3.5.3.4 ~os oheric Dispersion Modeling
SRS has modeled atmospheric dispersion of both maximum potential and actual emissions of criteria and
toxic air pollutants using EPA’s Industrial Source Complex Short Term Model (EPA 1992). This
modeling was performed using the most recent ( 1991) quality-assured onsite meteorological data. The
maximum potential emissions data included sources of air pol Iution at SRS that either existed or were
pemritted to operate as of December 1992. Emissions data for 1990 were used for the modeling of actual
emissions (WSRC 1993b; Hunter and Stewart 1994). The results of this modeling are summarized in
Tables 3-6 asrd 3-7, which list the maximum concentrations occurring at or beyond the SRS bounda~.
Actual SRS boundary concentrations are probably lower than values reported in these tables,
TE
3.5.3.5 Summa~ o f Norsradioloxical Air Ouality
SCDHEC has air quality regulatory authority over SRS and determines compliance based on pollutant
emission rates and estimates of ambient concentrations at the SRS perimeter based on modeling. SRS
complies \vith National Ambient Air Quality Standards and the gaseous fluoride and total suspended
particulate standards, as required by SCDHEC Regulation R.6 1-62.S, Standard 2 (“Ambient Air Quality
Standards”), These standards are shown io Table 3-6. SRS complies with SCDHEC Regulation I TE
R.61 -62.5, Standard 8 (“Toxic Air Pollutants”), which regulates the emission of 257 toxic air pollutants
(EPA 1992). SRS has idel]tified emission sources for 139 of the 257 regulated air toxics; the modeling
Iresults indicate that SRS complies with SCDHEC air quality standards. Table 3-7 lists concentrations of TE
air toxics at the SRS boundary which exceed 1 percent of SCDHEC standards. Concentrations of all
other air toxics are less than 1 percent of SCDHEC standards and are shown in Table E.2- 1 in
Appendix E,
3.6 Ecological Resources
The United States acquired the SRS property in 1951. At that time, the site was approximately I TE
60 percent forest and 40 percent cropland and pasture (Wike et al. 1994). At present, more than
90 percent of SRS is forested. An extensive forest management program conducted by the Savannah
River Forest Station, which is operated by the U.S. Forest Service under an interagency agreement with I TE
DOE, has converted many former pastures atld fields to pine plantations. Except for SRS production and
support areas, natural succession has reclaimed many previously disturbed areas.
3-29
TE I
DoE/E1s-0217July 1995
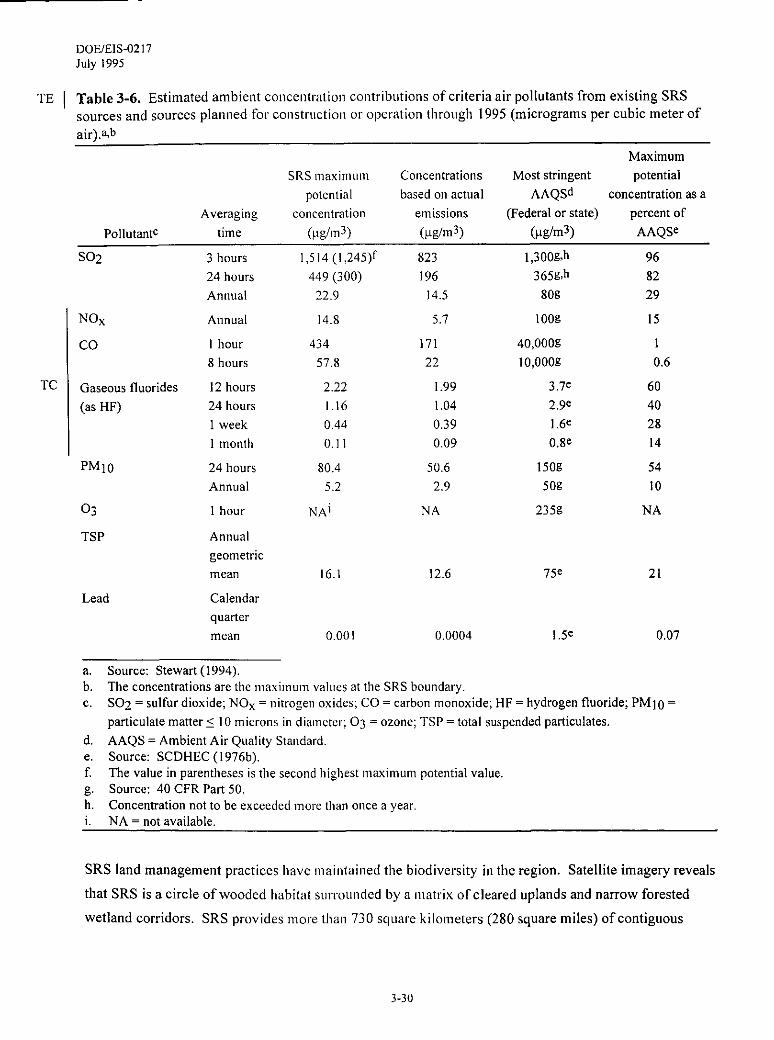
Table 3-6. Estimated ambient concentmtiml contriblltions of criteria air pollutants from existing SRS
sources and sources planned for constrtlction or operatiml throltgh 1995 (micrograms per cubic meter of
air).a.b
Maximum
SRS maximmn Concentrations Most stringent potential
potential based on actual AAQSd concentration as a
Averaging concentration emissions (Federal or state) percent of
Pollutant time (~lg/m3) (yglm3) (Ltim3) AAQSe
S02
co
TC IGaseous fluorides
(as HF)
IPMIO
03
TSP
Lead
3 hours
24 hours
Annual
Annual
1 hour
8 hours
12 hours
24 hours
1 week
1 month
24 hours
Annual
1 hour
Calendar
1,514 (l,245)t
449 (300)
22,9
14.8
4?4
57.8
2.22
1.16
0.44
0.11
80.4
5.2
NAi
16.1
823
196
14.5
5.7
171
22
1.99
1.04
0.39
0.09
50.6
2.9
NA
12.6
l,joog>h
365g>h
80g
1Oog
40,000g
Io,ooog
3.7e
2.9e
1.6e
o.8e
I5og
50’s
235g
75.
96
82
29
15
1
0.6
60
40
28
14
54
10
NA
21
quaner
mean 0.00 I 0.0004 1.5e 0.07
:.c.
d.e.f.
gh.i.—
Source Stewart (1994).The concentrations are the maximum valt!es at the SRS boundary.S02 = sulfur dioxide; NOX = Ilitrogen oxides; CO = carbon monoxide; HF = hydrogen fluoride; PM1o =
particulate matters 10 microlls in diameter; 03 = ozone; TSP = total suspended particulate.
AAQS = Ambient Air Quality Stalldard.Source: SCDHEC (1976 b).Tbe value in parentheses is tbe second highest ]maximum potential value,Source 40 CFR Pan 50.Concennation not to be exceeded more than once a year,NA = not available.
SRS land management practices have !mail]tail]ed the biodiversity ill the region. Satellite imagery reveals
that SRS is a circle of wooded habitat sljrrollndcd by a imatrix of cleared nplands and narrow forested
wetland corridors. SRS prnv ides more tball 730 sqLlare k iIometers (280 square miles) of contiguous
3-30
DoE/EIs-02 I7July 1995
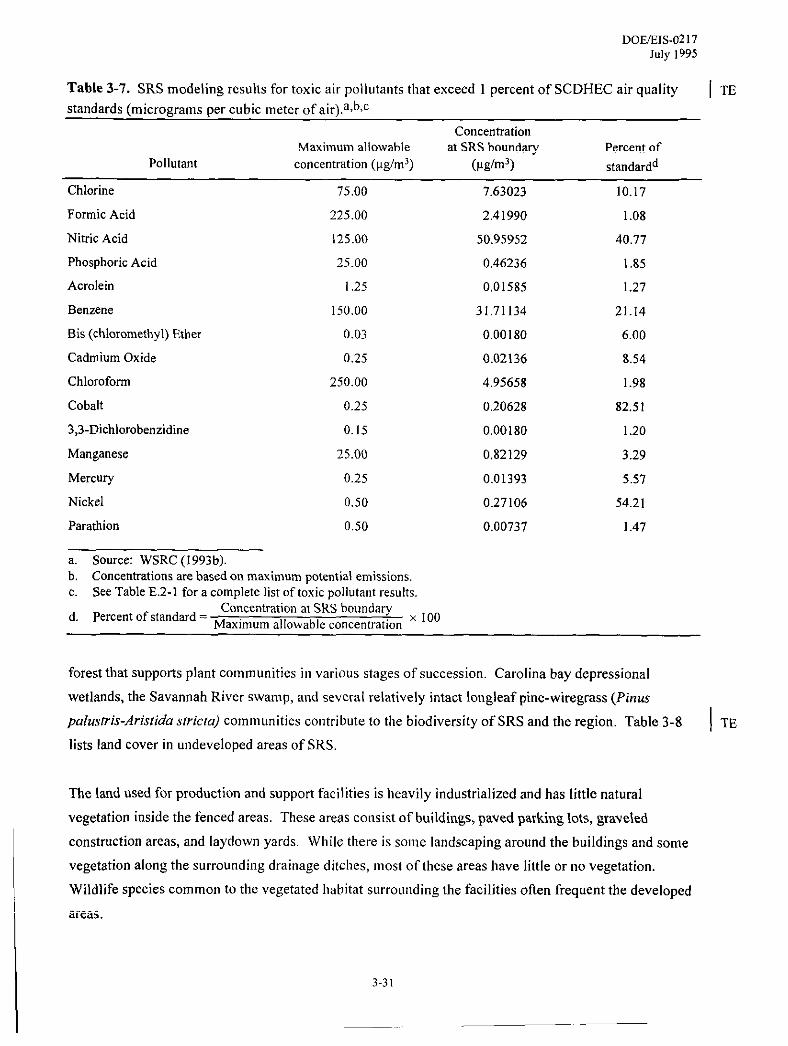
Table 3-7. SRS modeling results for toxic air pollutants that exceed 1 percent of SCDHEC air quality I ‘fE
standards (micrograms per cubic Imeter of air), a,b,c
ConcentrationMaximum allowable at SRS boundary Percent of
Pollutant concentration (yg/m3) (pg/m3) standardd
Chlorine 75.00 7.63023 10.17
Formic Acid 225.00 2.41990 1.08
Nitric Acid 125.00 50.95952 40.77
Phosphoric Acid 25.00 0.46236 1.85
Acrolein
Benzene
Bis (chloromethyl) Ether
Cadmium Oxide
Chloroform
Cobalt
3,3-Dichlorobenzidine
Manganese
1.25
150.00
0,03
0.25
250.00
0.25
0.15
25.00
0,01585
31.71134
0.00180
0.02136
4.95658
0.20628
0.00180
0,82129
1.27
21.14
6.00
8.54
1.98
82.51
1,20
3.29
Mercmy 0.25 0.01393 5.57
Nickel 0,50 0.27106 54.21
Parathion 0,50 0.00737 1.47
a. Source: WSRC (1993 b).b. Concentrations are based on maximum potential emissions.c. See Table E.2- 1 for a comnlete list of toxic DOIIutant results
d. Percent of standard =Concentration at SRS boundary ~ ,0.
Maximum allowable co[lcentration
forest that supports plant communities in various stages of succession. Carolina bay depressional
wetlands, the Savannah River swamp, and several relatively intact Iongleaf pine-wiregrass (Pinus
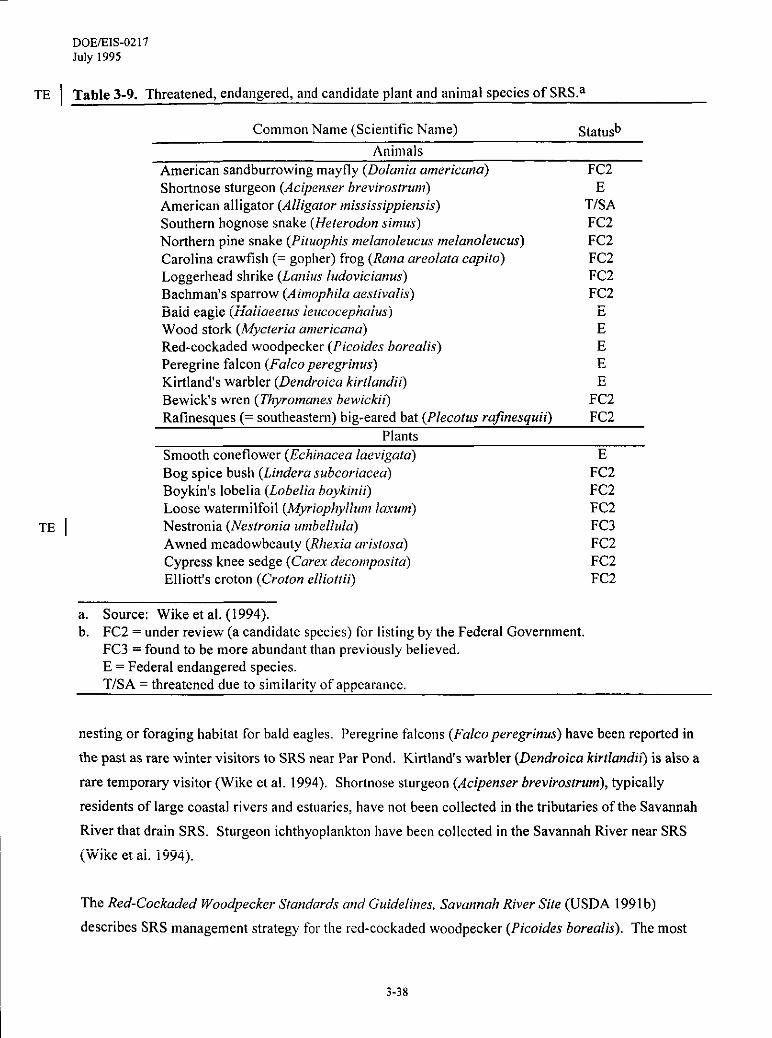
pa/ustris-Aristida stricta) communities contribute to the biodiversity of SRS and the region. Table 3-8 I TE
lists land cover in undeveloped areas of SRS.
The land used for production and support faci Iities is heavily industrialized and has little natural
vegetation inside the fenced areas. These areas ccmsist of buildings, paved parking lots, graveled
construction areas, and Iaydown yards. While there is some landscaping around the buildings and some
vegetation along the surrounding drainage ditches, most of these areas have little or no vegetation.
Wildlife species common to the vegetated habitat surrolmding the facilities often frequent the developed
areas.
3-3I
DOEIEIS-0217July I995
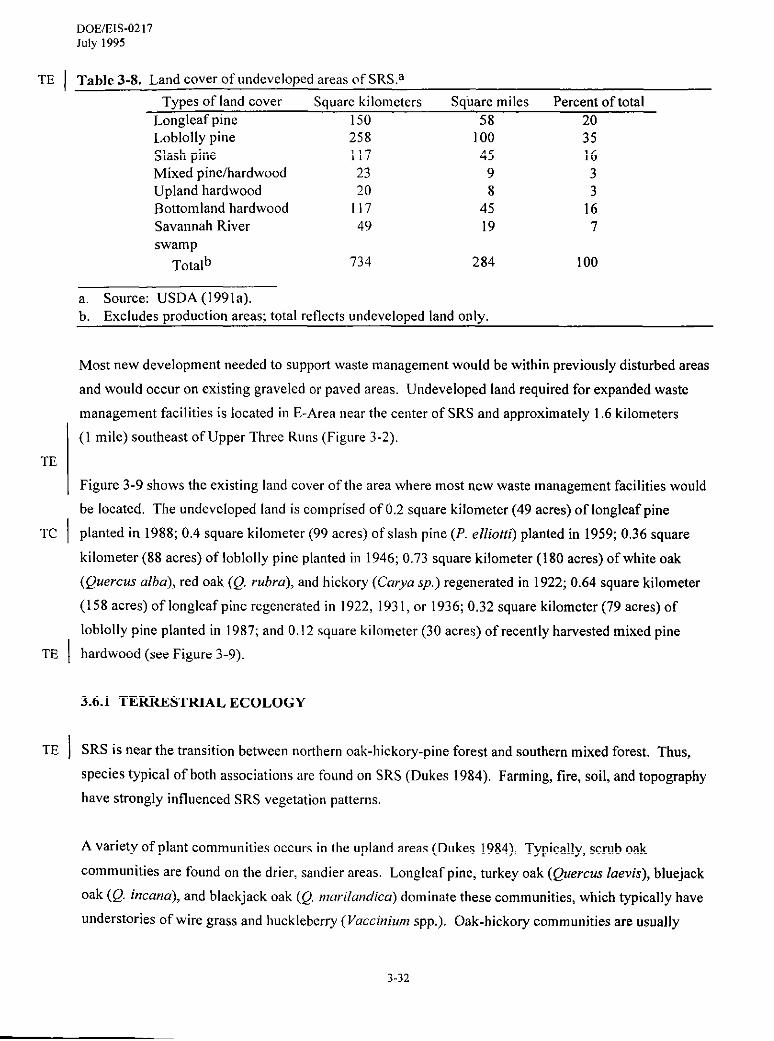
TE I Table 3-8. Land cover of undeveloped areas of SRS.a
Types of land cover Square kilometers Square miles Percent of total
Longleaf pine 150 58 20
Loblolly pine 258 100 35
Slash pine 117 45 16
Mixed pinefiardwood 23 9 3
Upland hardwood 20 8 3
Bottomland bardwood 117 45 16
Savannah River 49 19 7
swam p
Totalb 734 284 100
a. Source: USDA (1991a).
b, Excludes production areas; total reflects undeveloped land only.
TE
TC I
TE I
TE I
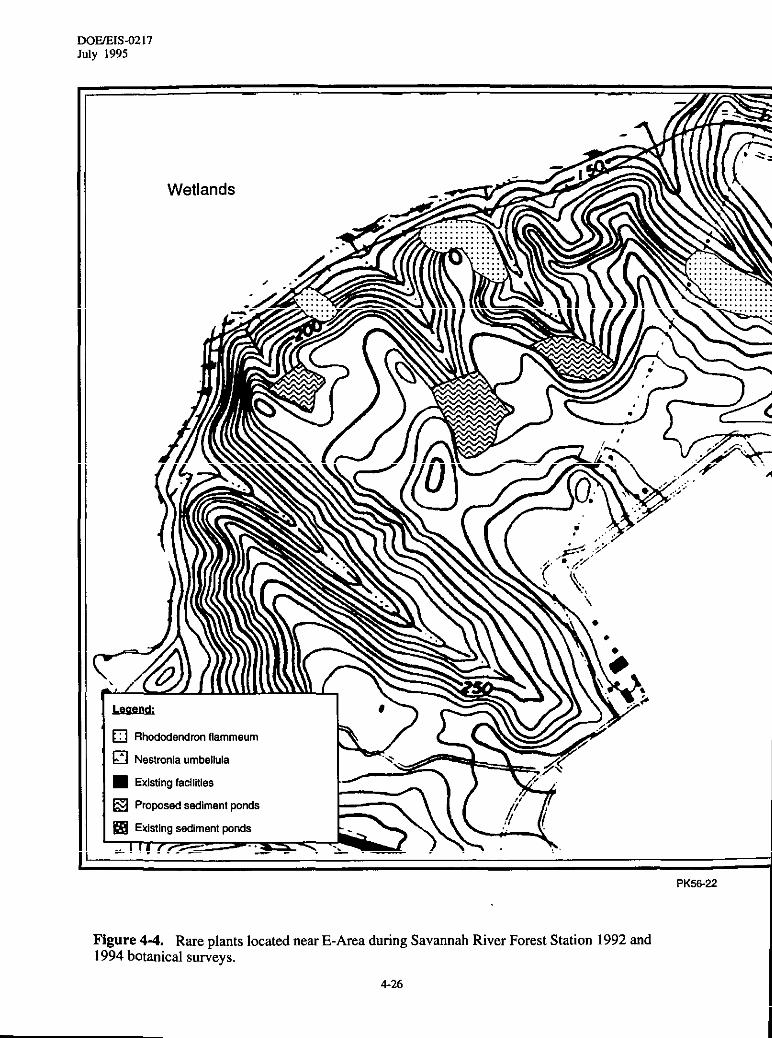
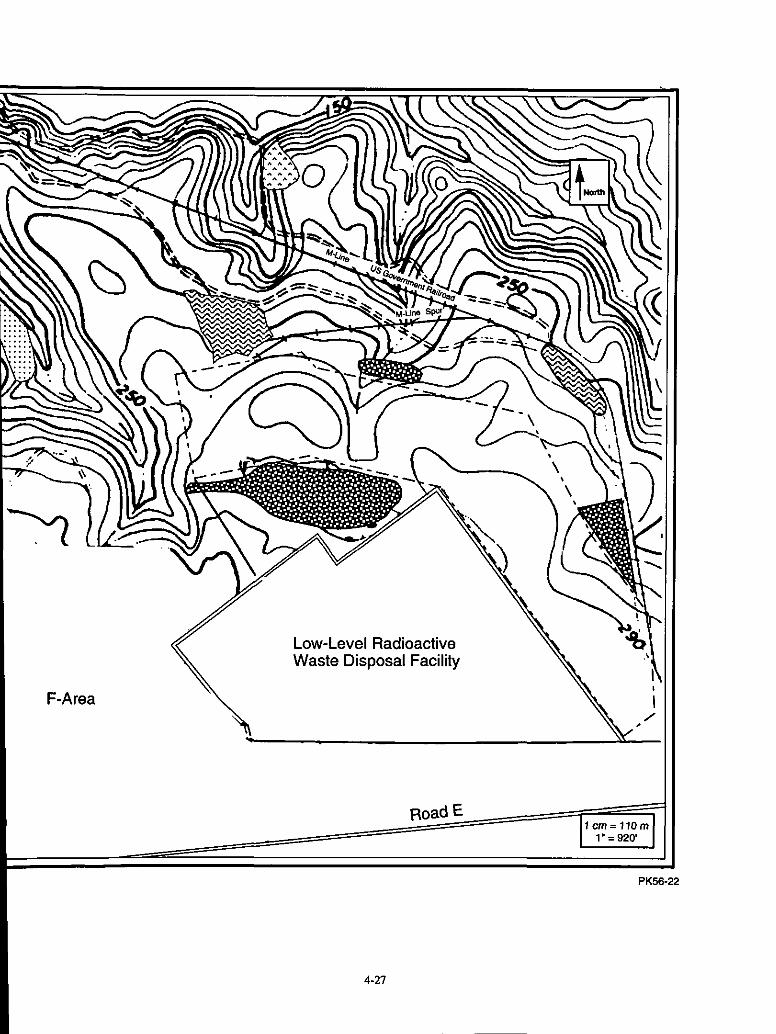
Most new development needed to support waste management would be witbin previously disturbed areas
andwould occur onexisting graveled or paved areas. Undeveloped land required forexpandedwaste
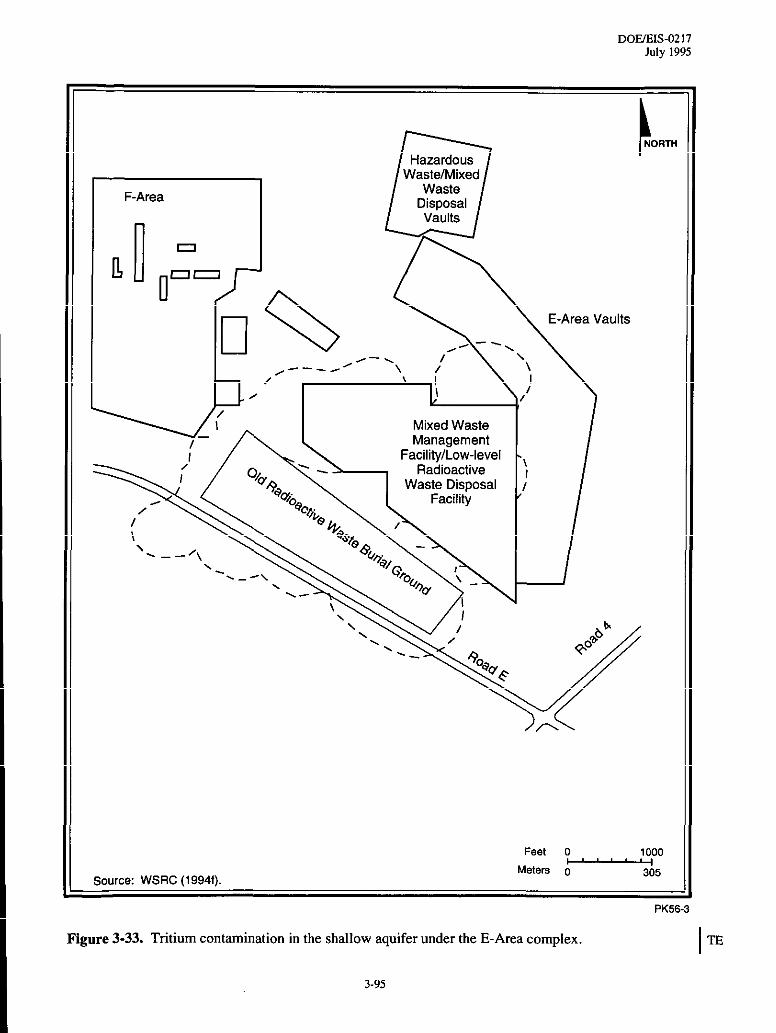
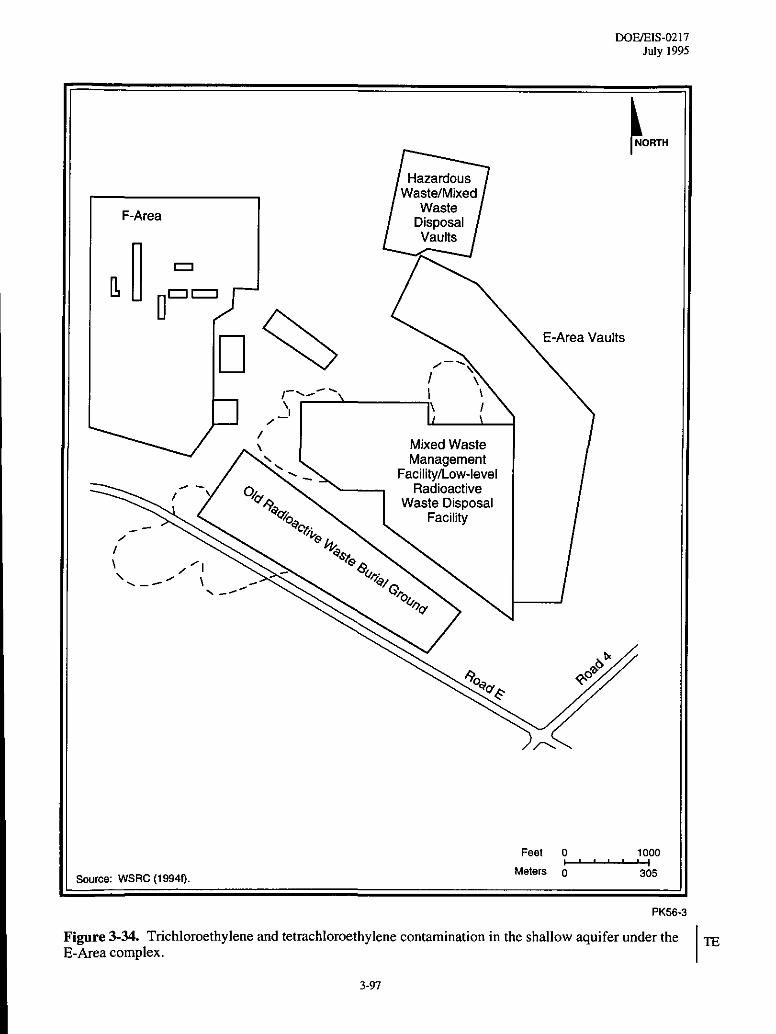
management facilities is located in E-Area near thecenterof SRS and approximately 1.6 kilometers
(1 mile) southeast of Upper Three Runs (FigLlre 3-2),
Figure 3-9 shows the existing land cover of the area where most new waste management facilities would
be located, Tlleundeveloped latldis coIllprised of 0,2square kilometer (49acres) oflongIeafpine
planted in 1988; 0,4 square kilometer (99 acres) of slash pine (P. elliotti) planted in 1959; 0,36 square
kilometer (88acres) ofloblolly pine planted in 1946; 0.73 square kilometer (180 acres) ofwhite oak
(Quercus alba), red oak (Q, rubra), and hickory (Ccrr,va sp,) regenerated in 1922; 0.64 square kilometer
(158 acres) of Iongleaf pine regenerated in 1922, 1931, or 1936; 0,32 square kilometer (79 acres) of
Ioblolly pine planted in 1987; and 0,12 square kilometer (30 acres) of recently hawested mixed pine
hardwood (see Figure 3-9).
3.6.1 TERRESTRIAL ECOLOGY
SRS is near the transition between northern oak-hickory-pine forest and southern mixed forest. Thus,
species typical of both associations are found on SRS (Dukes 1984), Farming, fire, soil, and topography
have strongly influenced SRS vegetation patterns.
A variety of plant communities occurs in the tlpland areas (Dukes 1984). Typically, scrub oak
communities are found O“ the drier, sandier areas, Longleaf pine, turkey oak (Quercus laevis), bluejack
oak (Q. irrcarra), and blackjack oak (Q, rr?arila}~diccr) dominate these communities, which typically have
rmderstories of wire grass and huckleberry ( Vaccirrium spp.). Oak-h icko~ communities are usually
3-32
DoE/EIs-021 7July 1995
located on more fertile, dry uplands; characteristic species are white oak, post oak (Q. sfeIIafa), red oak,
mockemut hickory (Carya tomentosa), pignut hickory (C. glabra), and Ioblolly pine, with an understory
of sparkleberry ( Vacciniurn arboreu~]t), ho! Iy (//ex spp. ), green briar (Srnilux spp.), and poison ivy
(Toxicodendron radicarrs) (Dukes 1984; Wike et al, 1994).
The departure of residents in 1951 and the sllbsequent reforestation have provided the wildlife of SRS
with excellent habitat. Forbearers such as gray fox ( Urocyon cirzereoargenfeus), opossum (Dide/phis
virginiana), and bobcat (Felis rufus) are relatively common throughout the site. Game species such as
a. Source: U.S. Bureau of the Census (1990a).b. Methodologies used to collect census data result in situations in which the total population does not equal the
sum of the populations of the identified racial gro~Ips. III this table, people of color is calculated by subtractingthe white population froln the total population
3-46
DOE/SIS-0217July 1995
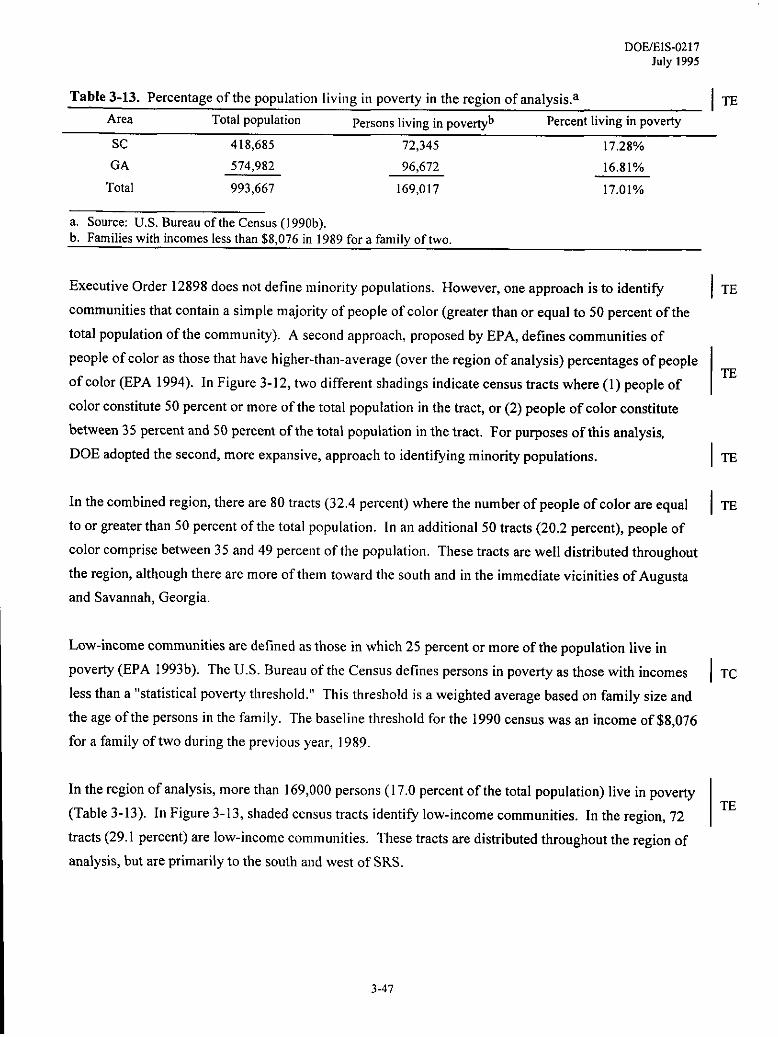
Table 3-I3. Percentage of the population Iiving in poverty in the region of analysis.a / TE
Area Total population persons living in povertyb Percent living in poverty
Sc 418,685 72,345 17.28%
GA 574,982 96,672
Total 993,667 169,017
16.81%
17.01%
a. Source: U.S. Bureau of the Census (1990b).b. Fanrilies with incomes less than $8,076 in 1989 for a family of two.
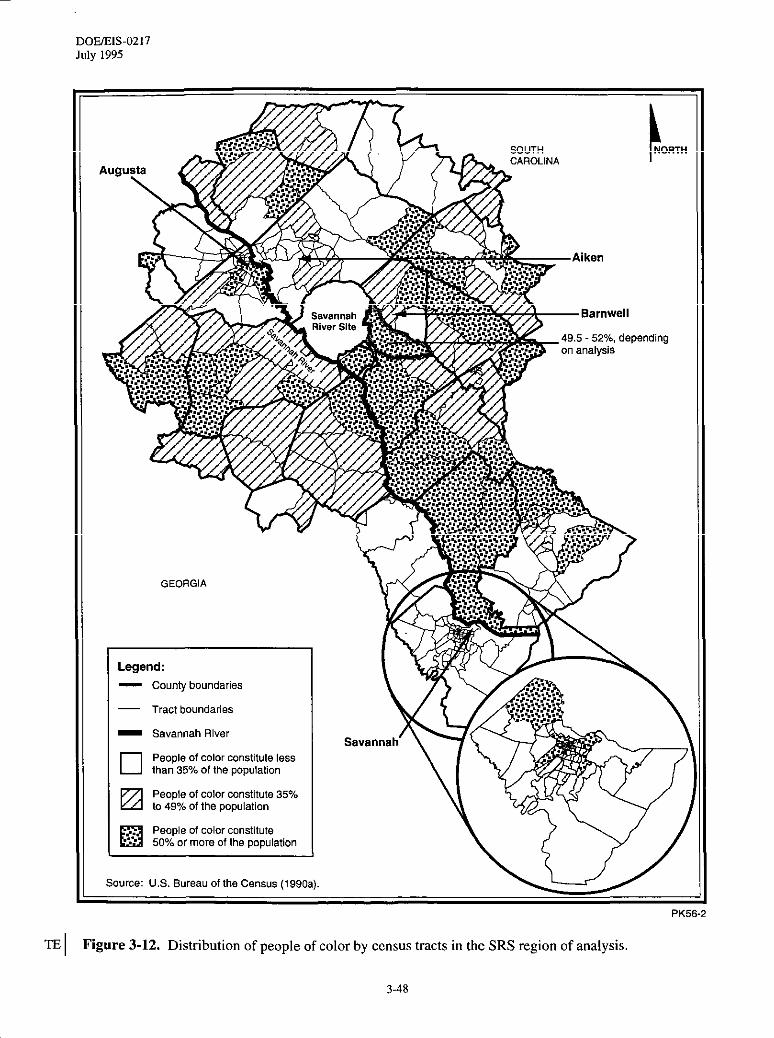
Executive Order 12898 does not define nrinority populations. However, one approach is to identify
communities that contain a simple majority of people of color (greater than or equal to 50 percent of the
total population of the community), A second approach, proposed by EPA, defines communities of
people of color as those that have higher-tha!l.average (over the region of analysis) percentages of people
of color (EPA 1994). In Figure 3-12, two different shadings indicate census tracts where (1) people of
color constitute 50 percent or more of the total population in the tract, or (2) people of color constitute
be~een 35 percent and 50 percent of the total population in the tract. For purposes of this analysis,
DOE adopted the second, more expansive, approach to identi~ing minority populations.
In the combined region, there are 80 tracts (32.4 percent) where the number of people of color are equal
to or greater than 50 percent of the total population. In an additional 50 tracts (20,2 percent), people of
color comprise beWeen 35 and 49 percent of the population. These tracts are well distributed throughout
the region, although there are more of thenr toward the south and in the immediate vicinities of Augusta
and Savannah, Georgia.
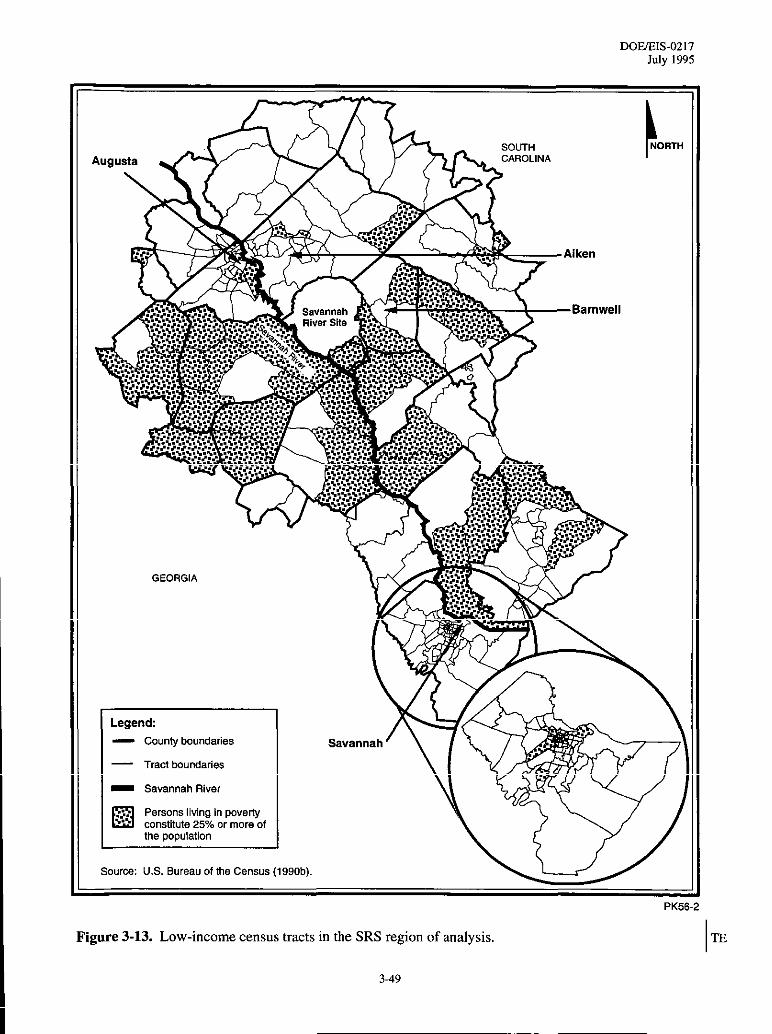
Low-income communities are defined as those in which 25 percent or more of the population live in
poverty (EPA 1993b). The U.S. Bureau of the Census defines persons in poverty as those with incomes
less than a “statistical poverty threshold.” This threshold is a weighted average based on family size and
the age of the persons in the family. The basel ine threshold for the 1990 census was an income of $8,076
for a family of two during the previous year, 1989.
I TE
TE
1~
TE
I TC
In the region of analysis, more than 169,000 persons (1 7.0 percent of the total population) live in poverty
(Table 3-13), In Figure 3-13, shaded census tracts identify low-income communities. In the region, 72 ‘E
tracts (29. 1 percent) are low-income communities. These tracts are distributed throughout the region of
analysis, but are primarily tn the south and west of SRS.
3-47
DO~IS-0217July 1995
‘z’;’;’ ....n.=
Legend:
_ Savannah River ‘R. \In Peopleofcolorconstituteless
than 35%of the populationI ‘-”-””””-”” \ ( Y* /“
l~~~:~~=eI wPeopleofcolorconstitute35%
50%o moreof the population
Source: U.S. Sureau of the Census (1990a).
OK.. .r m.”.<
E I Figure 3.12. Distribution of people of color by census tracts in the SRS region of analysis,
3-48
DomIs-02 I 7July 1995
Legend:
— Countyboundaries
— Traclbundanes
_ Savannah River
PK51
Figure 3-13. Low-income census tracts in the SRS region of analysis,
349
m
DOE/EIS-0217July 1995
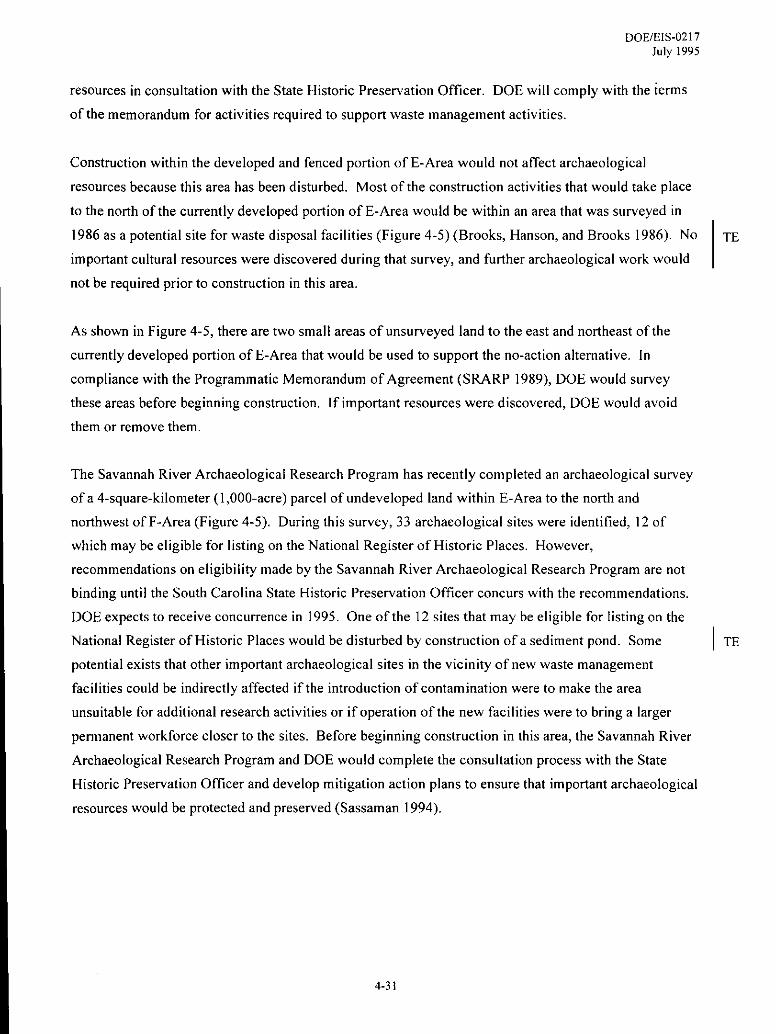
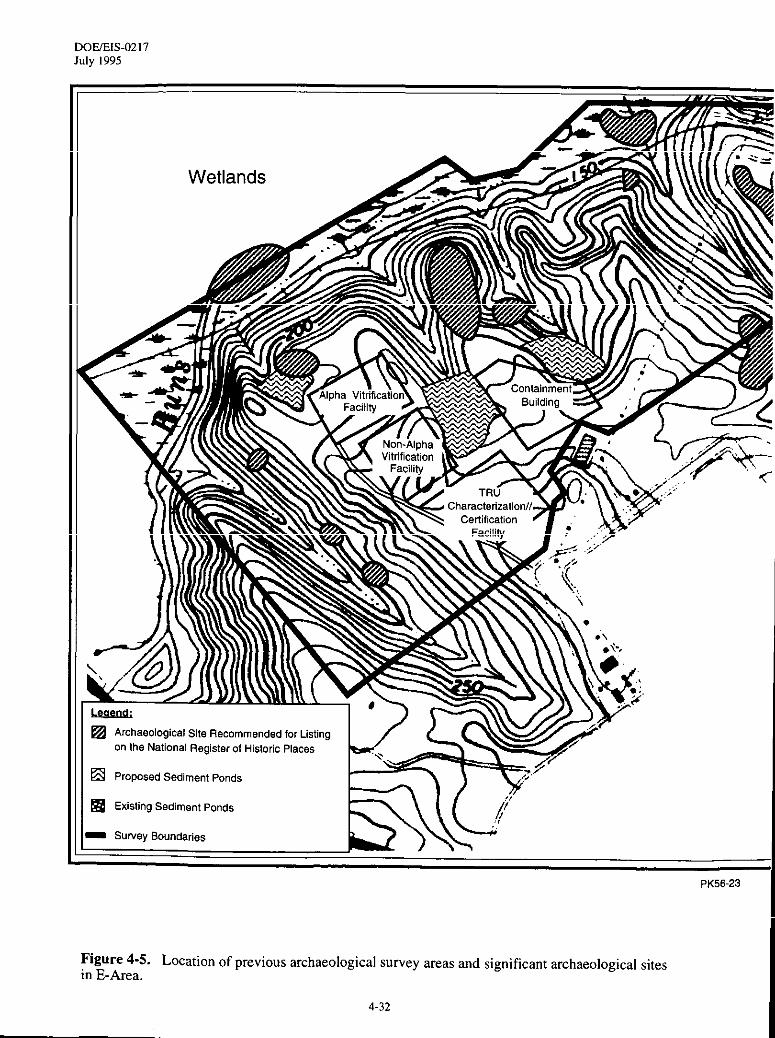
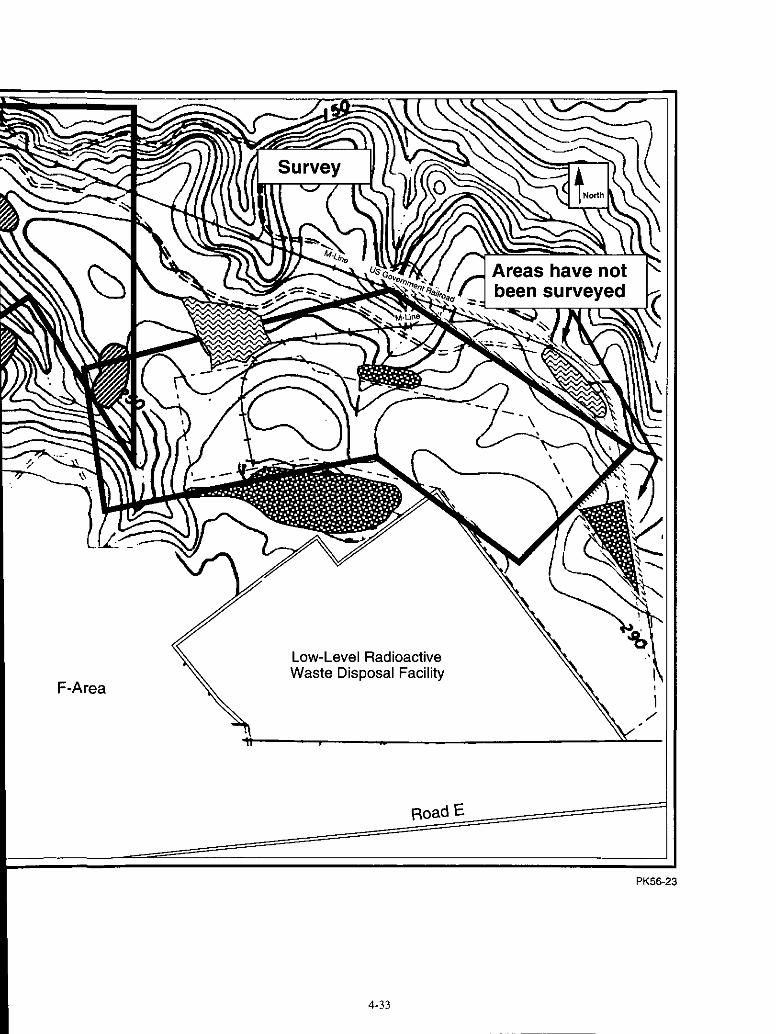
3.9 Cultural Resources
3.9.1 ARCHAEOLOGICAL SITES AND HISTORIC STRUCTURES
Field studies conducted over the past two decades by the South Carolit~a Institute of Archaeology and
Anthropology of the University of Solltb Carolilm, under contract to DOE and in consultation with the
South Carolina State Historic F’reservatioll Officer, have provided considerable information about the
distribution and contellt of archaeological and historic sites on SRS. By the end of September 1992,
approximately 60 percent of SRS had bee[l examil]ed, and 858 archaeological (historic and prehistoric)
sites had been identified. Of these, 53 have bee!l determined to be eligible for the National Register of
Historic Places; 650 have not been evaluated. No SRS facilities have been nominated for the National
Register of Historic Places, and there are 110plal]s for no!nillations at this time. The existing SRS nuclear
production facilities are not likely to be eligible for the Natio!~al Register of Historic Places, either
because they lack architectural integrity, do !Iot represent a particular style, or do not contribute to the
broad historic theme of the Manhattan Project and the production of initial nuclear materials (Brooks
1993, 1994).
Archaeologists have divided SRS into three zones related to their potential for containing sites with
multiple archaeological componel]ts or de[lse or diverse artifacts, and their potential for nomination to
the National Register of Historic Places (SRARP 1989).
. Zone 1 is the zone of the highest archaeological site density, with a high probability of
encountering large archaeological sites \vith dense and diverse artifacts, and a high potential for
nomination to the National Register of Historic Places,
. Zone 2 includes areas of lnoderate archaeological site density. Activities in this zone have a
moderate probability of ellcoullterillg large sites with more than three prehistoric components or
that would be eligible for nomillatiol] to the Natiotlal Register of Historic Places.
. Zone 3 includes areas of low archaeological site density, Activities in this zone have a low
probability of encountering archaeological sites and virtually no chance of encountering large
sites with more than three prehistoric co[llpotlents; the Ileed for site preservation is lnw, Some
exceptions to this definition have bee)) discovered itl Zone 3; some sites in the zone could be
considered eligible for no]ninatiot] to tke Natiol]al Register of Historic Places,
3-50
DOEiEIS-0217July 1995
S- sad Z-Areas were extensively surveyed prior to construction of the Defense Waste Processing
Facility. NO archaeological or historic artifacts were fotmd (DOE 1982). The construction of F- and
H-Areas during the 1950’s is likely to have destroyed ally historic or archaeological resources in those
areas (Brooks 1993).
3.9.2 NATIVE AMERICAN CULTURAL RESOURCES AND CONCERNS
In conjunction with studies in 1991 related to the New Production Reactor, DOE solicited the concerns
of Native Americans about religious rights in the Central Savannah River Valley. During this study,
three Native American groups, the Yuchi Tribal Organ izatio!], the National Council of Muskogee Creek,
and the Indian People’s Muskogee Tribal TOWI1Confederacy, expressed general concerns about SRS and
the Central Savannah River Area, but did Ilot identify specific sites as possessing religious significance.
The Yuchi Tribal Organization and the National Council of Muskogee Creek are interested in several
pkmt species traditionally used in tribal ceremonies, such as redroot (Lachnarrfhes caroliniarrum), button
snakeroot (EWngium yucc]~olium), and American ginseng (Parrux guirrgue~olium) that may occur on SRS
~S 1991a). Redroot and button snakeroot are known to occur on SRS (Batson, Angerman, and Jones
1985), DOE included all three tribal organizations on its mailing lists and sends them documents about
SRS environmental activities,
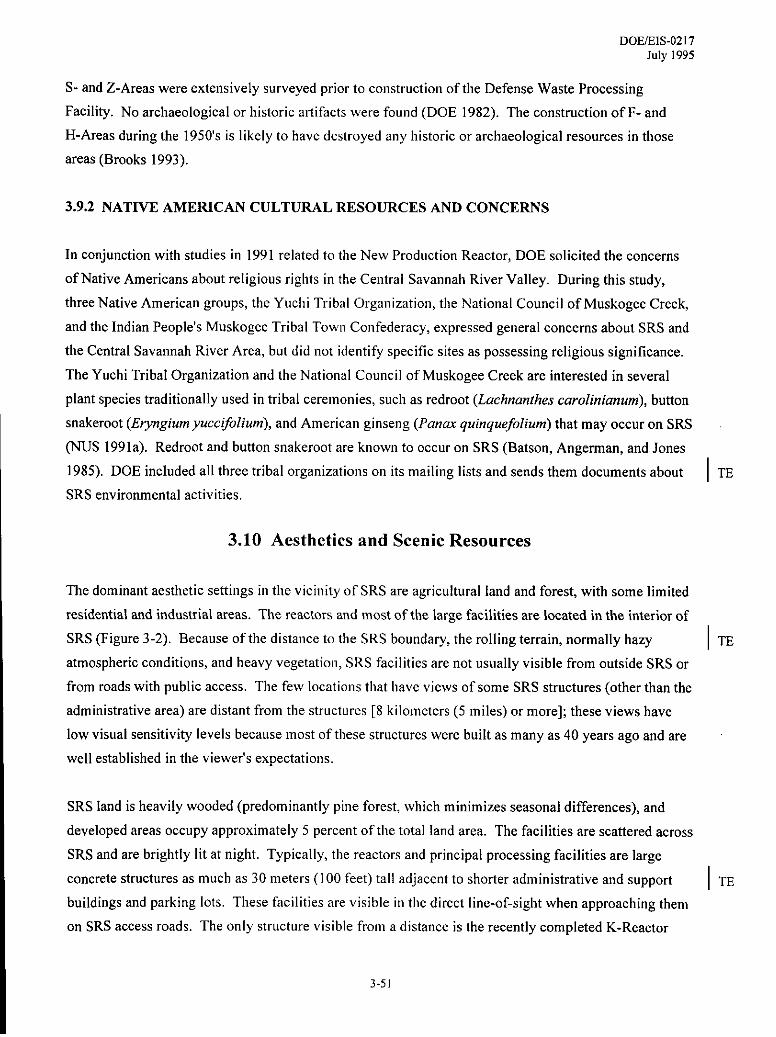
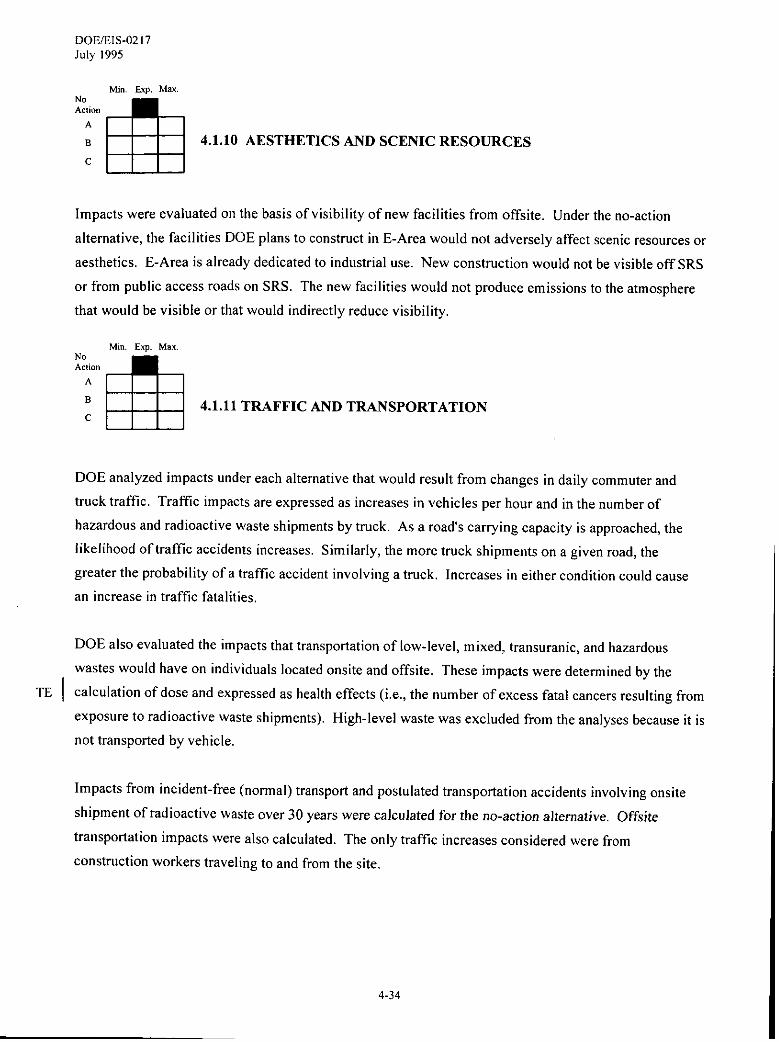
3.10 Aesthetics and Scenic Resources
The dominant aesthetic settings in the vicill ity of SRS are agricultural land and forest, with some limited
residential and industrial areas. The reactors and most of the large facilities are located in the interior of
SRS (Figure 3-2). Because of the distance to the SRS bou[ldary, the rolling terrain, normally hazy
atmospheric conditions, and heavy vegetatio(l, SRS facilities are not usually visible from outside SRS or
from roads with public access, The few locations that have views of some SRS structures (other than the
administrative area) are distant from the structures [8 ki Iometers (5 miles) or more]; these views have
low visual sensitivity levels because most of these structures were built as many as 40 years ago and are
well established in the viewer’s expectatiol]s.
I ‘rE
I ‘rE
SRS land is heavily wooded (predominantly pine forest, \vhich minimizes seasonal differences), and
developed areas occupy approximate y 5 percent of the total land area. The facilities are scattered across
SRS and are brightly lit at night. Typically, the reactors and principal processing facilities are large
concrete structures as much as 30 meters (100 feet) tal I adjacent to shorter administrative and support 1 ‘t-E
buildings and parking lots. These facilities are visible i!] the direct line-of-sight when approaching them
on SRS access roads. The only structure visible from a distance is the recently completed K-Reactor
3-51
TE I
TE I
DOE/EIS-0217July 1995
Cooling Tower. Since this tower wi II not be operated, the absence of a steam plume ensures no further
visual impact. Otherwise, heavily wooded areas that border the SRS road system and public highways
crossing the Site limit views of the facilities.
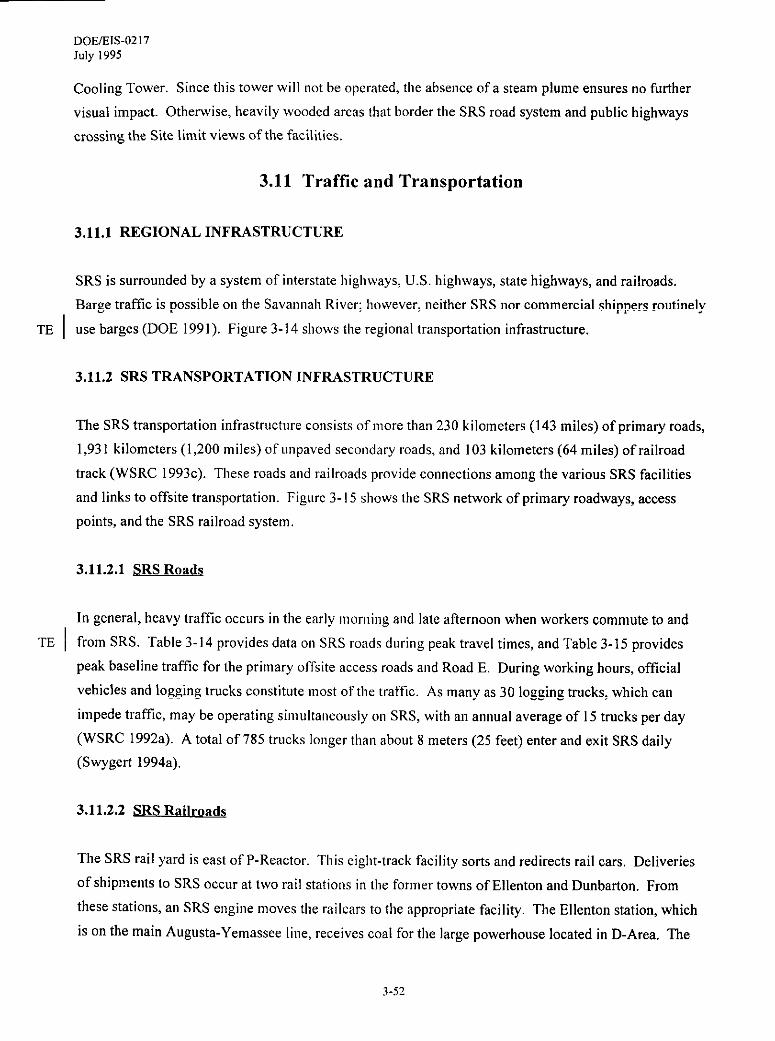
3.11 Traffic and Transportation
3.11.1 REGIONAL INFRASTRUCTURE
SRS is surrounded by a systeln of interstate highways, U.S. highways, state highways, and railroads.
Barge traffic is possible on the Savannah River; however, neither SRS nor commercial shippers routinely
use barges (DOE 1991). Figure 3-14sl)o\vs tlleregio{lal transponation infrastructure.
3.11.2 SRS TRANSPORTATION INFRASTRUCTURE
The SRS transportation infrastructure consists of nlore than 230 kilometers (143 miles) of primary roads,
1,931 kilometers ( 1,200 Iniles) of Llnpaved secondary roads, and 103 kilometers (64 miles) of railroad
track (WSRC 1993c). These roads and railroads provide connections among the various SRS facilities
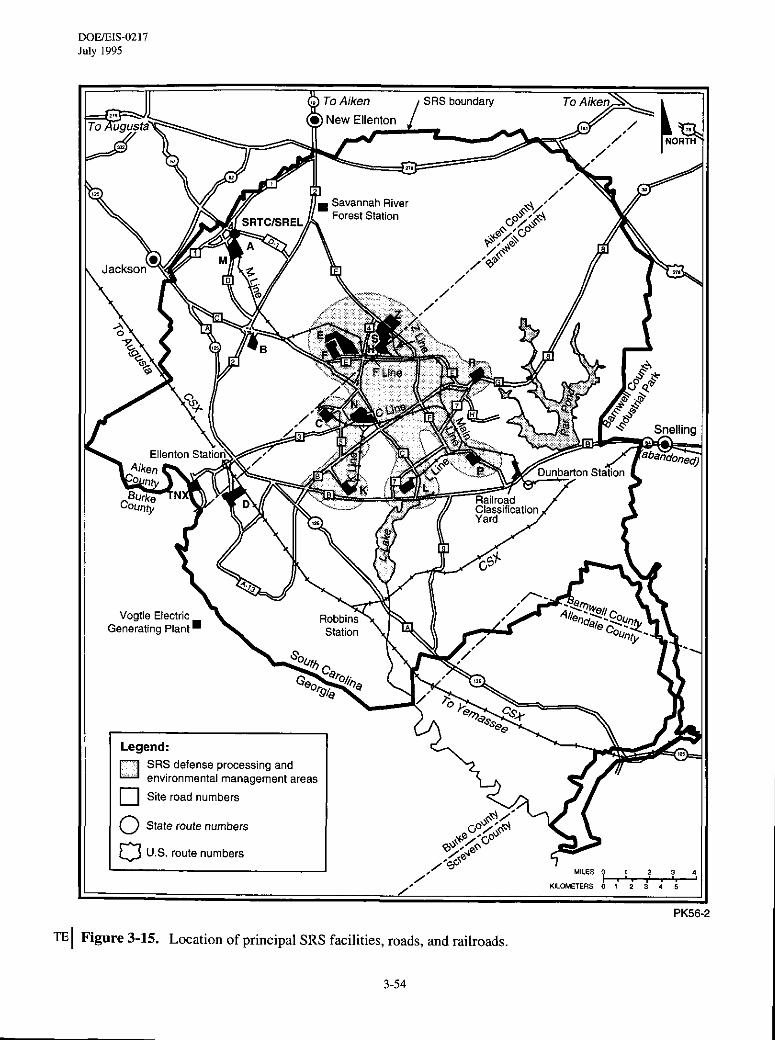
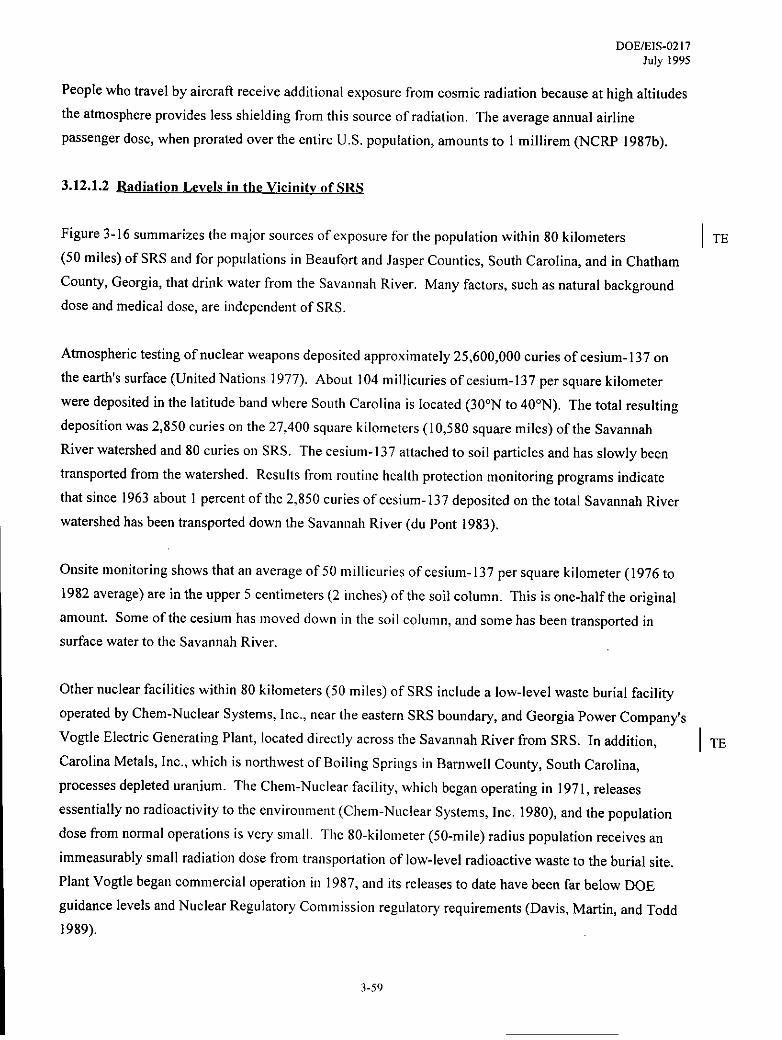
and links to offsite transportation. Figure 3-15 shows the SRS network of primary roadways, access
points, and the SRS railroad system,
3.11.2.1 SRS Roads
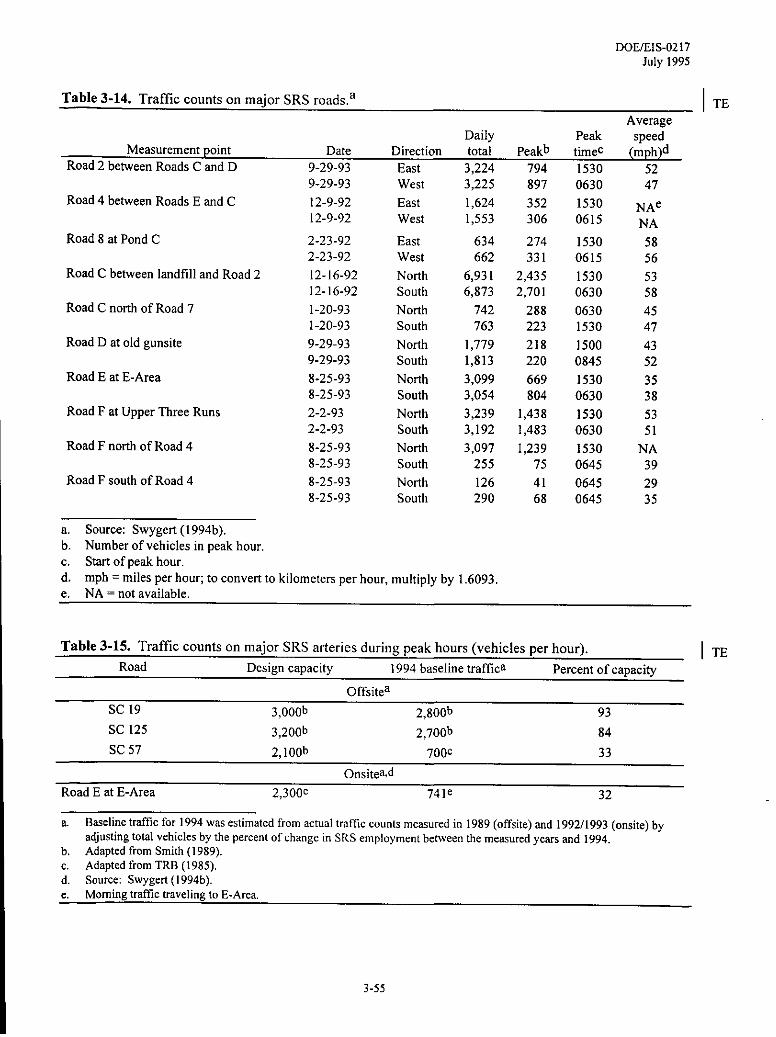
In general, heavy traffic occurs ill the early nJoming and late afternoon when workers commute to and
from SRS. Table 3-14 provides data 011SRS roads dliring peak travel times, and Table 3-15 provides
peak baseline traffic for the primary offsite access roads and Road E. During working hours, official
vehicles and logging trucks constitute lnost of the traffic, As many as 30 logging trucks, which can
iinpede traffic, may be operating sinlultaneously on SRS, with an annual average of 15 trucks per day
(WSRC 1992a). A total of 785 trucks longer than about 8 meters (25 feet) enter and exit SRS daily
(Swygeti 1994a),
3.11.2.2 SRS Railroads
The SRS rail yard is east of P-Reactor. This eight-track facility sorts and redirects rail cars, Deliveries
of shipments to SRS occur at two rai I stations itl the forlner towns of Ellenton and Dunbarton. From
these stations, an SRS engine moves tbe railcars to the appropriate facility. The Ellenton station, which
is on the main Augusta-Y emassee Iine, receives coal for the large powerhouse located in D-Area. The
❑ SRSdefense processing andenvironmental management areas
❑ Site road numbers
o State ro.te”urntlers
~ US, ro.tenumbers
n,,.. .
TE Figure 3-15. Location of principal SRS facilities, roads, and railroads
3-54
DoE/EIs-021 7July 199S
Table 3-14. Traffic counts on major SRS roads,a
AverageDaily Peak speed
Measurement point Date Direction total Peakb timec (mph)dRoad 2 between Roads C and D 9-29-93 East 3.224 794 1530 52
Road 4 between Roads E and C
Road 8 at Pond C
Road C between Imdfill and Road 2
Road C north of Road 7
Road D at old gunsite
Road Eat E-Area
Road Fat Upper Three Runs
Road F noti of Road 4
Road F south of Road 4
9-29-93
12-9-9212-9-92
2-23-922-23-92
12-16-9212-16-92
1-20-931-20-93
9-29-939-29-93
8-25-938-25-93
2-2-932-2-93
8-25-938-25-93
8-25-938-25-93
West
East
West
EastWest
NorthSouth
NotthSouth
North
South
NoflhSouth
NorthSouth
NorthSouth
North
South
3;225
1,6241,553
634662
6,9316,873
742763
I ,7791,813
3,0993,054
3,2393,192
3,097255
126290
a, Source: Swygert (1994b).b. Number of vehicles in peak hour,c, Start of peak hour.d. mph= miles per hrmL to convert to kilometers per hour, multiply by 1.6093e. NA = not available.
897
352306
274331
2,4352,701
288223
218220
669804
1,4381,483
1,23975
4168
0630
15300615
15300615
15300630
06301530
15000845
15300630
15300630
15300645
06450645
47
NAe
NA
5856
5358
4547
4352
3538
5351
NA39
2935
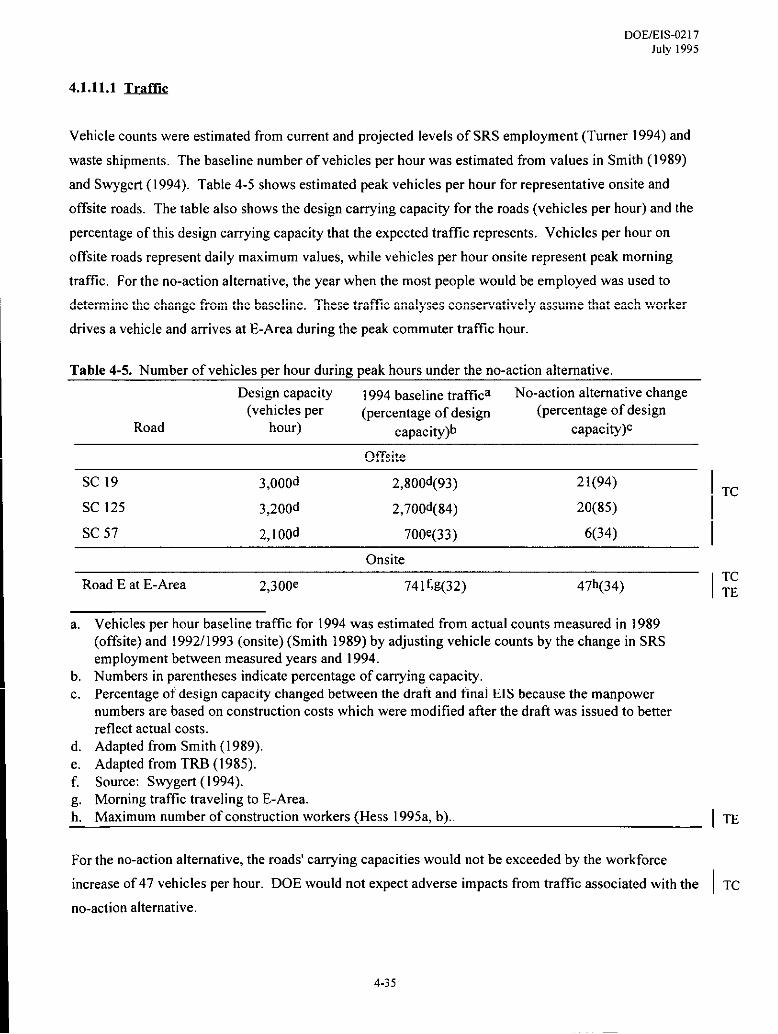
Table 3-15. Traftic counts on major SRS arteries duri!lg peak hours (vehicles per hour).
Road Design capacity 1994 baseline traffica Percent of capacity
Offsitea
Sc 19 3,000b 2,800b 93
SC 125 3,200b 2,700b 84
Sc 57 2,100b 700C 33
Onsite<d
Road E at E-Area 2>300c 741e 32
I TE
I TE
a. Baselinetraffic for 1994 was estimatedfrom actual traffic countsmes”red in 1989 (offsite) md 1992/1993 (mrsitc) byadjustingtotal vehicles by the percentof change in SRS employment betweentbe measuredyews and 1994.
b. Adapted from Smith (1989).c. Adaptedfrom TRB (1985).d. Source Svgeti ( 1994b).e. Morning traffic traveling to E-Area.
3-55
DOE/’EIS-O2l7July 1995
Dunbarton station receives the other rail shipments and coal for the smaller powerhouses located
throughout SRS (McLain 1994).
Under normal conditions, about 13 trains per day use the CSX tracks through SRS (Bums 1993).
Movement of coal and casks containing radioactive material constitutes the bulk of rail traffic (DOE
1991),
3.11.3 NOISE
Previous studies have assessed noise impacts of existing SRS operational activities @US 1991b; DOE
TE I 1990, ,991). These studies co!)cludedtl]at, because oftlleremotelocationsoftheSRSoperational~eas,
there are no known conditions associated with existing sources of noise at SRS that adversely affect
individuals at offsite locations,
3.12 Occupational and Public Radiological Health and Safety
3.12.1 PUBLIC RADIOLOGICAL HEALTH
A release of radioactivity to the environment from a nuclear facility is an important issue for both SRS
workers and the public. However, the environnlent contains many sources of radiation, and it is
important to understand all the sources of ionizing radiation to which people are routinely exposed.
3.12.1.1 so urces of Environmental Radiation
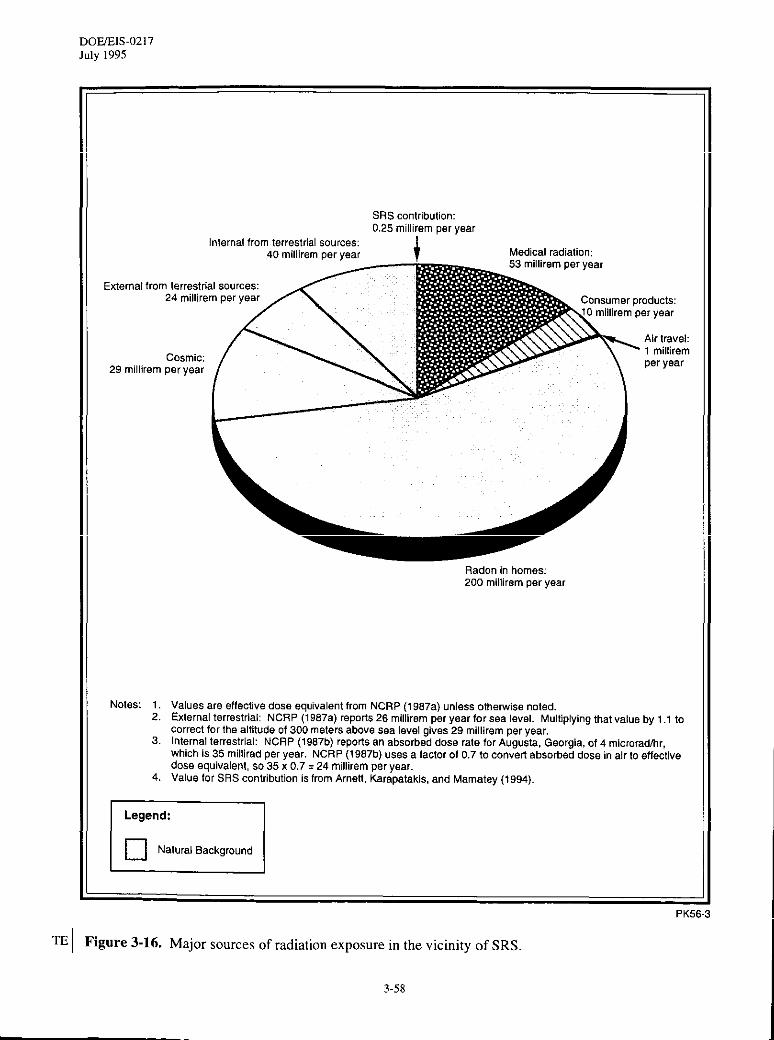
Environmental radiation consists of natural background radiation from cosmic, terrestrial, and internal
body sources; radiation from medical diagnostic and therapeutic practices; radiation from weapons tests
fallout; radiation from consumer and industrial products; and radiation from nuclear facilities. All
radiation doses mentioned in this EIS are “effective dose equivalents” (i.e., organ doses are weighted for
fossil fuels, and building materials. The estimated average annual dose for the U.S. population from
these sources is 10 millirem per year WCRP 1987a). About one-third of this dose is from external
exposure to naturally occurring radicmucl ides in bu ilditlg materials.
3-57
DO~lS-0217July 1995
SRS contribution:0.25 milliremDBryear
Internalfrom terrestrialsources:40 milliremper year Medcal radiation:
24m~mpeyea ~
53 milliremoer vear
Externalfrom Ierrestr!alsources:
Notes: 1.2.
3.
4.
Air travel:
Radon in homes!200 milfhemper year
Values are effectivedose equivalentfrom NCRP (1987a) unlessothe~ise noted.Externalterrestrial: NCRP (1987a) repofls26 milliremper year for sea level. Multiplyingthat value by 1.1 tocorrectfor the altitudeof 300 metersabove sea level gives29 milliremper year,Internalterrestrial: NCRP (1987b) reportsan absorbeddose rate forAugusta,Georgia,of 4 mlcrorad~r,whichis 35 mifliradperyear. NCRP (1987b) uses a factorof 0.7 to convertabsorbeddose in air to effectivedose equivalent,so 35 x 0.7.24 milliremper year.Value for SRS contributionisfromArnetf Karapatakls,and Mamatey (1994).
PK51
~ I Figure 3-16. Major sources of radiation exposure in the vicinity of SRS.
3-58
DoE/E1s-02 17July 1995
People who travel by aircraft receive additional exposure from cosmic radiation because at high altitudes
tbe atmosphere provides less shielding from this solirce of radiation. The average annual airline
passenger dose, when prorated over the entire U.S. population, amounts to 1 millirem @CRP 1987b).
3.12.1.2 Radiation Levels in the Vicinitv of SRS
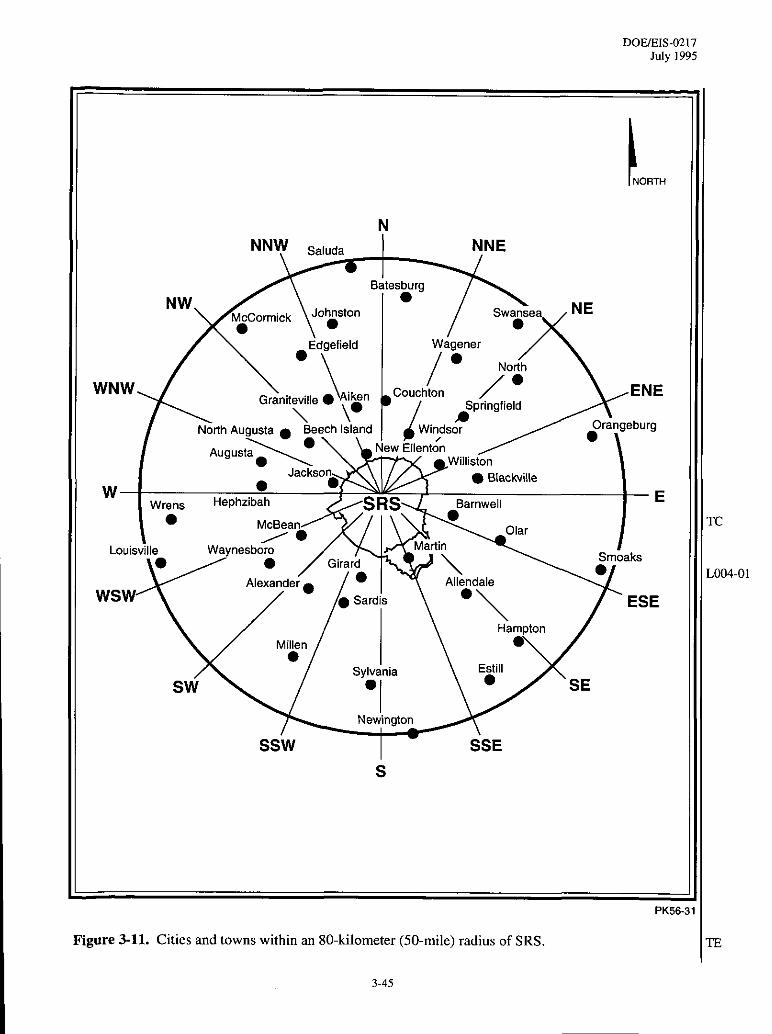
Figure 3-16 summarizes the major sources of exposure for the population within 80 kilometers
(50 miles) of SRS and for populations i]l Beallfort and Jasper Counties, South Carolina, and in Chatham
County, Georgia, that drink water from the Savannah River, Marry factors, such as natural background
dose arrd medical dose, are independent of SRS.
Atmospheric testing of nuclear weapons deposited approximately 25,600,000 curies of cesium- 137 on
the earth’s surface (United Nations 1977). About 104 m i11icuries ofcesium-137 per square kilometer
were deposited in the latitude band where South Carolina is located (30°N to 40°N), The total resulting
deposition was 2,850 curies on the 27,400 square kilometers (1 0,580 square miles) of the Savannah
River watershed and 80 curies on SRS, Thecesium-137 attached to soil particles and has slowly been
transported from the watershed. Results from routine health protection monitoring programs indicate
that since 1963 about 1 percent of the 2,850 curies ofcesium-137 deposited on the total Savannah River
watershed has been transported down the Savannah River (du Pent 1983),
Onsite monitoring shows that an average of 50 millicuries of cesium- 137 per square kilometer (1976 to
1982 average) are in the upper 5 centimeters (2 inches) of the soil column. This is one-half the original
amount. Some of the cesium has moved down in the soi I column, and some has been transported in
surface water to the Savannah River.
Other nuclear facilities within 80 kilometers (50 miles) of SRS include a low-level waste burial facility
operated by Chem-Nuclear Systems, Inc., near the eastern SRS bomrda~, and Georgia Power Company’s
Vogtle Electric Generating Plant, located directly across the Savannah River from SRS. In additinn,
Carolina Metals, Inc., which is northwest of Boiling Springs in Barnwell County, South Carolina,
processes depleted uranium. The Chem-NLlclear facility, which began operating in 1971, releases
essentially no radioactivity to the environ n]ent (Chem-NLlclear Systems, Inc. 1980), and the population
dose from normal operations is very smal 1. The 80-kilometer (50-mile) radius population receives an
immeasurably small radiation dose from transportation of Inw-level radioactive waste to the burial site.
Plant Vogtle began commercial operation in 1987, and its releases to date have been far below DOE
guidance levels and Nuclear Regulatory Commission regulatory requirements (Davis, Martin, and Todd
1989).
I TE
I TE
3-59
DOE/EIS-0217July 1995
In 1993, releases of radioactive lnaterial to the e!wirollment from SRS operations resulted in a site
perimeter maximutn dose from all pathways frotn atnrospheric releases of 0.11 millirem per year (in the
north-nnrthwest sector), and a maxilnuln dose froln releases into water of 0,14 millirem per year, for a
maximum total annual dose at the SRS peri!lleter of 0.25 lnil Iire!n (Arnett, Karapatakis, and Mamatey
1994). The maximuln dose to downstrealn co!lsutllers of Saval]nah River water was to users of the Port
Wentworth public water supply, and was 0.05 in iIIireln per year (Arnett, Karapatakis, and Mamatey
1994),
In 1990, the populatiotl within 80 kilo!lleters (50 lni]es)ofSRSwas620,100 (Arnett, Karapatakis, andTE
Mamatey 1993 and Table 3-1 l). The collective effective dose equivalent to the 80-kilometer (50-mile)
population in 1993 was 7.6 person-relm fronl atlnospberic releases (Arnett, Karapatakis, and Mamatey
1994), The 1990 population of 65,000 people using water from Port Wentworth (Savannah), Georgia,
and from Beau fort and Jasper Cou[lt ies, Sooth Carol il]a, received a collective dose equivalent of
1.5 person-rem (Arnett, Karapatakis, and Mamatey 1994).
Controlled deer and hog hunts are conducted ant]ual]y at SRS to control their populations. Field
measurements perforined On each a!lilllal prior to release to the hunter determine the levels of Cesium.
137 present in the allilnal. Field measurelnents are subsequel]tly verified by laboratory analysis, and
dose calculations are perforlned to estilrrate dose to the nraximally exposed individual among the hunters,
In 1993, the maximally exposed individual Illlllter killed four deer and three hogs. The dose to this
hunter was estimated based on thecesiutn-137 nleasuretne!lts of the deer and hog muscle taken from
these animals and the conservative assl!tl]ption that the Ilullter consumed all of the edible portions of
these animals (337 pounds of nreat). The dose to this nlaxinrally exposed individual was estimated to be
57 millirem (Arnett, Karapatakis, and Manlatey 1994), which represents 57 percent of the DOE annual
limit of iOO nrillireln (DOE Order 5400.5).
In 1993, the maximally exposed illdivid~!al fisherll]all was assumed to eat 19 kilograms (42 pounds) of
fish per year, The dose to the fisherman was based otl consmnptioll of fish taken only from the mouth ofTE
Steel Creek on SRS, The dose to this il]dividllal was estilllated to be 1,30 millirem (WSRC 1994a) orLO04-04
1.3 percent of the DOE annual Iil]]it (DOE 1993a).
The hunter population dose was estijnated based 011the fact that 1,553 deer and 147 hogs were killed in
1993, These deer and hogs contained average cesiuln - 137 concentrations of 4.69 picocuries per gram
and 5.64 picocuries per grain, respective y. The regional average of cesium - 137 concentration in deer is
0.7 picocuries per gram (Fledder]na], 1994). The population) dose due to tbe consumption of SRS
3-60
DoE/EIs-021 7July 1995
animals is estimated to be 8,3 person-rem. The portion of this dose attributable to the presence of
cesium- 137 above the regional average concentration is 7.1 person-rem (Rollins 1994).
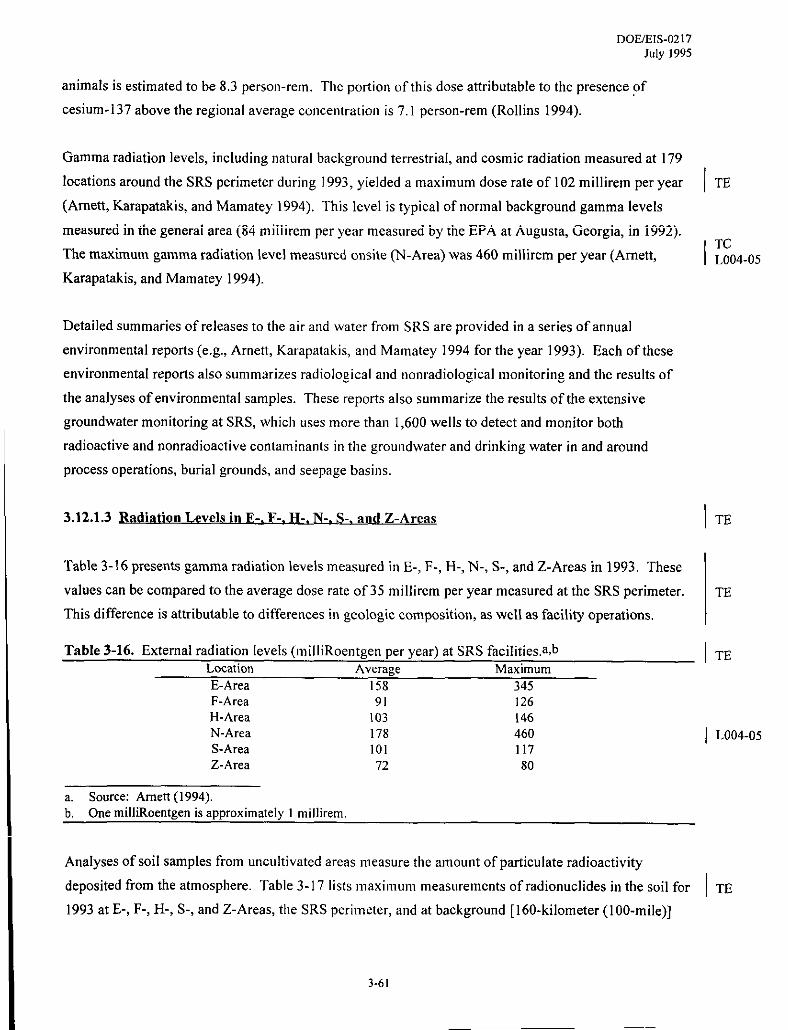
Gamma radiation levels, including natural background terrestrial, and cosmic radiation measured at 179
locations around the SRS perimeter during 1993, yielded a maximum dose rate of 102 millirem per year
(Amett, Karapatakis, and Mamatey 1994), This level is typical of normal background gamma levels
measured in the general area (84 millirem per year measured by the EPA at Augusta, Georgia, in 1992).
The maximum gamma radiation level measured onsite ~-Area) was 460 millirem per year (Amett,
Karapatakis, and Mamatey 1994).
Detailed summaries of releases to the air atld water from SRS are provided in a series of annual
environmental reports (e.g., Arnett, Karapatakis, and Mamatey 1994 for the year 1993). Each of these
environmental reports also summarizes radiological and nonradiologica] monitoring and the results of
the analyses of environmental samples. These reports also summarize the results of the extensive
groundwater monitoring at SRS, which uses more than 1,600 wells to detect and monitor both
radioactive and nonradioactive contain i!lants in the ground water and drinking water in and around
process operations, burial grounds, and seepage basins.
3.12.1.3 Radiation Le vels in E-. F-. H-, N-. S-. an d Z-Areas
Table 3-16 presents gamma radiation levels measured in E-, F-, H-, N-, S-, and Z-Areas in 1993, These
values can be compared to the average dose rate of35 mi Ilirem per year measured at the SRS perimeter.
This difference is attributable to differences in geologic composition, as well as facility operations,
I ‘i-E
I n134.05
I TE
TE
Table 3-16. External radiation levels (m illiRoentgen per year) at SRS facilities.a,b I TELocation Average MaximumE-Area 158 345F-Area 91 126H-Area 103 146N-Area 178 460 I LO04-05S-Area 101 117Z-Area 72 80
a. Source Amen (1994).b. One milliRoentgen is approximately 1 millirem.
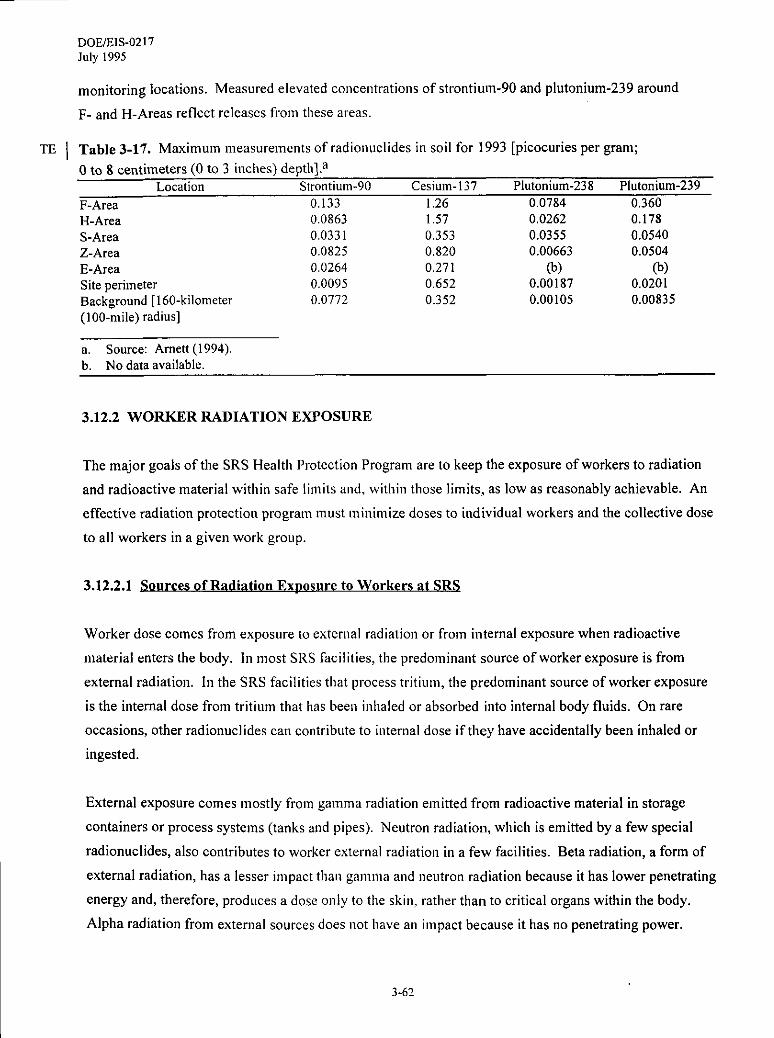
Analyses of soil samples from uncultivated areas measure the amount of particulate radioactivity
deposited from the atmosphere. Table 3-17 Iists lmaximum measllrements of radionuclides in the soil for ] TE
1993 at E-, F-, H-, S-, and Z-Areas, the SRS perimeter, and at background [160-kilometer (100-mile)]
3-61
TE I
DOE/EIS-0217July 1995
monitoring locations. Measured elevated concentrations of strontium-90 and plutonirrm-239 around
F- and H-Areas reflect releases from these areas
Table 3-17. Maximum measurements of radionuclides in soil for 1993 [picocuries per gram;
O to 8 centimeters (O to 3 inches) depth].aLocation StrOntiuln-90 Cesium-137 Plutrmium-238 PlutOnium-239
TE I PerPerson-remof radiation exposure (NCRp 1993).
In 1993,5,157 SRSworkers received atlIeasurable dose ofradiation amounting to263 person-rem
‘E I (Table 3-18) TherefOrethisgrOpmay exPerienceptoO.1 (0.0004 x263) additional cancerdeathdue
to its 19930ccupational radiation exposLlre. Continuing operation of SRScouid result inupto
0.1 additional cancer deatlleacl] year ofoperatioll, assu!nillg future annual worker exposure continuesat
the 1993 level. Inother words, foreacll 10 years ofoperatiotl, tllerecould beoneadditional death from
cancer among tl]ework force tllatreceives a!lleasllrable dose attlle 1993 level.
3.12.3 WORKER NONRADIOLOGICAL SAFETY AND HEALTH
Industrial safety, industrial hygiene, medical monitoring, and fire protection programs have been
‘E I ‘mP1ementedatSRS toensurethenonradiological heakhandsafetyof SRSworkers.
The Occupational Safety and Health Adm inistratioll requires the use of incidence rates to measureTE
worker safety andllealth(DOL 1986). Illcide!lce rates relate thenumber ofinjuries andillnesses and the
3-64
DOEEIS-0217July 199s
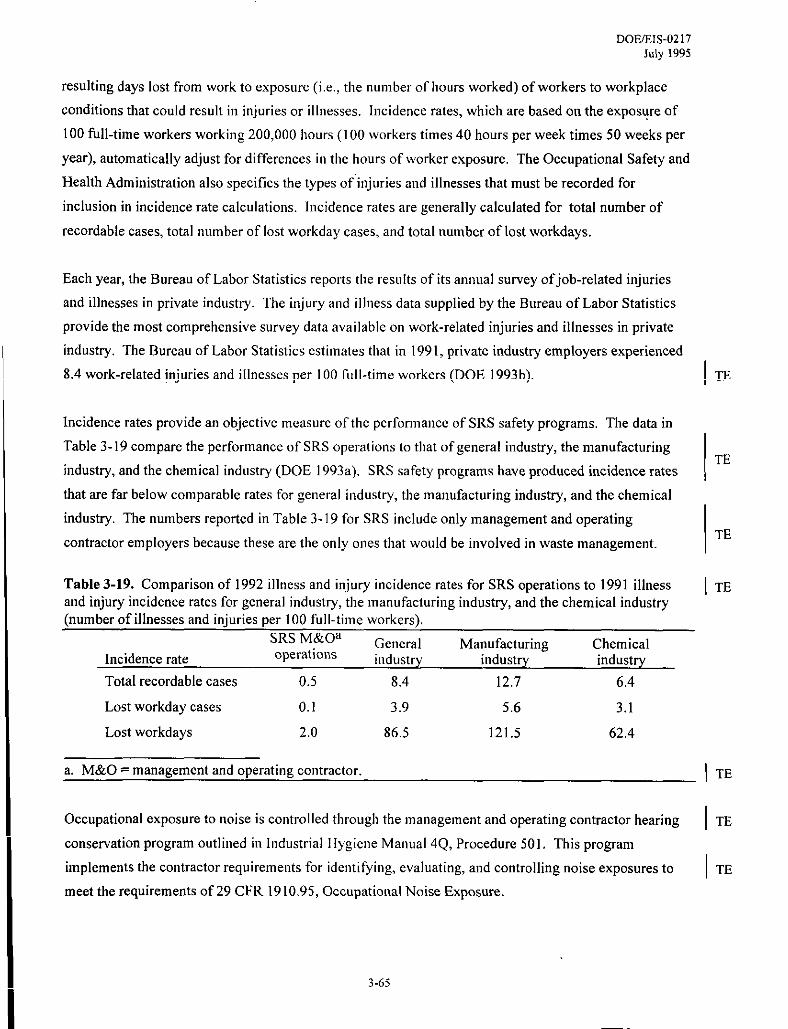
resulting days lost from work to exposure (i e., the nllmber of hours worked) of workers to workplace
conditions that could result in injuries or illnesses. Incidence rates, which are based on the exposure of
100 full-time workers working 200,000 kours ( 100 workers times 40 hours per week times 50 weeks per
year), automatically adjust for differences in the hours of worker exposure, The Occupational Safety and
Health Administration also specifies the types of injuries and illnesses that must be recorded for
inclusion in incidence rate calculations. incidence rates are generally calculated for total number of
recordable cases, total number of lost workday cases, and total number of lost workdays.
Each year, the Bureau of Labor Statistics reports the resll Its of its am~ua] survey of job-related injuries
and illnesses in private industry. The illj ury and iIIness data supplied by the Bureau of Labor Statistics
provide the most comprehensive survey data available on work-related injuries and illnesses in private
industry, Tbe Bureau of Labor Statistics estimates that in 1991, private industry employers experienced
8.4 work-related injuries and illnesses per 100 fttll-time workers (DOE 1993 b).
Incidence rates provide an objective measure of the performance of SRS safety programs, The data in
Table 3-19 compare the performance of SRS operations to that of general industry, the manufacturing
industry, and the chemical industw (DOE 1993a). SRS safety programs have produced incidence rates
that are far below comparable rates for general indllstry, the manufacturing industry, and the chemical
industry. The numbers reported in Table 3-19 for SRS i!lclude only management and operating
contractor employers because these are the only ones that would be involved in waste management.
Table 3-19. Comparison of 1992 illness and injury incidence rates for SRS operations to 1991 illness
and injury incidence rates for general industry, the manufacturing industry, and the chemical indust~(number of illnesses and injuries per 100 full-time workers),
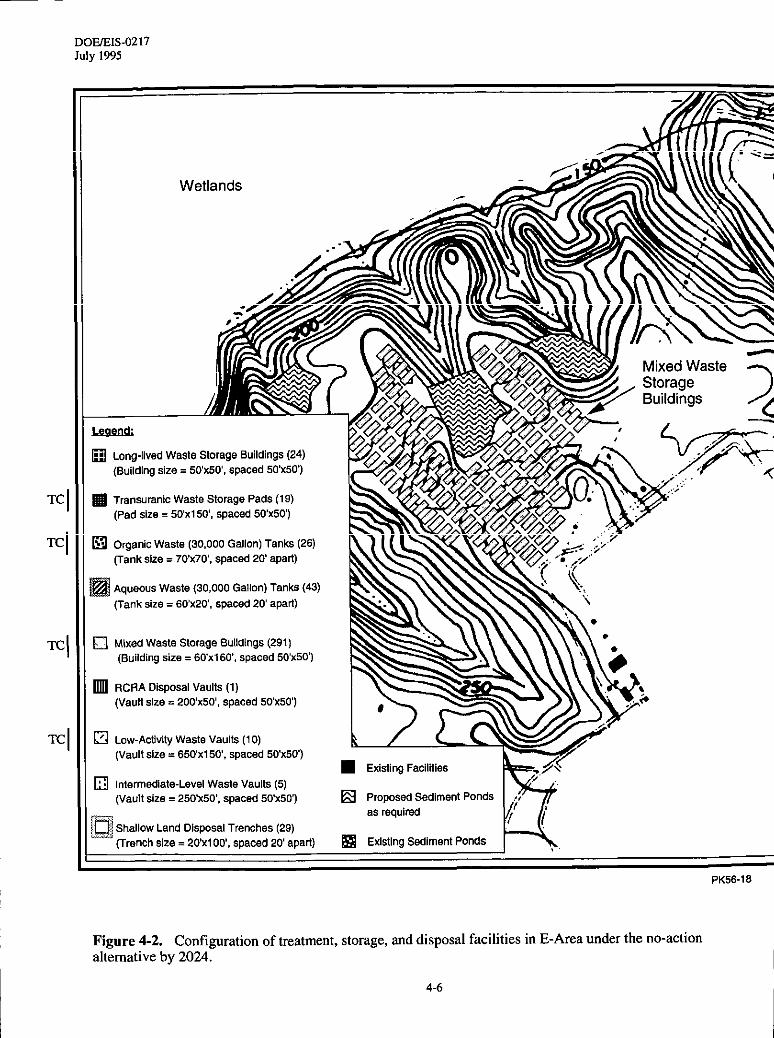
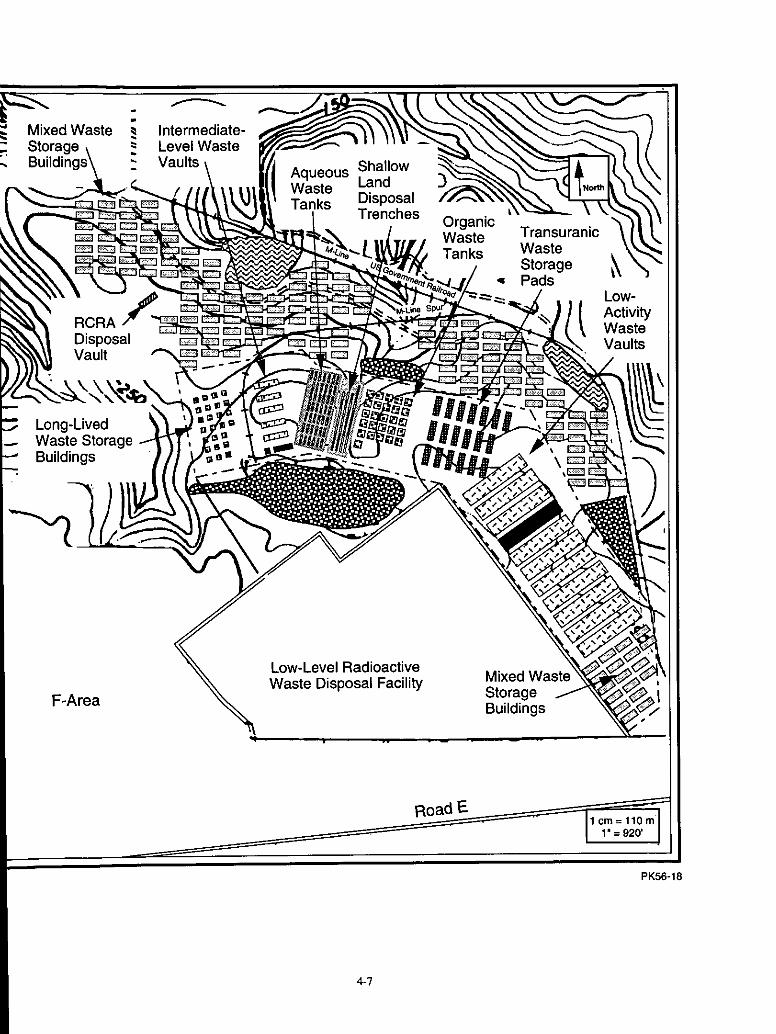
tanks, and 431 I4-cubic-meter (30,000-galIon) aqueous waste tanks in E-Area (see Figure 4-2). These
storage facilities would be designed and constructed to meet regulatory requirements to protect human
health and the environment, including maintenance of zero releases as noted above. The long-lived
waste storage buildings and the transuranic and alpha waste storage pads would include sumps to collect
and contain leaks. Below-grade organic waste tanks would be constructed with secondary containment
and leak detection and Ieachate collection systems, as required by the Resource Conservation and
Recovery Act (RCRA). Neither the low-level waste and transuranic and alpha waste storage facilities
nor the above- and below-grade mixed waste tanks are expected to adversely affect the quality of
groundwater at SRS under nor3nal circumstances.
Because DOE would not intend to release the areas containing these storage facilities to unrestricted
access, the facilities would not be designed to function for extended time intervals without institutional
control and maintenance. Accordingly, no assessment of potential releases from long-term unattended
operation of these facilities and their contents has been performed.
Tbe Defense Waste Processing Facility and the Z-Area Saltstone Facility would operate under the
no-action alternative for this EIS. High-1evel waste stored in the F- and H-Area tank farms would be
gradually removed for vitrification, storage and pemranent disposal. As the high-level waste is removed
4-13
TE I
TE
DoE/E1s-02 I 7July I 995
from the tanks and vitrified, the potential for inadvertent releases to grmrrrdwater would decrease.
Possible effects on groundwater would be minimized with the treatment and ultimate disposal of the
high-level waste. In case Of accidental spills Of salt solution (e.g., from transfer pipes in the tank famrs)
during Defense waste processing Facility operations, the soil would be expected to slow the migration of
contain in ants in the subsurface, and remedial actions would be undertaken to recover as much of the
spilled material as is feasible and to minimize the dispersal of the residual material, The effects on
groundwater of the operation of the Defense Waste Processing Facility and the Saltstone Facility were
presented in the Final Supplemental Environmental Impact Statement Defense Waste Processing
Facility.
M,. EXP, MaxNoAction
A
B
Q
4.1.4c
SURFACE WATER RESOURCES
This section examines the no-action alternative activities (described in Section 2.2) that would produce
wastewater discharges tosurface waters andpresents the potential effects on the environment from both
radiological andnonradiological constituents contained in treated wastewater. Theevaluation of these
consequences is based on Section 4.1.3. Evaluation of these consequences assumed that existing
regulatory limits would continue toapply forthevarious nonradiological constituents. The radiological
criterion used asthebasis forthis evaluation comply with DOE Order 54 OO.5and4OCFR 141, the U.S.
Environmental Protection Agency (EPA) national prima~ drinking water regulations.
Spills orleaks could occur from various tanks andequipment. Sumpsand secondary containment armrnd
tanks andvulnerable equipment would capture andcollect spills orleaks iftheywere to occur. Material
that accumulates in sumps and secondary containment would be sampled to determine if contaminants
were present. Ifcontaminated, thewastewater would retreated intheappropriate treatment facility,
such as tbe F/H-Area Effluent Treatment Facility or the M-Area Dilute Effluent Treatment Facility,
Uncontaminated wastewater would bedischarged viaapemitied outfall tosurface waters. SRShas and
would maintain a best management practices plan, a spill prevention control and countermeasures plan,
andadministrative procedures formonitoring andcleaning upspills topreventthem from reachinga
surface stream.
In construction of the various storage facil ities needed under tbe no-action alternative in E-Area, DOE
would prepare sedimentation and erosion control plans in compliance with state regulations on
stomwater discharges, wbichbecame effective in 1992 aspartofthe Clean Water Act. SRS was issued
4-14
DoE/EIs-02 I 7July 1995
a pemit by SCDHEC (Permit SCR1 00000) that applies to storrnwater runoff during construction
activities. If a project requires disturbing more than 0.02 square kilometer (5 acres) of land, SCDHEC
must approve the sediment and erosion control plan. Facilities or measures taken to control erosion
during the construction phase would be regularly inspected by SCDHEC; the Management and Operating
Contractor’s Environmental Protection Department the U.S. Natural Resources Conservation Service
(formerly the Soil Conservation Service); and the U.S. Forest Sewice to monitor the effectiveness of the
erosion control measures (particularly following a storer). Corrective measures, if needed, would be
taken by DOE, After facilities begin operating, they would be included in the SRS Storrnwa[er Pollution
Prevention Plan, which details the required stormwater control measures and is one of the criteria of the
stormwater general permit issued to SRS by SCDHEC (Pemrit SCROOOOOO)for operating facilities.
Also, as required by the National Pollutant Discharge Elimination System permit, the facilities would be
included in the SRS Best Management Practices Plan,
Studies have been performed to detemrine the effect of stormwater that might infiltrate waste in the
disposal facilities in E-Area and then enter the groundwater. As noted in Section 4.1.3, the incremental
increase in groundwater concentrations of the radionucl ides present in the waste would be small. Most
of the radionuclides would not reach peak concentrations in the river until at least 10,000 years beyond
the present. The tritium would peak in 70 to 237 years at a concentration below 105 picocuries per liter,
which is one billion times below the regulatory limits; iodine-129, selenium-79 and technetium-99 would
peak in 150 to 9,700 years at concentrations below Io-6, 10-6, and 10“4picocuries per Iiter, respective y,
which are also well below regulatory limits (Tnblin 1995). Thus, the impact on tbe Savannah River from
groundwater which reaches the surface and eventually enters the river would be very small.
The M-Area Vendor Treatment Facility (see Appendix B. 15) would not discharge wastewater directly to
a surface stream. However, the wastewater discharged from the scrubber system [an average flow of
approximately 0.5 liter (O.13 gallon) per minute] would be directed to the M-Area Dilute Effluent
Treatment Facility (DOE 1993a), which can adjust the wastewater pH, add alum as a coagulanL settle the
resulting suspended solids, and dewater the solids. Since the wastewater from the scrubber system would
be similar in composition to the wastewater already being treated, the surface water would receive little,
if any, impact from the discharge of this additional treated water. The water resources section in
Appendix E lists the minimum and maximum chemical concentrations found in the effluent from the
M-Area Liquid Effluent Treatment Facility, which includes the Dilute Effluent Treatment Facility
(outfall M-004). The treatment facility has been meeting the discharge criteria. The M-Area Liquid
Effluent Treatment Facility has been processing approximately 53 liters (14 gallons) per minute for the
last several years (Amett 1994), but it is designed to treat 100 liters (26 gallons) per minute. Thus, the
additional flow of 0.5 liter (O.13 gallon) per minute from the M-Area Vendor Treatment Facility would
I ‘rE
TC
TCTE
I TE
I TE
4-15
DoE/E1s-02 I 7July 1995
TE I
TC I
have a very smal I effect on the flOW rate of the water being treated and the effectiveness of the treatment
facility. The treated water would be discharged to Tires Branch via National Pollutant Discharge
Elimination System permitted outfall M-004. A DOE environmental assessment (DOE 1993a)
concluded that water quality and indigenous biota within the receiving stream (Tires Branch) would not
be adversely impacted by this discharge of treated water.
Additional wastewater streams would be treated in existing SRS wastewater treatment facilities. The
M-Area Air Stripper removes volati Ie organic compounds from the groundwater beneath A- and
M-Areas. The air stripper is permitted by SCDHEC to treat 2,270 liters (600 gallons) per minute of
contaminated groundwater and operates at approximately 1,900 liters (500 gallons) per minute. Purge
water containing voiati Ie organic compounds from the monitoring wel Is would be treated by the air
stripper. An additional 2 liters (0.53 gallon) per minute average flow of purge water would be treated by
the air stripper. The operation of the air stripper would not be compromised, and the quality of the
effluent would not change.
Additional wastewater would be sent to the F/H-Area Effluent Treatment Facility, either directly or after
being treated in one of the high-level waste evaporator systems. The F/H-Area Effluent Treatment
Facility has a design flow rate of 1,135 liters (300 gallons) per minute. The projected additional
wastewater stream for the no-action alternative (based on the expected waste forecast) is estimated to be
1.8 liters (O.48 gallon) per minute. There would also be 26 liters (6.9 gallons) per minute of recycle
water from the Defense Waste Processing Facility being sent to the F/H-Area Effluent Treatment
Facility. Thus, the additional flow of wastewater to be treated would he 27.8 liters (7.3 gallons) per
minute. Since the facility processes approximately 1I4 liters (30 gallons) per minute, this additional
flow would be within its design capability, The Final Supplemental Environmental Impact Statement
Dejerrse Waste Processing Facili~ discusses the effects of this wastewater on the treatment processes.
This release, on an annual basis, represents approximately 15 percent of the total dose to the offsite
maximally exposed individual from liquid releases from SRS in 1993. The water resources section in
Appendix E lists the minimum and maximum chemical concentrations which were reported for the F/H-
Area Effluent Treatment Faci Iity outfall (outfall H-O 16) for 1993. The effluent concentrations have been
in compliance with the permit limits. Since the additional wastewater is of similar composition to the
wastewater already being treated by this system, the quality of the effluent from the F/H-Area Effluent
Treatment Facility is not Iikel y to change. The calculated dose of the various radionucl ides is included in
the tables in Appendix E. TWO mdionuclides account for more than 99 percent of the calculated dose:
tritium and cesium-137 together account for 0.0206 millirem of the total dose of 0.0208 millirem to the
offsite maximal Iy exposed individual over the 30-year period (1995 through 2024)., The impact on
Upper Three Runs from radionuclides would be very small.
4-16
DoE/Els-021 7July 1995
The Replacement High-Level Waste Evaporator would eventually replace existing evaporators and
would produce distillate of the same quality as produced by the present evaporators and which would be
treated in the F/H-Area Effluent Treatment Facility. Concentrated waste from the evaporator would be
sent to the Defense Waste Processing Facility (WSRC 1994b). Operation of the replacement evaporator TE
would not change the quality of the wastewater discharges, The wastewater flow would be
approximately the same because the older evaporators would be retired.
Min. EXP.MaxN.Action
A
B
m
4.1.5 AIR RESOURCESc
The no-action alternative would result in additional nonradiological and radiological emissions from
SRS. In both cases, the resulting incremental increase in air concentrations at and beyond the SRS
bomrda~ would be very small compared to existing concentrations at and beyond the SRS boundary. I TE
Operations under the no-action alternative would not exceed state or Federal air quality standards.
4.1.5.1 co nstruction
Potential impacts to air quality from construction activities under the no-action alternative would include
fugitive dust and emissions from construction equipment. Fugitive dust results from soil transportation
activities, moving and maintenance of soil piles, and clearing and excavation of soil, Approximately
182,500 cubic meters (239,000 cubic yards) of soil would be displaced in E-Area for the construction of
the treatment, storage, and disposal facilities listed in Section 2.2.7.
The amount of fugitive dust produced was assumed to be proportional to the land area disturbed.
Amounts of fugitive dust for the no-action alternative were calculated from the estimated annual average
amount of soil excavated during construction activities over the 30-year analysis period. Fugitive soil
emissions are based on U.S. Environmental Protection Agency (EPA) AP-42 emission factors and the
number of cubic meters of soil excavated (EPA 1985; Hess 1994a). Maximum downwind concentrations
at the SRS boundary for total suspended particulate and particulate matter less than 10 microns in
diameter were calculated using EPA’s TSCREEN model (EPA 1988).
Exhaust emissions from construction equipment were calculated from estimates of the types and number
of earth-moving equipment required and from EPA AP-42 emission factors. Maximum downwind
4-17
DoE/EIs-02 I7July 1995
: the SRS boundary were calculated using EPA’s TSCREEN modelconcentrations for criteria
(EPA 1988).
pollutants al
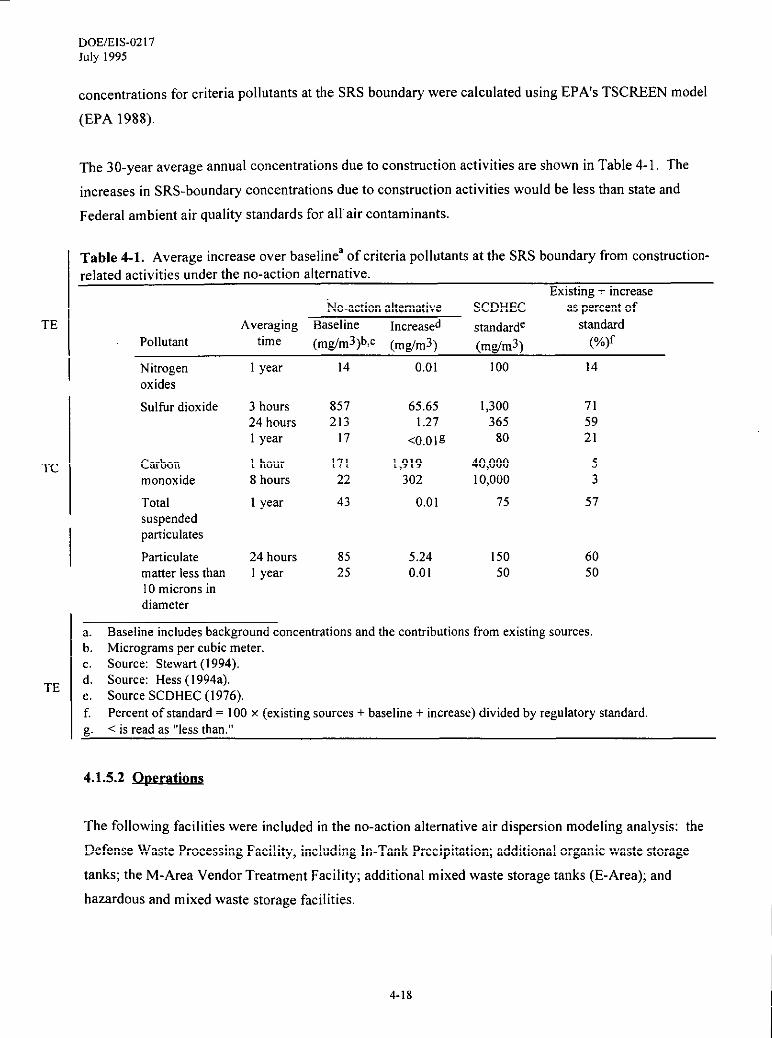
The 30-year average annual concentrations due to construction activities are shown in Table 4-1. The
increases in SRS-boundary concentrations due to construction activities would be less than state and
Federal ambient air quality standards for all air contaminants.
Table 4-1. Average increase over baseline’ of criteria pollutants at the SRS boundary from construction-related activities under the no-action alternative.
Existing + increase
TE
TC
TE
No-action alternative SCDHEC as p;rcent of
Averaging Baseline Increased standarde standard
Pollutant time (mg/m3)b,c (m~m3) (m#m3) (%)f
Nitrogen
oxides
Sulfur dioxide
1 year 14 0.01 100 14
3 hours24 hoursI year
857213
17
65.651,27
<0.olg
1>919302
0.01
1,300365
80
715921
Carbonmonoxide
Totalsuspendedparticulate
Particulatematter less thanIOmicrons indiameter
1 hour8 hours
17122
40,000I0,000
53
1 year 43 75 57
24 hours1 year
8525
5.240.01
15050
6050
a. Baseline includes background concentrations and the contributions from existing sources.b. Micrograms per cubic meter,c. Source: Stewart (1994).d. Source: Hess (1994a).e. Source SCDHEC (1976).f. Percent of standard = 100 x (existing sources+ baseline+ increase) divided by regulatory standard.g. < is read as “less than.”
4.1.5.2 @rations
The following facilities were included in the no-action alternative air dispersion modeling analysis: the
tanks; the M-Area Vendor Treatment Facility; additional mixed waste storage tanks (E-Area); and
hazardous and mixed waste storage facilities.
4-18
DoE/EIs-021 7July 1995
Air emissions from disposal vaults in E-Area are very small because solvents and solvent-contaminated
rags are not disposed of in the vaults. Solvents and solvent-contaminated rags are stored in drums, with
pressure relief valves that release with pressures greater than 280 grams per square centimeter (4 pounds
per square inch), located in the hazardous waste and mixed waste storage buildings, Emissions are very ~E
small under routine operating conditions because pressure changes greater than 280 grams per square
centimeter (4 pounds per square inch) would occur only during emergency conditions, such as a fire.
To determine which facility source terms should be revised to accurately reflect the structure of
operations of the no-action alternative, a thorough review of facilities was performed, The following
summarizes facility source terms that were not changed and the rationale for not modifying them,
Changes in impacts to maximum boundary-line concentrations would not be expected to result from the
continued operation of the F- and H-Area evaporators, the FiH-Area Effluent Treatment Facility, the lead
melter, solvent reclamation units, the silver recovery unit, the Organic Waste Storage Tank, Savannah
River Technology Center ion exchange process, the low-level waste compactors, or the M-Area Air
Stripper, because these facilities are currently operating. Additional organic emissions from the M-Area
Air Stripper due to the treatment of investigation-derived waste from groundwater monitoring well
operations would be less than 13 kilograms (29 pounds) per yea~ the incremental contribution to
maximum boundary-line concentrations would be very small [less than 0.005 micrograms per cubic
meter, based on TSCREEN modeling and Hess ( 1995a)]. Additional organic emissions from the
F/H-Area Effluent Treatment Facility would be 2.7 kilograms (6 pounds) per yeaq the incremental TC
impact would he very small (Hess 1994b),
4.1.5.2.1 Nonradiological Air Emissions Impacts
Table 4-2 shows maximum ground-level concentrations at the SRS boundary for nonradiological air
polhrtants emitted under the no-action alternative. Air dispersion modeling was perfomed with
calculated emission rates for facilities not yet operating and actual 1990 emission levels for facilities
currently operating (Stewart 1994). For proposed facilities for which permit limits have not yet been
established, emissions were estimated based on operational processes (see Appendix B) and data
obtained from similar activities at SRS and other waste management facilities. The dispersion
calculations for criteria pollutants were performed with 1991 meteorological data from H-Area. DOE
used periods ranging from 1 hour to 1 year to model criteria pollutant concentrations, which correspond
to the averaging periods found in South Carolina’s “Ambient Air Quality Standards” (SCDHEC 1976).
I TC
4-19
DoE/Els-02 I7July 1995
ITable 4-2. Changes in maximum ground-level concentrations of criteria pollutants at the SRS boundaryfrom operation activities under the no-action alternative.
I ExistingExisting +
Regulatory Background Increase in background +
TC Averaging sources standards concentration concentration increase as percent
‘b I Poli”tant time (p/m3)a,b (p/m3)c (~/m3)d (y/m3) of standard (“A)e
Nitrogen oxides 1 year 6 100 8 0.11 ldf
Sulfur dioxide 3 hour24 hour1 year
823196
14
17122
13
513
4X1O-4
210.40. I
I300365
80
34173
15.362.80.08
675921
I Carbon monoxide 1 hour8 hour
NA8NA
24.24.03
0.50.3I0;000
75Total suspended 1 yew
TC parriculates
30 2.02 60
I Paniculate matter 24 hour< 10 microns in I yeardiameter
15050
3422
5.200.13
6050
Lead 3 months I.5 0.o1 I o 0.8
Gaseous fluorides 12 hour(as hydrngen 24 hourflunride) I week
3.72,91,6
0.8
NANANANA
0.0019
9XI0-4
3.5XI0-4
9XI0-5
543525131 month
a.b.c,d.
TE I e.
Micrograms per cubic meter.Source: Stewart (1994).Source: SCDHEC ( 1976).Source: SCDHEC ( 1992).Percent of standard’= 100 x (existing sources+ background+ increase in concentration) divided by regulato~standard,For example, 6 + 8 +0, I I divided by 100 would equal 14.11 percent, rounded to the nearest whole number,14 percent.
f.
NA = not applicable.g.—
Maximum ground-level concentrations for nonradiological air pollutants were determined from the
Industrial Source Complex Version 2 Dispersion Model using maximum potential emissions from all the
facilities proposed in the no-action alternative (Stewart 1994). The calculations for the dispersion of
carcinogenic toxic substances were performed with 199 I meteorological data from H-Area. Modeled air
toxic concentrations for carcinogens were based on an annual averaging period and are presented in
Section 4.1.12.2,2. To get a 30-year exposure period, annual averages were calculated by adding all
emissions occurring in an annual period, and then proportioning the emissions on a unit-time basis
(e.g., grams per second). Under the no-action alternative, emissions of noncarcinogenic air toxics are
very small. Maximum boundary-line concentrations for all SCDHEC air toxics are very small and are
below SCDHEC regulato~ standards. They are presented in the SCDHEC Regulation No. 62.5 Srandard
4-20
DoE/EIs-02 17July 1995
No. 2 and Standard No. 8 Compliance Modeling Report Input/Output Data (WSRC 1993b) and in
Section 3,5 of this EIS.
4.1.5.2.2 Radiological Air Emissions Impacts
Offsite maximally exposed individual and population doses are presented for atmospheric releases
resulting from routine operations under the no-action alternative. The largest sources of radionuclides
would be from activities at the transuranic and alpha waste storage pads, the F- and H-Area tank farms,
M-Area Vendor Treatment Facility, and the F/H-Area Effluent Treatment Facility.
SRS-specific computer models MAXIGASP and POPGASP (Hamby 1992) were used to determine the
maximum individual dose at the SRS bounda~ and the 80-kilometer (50-mile) population dose,
respectively, resulting from routine atmospheric releases. See Appendix E for detailed facility-specific
isotopic and dose data,
Table 4-3 shows the doses to the offsite maximally exposed individual and the population as a
consequence of the normal radiological emissions from the no-action alternative activities. The
calculated incremental committed effective annual dose equivalent to the hypothetical offsite maximally
exposed individual would be 1.2x 10⁻⁴ millirem [doses were calculated using dose factors provided by
Simpkins (1994a)], which is well within the annual dose limit of 10 millirem for SRS atmospheric
releases. In comparison, an individual living near SRS receives a dose of 0,25 millirem from all current
releases of radioactivity at SRS (Amett 1994).
Table 4-3. Annual radiological doses to individuals and the population within 80 kilometers (50 miles)
of SRS from atmospheric releases under the no-action altemative,a
Offsite maximally
exposed individual Population
Release Dose DosePathway (millirem) (verson-rem)
LO04-13
LO04-13
TE
Atmospheric 1.2 X10⁻⁴ 2.9x I0-4 I TC
a. Source: Simpkins (1994a). I TE
The annual incremental dose to the population within 80 kilometers (50 mi Ies) of SRS from the no-action
alternative would be 2,9x 10⁻⁴ person-rem. In comparison, the collective dose received from natural
sources of radiation is approximately 1.95x 10⁵ person-rem (Amett, Karapatakis, Mamatey 1994),
Sections 4.1.12.1 and 4.1.12.2 describe the potential health effects of these releases on the workers and
public, respectively.
4-2 I
DOEIEIS-02I7July 1995
Min. EXP. Max.NoAcfi.n
A
B
Q
4.1.6 ECOLOGICAL RESOURCES
c
Under the no-action alternative, disturbed areas would be cleared and graded to build new waste storage
TE Iand disposal facilities. (Areas aregiven inacres; toconveti tosquare kilometers, multiply by O.OO4O47.)
TC Approximately 160 acres of the following types of woodlands would be cleared and graded by 2024:
Impacts were evaluated onthebasis ofvisibili& ofnewfacilities from offsite. Under the no-action
alternative, the facilities DOE plans to construct in E-Area would not adversely affect scenic resources or
aesthetics. E-Area isalready dedicated to industrial use. Newconstmction would not bevisibleoff SRS
or from public access roads on SRS. Thenewfacilities would notproduce emissions to the atmosphere
that would be visible or that would indirectly reduce visibility,
B
w
4.1.11 TRAFFIC AND TRANSPORTATIONc
DOE analyzed impacts under each alternative that would result from changes in daily commuter and
truck traffic. Traffic impacts are expressed as increases in vehicles per hour and in the number of
hazardous and radioactive waste shipments by truck. As a road’s carrying capacity is approached, the
likelihood of traffic accidents increases. Similarly, the more truck shipments on a given road, the
greater the probability of a traffic accident involving a truck, Increases in either condition could cause
an increase in traffic fatalities,
DOE also evaluated the impacts that transportation of low-level, mixed, transuranic, and hazardous
wastes would have on individuals located onsite and offsite, These impacts were determined by the
TE I calculatiOnOfdOse andexpressedashealth effects (i.e,thenumberO fexcessfatalca"cersresultingfrom
exposure to radioactive waste shipments). High-level waste was excluded from the analyses because it is
not transported by vehicle.
Impacts from incident-free (normal) transport and postulated transportation accidents involving onsite
shipment of radioactive waste over 30 years were calculated for the no-action alternative. Offsite
transportation impacts were also calculated. The only traffic increases considered were from
construction workers traveling to and from the site,
4-34
DoE/EIs-02 I 7July 1995
4.1.11.1 m
Vehicle counts were estimated from current and projected levels of SRS employment (Turner 1994) and
waste shipments. The baseline number of vehicles per hour was estimated from values in Smith (1989)
and Swygert ( 1994). Table 4-5 shows estimated peak vehicles per hour for representative on site and
offsite roads. The table also shows the design carrying capacity for the roads (vehicles per hour) and the
percentage of this design carrying capacity that the expected traffic represents. Vehicles per hour on
offsite roads represent daily maximum values, while vehicles per hour onsite represent peak morning
traffic. For the no-action alternative, the year when the most people would be employed was used to
determine the change from the baseline. These traffic analyses conservatively assume that each worker
drives a vehicle and arrives at E-Area during the peak commuter traffic hour.
Table 4-5. Number of vehicles per hour during peak hours under the no-action alternative.
Design capacity 1994 baseline traffica No-action alternative change(vehicles per (percentage of design (percentage of design
Road hour) capac ity)b capacity)c
Offsite
Sc 19 3,000d 2,800d(93) 21 (94)
SC 125 3,200d 2,700d(84) 20(85)
Sc 57 2,100d 7ooe(33) 6(34)
Onsite
TC
a.
b.c.
d.e.
f,
gh,
Road Eat E-Area 2,300e 741 f>g(32) 47h(34) 1:Vehicles per hour baseline traffic for 1994 was estimated from actual counts measured in 1989(offsite) and 1992/1993 (onsite) (Smith 1989) by adjusting vehicle counts by the change in SRSemployment be~een measured years and 1994.
Numbers in parentheses indicate percentage of carrying capacity.Percentage of design capacity changed between the draft and final EIS because the manpowernumbers are based on construction costs which were modified after the draft was issued to better
reflect actual costs.Adapted from Smith (1989).Adapted from TRB (1985).
Source: Swygert ( I994).Morning traffic traveling to E-Area.
Maximum number of construction workers (Hess 1995a, b). I TE
For the no-action alternative, the roads’ carrying capacities would not be exceeded by the workforce
increase of 47 vehicles per hour. DOE would not expect adverse impacts from traffic associated with the I TC
no-action alternative.
4-35
DoE/EIs-02 I 7July 1995
TEI
TE
TC
TE
TE
TC
Impacts of daily truck traffic associated with onsite shipments of hazardous and radioactive waste were
analyzed for the no-action alternative. These shipments, presented in Table 4-6, are assumed to occur
during normal working hours (versus cOmmuter hours), and therefore, would have very little effect on
the roadway carrying capacity. Hazardous waste shipments include shipments from accumulation areas
to the RCRA-permitted storage buildings and from the storage buildings to offsite treatment and disposal
facilities, Shipments of radioactive waste include those from the generators to the treatment, storage, or
disposal facilities.
Table 4-6. Projected SRS hazardous and radioactive waste shipments by tmck.a
No-action alternative
Waste Type Destination Total Shipments (1994 baseline traffic)b
Hazardous Onsite/Offsite 101,437 14
Low-level On site 1,559 7
Mixed Onsite/Offsite 58,349 8
Transuranicc Onsite 3,790 1
Total Shipments per day 30
a, To arrive at shipments per day, the total number of waste shipments estimated for the 30 years
considered in this EIS was divided by 30 to determine estimated shipments per year, These numberswere divided by 250, which represents working days in a calendar year, to determine shipments perday.
b. Shipments per day. 1994 baseline traffic is assumed to equal the no-action alternative usingexpected waste volumes,
c, Includes mixed and nonmixed transuranic waste shipments,
Under tbe no-action alternative, daily truck shipments would be the same as for tbe baseline. This
assumption was based on transportation data (Hess 1994c) developed from historical shipping
configurations for each \vaste. Baseline waste volumes were estimated from the 30-year expected waste
forecast. DOE expects that impacts from waste shipments under the no-action alternative would be the
same as for baseline waste management activities. Numbers of shipments assumed under the no-action
alternative aregiven in Tables E,3-1 through E,3-3,
[n 1992, South Carolina had a highway fatality rate of 2,3 per 100 million miles driven (SCDOT 1992),
At this rate, an estimated 5.5 fatalities would be expected to occur annually within the commuter
population for the baseline case based on a 40-mile round-trip commute 250 times a year (see
Section 3.11,2.1). Fortheno-action alternative, anadditional 47workers would beexpected to drive an
additional one-half million miles per year, which ispredicted to result in Iessthan one additional traffic
fatality.
4-36
DoE/EIs-02 17July 1995
The occurrence of highway injuries and prompt fatalities for truck accidents can be estimated from data
reported by the National Highway Safety Council (DOT 1982), Injuries occur in 24 percent of all single
truck accidents. The estimated injury- and fatality-causing accident rates are 3.2x 10⁻⁷ and 1,2x 10⁻⁷ per
mile traveled, respectively.
Trucks carrying hazardous waste have an accident rate of 1.4x 10⁻⁶ accidents per mile traveled for all
road types. An estimated 20 percent of these truck accidents will result in a release of hazardous
materials (EPA 1984).
Based on these statistics, an analysis (Rollins 1995) was pcrfomed to determine impacts from shipments
of hazardous and radioactive materials for the 30-year period of interest for this EIS, For the no-action
alternative, 7,200 annual (onsite and offsite) hazardous and radioactive waste shipments would travel TC
approximately 600,000 miles and would result in slightly less than 1 accident with 0.074 prompt fatality. TE
Accidents involving the release of hazardous material would be expected to occur, on average, once in 6
years.
The analysis determined that the largest impacts would occur for alternative B – maximum waste
forecast. For this case, 22,000 annual (onsite and offsite) hazardous and radioactive waste shipments
would travel approximately 1.9 million miles, leading to an expectation of less than 3 accidents with 0.23
prompt fatality, Accidents involving the release of hazardous material would be expected to occur, on
average, once in 4 years. Impacts for all other alternatives and waste forecasts would be lower. These
impacts are considered very small and are not discussed further in this EIS.
4.1.11.2 Transportation
DOE used tbe RADTRAN (Neuhauser and Kanipe 1992) computer codes to model the transportation of
radioactive materials. These computer codes were configured with applicable SRS demographics and
transportation accident rates (HNUS 1995a). The parameters for the RADTRAN analysis include the
package dose rate, the number of packages per shipment, the number of shipments, the distance traveled,
the fraction of travel in rural, suburban, and (for offsite transportation) urban population zones, traffic
counts, travel speed, and type of highway traveled. Transpofi of radioactive material within a particular
facility was excluded from this assessment because it involves operational transfers that are not defined
as transportation and that would be included in facility accidents (e.g., Section 4.1. 13). A more detailed
breakdown of the transportation analysis by waste type is provided in Appendix E. Other model
assumptions and input parameters are described in HNUS (1995a).
TC
TE
TE
4-37
TE I
TE I
DoE/E1s-021 7July I 995
DOE analyzed the impacts that transportation of low-level, mixed, transuranic, and hazardous wastes
would have on individuals located onsite and offsite. Doses from incident-free (normal) transport of
waste over 30 years and from postulated transportation accidents involving radioactive waste were
calculated for each alternative. Finally, health effects, expressed as the number of excess latent cancer
fatalities associated with tbe estimated doses, were calculated by multiplying the resultant occupational
and general public doses by the risk factors of 0.0004 (for occupational health) and 0.0005 (for the
general public) excess latent cancer fatalities per person-rem (ICRP 1991 ). For individuals, the
calculated value represents the additional probability of developing a latent fatal cancer.
The AXAIR89Q (Hess 1995c) computer code uses SRS-specific meteorological data to model releases
offsite from postulated onsite accidents. AXAIR89Q conservatively calculates the offsite individual and
population doses because it uses very conservative air quality parameters (99.5 percent of the time the
actual meteorology at SRS is less severe than that used by the model). For the transportation analyses,
seven hypothetical human receptor groups were identified:
Uninvolved worker: The SRS employee who is not assigned to the transportation activity but is
located along tbe normal transportation route at an assumed distance of 30 meters (98 feet) and
would be exposed to radiation from the normal transport shipment. Doses are repofied in units of
rem,
Uninvolved workers: The collective SRS employee population not assigned to the transportation
activity that would receive external or internal radiation exposure from normal onsite shipments
and accidents. About 7,000 SRS employees would be exposed to routine shipments and as many
as 6,OOOcould be exposed to radiation in the event of an accident. Doses are reported in units of
person-rem,
Involved workers: The collective SRS employee population assigned to the transportation activity
(i.e., twO transpOfi crew and six package handlers per shipment) that would receive external
radiation exposure from normal transport of shipments. These workers are allowed to receive a
greater radiation dose than the general public. Doses are reported in units of person-rem,
Offsite maximally exposed individual: The member of the public located at the point along the
SRS bounda~ that receives the highest ground-level radioactive material concentration and who
would receive external or internal radiation exposure from an onsite transportation accident.
Doses are reported in units of rem,
4-38
.
.
DOE/EIS-0217July 1995
Offsite population: The members of the public in the compass sector most likely to experience
the maximum collective dose due to radioactive material released from an onsite transportation
accident. Approximate y 182,000 people are considered part of the offsite population. Doses are
reported in units of person-rem.
Remote maximally exposed individual: The member of the public located along the offsite
transportation route who would receive radiation exposure from normal transport. Doses are
reported in units of rem.
Remote population: Members of the public (as many as 1,837 people per square kilometer) along
the offsite transportation route who would receive external or internal radiation exposure from
nornral shipments and accidents. Members of the remote population who would be exposed to
incident-free shipments by rail number about 200,000, and about 130,000 for truck shipments. As
many as 3 million people have the potential to be exposed to offsite accidents involving the
transport of radioactive wastes.
4.1.11.2.1 Incident-Free Radiological Impacts
The magnitude of incident-free impacts depends on the dose rate at the surface of the transport vehicle,
the exposure time, and the number of people exposed. Radiological consequences of incident-free
transport would result from external exposure to radiation by the vehicle crew and package handlers and
by the uninvolved workers along the transportation route (including those in vehicles sharing the route at
the time of transport). For each waste and package @pe, external dose rates at 1 meter (3,3 feet) from the
transport vehicle were calculated and used to calculate incident-free consequences to onsite receptors
(HNUS 1995a). Duration of exposure depends on the speed of the transport vehicle and the distance it
travels. Additionally, occupational exposure time depends on the number of shipments and how long it
takes to load each transport vehicle.
Annual incident-free doses for the no-action alternative are shown in Table 4-7. The uninvolved worker
dose represents the maximum annual exposure from each waste type (shown in Appendix E). Using
conservative assumptions, involved workers would experience the highest doses because they would be
closest to the waste. Of the waste types handled by these workers, low-level waste would deliver the
highest dose due to the types of radionuclides present.
TC
TE
ITE
4-39
DoE/EIs-02 17July 1995
TCTE
TE
Table 4-7. Annual dose and associated excess latent cancer fatalities from incident-free onsite transportof radioactive material under the no-action alternative.
I cancer fatalities 4,5xlo-6f 8.4x 10⁻⁴g 0.060g—a.
e.f.
&
See Appendix E for a list of waste streams which makeup each waste type. Dose is based onexposure to all waste streams of a particular waste type.See Section 4.1.11.2 for descriptions of the receptors.Totals are rounded to two significant figures.
Assumes the same individual has maximum exposure to each waste stream (Appendix E) for a singleyear.Dose from 1 year of exposure to incident-free transportation of all waste streams (see Appendix E).
Represents additional probability of an excess latent cancer fatality.Values equal the total dose x the risk factor (0.0004 excess latent fatal cancers per person-rem),
The concepts of fractions of fatalities may be applied to estimate the effects of exposing a population to
radiation, For example, in a population of 100,000 people exposed only to background radiation
(0.3 rem per year), 15 latent cancer fatalities per year would be inferred to be caused by the radiation
(I 00,000 persons x 0.3 rem per year x 0.0005 latent cancer fatalities per person-rem = 15 latent cancer
fatalities per year).
Sometimes calculations of the number of latent cancer fatalities associated with radiation exposure do
not yield whole numbers, and, especially in environmental applications, may yieId numbers less than 1.0.
For example, if a population of 100,000 were exposed as above, but to a total dose of only 0.001 rem, the
collective dose would be 100 person-rem, and the corresponding estimated number of latent cancer
fatalities would be 0.05 ( 100,000 persons x 0.001 rem x 0.0005 latent cancer fatalities per person-rem
= 0.05 latent fatal cancers).
In this instance, 0,05 is the average number of deaths that would result if the same exposure situation
TE I were appliedtOmanydiffere”tgro”psof 100,000 people. Inmostgroups,no cme(Opeople)wmddin cur
a latent cancer fatality from the 0.001 rem dose each member would have received. In a small fraction of
the groups, I latent fatal cancer would result; in exceptionally few groups, 2 or more latent fatal cancers
would occur. The average number of deaths over all of the groups would be 0,05 latent fatal cancers
fjust as the average of O, 0,0, and 1 is 1/4, or 0.25). The most likely outcome is O latent cancer fatalities.
How great the consequences of an accident are depends on the amount of radioactive contamination to
which the individual(s) are exposed, how long they are exposed, and the number of people exposed.
DOE considered both the consequence and probability of vehicle accidents in the transportation impacts
model, The joint probability of a given severity of accident occurring for each type of waste shipped was
calculated based on the probability of a range of impact forces that a package could receive in a
hypothetical accident (NRC 1977), vehicle accident rates, and number of miles traveled. The severity of
an accident is determined by the amount of damage tn the package and subsequent release of material.
Joint probabilities of a given accident severity greater than approximately 1x10⁻⁷ were selected forTE
further analysis to determine the magnitude of accident consequences. Dispersion of radioactive
material from the damaged package, combined with assumed release fractions, the fraction of released
material that becomes airborne, and the fraction of airborne material that is of a size capable of being
breathed in, is modeled to calculate the amount of radioactive contamination to which the individuals(s)
are exposed. Generally, the requirements for package integrity and transport vehicles for onsite waste
shipments are not as stringent as for transportation on public highways where package and vehicle
requirements are regulated by the Department nf Transportation and the Nuclear Regulatory
Commission. Consequently, impacts from onsite accidents would be much greater than those for offsite
accidents, because it is assumed that larger fractions nf material would be released in an onsite accident.
Accident probabilities are best understood by assuming that many trips occur for a given type of
transportation event (i.e., shipping low-level waste to an offsite facility). The number of trips when an
accident occurs for a given number of trips is the accident probability. For example, if on a single trip,
there was an accident, the probability of having an accident would be 1. If there was a second trip
without an accident, the number of trips with accidents which occurred nverall ( 1 out of 2 possible)
would bc one-half (0.5). However, since the number of accidents can only be whole numbers (i e., it is
impossible to have half an accident), the probability of having an accident is now I out of 2 trips, or 0.5,
or 50 percent probability, Note that the probability is a unitless number.
Over the 30-year analysis period, for all accidents resulting in any consequence, the total probability of
an accident involving low-level waste would be 0.49; from mixed waste, it would be 0.52; and from
transuranic waste, it would be 0.038. The most probable accidents would not result in a dose because TC
radioactive material would not be released. Table 4-8 presents the consequences to both onsite and
offsite receptors from high consequence (low probability) postulated accidents. The results indicate that
the highest consequences would result from accidents involving the release of transuranic waste and
occur through inhalation of high-energy alpha pafiicles associated with transuranic mrclides.
4-41
TC
TC
TETC
TE
DoE/EIs-02 17July 1995
Table 4-8. Annual accident probabilities, doses associated with thOse accidents, and associated excesslatent cancer fatalities from high consequence (low probability) accidents involving the transport ofradioactive materials under the no-action alternative.
Dose
Uninvolved workersa Offsite population Offsite MEIb
Annual Dose Excess Dose Excess latent Excess latentaccident (persOn- Iatent cancer (persOn- cancer Dose cancer
Waste type probability rem) fatalities rem) fatalities (rem) probability
a. See Section 4.1.11.2 for descriptions of the receptors.b. MEI = maximally exposed individual.c. Excess latent cancer fatalities= risk factor (0.0004 excess latent fatal cancers per person-rem for uninvolved
workers and 0.0005 per person-rem for tbe offsite population) x total dose.d. Additional nrobabilitv of an excess fatal cancer.
The greatest consequence from postulated transportation accidents involving radioactive materials would
be to the uninvolved workers (with an estimated 120 latent cancer fatalities; Table 4-8) as the result of an
accident in which it is assumed that all of the conservatively estimated transuranic nuclides in a
transuranic waste container would be released over an area of about 3 square kilometers (1.1 square
miles) in a single transportation accident. The number of cancers would be highest for the uninvolved
workers due to the larger number of people that would be exposed and the greater amount of radioactive
material to which they would potentially be exposed. Over the 30-year analysis period, the probability
that an accident of this consequence would occur is 1,44x 10⁻⁶.
Since the actions evaluated in this EIS do not introduce new dispersible, nonradioactive, hazardous
materials to the SRS transportation system, DOE reviewed the results of prior transportation accident
analyses (WSRC 1991 c, 1992b) for applicability to the waste management alternatives. These analyses
were based on the facilities, equipment, and operations representative of SRS conditions between 1982
and mid- 1985, when SRS’S them ical inventory and the movement of chemicals were at their peak,
Because the actions evaluated in this EIS involve the shipment of hazardous waste (rather than hazardous
materials whose concentrations are generally much larger) and current and future site chemical
inventories would be less than those previously analyzed (WSRC 1992b), this prior conclusion that there
would be very small onsite and offsite impacts from onsite shipments of hazardous waste remains valid.
This conclusion is fufiher supported by recent analysis (see Section 4.1, 11.1) which determined that
4-42
DOE/EIS-0217July 1995
accidents resulting in the release of hazardous material would occur, on average, only once in 6 years for
the no-action alternative, This analysis also predicted that for the scenario with the largest impacts
(alternative B - maximum waste forecast), accidents resulting in the release of hazardous material would
occur, on average, only once in 4 years. Based on the waste forecasts (Appendix A) over the next
30 years, most hazardous waste shipments (91 percent) are expected to be soil and debris. These wastes
do not contain high concentrations of toxic materials, and accidental release of these solid materials
would nnt lead to an explosion har.ard or atmospheric release of dangerous chemicals, Accident
consequences are therefore expected to be localized and result in minimal impacts to human health or the
environment. These impacts are considered very small and are nnt discussed further in this document.
4.1.11.3 h
As discussed in Section 3.11.3, studies have cnncluded that, because of the remote locations of the SRS
operational areas, no known conditions are associated with existing onsite noise sources that adversely
affect offsite individuals @US 1991; DOE 1990, 1991, 1993b). Since the vast majority of waste
management activities occur onsite, adverse impacts due to noise are not expected for any of the
alternatives or waste forecasts. Thus, noise impacts are not discussed further in this EIS.
Min. EXP, Max.NoAction
A m4.1.12 OCCUPATIONAL AND PUBLIC HEALTHB
c
This section discusses the radiological and nonradiological exposures due to normal operations under the
no-action alternative andsubsequent impacts tothepublic and workers. This analysis, further discussed
in Section 4.1.12.1.1, shows that the health effects (specifically latent cancer fatalities) associated with
the no-action alternative are themselves small and are small relative to those normally expected in the
worker and regional area population groups from other causes.
Theprincipal potential human health effect from exposure tolowlevels ofradiation is cancer. Human
TC
I
I TE
health effects from exposure to chemicals maybe toxic effects (e.g., nervnus system disorders) or cancer,
Fnr the purpose of this analysis, radiological carcinogenic effects are expressed as the number of fatal
cancers for populations and the maximum probability of death nf a maximally exposed individual.
Nonradiological carcinogenic effects are expressed as the total number of fatal and non-fatal cancers.
4-43
TC
DoE/EIs-021 7July 1995
In addition to latent cancer fatalities, other health effects could result from environmental and
occupational exposures tO radiation. These effects include nonfatal cancers among the exposed
population and genetic effects in subsequent generations. To enable comparisons with fatal cancer risk,
the International Commission of Radiological protection (ICRP 199 I ) suggested use of detriment
weighting factors which take into consideration the curability rate of non-fatal cancers and the reduced
quality of life associated with non-fatal cancer and heredity effect. The commission recommended
probability coefficients (risk factors) for the general public of 0.0001 per person-rem for non-fatal
cancers and 0.00013 per person-rem for hereditary effects. Both of these values are approximately a
factor of four lower than the risk factors for fatal cancer. Therefore, this EIS presents estimated effects
of radiation only in terms of latent cancer fatalities, because that is the major health effect from exposure
to radiation.
For nonradiological health effects, risks are estimated as the incremental probability of an individual
developing cancer (either fatal or nonfatal) over a lifetime as a result of exposure to the potential
carcinogen. The overall potential for cancer posed by exposure to multiple chemicals is calculated by
summing the chemical-specific cancer risks to give a total individual lifetime cancer risk.
For radiological emissions from facilities considered under the no-action alternative, the largest
occupational and public health effects were projected from the following facilities: ( 1) for involved
workers, the transuranic and alpha waste storage pads and the F- and H-Area (high-level waste) tank
farm> (2) for the public and uninvolved workers, the M-Area Vendor Treatment Facility; and (3) for the
public only, the F/H-Area Effluent Treatment Facility. To simpli~ the calculation, 30-year process
volumes were used to estimate occupational and public health effects,
Nonradiological air emissions are expected to produce very small health impacts for involved and
uninvolved workers, Although overall pub] ic health impacts would be very small, the greatest
contribution to these impacts would occur due to emissions from benzene waste generated from the
Defense Waste Processing Facility, including In-Tank Precipitation,
4.1.12.1 Occupational Health and Safety
4.1.12.1.1 Radiological Impacts
Doses to involved workers were estimated based on a review of exposures resulting from waste
management activities for the no-action alternative. Direct radiation and inhalation would be the largest
exposure pathways. Doses to uninvolved workers were calculated using the MAXIGASP computer code
4-44
DOE/’EIS-O2l7July 1995
(see Section 4.1, 12.2), An uninvolved worker was conservatively assumed to be located 100 meters
(328 feet) from the release point (of the affected facility) for 80 hours per week; another was
conservatively assumed to be located 640 meters (2, 100 feet) from tbe release point for 80 hours per
week. The weekly exposure period was conservatively estimated to ensure that doses to overtime
workers were not underestimated, Doses were estimated for the inhalation, ground contamination, and
plume immersion exposure pathways. Data required to calculate doses to the uninvolved worker
population are not currently available; however, dose to an individual uninvolved worker at 100 meters
(328 feet) and 640 meters (2,1 00 feet) would bound the impact to the individual members of the
population.
I TE
The incremental worker doses (the increase in dose due to activities under tbe no-action alternative) are
given in Table 4-9. DOE regulations ( 10 CFR 835) require that annual doses to individual workers not
exceed 5 rem per year. DOE assumes that exposure to the maximally exposed involved worker at SRS
would not exceed 0.8 rem per year due to administrative controls (WSRC 1994d). / TC
From these radiological doses, estimates of latent cancer fatalities were calculated using the conversion
factor for workers of 0.0004 latent cancer fatali~ per rem (lCRP 199 1). Based on this factor, the
probability that the average involved worker would develop a fatal cancer sometime during his lifetime
as the result of a single year’s exposure to waste management-generated radiation would be 1,Ox10-5, or
approximately I in 100,000. For the worker exposed to the administrative limit (0,8 rem), the probability
of developing a fatal cancer sometime in his lifetime as a result of a single year’s exposure would be I TE
3.2x 10“4, or approximately 3 in 10,000. For tbe total involved workforce, the collective radiation dose
could produce up to 0.022 additional fatal cancer as the result of a single year’s exposure; over the
30-year period the involved workers could have 0.65 additional fatal cancer as a result of exposure. The I TC
probability of any individual uninvolved worker developing a fatal cancer as a result of the estimated
exposure would be very small (Table 4-9). I ‘rC
The calculated numbers of fatal cancers due to worker exposure to radiation can be compared with the
number of fatal cancers that would normally be expected among the workers during their lifetimes.
Population statistics indicate that, of the U.S. population which died in 1990,23.5 percent died of cancer
(CDC 1993). If this percentage of deaths from cancer remains constant, 23.5 percent of the U.S.
population will develop a fatal cancer during their lifetime. Therefore, in the group of 2,088 involved
workers, about 491 would normally be expected to die of cancer.
The probability of developing a radiation-induced fatal cancer associated with the no-action alternative is
much less than the probability of developing a fatal cancer from other causes.
4-45
Table 4-9. Worker radiological dosesa and resulting health effects associated with the no-action alternative.
Individual All workers
Probability of a Number of fatalReceptor(s) Dose (rem) fatal cancer Dose (person-rem) cancers
Average involved worker
● AnnualbTC
0.025 1.OXIO-5 NAc NA
. 30-year 0.75 3. IXIO-4 NA NA
All involved workersd
. Annualb NA NA 52e 0.02 ITC
. 30-year NA NA 1,600 0.62
Uninvolved worker at 100 metersf,g,h
. Annualb 1.OXIO-5 4. IXIO-9 NCi NC
TC I o30-year 3.OX1O-4 1.2x1 o-7 NC NC
?. Uninvolved worker at 640 metersf,g
‘TC I . Annualb 2.9x10⁷ 1.1X1O-10 NC NC
. 30-year 8.6 X1O-6 3.4 X1O-9 NC NC
a. Supplemental facility information is provided in Appendix E.b. Annual individual worker doses can be compared with the regulatory dose limit of 5 rem (10 CFR 835) and with the SRS administrative
exposure guideline of 0.8 rem. Operational procedures ensure that the dose to the maximally exposed worker will remain as far below theregulato~ dose limit as is reasonably achievable. The 1993 average dose for all site workers who received a measurable dose was 0.051 rem
(see Table 3-18).
c. NA = not applicable.
d. The number of involved workers is estimated to be 2,088.e. Total for involved workers; 1993 SRS total for all workers was 263 person-rem (see Table 3- 18).
f. M-Area Vendor Treatment Facility.g. Doses conservatively assume 80 hours per week of exposure.
h. To convert to feet, multiply by 3.28.
TE I i. NC= not calculated. Uninvolved worker population doses were not calculated because not all facilities have “ot been sited.
DoE/E1s-02 I7July 1995
4.1.12.1.2 Non radiological Impacts
Potential nonradiological impacts to SRS workers were considered for air emissions emanating from the
following facilities: Defense Waste Processing Facility, including In-Tank Precipitation; M.Area
Vendor Treatment Facility; M-Area Air StrippeL hazardous and mixed waste storage buildings; and the I TC
E-Area organic waste storage tanks. Occupational health impacts to employees in the Defense Waste
Processing Facility and In-Tank Precipitation are presented in the Final Supplemental Environmental \ Tc
b. OSHA PEL is Occupational Safety and Health Administration Permissible Exposure Limitc. To convert to feet multiply by 3.281.d. Particulate matter less than 10 microns in diameter,e. NA = not applicable.
Effects are estimated for two separate population groups: (l) the 620,100 people living within
80 kilometers (50 miles) of SRS and the 871,000 people living within 80 kilometers (50 miles) of the
offsite facility who would be exposed to atmospheric releases; and (2) the 65,000 people using the
Savannah River whn would be exposed to releases to the river (Artlett, Karapatakis, and Mamatey 1994).
Impacts are estimated for tbe maximally exposed individual in each of these population groups.
4-48
DoE/EIs-02 I 7July I 995
To facilitate the prediction of the radiological doses associated with the no-action alternative, current and
future waste management practices at SRS were assessed. Wastes were aggregated into treatability
groups to estimate the radionuclide releases to air and water.
Airbnrne radiological releases were converted to doses using tbe MAXIGASP and POPGASP computer
codes (Ham by 1992). Doses were calculated using dose factors provided in Simpkins (1994a). These
codes calculate the dose to a hypothetical maximally exposed individual at the SRS boundary and the
collective dose to the population within an 80-kilometer (50-mile) radius, respectively. The inhalation,
food ingestion, ground contamination. and plume exposure pathways were evaluated. Bnth codes utilize
the GASPAR (Eckemran et al. 1980) and XOQDOQ (Sagendorf, Croll, and Sandusky 1982) modules,
GASPAR and XOQDOQ have been adapted for use at SRS (Hamby 1992 and Bauer 1991, respectively).
For the assessments, DOE assumed that the population would remain constant over the 30-year period of
analysis. This assumption is justified because (1) cument estimates indicate that the population will
increase by less than 15 percent during this period (HNUS 1995b), (2) there are uncertainties in the
determination of year-to-year population distributions, and (3) although the absolute impacts would
increase proportionately with population growth, the relative impact comparison between alternatives
would not be affected.
Calculated atmospheric doses are given in Table 4-1 I (releases from operation of tbe Defense Waste
Processing Facility are not included). The annual doses (0.00012 millirem to the offsite maximally
exposed individual and 0.00029 person-rem to the offsite population) would be small fractions of the
dose from total SRS airborne releases in 1993 [0.11 millirem to the offsite maximally exposed individual
and 7.6 person-rem to the population within 80 kilometers (50 miles) of SRS (Amett, Karapatakis, and
Mamatey 1994)]. Doses from 1993 operations were well within the EPA requirements given in 40 CFR
161 and adopted by DOE in Order 5400.5, which allow an annual dose limit to the offsite maximally
exposed individual of 10 millirem from all airborne releases.
Waterborne releases were converted to doses using the LADTAP XL computer code (Hamby 1991 ),
This code calculates the dose to a hypntbetical maximally exposed individual along the Savannah River
just downstream of SRS, and to tbe population using the Savannah River from SRS to the Atlantic
Ocean. Fish ingestion, water ingestion, and recreational exposure pathways were evaluated. The
aqueous dnse-producing-releases were discharges from the F/H-Area Effluent Treatment Facility; seeps
from grnundwater discharges were too small to affect the totals,
TE
TC
TC
TE
4-49
TEI
Table 4-11. Radiological dosesa associated with the no-action alternative and resulting health effects to the public.
Individual Population
Dose(mitlirem) Dose(Person-rem)b
Atmospher Aqueous Probabilityof Atmospheric Aqueous Numberof fatalReceptor(s)c ic releases releases Total a fatal cancer releases releaes Total cancers
Offsite maximallyexpased individual
TC ] . Annual 1.2X10⁻⁴ 6.9xI0-4 8.1xIO-4 4.IX1O-10 NAd NA NA NA
. 30-yew 0.0037 0.021 0.025 1.2xto-8 NA NA NA NA
Population
. Annual NA NA NA NA 2.9xl&4 0.0068 o.oo7t 3.5x I0-6
TC I . 30-year NA NA NA NA 0.0086 0.20 0.21 I.txlo-’r
a. Supplemental information is provided in Appendix E.* b. For atmospheric releases, the dose is to the population within 80 kilometers (50 miles) of SRS. For aqueous releases, the dose is to the people using thez Savannah River from SRS to the Atlantic Ocean.
c The doses to the public from total SRS operations in 1993 were 0.25 millirem to the offsite maximally exposed individual (O.I I millirem from airbornereleases and 0.14 millirem from aqueous releases) and 9.1 person-rem to the regional population (7.6 person-rem from airhome releases and 1.5 person-remfrom aaueous releases). Source: Amett, Karapatakis, and Mamatey (1994).
d. NA = n~t applicable.
DoE/EIs-02 I7July 1995
AS was done for the atmospheric assessments, the population was assumed to remain constant over the’
30-year period of analysis.
Calculated doses from releases to water are given in Table 4-11, The annual doses (0,00069 millirem to
the offsite maximally exposed individual and 0,0068 person-rem to the offsite population) would be
small fractions of the doses from total SRS releases to water in 1993 [0.14 millirem to the maximally
exposed member of the public and 1,S person-rem to the population using the Savannah River from SRS
to the Atlantic Ocean (Amett, Karapatakis, and Mamatey 1994)]. Doses from 1993 operations were well
within the regulatory requirements specified in DOE Order 5400,5 and by EPA in 40 CFR 141, which
allow an annual dose limit to the offsite maximally exposed individual of 4 millirem from drinking
water.
Using the fatal-cancer-per-rem dose factor given above, the probability of the maximally exposed
individual developing a fatal cancer and the numbers of fatal cancers that could occur in the regional
population under the no-action alternative were calculated (Table 4-1 I). The probability of the
maximally exposed individual dying of cancer as a result of 30 years of exposure to radiation from
activities under the no-action alternative is slightly more than I in 100 million; the number of additional
fatal cancers that might occur in the regional population for this same exposure period would be
l.l XIO-4,
About 23,5 percent of the U.S. population die from cancer from all causes (Section 4,1.12. 1);
accordingly, the probability of an individual dying of cancer is 0.235, or approximately I in 4, In a
population of 620,100 people (the number of people living within 80 kilometers [50 miles] of SRS), the
number of people expected to die of cancer is 145,700. In a population of 65,000 (the number of people
using the Savannah River as a source of drinking water), tbe number of people expected to die of cancer
is 15,275. Thus, the incidence of radiation-induced fatal cancers associated with the no-action
alternative (see Table 4-11 ) would be much smaller than the incidence of cancers from all causes,
4.1.12.2.2 Nonradiological Impacts
Potential nonradiological impacts to individuals residing offsite were considered for both criteria and
carcinogenic pollutants. Maximum SRS boundary-line concentrations for criteria pollutants are
discussed in Section 4.1.5.
For routine releases from operating facilities under the no-action alternative, criteria pollutant
concentrations would bewithin both state and federai ambient airquali~standards and are discussed in
4-51
TC
LO04-08
TE I
DoE/EIs-02 I 7July 1995
Section 4,1.5. During periods ofconstruction under nomaloperating conditions, the criteria pollutant
concentrations at the SRS boundary would not exceed air quality standards, and very small health
impacts would be expected from crheria pollutant emissions.
Offsite risks due to carcinogens were calculated using the Industrial Source Complex 2 model for the
same facilities discussed in Section 4.1.12 .l.2. The assumptions in the model are conservative.
Emissions of carcinogenic compounds were estimated using permitted values for facilities not cumently
operating (e.g~ the Defense Waste processing Facility) and emission factors for facilities cumently
a. Micrograms percubic meter of air.b. Source: Stewafl (1994).c. Latent cancer probability equals unit risk factor times concentration times 30years divided by7Oyears.
The unit risk (cancer risk per unit of air concentration) for a chemical is the highest lifetime risk (over 70
years) of developing cancer (either fatal or nonfatal) when continuously exposed to the chemical at an air
concentration of 1 microgram per cubic meter. Asshown in Table 4-12, theestimated lifetime risk
associated with routine emissions from facilities included intheno-action alternative isapproximately2
in I.0x107. Health impacts tothepublic would be very small,
4.1.12.2.3 EnvironmentalJ usticeAssessment
Environmental justice has assumed an increasingly prominent role in the environmental movement over
the past decade. Ingeneral, theterm ''environmental justice' 'refers to fairtreatment ofallraces, cultures,
andincome levels with respect tolaws, policies, andgovemment actions, In February 1994, Executive
Order 12898, “Federal Actions to Address Environmental Justice in Minority Populations and Low-
Income Populations,’’ was released. This order directs federal agencies toidentify andaddress, as
appropriate, disproportionately high and adverse effects of its programs, policies, and activities on
4-52
DOE/EIS-0217July 1995
minority and low-income populations. Executive Order 12898 also directs the Administrator of EPA to
convene an interagency federal working group on environmental justice (referred to below as the
Working Group). The Working Group will provide guidance to federal agencies for identifying
disproportionately high and adverse human health or environmental effects on minority and low-income
populations. The Working Group bas not yet issued this guidance, It has developed working draft
definitions. Although the definitions are in draft form, DOE used them in the analysis for this EIS. In
coordination with tbe Working Group, DOE is developing internal guidance on implementation of the
executive order, DOE’s internal guidance was used in preparing this EIS,
This EIS addresses environmental justice concerns in three areas: (1) potential air emissions,
(2) potential impacts from transportation of wastes offsite, and (3) potential impacts from consuming tisb
and game. Based on these analyses, DOE concluded that none of the alternatives would have
disproportionate adverse effects on minority populations or low-income communities.
Although adverse health effects are not expected under the no-action alternative, in tbe spirit of
Executive Order 12898 an analysis was performed to determine whether any impacts would have been
disproportionate y distributed. Figures 3-12 and 3-13 identify census tracts with significant proportions
of people of color or low income. This section presents the predicted average radiation doses that would
be received under the no-action alternative by individuals in these census tracts and compares them to the
predicted per capita doses received in the remaining tracts within the 80-kilometer (50-mile) radius of
SRS. This section also discusses impacts of doses received in the downstream communities from liquid
effluents from all alternatives and cases.
Figure 4-6 shows a wheel with 22.5-degree sectors and concentric rings from 16 to 80 kilometers (1O to
50 miles) radiating at 16-kilometer (10-mile) intervals from tbe center of SRS. A fraction of tbe total
dose (see Appendix E) was calculated for each sector based on meteorological data (Simpkins 1994b),
the sector wheel was laid over the census tract map, and each tract was assigned to a sector. For
purposes of this analysis, if a tract fell in more than one sector, the tract was assigned to the sector with
the highest dose.
DOE anal yzed the effects by comparing the per capita dose received by each type of community to the
other types of communities within a defined region. To eliminate the possibility that effects to a small
community close to SRS would be diluted and masked by including it with a larger community located
farther from SRS, comparisons were made within increasingly larger concentric circles, the radii of
which increase in 16-kilometer (10-mile) increments.
TETC
I TE
TE
4-53
DomIs-02 I 7July 1995
1NORTH
w... .
Figure 4-6. Identification of annular sectors around SRS. (See Appendix E for dose fractions bysector.)
4-54
rJoE/E1s-02 I 7July 1995
To determine the per capita radiation dose in each census tract for the no-action alternative, the number
of people in each tract was multiplied by that tract’s dose value to obtain a total population dose for each
tract. These population doses were summed over each concentric circle and divided by the total
community population to obtain a mean per capita dose for each circular area, The dose determined for
each tract was compared to this mean dose. Figure 4-7 illustrates these results for the no-action
alternative. Appendix E provides the supporting data.
As shown, the per capita dose is extremely small for each community type. This analysis indicates that
communities of people of color (in which the minority population is equal to or greater than 35 percent
of the total population) or low income (in which the number of low income persons is equal to or greater
than 25 percent of the total population) would not be disproportionately affected by atmospheric releases,
Table 4-11 lists predicted doses to the offsite maximally exposed individual and to the downstream
population from exposure to water resources. The doses reflect people using the Savannah River fnr
drinking water, sports, and food (fish). Because the communities of people of color or low income living
in the areas downstream from SRS are well distributed and because persons in the downstream region
would not be affected (the 30-year dose to the offsite maximally exposed individual for all alternatives
and forecasts would be 0.021 millirem), there are no disparate adverse impacts on low-income or
minority communities in the downstream areas for any of the alternatives.
The distribution of carcinogen and criteria pollutant emissions due to routine operations, and of criteria
pollutants from construction activities, would be essentially identical to those presented for airborne
radiological emissions, so people of color and the poor would not be disproportionately affected by non-
radiological emissions under any of the alternatives. Because non-radiological pollutant emissions have
only very small impacts in any of the alternatives, and are not disproportionate] y distributed among types
of communities, there are no environmental justice concerns related to these pollutants for any of the
alternatives.
Environmental justice concerns were also considered for the impacts associated with the offsite
transportation of hazardous and radioactive waste that would occur under the alternatives. A recent
impact analysis (see Section 4.1 .11.1 ) determined that for the no-action alternative, accidents resulting in
the release of hazardous material would be expected to occur, on average, only once in 6 years (i.e., five
accidents resulting in hazardous material release over the 30-year period of this El S). The impact
analysis determined that for the scenario with largest impacts (alternative B – maximum waste forecast),
accidents involving the release of hazardous material would be expected to occur, on average, only once
in 4 years. In addition to the expected frequency of such accidents, their impacts can be mitigated by
I TE
I TE
1:
I ‘rE
I TE
I TE
I TC
4-55
E
1.00E-07
8.ooE-oL3-rI I I/l! I II
6.00E-08
30 4.00E-08 — /
Non-LowIncome Low @64 kilometer
Communitia Income PersonsCommunities Ofblor Persons 0-80 kilometer
<35% of color Persons35 to 50% 0: ;;: All
a
Type ofCommunities
Community
1> is read as ‘greater than. I
Distance fromSavannah River
Site
Population dose = 0.0086 permn-rem
OKI, ..
Figure 4-7. Dose to individuals in communities within 80 kilometers (50 miles) of SRS under the no-action alternative.
DoE/EIs-02 17July 1995
existing training and technology for controlling spills from vehicles, Because these rare events are
expected to occur randomly in time with equal distribution throughout various types of communities,
there are no disproportionate adverse impacts on poor or minority communities from transportation of
hazardous and radioactive waste for any of the alternatives evaluated in this EIS.
DOE also considered impacts associated with consumption of wildlife from SRS and fish from the
Savannah River from the perspective of environmental justice. Doses to the maximally exposed hunter
and fisherman (see Section 3.12.1 .2) have been determined to be 57 and 1.3 millirem, respectively.
These analyses assumed that the hunter consumed 153 kilograms (337 pounds) of meat from deer and
hogs taken from SRS and 19 kilograms (42 pounds) of fish from the Savannah River at the mouth of
Steel Creek each year. If the rate of fish consumption, for conservatism, was doubled to 39 kilograms
(84 pounds) per year, the total annual dose to an individual consuming both game and fish would be
59.6 millirem or 59.6 percent of the DOE annual limit (DOE 1993c). A dose of this magnitude would
result in an annual probability of contracting a latent fatal cancer of 3 .Ox10-5 (approximate] y
3 in 100,000). It is highly unlikely that communities of people of color or low income consume game
and tisb at a rate greater than that calculated for the maximally exposed individual who both hunts and
fishes, as that person is assumed to eat 42 I pounds of fish and game each year. Because the doses
received by this maximally exposed individual from fish and game are not significant, there would be no
disproportionate adverse impacts from consumption of wildlife by people of color or low income.
4.1.13 FACILITY ACCIDENTS
This section summarizes the risks to workers and members of the public from potential accidents at
facilities associated with the various waste types under the no-action alternative. An accident is a series
of unexpected or undesirable events leading to a release of radioactive or hazardous material within a
facility or to the environment. Appendix F provides further detail and discussion regarding the accident
analysis,
4.1.13.1 Methodology
Accident assessment is based on potential accidents identified and described in safety documentation for
SRS facilities and on material inventories at SRS facilities that support the no-action alternative.
Accidents include events resulting from external initiators (e.g., vehicle crashes, nearby explosions),
internal initiators (e.g., equipment failures, human error), and natural phenomena initiators
(e.g., earthquakes, tornadoes). Radioactive and hazardous material releases resulting from accidents are
considered in this analysis.
[ TC
I TE
4-57
DoE/Els-02 I 7July 1995
TE
TE I
The accident scenarios selected for this evahration were chosen to represent the full spectrum of events
which could occur (i.e., both high- and low-frequency events and large- and small-consequence events).
The frequency ranges, as presented in Table 4-13, areas follows: anticipated accidents, unlikely
accidents, extremely unlikely accidents, and beyond-extremely-unlikely accidents. A more complete
discussion on accident frequencies is given in Section F.2 of Appendix F. However, it should be noted
that all frequency ranges may not have representative accident scenarios identified for them. Accident
scenarios in the beyond-extremely-unlikely frequency range are so unlikely that they often are not
analyzed in safety documentation.
Table 4-13. Accident frequency categories.aFrequency range
Frequency category (accidents per year)b
Anticipated accidents lml?p>lo-z
Unlikely accidents 1o’22p21 0-4
Extremely unlikely accidents 10-4ZPZ1 o-6
Beyond-extremely-unlikely accidents 10-62P
a. The frequencies for accidents are from DOE Standard 3009-94 (DOE 1994b).b. xzy. The number “x” is greater than or equal to the number” y.” Conversely, tbe number “y” is less
than or equal to the number “x” (e.g., 52423).
Radiological consequences are defined in terms of (1 ) the dose to an individual and collective dose to a
population; and (2) latent fatal cancers from a postulated accident. The human health effect of concern is
the development of latent fatal cancers. The International Commission on Radiological Protection
(ICRP) has made specific recommendations for quantifying these health effects (ICRP 199 I). The
results of these health effects are presented in terms of increased latent fatal cancers (i.e., number of
additional fatal cancers expected in the population) calculated using ICRP-60 conversion factors of
0.0005 for the public and 0,0004 for onsite workers if the effective dose equivalent is less than 20 rem.
For individual doses of 20 rem or more, the ICRP-60 conversion factors are doubled. For hazardous
materials, consequences are defined in terms of airborne chemical concentrations.
Radiological doses for the postulated accident scenarios were extracted from information provided in the
following technical reports: Bounding Accident Determination for the Accident Input Analysis of the
RHLWEd release due to a feed line break High-level
RHLWE release due to a design basis earthquake High-level
RHLWE release due to evaporator pressurization High-leveland breech
Design basis ETFh airborne release due to tornado High-levelMixed
Container breach at the ILNTVj Low-levelMixed
High wind at the ILNTV Low-levelTornado at the ILNTV Low-level
Earthquake at the SRTCk storage tanks Mixed
F3 tornado] at Building 3 16-M Mixed
Deflagration in culvert during TRUm drum retrieval Tmnsumnic? activitiess
Fire in culveti at the TRU waste storage pads (one Transuranic
drum in culvert)Vehicle crash with resulting fire at the TRU waste Transuranic
storage pads
0.07’2,00x Io-4f5.09x lo-5g
3.69x 10⁻⁷i
0.02’
O.oolf2.00X1O-jg2.00X1o-4f
2.80x 10⁻⁵gI.OoxI0-2
8.10x 10⁻⁴f
6.50x 10⁻⁵g
1.79 XI0-5
1,54x I o-6
I,95x I0-6
3.2ox1o-I3
0.00104
4.04 XI0-103.26x10-124.80x 10⁻⁷
5.35x I0-12
8.96x 10⁻⁴
3.07XIo-4
4.47x I o-6
6.38x10-85.46x Io-83.46x Io-8
1,02X10⁻¹⁴
1.84x I0-5
2.43x10-lo6.18x lo-lt3
1.54x I0-81.29x 10⁻⁹
1.59XI0-5
5.48xI0-6
7.96x I0-8
1.32.10-8
1,12X10-97.13 XI0-10
7,20x I0-15
3.31 XI0-7
1.52x 10⁻¹⁰
1.18xl&10
8.06x lo-lo
1.65x I0-9
2.86 X1O-7
9.84x10⁻⁸
1.43x 10⁻⁹
6.34x10⁻⁴
5.43 XI0-5
3 .44x I o-5
6.35x I0-14
0.0168
1.06x 10-51.18x I0-7
3.60x 10-61.12X10-9
1.45x I0-2I TC
0.0498
7.25x10⁻⁵
a. A completedescriptionand analysisof the representativeboundingaccidentsare presentedin Appendix F.b. Increwed riskoffatal cmccrsperyear iscalculated bymultiplying the[consequence(dose) xlatent cmcerconve~ion factor] xanual frequency. Fordose consequences
md latent cancerfatalities per dose,seetablesin Appendix F.c. Thewmte type forwhich theaccident scenaio isidentified aarepresentitive boundingaccident. Arepresentative boundin8accident may beidentificd formorcthmo"c
waste type. Thescwste Qpesaehigh-Ievel, low-level, mixed, mdtrmsuranic.d. ReplacementHigh-Level Waste Evaporator.e. The frequencyofthisaccidcnt sccn=io iswithin themticipated accidentrmge.f. The frequencyofthisaccident scenwio iswithin theunlikely accidentmge.g. The frequencyofthisaccident scenwio iswithin theextremely uniikcly accidentrange.h. F/H-Area Emuent Treatment Facility.i. The frequency of this accidentscenariois within the beyond-extremely-unlikely accidentrange.
j. Intermediate-Level Nontritium Vault.k. Savann& River Technology Center.1. F3tomadoes havcrotitional windspeeds of254to 331kilomcters (158t0206miles) perhour.
DoE/EIs-02 I 7July 1995
Table 4-15. Summawofchemical hazards associated with theno-action alternative estimated toexceed
ERPG-2a values.
Appendix F 100-meter 640-meter Offsite Reference concentrationstable concentration concentration concentration
Figure 4-14. Configuration of treatment, storage, and disposal facilities in E-Area for alternative A –expected waste forecast by 2024,
4.74
Road E
E
PK56-22
4-75
DOE/EIS-0271July 1995
4.2.3 GROUNDWATER RESOURCES
TE
TC I
TC
TETC
TE I
Min. EIp. M...NoAction
A
B
@
4.2.3.1c
Groundwater Reso urces– Exr)ected Waste Fo recast
This section discusses the effects of alternative A – expected waste forecast on groundwater resources at
SRS. Effects can reevaluated bycOmparing theconcentrations ofc6ntaminants predicted toenterthe
groundwater foreach alternative and waste forecast. Effects ongroundwater resources under the no-
action alternative (Section 4.1.3 )form the baaisfor comparison among thealtematives and are
referenced in this section,
Operation and impacts of the M-Area Air Stripper and the F- and H-Area tank farms would be the same
as under the no-action alternative.
For the expected forecast and as noted in Section 4.1.3, releases to groundwater from RCRA-permitted
disposal vaults would be improbable during active maintenance; however, releases could eventually
occur after loss of institutional control and degradation of the vaults. Impacts from the RCRA-permitted
disposal vaults would be similar to the effects under the no-action alternative (Section 4. 1.3),
There would be two more additional low-activi~ and intermediate-level radioactive waste disposal
vaults (17) than undertbe no-action alternative (15). Modeling has shown that releases from these vaults
would notcause groundwater standards to be exceeded during the30-year planning period or the
100-year institutional control period. Asinthe no-action alternative, noradionuclide exceededtbe
4millirem peryear standard forauser ofshallow groundwater from thehypothetical we1l 100 meters
(328 feet) fromthe waste disposal facility atanytime afierdisposal (Toblinl995). Alsoas in the
no-action alternative, thepredicted concentrations oftritium would beavery small fraction of the
drinking water standard, Thediscussion in Section 4,1,30n the basis forthe4millirem standard also
applies tOthiscasc. impacts under this forecast would besimilar totheeffects under the no-action
alternative,
4-76
DOE/EIS.0271July 1995
Under this waste forecast, 73 additional slit trenches would be constructed. Twentyseven (27) of these
slit trenches would be used for disposal of suspect soil and have been evaluated using results from the
previous Radiological Performance Assessment (Martin Marietta, EG&G, and WSRC 1994). Under this
waste forecast, modeling results indicate that none of the radionucl ides analyzed would at any time
exceed DOE’s perfomrance objective of 4 millirem per year for drinking water (Toblin 1995). The
remaining trenches would be tilled with stabilized waste forms (e. g., ashcrete) subject to completion of
performance assessments and demonstration of compliance with the performance objectives required by
DOE Order 5820.2A. Therefore, DOE has conservatively assumed that groundwater concentrations as a
result of radioactive releases from the RCRA-pemrhted vaults mrd all other low-level waste disposal
facilities (vaults and slit trenches) would remain within the DOE performance objective of 4 millirem per
year adopted by DOE in Order 5400.5.
In summary, effects on groundwater for alternative A – expected waste forecast would be very small and
similar to the effects discussed under the no-action alternative.
Min. EXP. Ma,NoAction
A
a
Q
4.2.3.2c
~ ter Resources – ini urn Wa Forecast
For the minimum forecast, and as discussed in Section 4.1.3, releases to groundwater from the disposal
vaults would be improbable during active maintenance; however, releases could eventually occur after
the loss of institutional control and degradation of the vaults. Impacts from the disposal vaults would be
similar to the effects under the no-action alternative (Section 4.1.3).
There would be four fewer additional low-activity and intermediate-level radioactive waste disposal
vaults (11 ) than under the no-action alternative (15). Impacts of disposal in these vaults are similar to the
impacts discussed in Section 4.1.3. Exceedance of the 4 millirem per year drinking water standard does
not occur for any radionuclide in shallow groundwater at any time after disposal (Toblin 1995).
For this forecast there would be limited direct disposal of radioactive waste by shallow land disposal (25
additional slit trenches). Eleven (11 ) of these slit trenches would be used for disposal of suspect soil and
have been evaluated using results from the previous Radiological Performance Assessment (Martin
Marietta, EG&G, and WSRC 1994). Under this waste forecast, modeling results indicate that none of
TC
TE
TC
TE
rc
TC
4-77
TC
TE
TC I
TC I
TE
TC
TC
DOE/EIS-027 IJuly 1995
the radionuclides analyzed wOuld at any time exceed DOES performance objective of 4 millirem per
year for drinking water. The remaining trenches would be tilled with stabilized waste forms
(e.g., ashcrete) subject to completion of performance assessments and demonstration of compliance with
the performance objectives required by DOE Order 5820.2A. Therefore, DOE has conservatively
assumed that groundwater concentrations as a result of radioactive releases from the RCRA-perm itted
vaults and all other low- level waste disposal facilities (vaults and slit trenches) would remain within the
DOE performance objective of 4 millirem per year adopted by DOE in Order 5400.5.
In summary, effects on groundwater for alternative A – minimum waste forecast would be sim ilar to the
effects under the no-action alternative (Section 4.1.3) and the effects for alternative A – expected waste
forecast.
Min.Exp.Ma,.N. —Act,..
A
a
“-m
4.2.3.3 Groundwater Resources – Maximum Waste Forecastc
For the maximum forecast under alternative A, a total of 347 disposal vaults would have been
constructed by 2024. However, these vaults would have double liners and leak-detection and
Ieachate-collection systems, as required by RCRA (see Section 4, 1.3), Therefore, despite the large
number of vaults required, releases to groundwater would be improbable during active maintenance;
however, releases could eventually occur after loss of institutional control and degradation of the vaults.
Impacts from the RCRA-permitted disposal vaults would be similar to the effects under the no-action
alternative (Section 4, 1.3). Potential effects on groundwater resources due to the construction of RCRA-
pemritted disposal vaults would be similar to the potential effects due to the construction of mixed-waste
storage buildings under the no-action alternative discussed in Section 4.1.3.
There would be more than four times the number of low-activity and intermediate-level radioactive
waste disposal vaults (62) than under the no-action alternative (15). Predicted effects on groundwater
resources from low-activity and intermediate-level radioactive waste disposal vaults would be similar to
those effects under the no-action alternative (Section 4. 1.3); no radionuclide would exceed the 4 millirem
drinking water standard at any time after disposal (Toblin 1995),
For the maximum forecast, 644 additional slit trenches would be needed to support shallow land
disposal. Four hundred twenty six (426) of these slit would be used for disposal of suspect soil and have
been evaluated using results from the previous Radiological Performance Assessment (Martin Marietta,
4-78
—
DoE/EIS-0271July 1995
EG&G, and WSRC 1994). IJnder this waste forecast, modeling results indicate that none of the
radionucl ides analyzed would at any time exceed DOES performance objective of 4 millirem per year
from drinking water (Toblin 1995), The remaining trenches would be filled with stabilized waste forms
(e.g., ashcrete) subject to completion of performance assessments and demonstration of compliance with
the perfomrance objectives required by DOE Order 5820.2A, Therefore, DOE has conservative y
assumed that groundwater concentrations as a result of radioactive releases from the RCRA-permitted
vaults and all other low-level waste disposal facilities (vaults and slit trenches) would remain with tbe
DOE performance objective of 4 millirem per year adopted by DOE in Order 5400,5.
In summary, predicted impacts to groundwater for alternative A - maximum waste forecast would be
similar to those under the no-action alternative (Section 4. 1,3) and alternative A – expected waste
forecast (Section 4.2.3. 1).
4.2.4 SURFACE WATER
Min. Exp. Mu,No mA.t).n
A
m
4.2.4.1B
c
RESOURCES
Surface Water Resour ces – Exr)ected Waste Forecast
The impacts of the alternatives can be compared by examining the pollutants that would be introduced to
the surface waters. The effect of alternative A – expected waste forecast on SRS streams would not
differ from present effects, except that flow rates of the discharged treated wastewater would increase
slightly.
As discussed in Section 4.1.4, construction of facilities would require sedimentation and erosion control
plans to prevent adverse effects to streams by silt, oil/grease, or other pollutants that could occur in
runoff. Regular inspection of the implementation of these plans would be performed as outlined in
Section 4.1.4. After facilities were operating, they would be included in the S~ Stormwater Pollution
Prevention Plan, and erosion and pollution control measures would be implemented as indicated in this
plan.
For alternative A – expected waste forecast, the M-Area Air Stripper, the M-Area Dilute Effluent
Treatment Facility, and the F/H-Area Effluent Treatment Facility would receive the same additional
wastewater flows for treatment as those received in the no-action alternative. Each of these facilities has
the design capacity to treat the additional flows and maintain discharge levels in compliance with
TC
TE
TC
I TE
TC
4-79
TC I
TC
DOE/EIS-0271July 1995
established pemr it conditions. The treated effluent from these facilities would, as explained in
Section 4.1.4, continue to have little, if any, impact to receiving streams. Radionuclide concentrations
would be tbe same as those reported for the no-action alternative. Drinking water doses due to
stormwater infiltrating the vaults and trenches and draining to surface water would be many times lower
than regulatory standards (Toblin 1995).
The Replacement High-Level Waste Evaporator (as noted under the no-action alternative) would
evaporate the liquid waste from the high-level waste tanks in the F- and H-Area tank farms. It would be
used in the same manner as the present F- and H-Area evaporators, with the distillate being sent to the
F/H-Area Effluent Treatment Faci Iity for treatment prior to being discharged to Upper Three Runs, The
concentrate from the evaporator would be sent to the Defense Waste Processing Facility for vitrification.
Since the Replacement High Level Waste Evaporator would be used in the same manner as the existing
evaporators and would produce a distillate similar in composition to the present distillate, the effect of
the F/H-Area Effluent Treatment Facility effluent on Upper Three Runs would be the same as it is now.
Wastewater from the containment building would be transferred to the Consolidated Incineration Facility
for treatment, The containment building would not discharge to a stream.
Wastewater discharges would not occur from the mobile soil sort facility under this alternative.
Min, EXP M,,.N. nA.,,.”
A
B
cm 4.2.4.2 Su rface Water Res ources – Minimum Waste Forecast
The M-Area Dilute Effluent Treatment Facility would receive the same additional wastewater flow for
treatment as under the no-action alternative, The M-Area Air Stripper and the F/H-Area Effluent
Treatment Facility would each receive approximate y 0,4 gallon (1,5 liters) per minute less than that sent
to each facility under the no-action alternative, As explained in Section 4,1.4, the treated effluent from
these facilities would continue to have little, if any, impact on receiving streams. Each facility has the
necessa~ capacity to treat the additional wastewater and maintain discharges in compliance with
established permit conditions. Also, because of less waste disposal, groundwater discharging to surface
water would have a very small impact (Toblin 1995), Drinking water doses due to stormwater
infiltrating waste disposal vaults a“d trenches and draining to surface waters would be many times lower
than regulatory standards.
4-80
DOE/SIS-0271July 1995
As discussed in Section 4.1.4, erosion and sedimentation control plans would be prepared and
implemented for the construction projects, and the operators of the facilities would be required to abide
by the SRS Pollution Prevention Plan.
Min. Exp, Max.N.Action
A
B
as
4.2.4.3 rfce Wtr R r~c
Storage and disposal facilities would be as described in Section 4,2,4,1. Surface waters would not be
affected by operation of these facilities.
For the maximum waste forecast, wastewater from the containment building would not be transferred to
the Consolidated Incineration Facility because that facility could not handle the increased volume. A
new wastewater treatment facility would be installed to treat this wastewater to meet outfall discharge
limits established by SCDHEC. The average flow rate for this discharge would be approximately
11 liters (2.9 gallons) per minute. The dose to the offsite maximally exposed individual would be
2.1 x10⁻⁵ millirem (Appendix E). The flow of properly treated water would not affect the water quality
of the receiving stream,
The M-Area Air Stripper and the M-Area Dilute Effluent Treatment Facility would receive
approximately the same additional wastewater flOWSas under the no-action alternative. The F/H-Area
Effluent Treatment Facility would receive additional wastewater flow of 0.28 gallon (1. 1 liter) per
minute above that for the no-action alternative. The facilities have the capacity to treat the additional
flow.
Stormwater infiltrating the disposal vaults and trenches would drain to surface water at concentrations
many times less than regulatory standards (Toblin 1995), I TC
Erosion and sediment control during construction projects and pollution prevention plans after operations
begin would be required, as discussed in Section 4,1,4.
4-81
DOE/EIS-0271July 1995
4.2.5 AIR REsOURCES
Min. Exp. Max.No n
TE
TE I
Action
.4
B
@
4.2.5.1 Air Resources – ExDected Waste Fc
0 recast
Impacts to air can be compared among the alternatives by evaluating the pollutants introduced to tbe air.
Under alternative A expected waste forecast, DOE would continue ongoing and planned waste treatment
activities and construct and operate the additional facilities identified in Section 4.2.1. Additional
nonradiological and radiological emissions would come from these facilities. Tbe resulting increases of
pollutant concentrations at and beyond the SRS boundary would be very small compared to existing
concentrations. Operations for alternative A – expected waste forecast would not exceed state or Federal
air quality standards.
4.2.5.1.1 Constriction
Potential impacts to air qual ity from construction activities would include fugitive dust (particulate
matter) and exhaust from earth-moving equipment. For this case, approximately 5.73x10⁵ cubic meters
(7,5ox 105 cubic yards) of soil in E-Area would be moved. Fugitive dust emissions for alternative A -
expected waste forecast were estimated using the calculations described in Section 4.1.5.1.
Maximum SRS boundary-line concentrations of air pollutants from a year of average construction
activity are shown in Table 4-16. Tbe sum of the incremental increases of pollutant concentrations due
to construction and the existing baseline concentrations would be within both state and Federal air
quality standards.
4.2.5.1.2 Operations
In addition to the current emissions from SRS, nonradiological and radiological emissions would occur
due to the operation of new facilities such as the Defense Waste Processing Facility, including In-Tank
Precipitation; the M-Area Vendor Treatment Facility; the Consolidated Incineration Facil hy; the mixed
waste containment building; mixed waste soil sort facility; and the transuraDic waste characterization/
certification facility, Air emissions from facilities such as disposal vaults and mixed waste storage
buildirrgs would be very small.
4-82
Table 4-16. Maximum SRS boundary-line concentrations resulting from a year of construction activities under alternative A (in micrograms percubic meter of air).
Average increaseb Baseline + increase
(vg/m3) SCDHECC as percent of standard
Averaging Baselinea standard
Pollutant time (P~m3) Expected Minimum Maximum (Pg/m3) Expected Minimum Maximum
b. DOE assumed that approximately 50 percent of the total SRS workforce would be available to support wastemanagement activities.
c. New hires are calculated by comparing tbe required employment (column 4) to available employment(column 3); new hires would be needed only in those years when required employment exceeds availableemployees,
4-96
Table 4-21. Changes in employment, population, and personal income for alternative A – maximum waste forecast,a
Change inChange in
Net .ha”g. in Percent change Change in Percent change cegionai personal Percent changeindirect regional total regional in regional regional in regional income in regional
Year New hiresb emvlovmentc employment employment population population (millions) personal income
1998
I999
2000
200 I
2002
2003
2004
2005
2006
2007
2008
2009
2010
2011
2012
2013
2014
2015
2016
2017
2018
.
2,300 3,300 5,600 2.26 1,960 0.42 270 2.6o
2,590
2,610
2,610
3,300
3,300
3,300
3,300
2,140
0
1,160
1,160
1,160
1,160
1,160
1,160
1,160
1,160
1,160
1,160
1,160
3,640
3,490
3,330
4>240
4,100
3,990
3,920
2,170
3,060
760
910
1,070
I ,220
1,340
1,450
1,530
1,600
1,650
1,6g0
1,710
6,230
6,100
5,940
7,540
7,400
7,290
7,220
4,310
3,060
1,920
2,070
2,230
2,380
2,500
2,610
2,690
2,760
2,810
2,840
2,870
2.49
2.41
2.32
2.92
2.83
2.76
2.70
1.60
1.13
0.71
0.76
0.82
0.87
0.91
0.95
0.98
1.01
I .03
I .04
I .05
4,600
6,380
7,770
9,460
1I ,020
f2,080
12,900
12,490
11,270
9,880
8,690
7,850
7, I 70
6,630
6,200
5,850
5,560
5,310
5, I 00
4>920
0.97
I.34
1,63
1.98
2.30
2.52
2.69
2.60
2.34
2.04
1.79
1,61
I.47
1.35
1.26
1.18
1.t2
1.06
I.02
0.98
340
370
390
520
550
580
610
430
340
240
240
250
260
280
310
330
360
380
410
440
3.09
3,18
3.16
3,9g
3.96
3,94
3.91
2.59
1.92
1.27
1.20
1.17
1.15
1,[7
I .22
I .22
1,25
1.25
1.27
1.29
a. Source: Hess ( 1995a, b); ~US ( 1995b).b. From Table 4-20.
c. Change in employment related to changes in population.
TC
TC
DOE/EIS-0271July 1995
Potential changes in total personal income would peak in 2005 with a$610 million increase over forecast
income levels for that year (HNUS 1995b). This would be a 4 percent increase over baseline income
levels (Table 4-2 l) and would have a substantial, positive effect on the regional economy.
4.2.9 CULTURALRESOURCES
This section discusses the effect of alternative A on cultural resources.
Min. EXP. Max,NoAction
A
a
@
4.2.9.1c
Cultural Resource s – Exoecte d Waste Forecast
Waste treatment, storage, and disposal facilities would be constructed within the currently developed
portion of E-Area, to the north and notihwest of this area, and to the northwest of F-Area (see
Figures 4-13 and 4-14),
Construction within the developed and fenced portion of E-Area would not affect cultural or
archaeological resources because this area has been previously disturbed.
Two small areas of unsurveyed land to the east and northeast of the current] y developed portion of
E-Area that would be used for the construction of sediment ponds (see Figure 4-5) would be surveyed
before beginning construction. Ifimpotiant resources were discovered, DOEwould avoid them or
remove them,
Construction of the RCRA-permitted disposal vaults to the nofihwest of the currently developed portion
of E-Area (see Figure 4-13) would not affect archaeological resources because when this area was
surveyed important sites were not discovered,
Archaeological sites intbearea ofexpansion could beimpacted asdescribed in Section 4.l.9. If this
occurred, DOE would protect these resources as described in Section 4.1.9,
4-98
DOEEIS-0271July 1995
Min. E*P, Mu,NoAction
A
B
@ CU’tu
4.2.9.2 ral Resources – Minimum Waste Fo recast
c
Construction of new waste management storage facilities for this forecast would require approximately
0.18 fewer square kilometer (44 fewer acres) than that for the expected waste forecast. Although the
precise configuration of facilities is currently undetermined, construction would take place within
previously disturbed parts of E-Area.
I Tc
As discussed in Section 4.2,9.1, construction within the developed and fenced portion of E-Area or to the
northwest of this area would not have an effect on archaeological resources. Before construction would
begin in the undeveloped area northwest of F-Area, the Savannah River Archaeology Research Program
and DOE would complete the consultation process with the State Historic Preservation Officer and
develop mitigation action plans to ensure that important archaeological resources would be protected and
preserved (Sassaman 1994)
Min. Exp, Max.NoAction
A
a
@
4.2.9.3c
~ ximum Wa recast
Construction of new waste management storage, treatment, and disposal facilities for this forecast would
require approximately 4.27 square kilometers (1,056 acres), 3.66 kilometers (904 acres) more than for I ‘rC
the expected waste forecast. Some of the new facilities would be sited within E-Are~ however, DOE
would need an estimated additional 3.24 square kilometers (802 acres) outside of E-Area. I ‘rC
Construction within the developed and fenced portion of E-Area or to the rrmthwest of this area would be
preceded by consultation with the State Historic Preservation Officer and the development of a
mitigation plan to ensure that archaeological resources would be protected.
Until DOE determines the precise location of the additional 3.24 square kilometers (802 acres) that I Tc
would be used outside of E-Area, effects on cultural resources cannot be predicted. The potential
disturbance of important cultural resources would be proportional to the amount of land disturbed,
However, in compliance with the Programmatic Memorandum of Agreement, DOE would survey areas
4-99
TE
TE I
TC I
DOE/EIS-0271July 1995
proposed for new facilities prior tO disturbance. If important resources were discovered, DOE would
avoid or remove them.
M,”, Exp. Max.NoAction
A
@
4.2.10 AESTHETICS AND SCENIC RESOURCES-EXPECTED,
1% MINIMUM, AND MAXIMUM WASTE FORECASTSc
Activities associated with alternative A – expected, minimum, and maximum waste forecasts would not
adversely affect scenic resources or aesthetics. E-Area is already dedicated to industrial use. In all
cases, new construction would not be visible from off SRS or from public access roads on SRS. The new
facilities would not produce emissions that would be visible or that would indirectly reduce visibility.
4.2.11 TRAFFIC AND TRANSPORTATION
4.2.11.1 _
Min. Exp. Max,No n4.,,0.
A
B
m
4,2.11.1.1 Traffic – Expected Waste Forecastc
rhe additional traffic under alternative A – expected waste forecast (Table 4-22) would result from
construction activities, The increase would be greatest in 2003, when the greatest number of people
would be employed. In the table, the additional traffic is distributed among offsite roads based on the
percentage of baseline traffic each road carries. Traffic on all roads would remain within design
capacity, and the effects of increased traffic would be very small,
Additional truck traffic due to increased construction activities was estimated to be fewer than It) trucks
per day for all alternatives (Hess 1994d), DOE would not expect this increase in construction-related
truck traffic during nnrmal working hours to adversely affect traffic; therefore, it will not be discussed in
subsequent sections.
For the expected waste forecast, there would be two additional waste shipments per day over the
no-action estimates (Table 4-23). This would be due to shipments of stabilized ash and blowdown from
4-1oo
DOE/EIS-027IJuly 1995
the Consolidated Incineration Facility to disposal facilities. DOE would not expect the additional truck
traffic during normal working hours to adversely affect traffic. Numbers of shipments assumed under
each alternative are given in Tables E.3- 1 through E.3-3,
Table 4-22. Number of vehicles per hour during peak hours under alternative A,
TE
No-actionaltemat ive Waste Forecast
Design capacity (Percentage ofRoad (vehicles per hour) design capacity) Minimum Expected Maximum
a, Number in parentheses represents percentage of design capacity.b. Adapted from Smith (1989).c, Adapted from TRR (1985).d. Includes baseline PIUSthe maximum number (47) of construction workers (Hess 1995a, b).e. Includes baseline plus the maximum number (68 for the minimum, 83 for the expected, and 258 for the
maximum waste forecast) of construction workers (Hess 1995a, b).
Table 4-23. SRS daily hazardous and radioactive waste shipments by truck under alternative A,aChange from no-action
Waste type 1994 no-action traff]ca Minimum Expected Maximum
Hazardous 14 -6 <lb 6
Low-level 7 -3 0 12Mixed 8 -4 2 25
Trarrsuranicc I <1 <1 15
Total change NAd -13 2 58
Total shipments per day 30 17 32 88
TC
TC
a. Shipments per day To arrive at shipments per day, the total number of waste shipments estimated for the30 years considered in this EIS was divided by 30 to determine estimated shipments per year. These numberswere divided by 250, which represents working days in a calendar year, to determine shipments per day,Supplemental data are provided in the traffic and transportation section of Appendix E.
b. Values less than I are treated as zero for purposes of comparison.c. Includes mixed and nonmixed tmnsurarsic waste shipments.d. NA = not applicable.
4-101
DOE/EIS-0271July 1995
Min. E.P, Mm.NO _Act,..
A
““mm 4.2.11.1.2 Traffic – Minimum Waste Forecast
TC I For the minimum waste forecast, there would be21 more vehicles than in the no-action alternative
during peak commuter hours (Table 4-22). Traffic on all roads would remain within design capacity.
The effects of traffic under this case would be very small. There would be 13 fewer waste shipments per
day compared to no-action estimates (Table 4-23). This decrease is due to smaller volumes of all types
of waste. The lower volume of truck traffic would result in a slightly positive effect on traffic.
M,.. EXP. Max.NoAction
A
B
@
4.2.11.1.3 Traffic – Maximum Waste Forecastc
TC
TC
TE I
As discussed in Section 4.1.11.1, the 1992 highway fatality rate of 2.3 per 100 million miles driven in
South Carolina provides a baseline estimate of 5.5 traffic fatalities annually. Under alternative A, the
largest increase in construction workers would occur for the maximum waste forecast(21 I more workers
than under the no-action alternative). These workers would be expected to drive 2.6 million miles
annually (2.1 million miles more than under the no-action alternative), which would result in less than
one additional traffic fatality per year.
Even with the addition of211 vehicles above the estimates under the no-action alternative, traffic on all
roads would remain within design carrying capacity; therefore, effects on traffic would be very small.
Depending on the areas to which these employees were assigned and the shifts they worked, DOE would
need to examine the design capacity of the affected roads.
Daily waste shipments would increase by 58 (Table 4-23), primarily due to overall increases in waste
volumes and shipment of stabilized ash and blowdown to disposal facilities. The shipments would
originate at various SRS locations (primarily F. and H-Areas) and teminate at the E-Area treatment and
disposal facilities. Shipments from the transuranic waste characterization/certification facility and
containment building would not affect traffic because these shipments would occur on a dedicated road
that would be upgraded to accommodate expected traffic flows, The additionof58 trucks during normal
working hours is expected to have very small adverse effects on traffic.
Consequences from incident-free onsite transportation over 30 years under alternative A were based on
those under the no-action alternative, adjusted by the changes in the number of waste shipments (as a
result of changes in volumes of waste shipped). The percent change in dose from the no-action
alternative and corresponding health effects are shown in Table 4-24 for incident-free transportation.
Consequences of onsite transportation accidents for any given shipment are independent of the number
of shipments and are, therefore, the same as for the no-action alternative (Table 4-8).
Table 4-24. Annual dose (percent change from the no-action alternative) and associated excess latentcancer fatalities from incident-free onsite transport of radioactive material for alternative A – expectedwaste forecast.
waste streams of a particular waste type. ISee Section 4.1.11.2 for descriptions of the receptors.Totals were rounded to two significant figures.Assumes the same individual bas maximal exposure to each waste Vpe (Appendix E) for a single year.Dose from 1 yea of exposure to incident-free transportation of treatability groups (see Appendix E).Additional probability of an excess latent cancer fatality.Value eauals the total dose x the risk factor (0.0004 excess latent fatal cancers per person-rem).
Doses from incident-free offsite shipments of mixed wastes were calculated as in Section 4.1.11.2 using
calculated external dose rates 1 meter (3.3 feet) from the transport vehicle for each waste and package
type (HNUS 1995a). Additionally, occupational exposure time depends on the number of shipments and TE
how long it takes to load each transport vehicle. The results are shown in Table 4-25.
4-103
DOE/EIS-0271July I 995
Table 4-25. Annual dose and excess latent cancer fatalities from incident-free offsite transport of mixed
waste under alternative A – expected waste forecast.Involved workersa Remote MEIb Remote population
Waste (person-rem) (rem) (person-rem)
Mixed 0.012C 3.2x 1o-8c 2,5x 10⁻³c
Excess latent cancer fatalities 4.8x10⁻⁶ 1.6x10-lld I,3x1o-6
a. See Section 4.1.11.2 for descriptions of the receptors.b. MEI=maximally exposed individual.
a. The accident probabilities under the no-action alternative are the same as for the expected waste forecast. SeeAppendix E for numbers of shipments,
4-104
DOE/EIS-0271July 1995
Table 4-27. Annual accident probability, doses associated with an accident, and excess latent cancerfatalities from an accident during offsite transport of m ixed waste under alternative A.
Accident probabilities Remote population
Minimum Expected Maximum doses Number of latentWaste forecast forecast forecast (person-rem) cancer fatalities
For the minimum waste forecast, there would be decreases in dose (Table 4-28) to all onsite receptors
compared to those from the expected waste forecast due to the smaller volumes of all wastes shipped
onsite,
Table 4-28. Annual dose (percent change from the expected waste forecast) and associated excess latentcancer fatalities from incident-free onsite transport of radioactive material for alternative A –minimum
Excess latent cancer fatalities 2.3x lo-6f 4.2x lo-4g o.057g
b.c.d,e.f.
g.
TC
TCTE
a. See Appendix E for a list of waste streams which makeup each waste VP. Dose is based on exposure to all
TE
waste streams of a particular waste type.See Section 4. J. 11.2 for descriptions of receptors.Totals rounded to two significant figures.Assumes the same individual has maximal exposure to each waste type (Appendix E) for a single year..
Dose from 1year of exposure to incident-free tmuspor’tation of treatability groups (see Appendix E).
Additional probability of an excess fatal cancer.Value equals the total dose x the risk factor (0.0004 excess latent fatal cancers per person-rem).
4-105
DOE/EIS-0271July 1995
For the minimum waste forecast, impacts from incident-free offsite transportation of radioactive
materials (Table 4-29) would be very small.
Table 4-29. Annual dose and excess latent cancer fatalities from incident-free offsite transport of mixed
waste for alternative A – minimum waste forecast.
Involved workersa Remote MEIb Remote population
Waste (person-rem) (rem) (person-rem)
I MixedTC
5.2x1w3C I.4x1o-8c I. IX1O-3C
Excess latent cancer fatalities 2.1x1 o-6 7.oxlo-12d 5.5 XI0-7
a. See Section 4.1.11.2 for descriptions of receptors.b. MEI = maximally exposed individual.
TE \ C. Dose for the remote MEI assumes exposure to each waste in a year; for the population, dose is the result ofexposure to 1 year of incident-free transportation of treatability groups (see Appendix E).
d. Additional probability of an excess latent fatal cancer,
Transportation Accident Impacts
The probability of an onsite accident involving radioactive wastes would decrease slightly for the
minimum waste forecast (Table 4-26) because less waste would be shipped compared to the expected
waste forecast; however, the consequences due to an accident would be the same as described in
SectiOn 4.1.11 .2.2.
Effects of offsite accidents would be the same as for the expected waste forecast; however, the
probability of an offsite accident would decrease by about one-third compared to the expected waste
forecast because of the smaller volumes of wastes shipped (Table 4-27).
Min. EXP, Max.NOAction
A
B
@
4.2.11.2.3 Transportation – Maximum Waste Forecastc
Incident-Free Radiological Impacts
For the maximum waste forecast, there would be large increases in dose to all receptors (Table 4-30) due
to the increases in volumes of al 1wastes shipped.
mixed waste (Table 4-3 1) would be very small.
Impacts from incident-free offsite transportation of
4-106
DOE/EIS-0271July 1995
Table 4-30. Annual dose (percent change from the expected waste forecast) and associated excess latent
cancer fatalities from incident-free onsite transport of radioactive material for alternative A – maximum
a. See Appendix Eforalistofwaste stieams which m&eupeachwaste~pe, Dose is based onexposure to allwaste streams of a particular waste type.
b. See Section 4,1.11 .2 fordescriptions of receptors.c. Totals rounded totwosigniticant figures.d. Assumes tiesame individual hasmaximum exposure toeachwaste ~pe(Appendix E) forasingle year.e. Dose from 1 yearofexposure toincident-free transpofiation ofwaste (see Appendix E).f. Additional probability ofanexcess fatai cancer.g. Value equals thetotal dose xtherisk factor (O.0004excess latent fatal cancers perperson-rem).
TC
TE
Table 4-31. Annual doseand excess latent cancer fatalities from incident-free offsite transpofl of mixedwaste for alternative A – maximum waste forecast.
Involved workersa Remote MEIb Remote population
Waste (person-rem) (rem) (person-rem)
Mixed 0.031C 8.2x 10⁻⁸C 6.3x 10⁻³c
Excess latent cancer fatalities I.2x1o-5 4.lxlo-lld 3.2x I0-6 I LOO4-10
a. See Section 4.1.11 .2 fordescriptions of receptorsb. MEI=maximally exposed individual.c. Dose fortheremote MElassumes exposure toeachwaste inayea6for thcpopulation, dose istieresultof 1 TE
exposure to 1 year ofincident. free transportation ofwaste (see Appendix E).
d. Additional probability ofanexcess latent fatal cancer.
Transportation Accident Impacts
The probability of an on site accident involving radioactive wastes would increase for the maximum
waste forecast (Table 4-26) because more waste would be shipped compared to the expected waste
forecast; however, the consequences due to an accident would be the same as described in Section
4,1.11.2.2. Effects ofoffsite accidents would bethesame as fortheexpected waste; however, tbe
probability of an offsite accident would be three times greater than that in tbe expected waste forecast
because of the larger volumes of wastes shipped (Table 4-27).
4-107
DOE/EIS-0271July 1995
4.2.12 OCCUPATIONAL AND PUBLIC HEALTH
Radiological and nonradiological impacts to workers and the public are presented in this section for the
three waste forecasts. Asexpected, theimpacts aresmallest fortbeminimum waste forecast and largest
for the maximum waste forecast.
Under this alternative, the Consolidated Incineration Facility, the transuranic waste characterization/
certification facility, the mixed waste containment building, compaction facilities, andthe mobile soil
sort facility would operate. These facilities and changes in waste management would result inan
increase inadverse health effects over the no-action alternative for the three waste forecasts. However,
the effects would besmall overall, except to involved workers under the maximum waste forecast,
The waste management operations that produce most of the occupational and public health effects are as
follows:
. Fortheinvolved workers, thesources oflargest exposure would bethetransuranic waste storage
pads, the H-Area high-level waste tank farm, and the transuranic waste characterization/
certification facility.
o Forthepublic anduninvolved workers, thesources oflargest exposure would he the Consolidated
incineration Facility andthetransuranic waste characterization/cefiificationfacili~. (Doses and
health effects for the Consolidated Incineration Facility are presented in Appendix B,5,)
. Forthepublic only, the F/H-Area Effluent Treatment Facili~would bethesource of greatest
exposure.
For radiological assessments, the same general methodology was used as under the no-action alternative
(see Section 4.1.12). Thesame risk estimators were used toconveti doses to fatal cancers, andwastes
were classified into treatability groups to facilitate the evaluations. However, thedevelopmentof
radiological source terms andworker exposures wasmuch more involved. Thereleases of radioactivity
totheenvironment andtheradiation exposures ofworkers were detemined foreach waste forecast. The
expected performance of new facilities was based on actual design information, augmented as necessary
by operating experience with similar facilities,
4-108
DOEEIS-027 IJuly 1995
Radiological impacts of facility operations were estimated for the 30-year period of analysis based on
total material throughput. Annual impacts to workers and the offsite population were estimated by
dividing the total 30-year impact by 30.
Min. EXP. MaxNOAction
A
a
@
4.2.12.1 Occerr)at ional and Public Health – ExDected Waste Forecastc
For alternative A – expected waste forecast, the volumes of wastes to be treated would be the same as
under the no-action alternative.
4.2.12.1.1 Occupational Health and Safety
Table 4-32 presents the worker doses and resulting health effects associated with the expected waste
forecast. Doses would remain well within the SRS administrative guideline of 0.8 rem per year, The
probabilities and projected numbers of fatal cancers from 30 years of waste management operations
under this alternative would be much lower than those expected from all causes during the workers’
lifetimes. It is expected that there could be 0.86 additional fatal cancer in the workforce of 2,123, In
comparison, the lifetime fatal cancer risk from all causes is 23.5 percent (refer to Section 4.1.12.1),
which translates to a 1 in 4 chance of any individual (including a worker) contracting a fatal cancer, or
499 fatal cancers in the workforce of 2,123.
Nonradiological Impacts
DOE considered potential nonradiological impacts to SRS workers from air emissions from the
following facilities: the Defense Waste Processing Facility, including In-Tank Precipitation; the M-Area
Vendor Treatment Facility; the Consolidated Incineration Facility; Building 645-N, hazardous waste
storage; Building 645-2N, mixed waste storage; the mobile soil sort facility; four new solvent tanks; the
transuranic waste characterization/certification facilitfi and the mixed waste containment building,
Occupational health impacts to employees at the Defense Waste Processing Facility and In-Tank
Precipitation were discussed in the Final Supplemental Environmental Impact Statement Defense Waste
Processirrg Facili@. Occupational health impacts to employees associated with the Consolidated
TE
I l-c
4-109
Table 4-32. Worker radiological doses and resulting health effects associated with implementation of alternative A.aFu.- g
ReceDtotis) alternative Expected Minimum Maximum 0./5
Individual involved worker
. Average annual dose (rem)b
. Associated probability ofa fatal cancer
. 30-year dosetoaverage worker (rem)
TC I - Associated probability ofafatal cancer
All involved workersc
. Annual doseb (person-rem)
. Associated number of fatal cancers
. 30-year dose(person-rem)
. Associated number of fatal cancers
Individual uninvolved workerb,d
?
I . Annual doseatlOOmeteF (rem)s0 (associated probability of a fatal cancer)
I . Annual doseat640meters (rem)TC (associated probability of a fatal cancer)
I ● 30-year doseatlOOmeters (rem)(associated probability of a fatal cancer)
. 30-year doseat640meters (rem)(associated probability of a fatal cancer)
0.025
1.OXIO-5
0.75
3.OXIO-4
52
0.021
1,600
0.62
1.OX1O-5
(4. IX IO-9)
2.9x10⁷
(1.lxlo-lo)
3.OXIO-4
(1.2x I0-7)
8.6 X1O-’5
(3.4x 1o-9)
0.033
1.3XI0-5
0.99
4.OX10-4
70
0.028
2,100
0.84
0.0054
(2.1x1 o-6)
l,6x10-4
(6.2x I0-8)
0.16
(6.4x 1O-5)
0.0047
(1.9x I0-6)
0.032
1.3X1O-5
0.96
3.9 X1O-4
67
0.027
2,000
0.81
3.7 XI0-3
(1.5xI0-6)
1.1X1O-4
(4.3 x1o-8)
0.11
(4.5 XI0-5)
0.0033
(I.3x1o-6)
0.047
I.9X1O-5
I .4
5.7 X1O-4
113
0.045
3,400
I .4
0.088
(3.5 X1O-5)
0.0026
(1.oxIo-6)
2.7
0.0011
0.077
(3.1 X1O-5)
a. Supplemental faciliV infomation isprovided in Appendix E.b. Annual individual worker doses can becompared witithe regulator dose limit of5rem(l 0CFR835) andwith the SRSadminisEative exposure
guideline of O.8rem. Operational procedures ensure thatthe dosetothe maximally exposed worker remains as far below theregulatow dose limit as isreasonably achievable.
c. The number of involved workers is estimated to be 2,123 for the expected waste forecast 2,104 for the minimum waste forecast, and 2,379 for themaximum waste forecast.
d. Dose isdueto emissions from the&ansuranic waste characterimtionlce flification facili~except fortheno-action alternative. Doses conservativelyassume 80hours perweek of exposure. Exposures forawpical 40-hour work weekwould beapproximately 50percent ofdoses given in the table.
e. Tocnnvert to feet, multiply by3.28.
DOE/SIS-0271July 1995
Incineration Facility were discussed in the Environmental Assessment, Consolidated Incineration
Facili~ (DOE 1992).
Table E,2-2 in Appendix E presents a comparison between Occupational Safety and Health
Administration permissible exposure limit values and potential exposures to uninvolved workers at both
100 meters (328 feet) and 640 meters (2, 100 feet) from each facility for the expected, minimum, and
maximum waste forecasts, Downwind concentrations were calculated using EPA’s TSCREEN model I TE
(EPA 1988). For each facility’s emissions, based on tbe expected waste forecast, uninvolved workers
occupational exposure would be less than Occupational Safety and Health Administration permissible
exposure limits. In most instances, downwind concentrations would be less than 1 microgram per cubic TE
meter, whereas the Occupational Safety and Health Administration Iim its are greater than
2,000 micrograms per cubic meter,
4.2.12.1.2 Public Health and Safe~
Radiological Impacts
Table 4-33 presents the radiological doses to the public and the resulting health effects associated with
the expected waste forecast. The annual doses to the offsite maximally exposed individual
(0.012 millirem) and to the regional population (0,57 person-rem) surrounding SRS are small fractions of
the doses that resulted from SRS operations in 1993, which were well within regulatory limits (Amett,
Karapatakis, and Mamatey 1994), For the offsite facility (assumed to be located in Oak Ridge,
Tennessee, for the pu~oses of this assessment) under this forecast, the annual doses to the offsite
maximally exposed individual (5. 1x 10⁻⁷ millirem) and to the regional population (2.3x 10⁻⁷ person-rem)
surrounding Oak Ridge, Tennessee, represent a very small fraction (less than 0.0 I percent) of the
comparable doses to the SRS regional population. These doses remain less than 0.0 I percent of the
comparable SRS doses for all waste forecasts under this alternative (see Appendix E for facility-specific
data). For this waste forecast, radiologically induced health effects to the public would be very small
(Table 4-33).
Nonradiological Impacts
TC
Potential nonradiological impacts to individuals residing offsite were considered for both criteria and
carcinogenic pollutants. Maximum SRS boundary-line concentrations for criteria pollutants are
discussed in Section 4.2.5.1.2.
4-III
Table 4-33. Radiological doses associated with implementation of alternative A and resulting health effects to the public.a ::
No-action alternativem
Alternative A =R
Doseb Dose := ~
ProbabilityN
AtmosphericProbabilityd -
Aqueous or number of Atmospheric Aqueous or number of
Waste forecastlreceptor(s)c releases releases Total fatal cancers releases g releases Total fatal cancers
ExDected waste fOreCaSt
Oftsite MEIe. Annual, millirem 4. IX1O-10
1.2x I0-8
0.011
0.336.9x10-40.02}
0.0120.35
5.8x I0-9
1.7XI0-7
1.2X10-40.0037
6.9x I0-4
0.021
8. IXIO-40.025. 30 years, millirem
POpulatiOD. Annual, person-rem 0.56
17
0.0068
0.20
0.57
17
2.8x10⁻⁴
0.00852.9x 10-40.0086
0.0068
0.20
0.00710.21
3.5x I0-6
1.1X1O-4. 30 years, person-rem
Minimum waste forecastOffsite MEI
. Annual, millirem NA
NA
0.0057
0.17
0.0064
0.19
3.2xI0-9
9.6xI0-8
NAf
NA
NA
NA
6.9x 10⁻⁴
0.021. 30 years, millirem
Population. Annual, person-rem 0.27
8.2
0.0068
0.20
0.28
8.4
1.4XI0-4
0.0042
NA
NA
NA
NA
NA
NA
NA
NA. 30 years, person-remMaximum waste forecast
Offsite MEI. Annual, millirem
. 30 years, millirem
NA
NA
NA
NA
NA
NA
NA
NA
0.08
2.46.9x I0-4
0.02 r0.0812.4
4. IXIO-8
1.2x I0-6
PODulatiOn3.4 0.0017
0.052. Annual, person-rem NA NA NA NA 3.4 0.0068
. 30 years, person-rem NA NA NA NA 100 0.20
Suuulementai facilitv information is provided in Appendix E.
100
a.
b.
c,
d.
e.
K-—
Fo~ atmospheric rel~uses,the dose is;o the poptda~on within 80 kilDmetelS(50 miles) of SRS. For aqueDus releases, tbe dose is to the people using tbe Savannah River
from SRS’to tbe Atlantic Ocean.
Tbe doses to tbe public from total SRS operations in 1993 were 0.25 millirem to tbe offsite maximally exposed individual and 9.1 person-rem to tbe regional population.These doses. when added to the incremental doses associated with the waste mana~ement alternative given in this table, are assumed to equal total SRS doses. Source:
Amett, Karapatakis, and Mamatey ( 1994).
For the offsite maximally exposed individual, probabilig of a latent fatal cancer; for tbe population, number of fatal cancers.MEI = maximatty exposed individual.
Atmospheric releases for MEI and population include contribution from off-site facilities, wbicb contribute less than 0.01 % to tbe atmospheric releases repofled here.
DOE/EIS-0271July 1995
For routine releases from operating facilities under the expected waste forecast, criteria pollutant
concentrations would be within state and federal ambient air quality standards, as discussed in
Section 4.2,5.1.2, and health impacts to the public would be very small.
Offsite risks due to carcinogens were calculated using the Industrial Source Complex 2 model (Stewart
1994) for the same facilities listed in Section 4.2.12.1.1, Emissions of carcinogenic compounds were
based on the types and quantities of waste being processed at each facility. Table 4-34 shows the excess
individual lifetime cancer risks calculated from unit risk factors (see Section 4.1. 12.2.2) derived from
EPA’s Integrated Risk Information System database (EPA 1994). As shown in Table 4-34, the estimated
incremental lifetime cancer risk associated with routine emissions under the expected waste forecast is 2
in ten million. This is the same as that for the no-action alternative and represents a small overall
increase in risk,
4.2.12.1.3 EnvironmentalJustice Assessment
Section 4.1.12.2.3 described DOE’s methodology for analyzing radiological dose to determine if there
might be adverse and disproportionate impacts on people of color low income, Figure 4-15 illustrates
the results of the analysis for alternative A – expected waste forecast for the 80-kilometer (50-m ile)
region of interest in this EIS. Supporting data for the analysis can be found in Appendix E.
I ‘E
The predicted per capita dose differs very little between types of communities at a given distance from I TC
SRS, and the per capita dose is extremely small in each type of community. This analysis indicates that
people of color or with low incomes in the 80-kilometer (50-mile) region would be neither
disproportionately nor adversely affected.
Min. EXP, Mm,No nActIon
A
B
B
4.2.12.2 Occuuat onali -blic Health - Minimum Waste Forec astc
Because the waste amounts for alternative A – minimum waste forecast would be smaller than for the
expected waste forecast and the treatment operations would be the same, the impacts to workers and the
public would be smaller than described for the expected waste forecast,
4-113
TC
Table 4-34. Estimated number of excess latent cancers in the offsite population from nonradiological carcinogens emitted under alternative A. :8
Concentrationb,c Latent cancersd Ga:7
f_lnitrisk factora Expected waste Minimum waste Maximum waste z(latent cancersl
Pollutant(Utim3)e
Acetaldehyde 2.2x I0-6
Acrylamide
Acrylonitrile
Arsenic Pentoxide
Asbestos
Benzene
Benzidine
Bis(chloromethyl)ether
Bromoform
Carbon Tetrachloride
Chlordane
Chlorofoml
Cr(+6) Compounds
Formaldehyde
Heptachlor
Hexachlorobenzene
Hexachlorobutadiene
Hydrazine
1,1,2,2-Tetrachloroethane
1,1,2-Trichloroethane
Toxapbene
1,1-Dichloroetherre
Methylene Chloride
0.001
6.8x10⁻⁵
0.004
0.23
8.3x I0-6
0.067
0.062
1.IXIO-6
l,5xlo-5
3.7 XI0-4
2.3x I0-5
0.012
I.3X1O-5
0.0013
4.6x1 O-4
2.2 X10⁻⁵
0.0049
S.8X10-5
1.6x10⁻⁵
3.2x I0-4
5.OX1O-5
4,7 X1O-7
forecast forecast forecast Expected Minimum Maximum S
Low-level waste a Mixed waste Transuranic waste a High-level waste
ELegend:
■ Anticipated accicie”ts
❑ Unlikely accidents
❑ Extremely unlikely accidents
❑ Beyond-extremely-unlikely accidents
Notes
a. No beyond-extremely-unlikely accidents were identified tor low-level o, transuranic wastes.
TC
.1Figure 4-19. Summary of radiological accident impacts to the offsite maximally exposed individual for alternative A – expected waste forecast,
-.TE%5
1.0
0.1
0.01
0.001~ 1X1 O-4 [
+1X1 O-5 I
1x1o-6
IXIO-7
IxIo-8
1X1 O-9
,X, o-lo
,X, o-n
,X, o-lz,
,X,0-13.
IXIIJ-14
IXIIJ-15.
Low-level waste a Mixed waste Transuranic waste a
Legend:
■ Anticipated accidents
❑ Unlikely accidents
❑ Extremely unlikely accidents
H Beyond-extremely-unlikely accidents
-1High-level waste a
Notes:
a. Nobeyond. extremely-unfikely accidents were identified for low-level, fransuranic, or high-level wastes.
i
PK56-31
ITE F~gure4-20. Summa~ of radiological accident impacts to the uninvolved worker within 640 meters (2,100 feet) for alternative A – expectedwaste forecast.
1.0
0.1
0.01
~ 0.001>& 1X1 O-4n~
1X1 O-5E~ 1x1o-6
:g 1X1 O-7
~
s 1xl 0-8
alzE
1X1 O-9.=
; 1X1O-10
E.-Ixlo-11
2
lxlo-fz
lXIO-13
Low-Level Waste a Mixed Waste Transuranic Waste a High-Level Waste
E
❑ Extremely unlikely accidents
❑ Beyond-extremely-unlikely accidents
Notes:a. No beyond-extremely-unlikelyaccidentswere identifiedfor low-levelor transuranicwastes.
mu. . .. ..3,,..”-. , :- ~
Figure 4-21. Summary of radiological accident impacts to the uninvol ved worker within 100 meters (328 feet) for alternative A – expected waste ~ y ~~~
forecast.
TC I
TE ]
DOE/EIS-0271July 1995
risks presented are different, the multiplication factor is the ratio of the two values (i.e., higher estimated
risk divided by smaller estimated risk). ArTOWSindicate the alternative A risks that are larger than the
no-action risks.
Table 4-35. Comparison of risks from accidents under the no-action alternative and alternative A.
Estimated risks
Receptor Waste typeb No-action alternative Alternative A Change factorc
Population within Low-level waste 0.017 0,017 I .0
a. Increased risk of latent fatal cancers per year,b. Waste types are described in Appendix F.c. Change factors represent the multiplication factor rtquired to equate no-action alternative risks to alternative A risk (e.g.,
no-action risk times change factor equals alternative A risk), The up arrow (~) indicates that the alternative A risk is
A complete summary of all representative bounding accidents considered for alternative A is presented
in Table 4-36, This table provides accident descriptions, annual frequency of occurrence, increased risk
of latent fatal cancers for al 1receptor groups, and the waste type associated with the accident scenario.
Details regarding the individual postulated accident scenarios associated with the various waste types are
provided in Appendix F,
Table 4-37 presents for each waste considered a summary of the them ical hazards estimated to exceed
ERPG-2 values for the uninvolved worker at 100 meters (328 feet), For this worker, seven chemical
release scenarios would exceed ERPG.3 values. Moreover, another five chemical release scenarios
would have estimated airborne concentrations that exceed ERPG-2 values where equivalent ERPG-3
values were not identified, For the offsite maximally exposed individual, no chemical release scenario
4-126
Table 4-36. Summary of representative bounding accidents under alternative A.a
Increased risk of latent fa[al cancers per yearb
MaximallyAffected waste Frequency Uninvolved worker Uninvolved worker
Accident Description
exposed offsite Population wilbin
typesc (per year) at I 00 meters at 640 meters individual 80 kilometers
RHLWEd release due to a feed line break High-1evel o.07e I .79X 10-5 6.38x10⁻⁷ L32x I0-7 6.34x 10⁻⁴
RHLWE release due to a design basis earthquake High-1evel 2.00x Io-4f 1.54.10-6 5.46x 10⁻⁸ 1.12.10-9 5.43x10⁻⁵
RHLWE rcleue due to evaporator pressurization and breech High-1evel 5.09. I O-jg 1.95x I o-6 3.46.10-8 7.13.10-10 3.44.10-5
Design basis ETFh airborne release due to tornado High-1evel 3.69.10-71 3.20.10-13 1.02X10⁻¹⁴ 7.20.10-15 6.35.10-14
Container breach at the ILNTVJ Low-1.,.1 0.02. 0.00104 1.84x 10⁻⁵ 3.31 .10-7 0.0168Mixed
High wind at the ILNTV Low-1evel O.oolf 4.04.10-10 2.43x10-lo 1.52x10-lo L06x10-5
Tornado at the ILNTV Low-1evel2.ooxlo-5g 3.26.10-12 6.18.10-10 L18x10 -lo LJ8x10-7
Release due to multiple open containers at the containment Mixed o.oo3f 4.69x 10⁻⁷ 6.91.10-7 1.22.10-8bui!di”g
5.70 XI0-4
F3 tomadok at Building 316-M Mixed 2.80, 10-5g s.35.10-12 1.29x 10⁻⁹ 1.65x 10⁻⁹ 1.12.10-9
Aircraft crash at the containment b“ildi.g Mixed 1,60. 10-7i 9.73x J0-lof
3.46.10-11 6.66x I 0-13 3.19.10-8
s De flagratio” in culverl during TRUI retrieval activities Trans. ra”ic o.o]e 8.96x 10⁻⁴ I .59x 10-5 2.86.10-7 1.45.10-2
Fire i. culvefi at the TRUlwaste stocagepads (O”C drum i“ Tra”s”ranic 8. 10x 10-4f 3.07.10-4 5.48x 10⁻⁶ 9.84x 10⁻⁸ 0.00498
culvert)
Vehicle crash with resulting fire at the TRUlwaste storage Trans” ra” ic6.50. 10-5g 4,47.10-6 7.96x 10⁻⁸ L43XI0-9
pads7.25x 10-5
a.b.
c.
d.
e.f.
gh.
i.
jk.
A complete description and analysis of the rcprcsc”tative bounding accidents are presented in Appendix F.lncre~ed risk of fatal ca”cct’s per year is calculated by multiplying the [consequence (dose) x latent cancer conversion factor] x annual frequency. For dose consequences and Iale”t
cancer fatalities per dose, see tables in Appendix F.The waste type for which tbe accident scenario is identified as a representative bounding accidenL A rcpresentati.e bounding accident may be ide”titied for more than OIIe waste
type. These waste types are high-level, low-level, mixed, and transura”ic.Replacement High-Level Waste Evaporator.The frequency of this accident scenario is within lhe anticipated accident range.
The frequc”cy of this accidc”t scenario is within the unlikely accident range.The frequency of this accident scenario is within tbe extremely unlikely accident range.
F~.Area Eftl”ent Treatment Facility.
The freq”e”cy of this accident scenario is within beyond extremely unlikely accidc”t range. u
lntenncdiate-Levet Nontriti.m Vault.o
F3 tornadoes have rotational wind speeds of 254 to 33 I kilometers ( 158 to 206 miles) per hour. ~fi
TE I
TE I
DOE/EIS-0271
July 1995
Table 4-37. Summary of chemical hazards associated with alternative A estimated to exceed ERPG-2values.
I 00-meter 640-meter OffsiteAppendix F concentration concentration concentration ERPG-2C ERPG-3
Chemical name table reference” (mg/m3)b (mg/m3) (mg/m3 )
Nitric acid F-6
(mtim3) (m.e/nr3)
830a IOoc 2 39 77
Nitrogen dioxide
Oxalic acid
Nitric acid
Benzene
Cadmium
Chromium
Lead
Mercuw
Methyl ethyl ketone
Beryllium
Cadmium
Ch(orofom
Chromium
Copper
Lead
Lead nitrate
Mercuric nitrate
Mercury
Nickel nitrate
Silver nitrate
Sodium chromate
Toluene
Uranyl nitrate
F-7
F-7
F-7
F-17
F-17
F-17
F-17
F-17
F-17
F-25
F-25
F-25
F-25
F-25
F-25
F-25
F-25
F-25
F-25
F-25
F-25
F-25
F-25
79.6f
276
Is]d
670
2.7
2.7
160
15
1,80ctd
16.7d
333d
8,330d
16,7
66.7
667
16.7
16,7
16,7
16.7
16.7
16.7
8,330d
16.7
0.339
1.18
0.771
(0
(0
(f)
(f)
(f)
(f)
(0
(0
(0
(0
(0
(f)
(f)
(fl
(0
(0
(f)
(9
(f)
(0
0.159”
0.552
0.361
0.42
0.0017
0.0017
0.10
0.0094
1.1
0.00823
0.165
4.11
0.00823
0.0329
0.329
0.00823
0.00823
0.00823
0.00823
0.00823
0.00823
4.11
0.00823
1.88
5.00
38.7
160
0.25
2.5
0.25
0.20
845
0.01
0.25
488
2.5
5.0
0.25
0.25
0.2
0.2
5
0.5
0.25
754
0.25
54.6
500
77,3
9,6oo
500
(g)700
28
1.01%104
10
50
4,880
(8)
(g)700
700
28
28
(g)
(g)30
7,450
30
a. Analyses rcgardi”g specific chemical releases are provided in the referenced Appendix F tables,h. Milligrams per cubic meter of air.c, Emergt”cy Rcspo”se Planning Guidelines.d. Concentration at 100 meters exceeds ERPG.3 concentration.e. Concentration at 640 meters exceeds ERPG.3 concentration.f, Airborne concentrations at 640 meters (2, 100 feet) were “ot available from existing safety documentation.g. No cq”ivalent value found,
would have airborne concentrations that exceed ERPG-3 values. In fact, in only one instance would a
chemical release scenario have an airborne concentration that exceeds an ERPG-2 value for the offsite
maximally exposed individual (release of lead; see Table F-25 in Appendix F). Appendix F provides
further detail and discussion regarding chemical huards associated with each waste type,
In addition to the risk to human health from accidents, seconda~ impacts from postulated accidents on
plant and animal resources, water resources, the economy, national defense, contamination, threatened
and endangered species, land use, and Native American treaty rights are considered, This qualitative
4.128
DOE/EIS-0271
July 199S
assessment (see Appendix F) detemrined that no substantial impacts would result from accidents for
This section discusses the effects of alternative C – expected waste forecast on grorsndwater resources at
SRS. Effects can reevaluated bycomparing tlledoses from contaminants predicted toenterthe
groundwater from each alternative andwaste forecast. Effects ongroundwater resources under the
no-action alternative (Section 4.1.3) form the basis for comparison among the alternatives and are
referenced in this section,
Operatiol~ and impacts of the M-Area Air Stripper and the F- and H-Area tank farms would be the same
as for the no-actinn alternative.
For this forecast, and as noted in Section 4.1,3, releases to the groundwater from RCRA-pemritted
disposal vaults would be improbable during active maintenance; however, releases cnuld eventually
occur after loss ofinstitutional contrnl a]lddegradatioll oftlle vaults, Impacts from the RCRA-permitted
disposal vaults would be similar to the effects under the no-action alternative (Section 4, 1.3).
There would be 11 fewer additional low-activi& andintermediate.level radioactive waste disposal vaults
(4)than under theno-action alternative (15), Modeling hasshnwnt hatanyr eleasesf romthesevaults
would not cause groundwater standards to be exceeded during the 30-year planning period or the
100-year institutional control period oratany tilneafter disposal (Toblin 1995). Asinthe no-action
alternative, the predicted concentrations of tritium would be a very small fraction of the drinking water
standard. The discussion in Sectio114.1 .30nt11e basis oft11e41nilliren1 stat] dardisapplicable to this
case. Forthis waste forecast, ilnpacts togrouildwater resources frolndisposal vaultswould be similar to
the impacts under the no-action altemativc.
4-138
DOE/EIS-0217July 1995
For this waste forecast, 123 additional slit trenches would be constructed. SJnder this alternative, waste
disposed in slit trenches would be stabilized (ashcrete, glass, smelter ingots), These disposal activities
would be subject to completion of performance assessments and demonstration of compliance with the
performance objectives required by DOE Order 5820,2A. Therefore, DOE has conservatively assumed
that groundwater concentrations as a result of radioactive releases from the RCRA-permitted vaults and
all other low-level waste disposal facilities (vaults and slit trenches) would remain within the DOE
performance objective of 4 millirem per year adopted by DOE in Order 5400,5,
In summary, impacts to groundwater from alternative C – expected waste forecast would be similar to
the impacts under the no-action alternative,
Min SXp. MaxNOAction
A
B
&
4.3.3.2c
Groundwater Resources - Minimum Waste Forecast
For alternative C – minimum waste forecast, and as noted in Section 4,1,3, releases to the groundwater
from RCRA-permitted disposal vaults would be improbable during active maintenance; however,
releases could eventually occur after loss of institutional control and degradation of the vaults. Impacts
from the RCRA-permitted disposal vaults would be similar to the effects under the no-action alternative
(Section 4.1 .3).
There would be 12 fewer additional low-activity and intermediate-level radioactive waste disposal vaults
(3) than under the no-action alternative (15). Modeling has shown that the 4 millirem per year drinking
water standard would not be exceeded by any radionuclide (Toblin 1995). Impacts to groundwater
resources from disposal vaults, including minimal doses from tritium would be similar to thnse under the
no-action alternative.
There would be less disposal of radioactive waste by shallow land disposal (45 additional slit trenches
compared to 123 for the expected waste forecast). Under this alternative, waste disposed in slit trenches
would be stabilized (ashcrete, glass, smelter ingots). These disposal activities would be subject to
completion of performance assessments and demonstration of compliance with the performance
objectives required by DOE Order 5820.2A. Therefore, DOE has conservatively assumed that
groundwater concentrations as a result of radioactive releases from the RCRA-permitted vaults and all
other low-level waste disposal facilities (vaults and slit trenches) wnuld remain within the DOE
performance objective of 4 millirem per year adnpted by DOE in Order 5400,5.
4-139
TC
TCTE
TE
TC
TCTE
TE
TC
TC
TC
DOE/EIS-0217Iuly 1995
[n summary, impacts to groundwater from alternative C – minimum waste forecast would be similar to
the impacts discussed under the no-action alternative (Section 4.1.3).
%. Sxp.Mu.NoAction
A
a
@
4.3.3.3 Groundwater Resources - Maximum Waste Fore@c
For this forecast, and as noted in Section 4.1.3, releases to the groundwater from RCRA-permitted
disposal vaults would be improbable during active maintenance; however, releases could eventually
occur after loss of institutional control and degradation of the vaults. Impacts from the RCRA-permitted
disposal vaults would be similar to the effects under the no-action alternative (Section 4.1.3).
There would be seven fewer additional low-activity and intermediate-level radioactive waste disposal
vaults (8) than under the no-action alternative (15). Modeling has predicted that the 4 millirem per year
drinking water standard would not be exceeded for any radionuclide at any time after disposal (Toblin
1995). The impacts of the vaults in this case would be similar to those impacts in the no-action
alternative (Section 4.1 .3).
For alternative C – maximum waste forecast, there would be 576 additional slit trenches. Under this
alternative, waste disposed in slit trenches would be stabilized (ashcrete, glass, smelter ingots). These
disposal activities would be subject to completion of performance assessments arrd demonstration of
compliance with the performance objectives required by DOE Order 5g20.2A. Therefore, DOE has
conservatively assumed that groundwater concentrations as a result of radioactive releases from the
RCRA-perrnitted vaults and all other low-level waste disposal facilities (vaults and slit trenches) would
remain within the DOE performance objective of 4 millirem per year adopted by DOE in Order 5400.5.
In summary, impacts to groundwater from alternative C – maximum waste forecast would be similar to
tbe impacts under the no-action alternative (Section 4. 1,3) and those for the expected waste forecast of
this alternative (Section 4.3.3. 1).
4-140
DoS/EIS-0217July 1995
4.3.4 SURFACE WATER RESOURCES
Mi.. Exp, %.NoAction
A
B
@ ‘ater - ‘wasteForecast
4.3.4.1c
- ExDecte
The extensive treatment configuration would use the treatment facilities presently available or being
installed at SRS and several new facilities, Of the three alternatives, alternative C would treat waste
most extensively prior to disposal. Impacts can be compared between the alternatives by evaluating the
pollutants that would be introduced to the surface waters. The 4-millirem-per-year drinking water
standard would not be exceeded for any radionuclide (Toblin 1995).
Under this alternative, the Consolidated Incineration Facility would operate until the non-alpha
vitrification facility began operating. The incinerator would not discharge wastewater (blowdown)
because it would be treated in the ashcrete process, and the stabilized ash and blowdown would be
disposed of in RCRA-permitted disposal vaults or sent to shallow land disposal as discussed in
Section 4.3.3.1.
The Replacement High-Level Waste Evaporator would evaporate the liquid waste from the high-level
waste tanks in the F- and H-Area tank farms (as noted in the no-action alternative), It would be used in
the same manner as the present F- and H-Area evaporators, with the distillate being sent to the F~-Area
Effluent Treatment Facility for treatment prior to being discharged to Upper Three Runs. The
concentrate from the evaporator would be sent to the Defense Waste Processing Facility for vitrification.
Since the Replacement High-Level Waste Evaporator would be used in the same manner as the existing
evaporators and would produce a distillate similar in composition to the present distillate, the effect of
the effluent on Upper Three Runs would be the same as it is now.
DOE would also construct two vitrification facilities. The wastewater from both vitrification facilities
would be treated at dedicated wastewater treatment facilities using an ion-exchange process, and the
treated water would be recycled to each vitrification facility. Wastewater from the containment building
would be transferred to the non-alpha vitrification facility for treatment and disposal. Wastewater would
not be discharged to a surface stream.
Investigation-derived waste from groundwater wells that contained volatile organic compounds would be
collected and treated by the M-Area Air Stripper. Since this water would be similar in composition to
4-141
TC
TE
TE
DOE~lS-0217July 1995
the groundwater presentIy being treated by the M-Area Air Stripper, surface waters would not be
affected by the discharge of additional treated water.
As discussed in Section 4.2.4.1, additional wastewater would be treated in existing SRS facilities without
exceeding the design capacity of any facility.
DOE would construct new facilities and additional storage buildings, pads, and vaults under this
alternative. Erosion and sedimentation control plans would be developed and implemented for these
projects, as noted in Section 4.1.4. After the facilities were operating, they would be inciuded in the
Savannah River Site Stormwater Pollution Prevention Plan, which details stormwater control measures.
Min. E.xP, Max.N. _
B
m
4.3.4.2 Surface Water - Minimum Waste Forecas(c
As discussed in the other minimum waste forecasts (Sections 4.2.4.2 and 4,4,4.2), additional wastewater
would be treated by the existing wastewater treatment facilities,
Erosion and sedimentation control plans for construction projects, and pollution prevention plans would
be required as they are under the no-action alternative,
Min. =P. Mu.NOAction
A
B
@
4.3.4.3c
Surface Water – M aximum Waste Forecast
Facilities and discharges would be as described in Section 4.3.4,1. The previously described
requirements for erosion and sedimentation control plans and pollution prevention plans would apply.
4-142
DoEiEls-0217July 1995
4.3.5 ~ RESOURCES
M, hp. M-.NoAction
A
B
@
4.3.5.1 Air Resources - ExDected Waste Forec~c
Impacts tD air resources can be evaluated by comparing pollutants introduced under the various
alternatives. For alternative C – expected waste forecast, DOE would continue ongoing or planned waste
treatment activities and construct and operate additional waste management facilities. Additional
nonradiological and radiological emissions would occur, The resulting increases of pollutant
concentrations at and beyond the SRS boundary would be minimal compared to existing concentrations. /m
Neither state nor Federal air quality standards would be exceeded by operations under alternative C.
4.3.5.1.1 Construction
Potential impacts to air quality from construction activities would include fugitive dust and earth-moving
equipment exhaust. Approximately 6,19x 10⁵ cubic meters (8. 10x 105 cubic yards) of soil would be
disturbed in E-Area for the construction of facilities for alternative C – expected waste forecast.
Maximum SRS boundary-line concentrations of air pollutants resulting from a year of average
construction are shown in Table 4-38. These concentrations would be similar to those for the no-action
alternative. During a year of average construction, the sum of the increase over baseline pollutant
concentrations due to construction plus the existing baseline would be within both state and Federal air
quality standards.
4.3.5.1.2 Operations
There would be additional radiological and nonradiological emissions at SRS due to the operation of new
facilities such as the M-Area Vendor Treatment Facility, the mixed and hazardous waste containment
building, the non-alpha waste vitrification facility, the transuranic waste characterizatiorr/certification
facility, the alpha waste vitrification facility, and the Consolidated Incineration Facility (assuming it
operates as scheduled until it is replaced by the vitrification facilities).
4-143
Table 4-38. Maximum SRS boundaw-line concentrations resulting from a year Of average cOnstructiOn activities under alternative C [inmicrograms per cubic meter of air).
Existing Average changeb SCDHEC Existing baseline+ change as percentAveraging baselinea (wg/m3) standardc of standard
Pollutant time (u~m3) Expected Minimum Maximum (y~m3) Expected Minimum Maximum
Carbon monoxide 1 hour 171 737 330 6,793 40,000 2 1 17TC 8 hours 22 115 52 1,030 10,000 I I II
Total suspended 1 year 43 0.01 ~o.o 1 0.03 75 57 57 57particulate
Patiiculate matter less 24 hours 85 2.47 1.03 23.51 150 58 58 72than 10 microns in I ye~ 25 0.0 I <0.0 I 0.04 50 50 50 50diameter
?z. a. Source: Stewati (1994).
b. Source: Hess (1994a).c. Source: SCDHEC (1976).d. < is read as “less than.”
I ‘rE
DoE/EIs-021 7July 1995
Emissions from new or proposed facilities are estimated from processes occurring in the facilities or
similar facilities, annual average waste flow volumes, and air permit applications. Air emissions from
facilities such as disposal vaults and mixed waste storage buildings would be very small.
Per the rationale provided in Section 4.1.5.2 regarding similar facilities, no increase in maximum
bounda~-line concentrations of pollutants would result from the continued operation of cumently
operating facilities, Additional emissions from the M-Area Air Stripper and the F/H-Area Effluent
Treatment Facility due to the expected waste forecast would be very small and are discussed in
Section 4. I .5.2.
Nosrradiological Air Emissions Impacts
Maximum ground-level concentrations for nonradiological air pollutants are estimated from the
Industrial Source Complex Version 2 Dispersion Model using maximum potential emissions from all
facilities included in alternative C (Stewart 1994), Calculations for the annual averaging period and for
the dispersion of toxic substances that are carcinogenic are presented in Section 4.1.5.2. Modeled air
toxic concentrations for carcinogens are based on an annual averaging period and are presented in
Section 4.3.12.1.2. Air dispersion modeling was perfomred with calculated em ission rates for facilities
not yet operating and actual 1990 emission levels for facilities currently operating (Stewart 1994).
The following facilities were included in the modeling analysis for alternative C air dispersion: the
Consolidated Incineration Facility, including the ashcrete storage silo, the ashcrete hopper duct, and the
ashcrete mixe~ four new solvent tanks; the M-Area Vendor Treatment FaciliW, the hazardous and mixed I TC
waste containment building, the transuranic waste characterization/certification facility; hazardous waste
storage facilities; mixed waste storage facilities; the non-alpha waste vitrification facility; and the alpha
waste vitrification facility.
Emissions of air toxics would be negligible. Maximum boundary-line concentrations for air toxics
emanating from existing SRS sources, including the Consolidated Incineration Facility and the Defense
Waste Processing Facility, would be well below regulatory standards and are presented in the SCDHEC
Regulation No. 62.5 Standard No. 2 and Standard No. 8 Compliance Modeling Input/Output Data.
The Savannah River Technology Center Iaboratow’s liquid waste and E-Area vaults would have very
small air emissions, as discussed in Section 4.1.5.2.
TE
4-145
DoEiEIs-02 I7July 1995
Table 4-39 shows the increase in maximum ground-level concentrations at the SRS bomrda~ for
nonradiological air pollutants due to routine releases for alternative C – expected, minimum, and
maximum waste forecasts. Concentrations due to routine emissions resulting from alternative C –
TCexpected waste forecast are similar to those under the no-action alternative. Refer to Section 4.2.5.1,2
for a discussion of the emissions from offsite lead decontamination.
TE I Radiological AirEmissio”sImpacts
Offsite maximally exposed individual and population doses were determined for atmospheric releases
resulting from routine operations. The major sources of radionuclides would be tbe ConsolidatedLO04-13
Incineration Facility, the alpha and non-alpha vitrification facilities, and the transuranic waste
characterizatio n/cefiiti cation facility. Other facilities with radiological releases i~clude the M-Area
Vendor Treatment Facility and the mixed and hazardous waste containment building.
SRS-specific computer codes MAXI GASP and POPGASP were used to determine the maximum offsite
individual dose and the 80-kilometer (50-m ile) population dose, respectively, resulting from routine
LCICJ4-13I atmospheric releases, See Appendix E for detailed facility specific isotopic and dose data,
Table 4-40 shows the dose to the offsite maximally exposed individual and the population, Tbe
calculated maximum committed effective annual dose equivalent to a hypothetical individual is
‘c I 0.18 rnillirem(Ches”ey 1995), wbichiswellwithin theann”aldoselirnitof IOmillirem from SRS
atmospheric releases. In comparison, an individual living near SRS receives a dose of 0,25 millirem
from all current SRS routine releases (Amett 1994).
For alternative C – expected waste forecast, tbe annual dose to the population within 80 kilometers
‘c I (SOmiles)OfSRS wOuld be 10persOn-rern. IncOmparison,tbe collectivedosereceivedfromnat"ral
sources of radiation is approximately 195,000 person-rem (Amett, Karapatakis, and Mamatey 1994) to
tbe same population. Section 4,3.12.1.2 describes tbe potential health effects of these releases on
individuals residing offsite,
4-146
—
Table 4-39. Changes in maximum ground-level concentrations of air pollutants at the SRS bounda~ for alternative C – expected, minimum, and
maximum waste forecasts.TE
TC
Existing Regulato~ BackgroundAveraging ~o”rce~ standards concentration Increase in concentration (~g/m3) Percent of standarde
Pollutant time (Ptim3)a,b (pg/m3)c (Pg/m3)d Expectedb Minimum Maximum Expected Minimum Maximum
Nitrogen oxides 1 yeal 6
823196
14
171
22
100
1,30036580
40,00010,000
8
3417
3
~Af
NA
30
34
22
0.011
NA
NA
NA
NA
0.28
2.70
0.390.01
24.19
4.02
0.28
2.69
0.39
0.0 I
24.194.02
0.32
2.74
0.40
0.01
24.19
4.02
14 14 14
66 66 66
58 58 5821 21 21
0.5 0.5 0.5
0.3 0.3 0.3
60 60 60
59 59 59
50 50 50
Sulfur oxides 3 hours24 hours
1 year
Carbon monoxide 1 hour8 hours
Total suspended 1 yearpatticulates
13 75 1.98 1.98 1.98
Particulate matter 24 hours
less than I year10 microns in
diameter
Lead 3 months
513
150
50
3.20
0.08
3.18
0.083.520.10
4. OXIO-4
2
1
0.40.01
I .5 2.50x I0-5
0.0012
8.60x I0-4
3.40 XI0-4
1. IOXIO-4
1.90 XI0-5
0.0011
8.60x10⁻⁴
3.40 XI0-4
1.IOXIO-4
6.60x10⁻⁵
0.0012
8.80x10⁻⁴
3.50 XI0-4
I. IOX1O-4
0.8 0.8 0.8
54 54 54
35 35 35
25 25 2513 13 13
Gaseous fluorides 12 bours
(as hydrogen 24 hours
fluoride) 1 week
1 month
3.7
2.9
1.600.80
a. Micrograms percubic meter of air.
b. Source: Stewart (1994).
c. Source: SCDHEC (1976).
d. Source: SCDHEC (1992)..,e. Percent of standard = 100 x (actual + background+ increment) divided by tbe regulatory standards. I TEf. NA = not applicable.
–1
DoE/EIs-02 I 7
July 1995
TC
TE
Table 4-40. Annual radiological doses to individuals and the population within 80 kilometers (50 miles)
of SRS under alternative C.aOffsitemaximallyexposed individual Population
a. Source: Hess (1995a).b. DOE assumed that approximately 50 percent of the total site workforce would be available to work on
waste management activities.
c. New hires are calculated by comparing the required employment (column 4) to available employment(column 3); new hires would result only in those years when required employment exceeds available
employment.
TC
4-155
TC
TC
TE
DoE/E1s-02 I 7
July I 995
Min. EXP. Max.N.A,,;..
A
B
& ‘0 ‘no
4.3.8.2 cioec mics – Minimum Waste Forecast
c
4.3.8.2.1 Construction
Construction employment associated with alternative C – minimum forecast would be slightly less than
that for the expected waste forecast and would peak in 2004 and 2005 with approximately 130 jobs
(Table 4-4 1), which represents much less than 1 percent of the forecast employment in 2005. DOE does
not expect a net change in regional construction employment from implementation of this case. As a
result, socioeconomic resources in the region would not be affected.
4.3.8.2.2 Operations
Operations employment associated with implementation of the minimum waste forecast is expected to
peak in 2004 with an estimated 1,470 jobs, approximate y 690 fewerjobs thanundertheexpectedwaste
forecast (Table 4-4 1). This employment demand represents less than 1 percent of the forecast
employment in 2005 (see Chapter 3) and approximately 7 percent of 1995 SRS employment. DOE
believes these jobs could be filled from the existing SRS workforce and, therefore, anticipates that
socioeconomic resources would not be affected by changes in operations employment.
Min. EXP. Max,N.Action
A
B
@
4.3.8.3c
4.3.8.3.1 Construction
Construction employment associated with alternative C – maximum waste forecast would be greater than
that for the expected waste forecast and would peak in 2004 and 2005 with approximately350 jobs
(Table 4-4 I), which represents less than 1 percent of forecast employment for 2005. DOE does not
expect a net change in regional construction employment from implementation of this case. As a result,
socioeconomic resources in the region would not be impacted.
4-156
DOE~IS-0217
July 1995
4.3.8.3.2 Operations
operations employment associated with the implementation of alternative C – maximum waste forecast
is expected to peak during 2002 through 2005 with an estimated 10,060 jobs (Table 4-42), which
represents 3.7 percent of the forecast regional employment in the year 2005 and approximate y 50
percent of 1995 SRS employment, DOE assumes that approximately 50 percent of the total SRS
workforce would be available to support implementation of this case. If DOE transfers 50 percent of the
SRS workforce, an additional 2,160 new employees would still be required in the peak years. Based on
the number of new jobs predicted, DOE calculated changes in regional employment, population, and
personal income using the Economic-Demographic Forecasting and Simulation Model developed for the
six-county region of influence (Treyz, Rlckman, and Shao 1992).
Results of the modeling indicate that the peak regional employment change would occur in 2002 with a
total of approximately 5,320 new jobs (Table 4-43) (HNUS 1995b). This would represent a 2 percent
increase inbaselineregionalemploymentandwould have a substantial positive impact on the regional
economy,
Potential changes in regional population would lag behind the peak change in employment because of
migration lags and because in-migrants may have children after they move into the area, As a result, the
maximum change in population would occur in 2005 with an estimated 6,630 additional people in the
six-county region (Table 4-43) (HNUS 1995b). This increase is approximately 1.4 percent above the
baseline regional population forecast and could affect the demand for community resources and services
such as housing, schools, police, health care, and fire protection.
Potential changes in total personal income would peak in 2005 with a $410 million increase over forecast
regional income levels for that year (Table 4-43) (HNUS 1995b). This would be a 2.6 percent increase
over baseline income levels and would have a substantial, positive effect on the regional economy.
4.3.9 CULTURALRESOURCES
TC
TC
This section discusses the effect of alternative C on cultural resources.
4.157
Table 4-43. Changes in employment, population, and personal income for alternative C – maximum waste forecast.a
Change in
Change in Net change in Percent change Change in Percent change regional personal Percent change
indirect regional total regional in regional regional in regional Income in regional
Year New hiresb employment employment employment population population (millions) personal income
I2002 2,(60 3,160 5,320 2.06 1,870 0.39 310 2.37
I 2003 2, i 60 3,110 5,270 2.02 4,130 0.86 350 2.52