43
EPIDEMIOLOGIC EPIDEMIOLOGIC RESEARCH: RESEARCH: Things to Think About Things to Think About Including some examples from the wonderful world of diet and cancer
| Date post: | 02-Jan-2016 |
| Category: |
Documents |
| Upload: | abner-carpenter |
| View: | 214 times |
| Download: | 1 times |

EPIDEMIOLOGIC EPIDEMIOLOGIC RESEARCH:RESEARCH:
Things to Think AboutThings to Think About
Including some examples from the wonderful world of diet and cancer

James R. Hebert, Sc.D., Professor, Arnold James R. Hebert, Sc.D., Professor, Arnold School of Public Health Department of School of Public Health Department of
Epidemiology and BiostatisticsEpidemiology and Biostatistics
Director, South Carolina Statewide Director, South Carolina Statewide Cancer Prevention & Control ProgramCancer Prevention & Control Program

Observations We are generally driven by “Outcome
yield” (as indicated by high rates of disease); go to SC because CA rates are very high here
But “Information yield” (as indicated by optimizing the likelihood of observing a true relationship between the risk factor under study and the outcome – RR or OR) – is far more important

Fat Consumption (proportion EI) Comparing US individuals to 154 Country Means
·50-
·40-
·30-
·20-
·10-
Proportion
of
Calories
as
Fat
U.S. WORLD
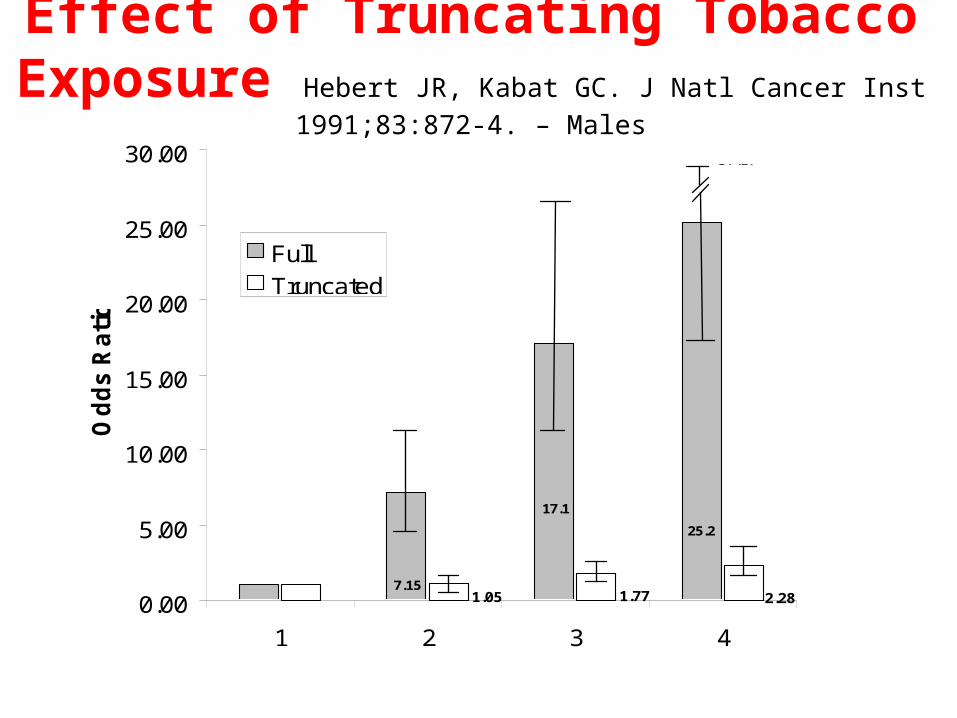
Effect of Truncating Tobacco Exposure Hebert JR, Kabat GC. J Natl Cancer Inst 1991;83:872-4. – Males
7.15
17.1
25.2
2.281.771.050.00
5.00
10.00
15.00
20.00
25.00
30.00
1 2 3 4
Od
ds
Ra
tio
FullTruncated
Referrent Category
Never Smokers 1-19 CPD 20-29 CPD 30+ CPD
15-20 CPD 21-30 CPD 31-40 CPD 41+ CPD
37.17

Effect of Truncating Tobacco Exposure Hebert JR, Kabat GC. J Natl Cancer Inst 1991;83:872-4. – Females
30.8118.69
6.921.782.651.490
5
10
15
20
25
30
35
40
45
CPD=
Od
ds R
ati
o
Full
Truncated
Referrent Category
0 15-20 1-19 21-30 20-29 31-40 30+ 41+

Observations Timing of exposure in relation to outcome
(and therefore measurement of things such as cancer initiators and promoters) is crucial (etiologic relevance)
Non-linearity is the norm for biological processes, perhaps more so for carcinogenesis than for more “mundane” processes (e.g., cancers often exhibit “log-normal” growth)

Examples Uterine thalidomide exposure and phocomelia
Calcium intake and bone mineralization
Tobacco and a variety of cancers/ precancers (e.g., oral leukoplakia)
Diet & BrCA
Physical activity & BrCA
BrCA & timing of surgical interventions
Etc., etc., etc., etc., etc., etc., etc., etc., etc.,

Observations Outcomes (e.g., cancers of a particular
anatomic site) may represent ≥ 2 [sometimes very] different diseases
Susceptibility may vary [drastically] across individuals
Conventional views of reality are conditioned by world view of researchers and accessibility/compliance of subjects

Esophageal Cancer In Western countries, 95% of the variability
in incidence is attributable to tobacco and alcohol use.
Within the U.S., rates for Blacks are about 2-3 times those of Whites (and they were 3-4 times just 15 years ago!); yet the use rates of tobacco and alcohol are about equal. Also see:
1. Hebert JR. Differences in biological responses to cigarette smoking remain unexplained. Am J Pub Health 1991; 81:1679-1680.
2. Hebert JR, Kabat GC. Menthol cigarette smoking and Oesophageal cancer: Results of a case-control study. Int J Epidemiol 1989; 18:37-44.
Esophageal Cancer
Right now in the U.S. esophageal cancer incidence rates are:
↑205% in Black men compared with Whites
↑240% in Black women compared with Whites

Esophageal Cancer
Incidence rates of squamous cell carcinoma, the common form in African Americans, are falling (slightly)
Rates of adenocarcinoma are rising (rapidly), and this change is seen almost exclusively in Whites

Esophageal Cancer Incidence, by Age & Sex
Esophageal CancerMortality rate differences are even larger than incidence rate differences:
Black men in SC have an esophageal cancer mortality rate that is 3.83 times higher than that of their White counterparts
The mortality rate for Black women is 2.53 times higher than that of their White counterparts
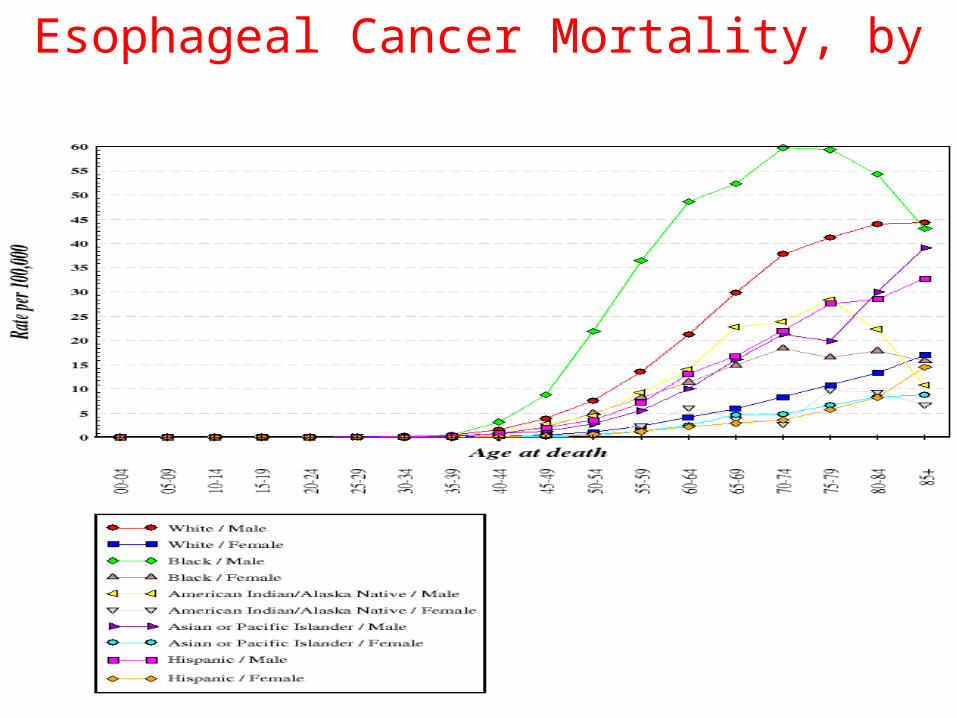
Esophageal Cancer Mortality, by Age & Sex

Esophageal Cancer
Non-Western populations (in China, South American and in the Caspian Littoral) have rates higher than Western populations and much lower exposures to tobacco and alcohol
Interactions evident in Western populations do not seem to be fully operative and there appears to be at least one other main effect or some other important interaction

Total Area: 31,113 mi2
Total Population: ~4.2mProportion AA: 31% >40% of rural population is AA
State of South Carolina

State of South Carolina

Esophageal Cancers in SC 1996-2000
020406080
100120140160
UpstateRegion 1
MidlandsRegion 2
Pee DeeRegion 3
Low CtryRegion 4
EA AA
020406080
100120140160
UpstateRegion 1
MidlandRegion 2
Pee DeeRegion 3
Low CtryRegion 4
EA AA
Squamous AdenocarcinomaSquamous Squamous

Menthol Cigarette Sales and Age-Adjusted Esophageal Cancer Rates in Blacks

How Could Menthol Explain these Differences?
Pyrollized menthol could exert a direct effect or its mild anesthetic properties could lead to changes in diet – e.g., allowing smokers to consume beverages at a higher temperature
Menthol may modify specific nutrient effects

In Our 1989 Study Of Menthol Cigarettes & Esophageal Cancer, we Looked at:
Current Cigarette Smokers Cases With Esophageal Cancer 216 Males 96 Females Controls With Non-Tobacco-Related Diseases
Matched on Age (5years) and Sex 305 Males 157 Females Participants from 20 Hospitals in 9 U.S. Cities
Hebert JR, Kabat GC. Menthol cigarette smoking and Oesophageal cancer: results of a case-control study. Int J Epidemiol 1989;18:37-44.

Statistical Methods:
Simple Univariate Statistics Exploratory Analyses to assess relationships
among the variables Two-Stage Logistic Regression (to account for
intercorrelations, to allow for increased degrees of freedom, and to provide a conservative estimate of the effect of menthol cigarettes on risk of esophageal cancer)

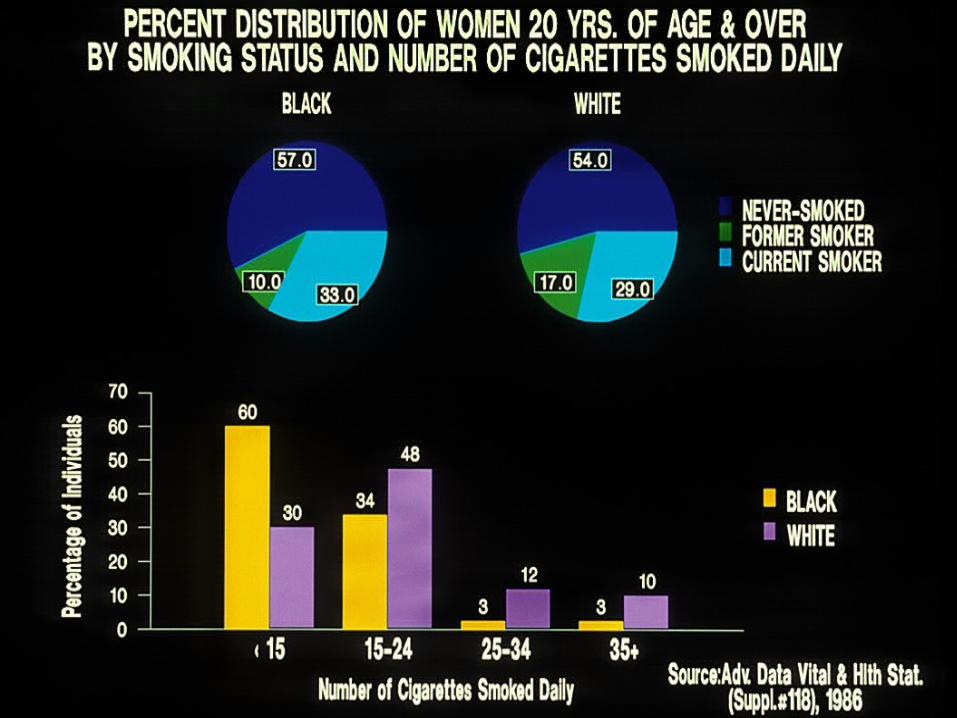
PERCENTAGE IN OUR STUDY GROUP EVER SMOKING MENTHOL BRANDS
[UNAMBIGUOUS]
WHITES NON-WHITES
Cases Controls Cases Controls
MALE 10% 15% 10% 15%
FEMALE 22% 13% 32% 30%

CRUDE ODDS RATIOS - FEMALES
O.R. 95% CI
EVER MENTHOL: 2.05 (1.09-3.87)
> 10 YRS MENTHOL: 2.03 (0.91-4.56)
> 15 YRS MENTHOL: 2.83 (0.77-10.36)
Cases = 96
Controls = 157N

RESULTS OF FIRST STAGE LOGISTIC MODELS - FEMALES
Odds Ratio
95%
Confidence Interval
P-value
Education (>HS) 0.72 0.37-1.38 0.33
Religion (Jewish) 0.16 0.05-0.49 0.001
Alcohol (> 1oz/d) 2.79 1.55-5.03 0.0006
Race (Black) 4.60 2.11-10.04 0.0001
Cigarettes (20+/d) 1.52 0.79-2.79 0.22
Non-Menthol
Smoking (years)
1.02 0.99-1.05 0.15

RESULTS OF SECOND STAGE FITTING - FEMALES
Odds
Ratio
95%
Confidence Interval P-value
Stage IIa:
Menthol
Smoking (<10 y)
1.50 0.54-4.17 0.44
Menthol
Smoking (10 y) 2.30 0.93-5.72 0.07
Stage IIb:
Menthol
Smoking (years) 1.05 0.75-4.17 0.09
THESE RESULTS DO NOT RESOLVE THE
ISSUE DEFINITIVELY BECAUSE OF:
The lack of representativeness of Blacks in our study population
The inability to define menthol cigarette exposure unambiguously
The lack of data on potential effect-modifiers, such as dietary factors (including temperature of beverages consumed)

New Hypothesis:
Menthol, alone or in combination with EtOH, may modify permeability and solubility of tobacco carcinogens
[Azzi C, Zhang J, Purdon CH, Chapman JM, Nitcheva D, Hebert JR, Smith EW. Permeation and reservoir formation of 4-(methylnitrosamino)-1-(3-pyridyl)-1-butanone (NNK) and benzo[a]pyrene (BAP) across porcine esophageal tissue in the presence of ethanol and menthol. Carcinogenesis 2006;27(1):137-45.]
Observations Humans are not simple systems (so
interactions occur on multiple levels)
We have done a poor job of anticipating, let alone helping to create scientific innovation, though there are occasional flashes of brilliance

Observations
What people know (or believe that they know) is not always obvious – because we epidemiologists rely heavily on self-assessment, this can be a real problem
We need to anticipate as much as possible about people’s motivations and beliefs

Observations
We need to realize that what cannot be controlled by design may be controlled analytically
This kind of control may be both necessary and preferable - the RCT is often impractical, it is not true to life, and it is almost always expensive

Yet More Observations:Yet More Observations: “Ecological studies” produce results that are
often very different from “Analytic studies” –e.g., dietary factors “explain” ≈ 80-90% of the variability in hormone-sensitive CA rates in the former (at least in cross-national studies) and around 10% in the latter
“Correlatedness” among cancers changes with level of aggregation (internationally r ≈ 1.0 for BrCA, PrCA & CRCA), but not within populations (an example of “ecological” inversion)
Now, Some Questions:Now, Some Questions:
If such large differences exist in rates, why are estimates for most risk factors (OR or RR) <3.0?
Why are results so different according to level of aggregation (e.g., cross-nationally vs. between states in the U.S.)?
Why are results derived in studies of individuals so different from those obtained in ecological studies?

How About Some Answers?How About Some Answers?
1. Diet assessment methods are inadequate to estimate true exposure with reasonably sufficient accuracy and precision, especially over long periods
– Based on our work, resulting biases could easily distort epidemiologic effect estimates
2. Use of retrospective diet assessment methods in case-control study designs introduces additional information bias
– And this also could distort estimates of effect
From the Conventional Epidemiologic Perspective, there is:
Type I Error – [the probability of] accepting the alternative hypothesis [of an effect] on the assumption that the null hypothesis is true (often worded as “the error of rejecting a true null hypothesis” – declaring a difference when one does not exist); Test statistic exists – usually = 0.05 (expressed as the “p” value)

Type II Error – [the probability of] accepting the null hypothesis on the assumption that the alternative hypothesis is true (often worded as “the error of failing to reject a false null hypothesis” – i.e., declaring that a difference does not exist when in fact it does); Test statistic exists – usually 1- ≥ 0.80 (*100 = power; 80%)
And:

There is a More Insidious Category:
Type III Error – incorrect inference resulting from a faulty conception of how the world works, or selection of a study design that produces an answer [even if correct] to the wrong question; Test statistic does not exist

Another Answer (more specifically to the Another Answer (more specifically to the Type III Error Problem)Type III Error Problem)
3. Within-study-group contrasts, in both relevant exposures and cancer-related outcomes, are often lacking
– this reflects the “Information Yield” vs. “Outcome Yield” problem
Also see:Hebert JR. Epidemiologic studies of diet and cancer: The case for international collaboration (Commissioned as part of the Eminent Scientist of the Year 2004 Award by the World Science Forum). Austro-Asian J Cancer 2004;5(Special Issue - Recent Advances and Research Updates):140-53.Hebert JR. Invited commentary: menthol cigarettes and risk of lung cancer. Am J Epidemiol 2003;158:617-20.

So, what can we do about this?So, what can we do about this? Study disease-risk factor relationships in situations where
we expect to obtain the largest “information yield”
Create large study-group contrasts in relevant exposures by designing and implementing effective interventions
Engage other basic, clinical, and behavioral scientists in considering what is really important and in paying attention to important clues that are not readily discernable from their vantage points (thereby lowering type III error rates)
Be open-minded and inquisitive; be willing to say yes
Thanks to the Many People and Institutions that have influenced my thinking, especially
University of Washington• Cole P. Dodge (UNICEF)• Ross Prentice (FHCRC)Harvard University• Glorian Sorensen (DFCC)• Karen Peterson• Mohamed el Lozy• Walter Willett• Larry Kushi (Kaiser P.)Bombay University – Healis• Prakash C. GuptaBoston University – Bedford VA• Donald Miller
American Health Foundation• Ernst Wynder (deceased)• Geoffrey Kabat University of Massachusetts• Ira Ockene (Prev Cardiology)• Judy Ockene • Jon Kabat-Zinn (emeritus)University of South Carolina• Tom Hurley (EPID-BIOS)• Bill Hrushesky (Dorn VA)• Frank Berger (Biol – CAS)• Jane Teas (SCCC)• Harris Pastides (EPID-BIOS)


