44
Epidemiology Cardiovascular Disease in Europe Wilma Scholte op Reimer, RN, PhD Amsterdam School of Health Professions Academic Medical Center / University of Applied Sciences Amsterdam

Epidemiology
Cardiovascular Disease in Europe
Wilma Scholte op Reimer, RN, PhD
Amsterdam School of Health Professions
Academic Medical Center / University of Applied Sciences Amsterdam

Disclosures
• No conflict of interest
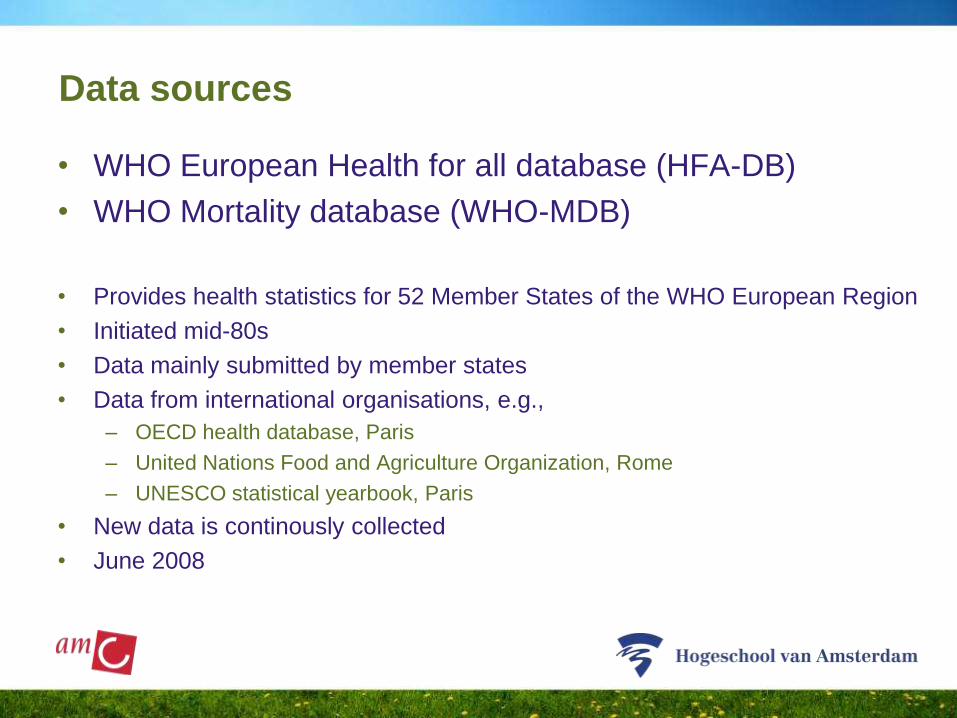
Data sources
• WHO European Health for all database (HFA-DB)
• WHO Mortality database (WHO-MDB)
• Provides health statistics for 52 Member States of the WHO European Region
• Initiated mid-80s
• Data mainly submitted by member states
• Data from international organisations, e.g.,
– OECD health database, Paris
– United Nations Food and Agriculture Organization, Rome
– UNESCO statistical yearbook, Paris
• New data is continously collected
• June 2008

Groups of countries
• European Region: the 52 countries of the WHO Region
• EU: the Member States of the European Union
• EU-15: the 15 Member States of the European Union prior
to 1 May 2004
• EU-10: the 10 Member States which joined the European
Union from 1 May 2004
• CIS: the 12 countries of the Commonwealth of
Independent States, which are 12 out of 15 countries of
the former USSR

Increasing Life Expectancy

LIFE EXPECTANCY AT BIRTH
75 to 8070 to 7565 to 70
>=80No data
Years
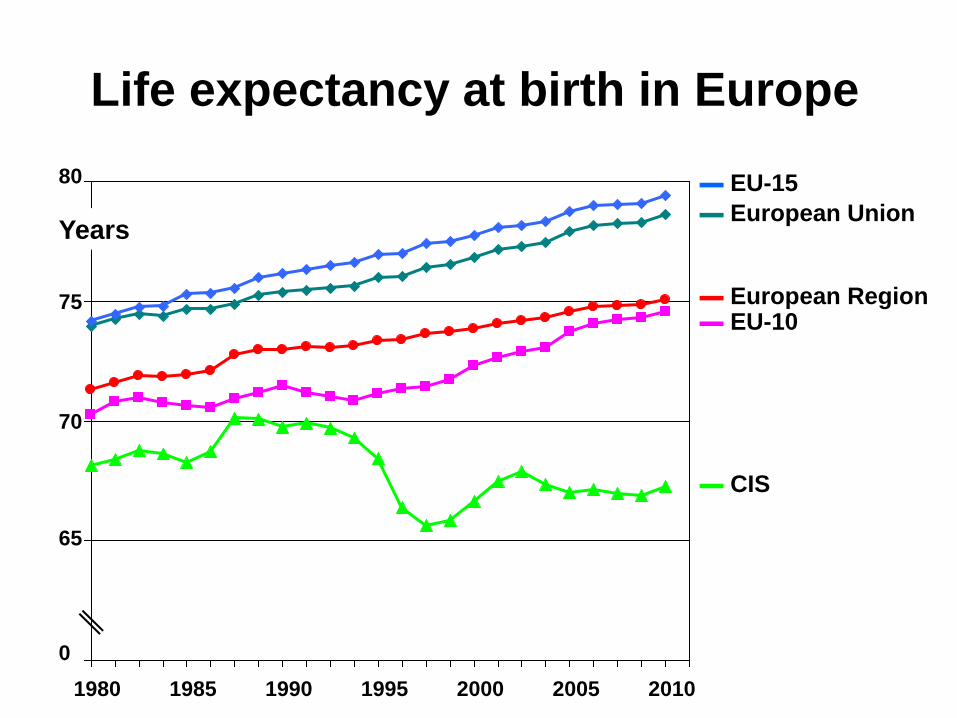
Life expectancy at birth in Europe
60
65
70
75
80
1980 1985 1990 1995 2000 2005
0
70
75
80
Years
▬ European Region▬ EU-10
▬ European Union
▬ EU-15
▬ CIS
65
1980 1985 1990 1995 2000 2005 2010


Europe is ageing rapidly
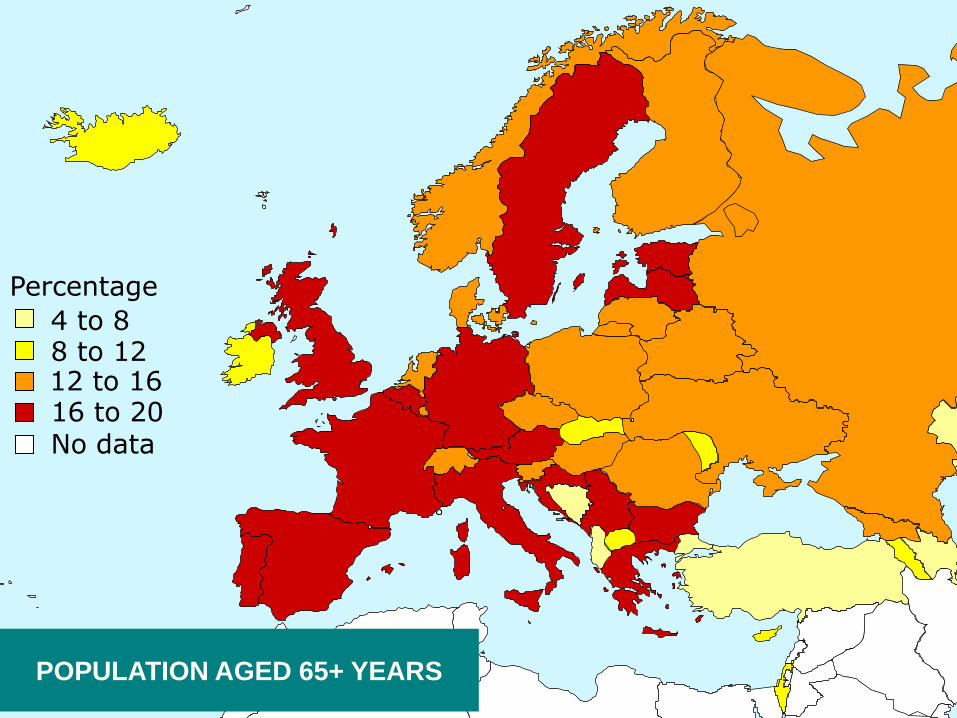
POPULATION AGED 65+ YEARS
12 to 168 to 124 to 8
16 to 20No data
Percentage

Proportion of 65+ years of age
5
10
15
20
1980 1985 1990 1995 2000 2005
0
10
15
20
% 65+
▬ European Region
▬ EU-10
▬ European Union
▬ EU-15
▬ CIS
1980 1985 1990 1995 2000 2005 2010

159
141822273135404448535761667074798388
Age pyramid for Europe in 2008Age
Men Women
4 3 2 1 0 1 2 3 4
Numbers per million
90+
85
80
75
70
65
60
55
50
45
40
35
30
25
20
15
10
5
0

159
141822273135404448535761667074798388
Age pyramid for Europe in 2050Age
Men Women
4 3 2 1 0 1 2 3 4
Numbers per million
90+
85
80
75
70
65
60
55
50
45
40
35
30
25
20
15
10
5
0

Age = CVD
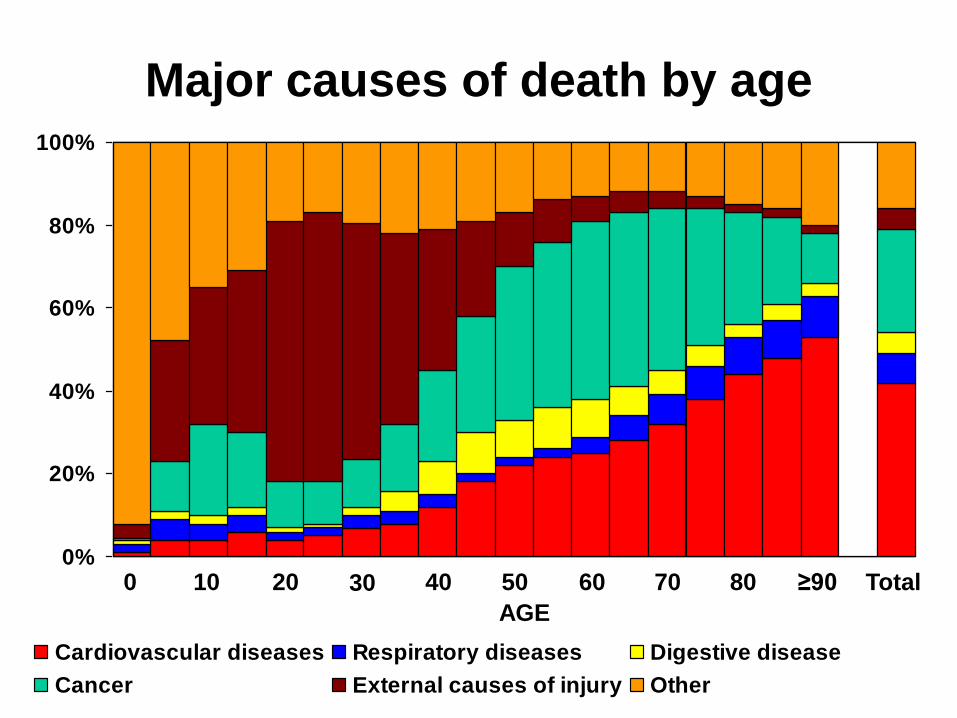
Major causes of death by age
0%
20%
40%
60%
80%
100%
Cardiovascular diseases Respiratory diseases Digestive disease
Cancer External causes of injury Other
0 10 20 30 40 50 60 70 80 ≥90 Total
AGE

Decreasing CVD mortality?
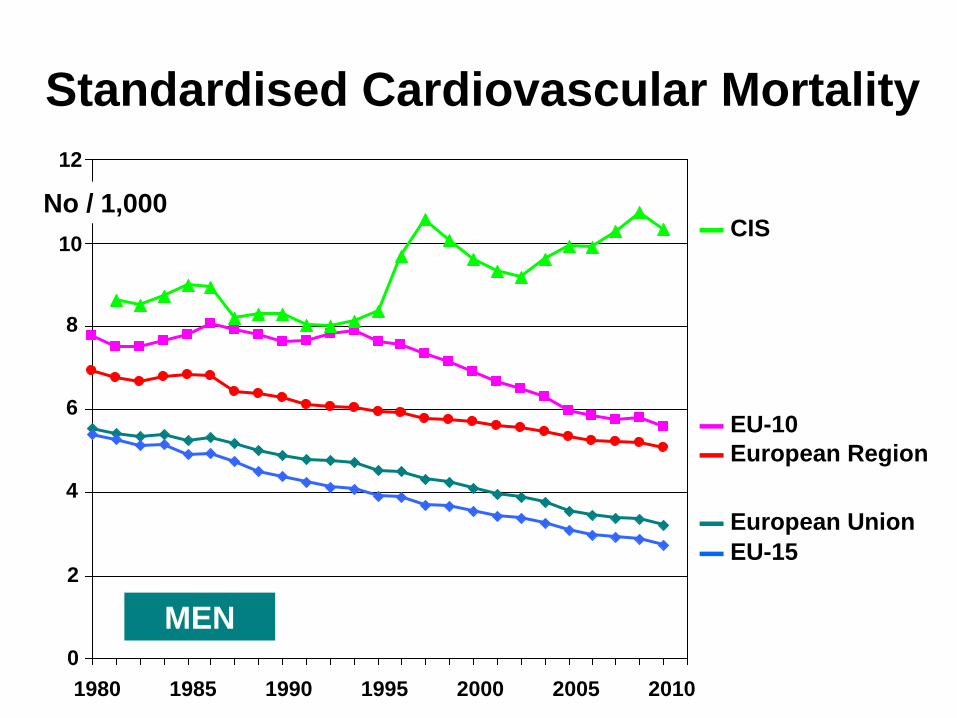
Standardised Cardiovascular Mortality
0
200
400
600
800
1000
1200
1980 1985 1990 1995 2000 2005
0
8
12
No / 1,000
▬ European Region
▬ EU-10
▬ European Union
▬ EU-15
▬ CIS
4
10
6
2
MEN
1980 1985 1990 1995 2000 2005 2010

0
20
40
60
80
100
EA-I EA-II ACS I CR AP DM ACS II PCI
%
Improved Secondary Prevention
since 1995Antithrombotics
Lipid lowering
Beta-blockers
ACE-I/ARB
Surveys
1995 2005-2006

Standardisation procedure
• Large heterogeneity in age across countries
• Standardisation is needed for comparison of health
indicators (e.g., mortality)
• Age-standardised death rates are calculated using the
direct method
– They represent what the crude rate would have been if the
population had the same age distribution as the European standard
population, as follows …

European standard population

7.2 to 9.64.8 to 7.2
<= 2.42.4 to 4.8
9.6 to 12.0No data
STANDARDISED CARDIOVASCULAR
MORTALITY ~ 2008 MEN
Number/1,000

Standardised Cardiovascular Mortality
0
200
400
600
800
1000
1200
1980 1985 1990 1995 2000 2005
0
8
12
No / 1,000
▬ European Region
▬ EU-10
▬ European Union
▬ EU-15
▬ CIS
4
10
6
2
MEN
1980 1985 1990 1995 2000 2005 2010
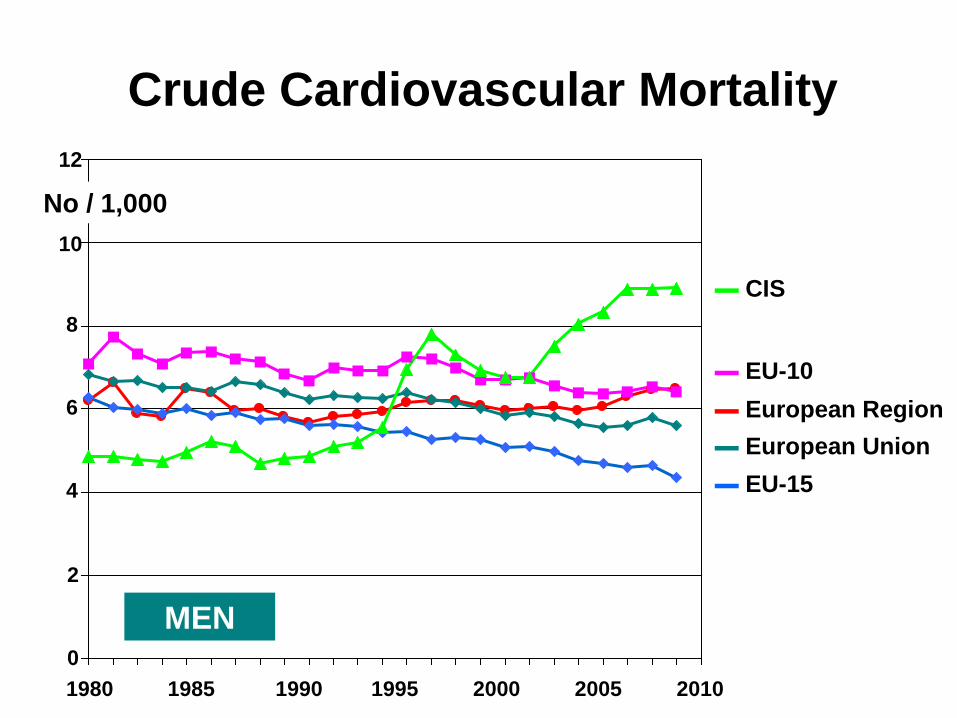
Crude Cardiovascular Mortality
0
0,2
0,4
0,6
0,8
1
1,2
1980 1985 1990 1995 2000 2005
0
8
12
No / 1,000
▬ European Region
▬ EU-10
▬ European Union
▬ EU-15
▬ CIS
4
10
6
2
MEN
1980 1985 1990 1995 2000 2005 2010

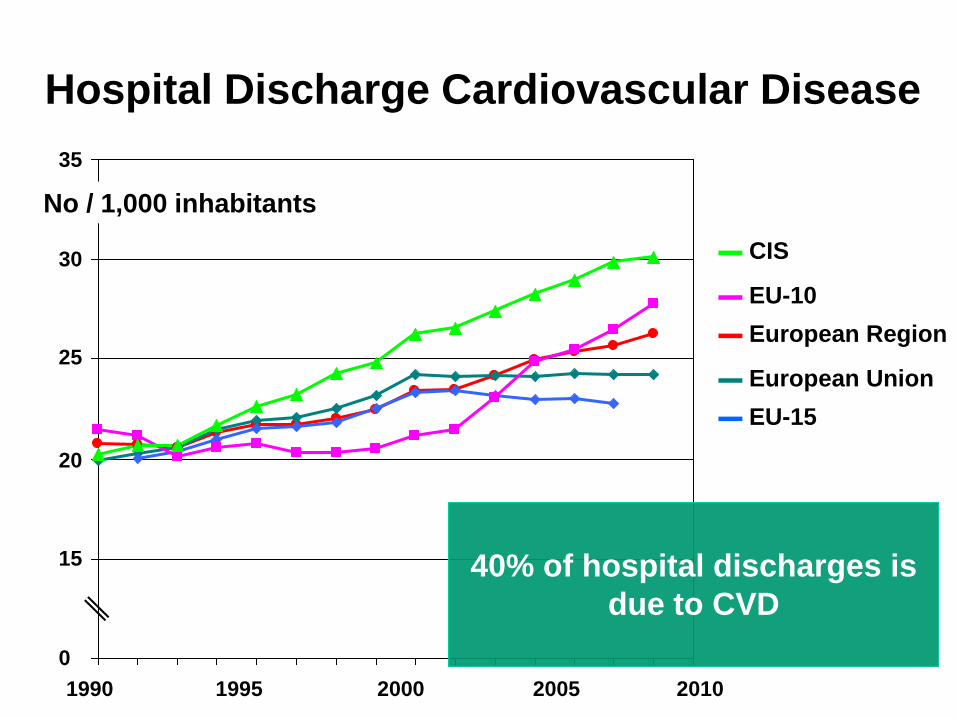
Increasing number of
hospital discharges

Hospital Discharge Cardiovascular Disease
1000
1500
2000
2500
3000
3500
1990 1995 2000 2005
No / 1,000 inhabitants
▬ European Region
▬ EU-10
▬ European Union
▬ EU-15
▬ CIS
0
25
35
20
30
15
1990 1995 2000 2005 2010

Hospital Discharge Cardiovascular Disease
1000
1500
2000
2500
3000
3500
1990 1995 2000 2005
No / 1,000 inhabitants
▬ European Region
▬ EU-10
▬ European Union
▬ EU-15
▬ CIS
0
25
35
20
30
15
Ischemic Heart Diseases
29%
Cerebrovascular Diseases
41%
1990 1995 2000 2005 2010
Hospital Discharge Cardiovascular Disease
1000
1500
2000
2500
3000
3500
1990 1995 2000 2005
No / 1,000 inhabitants
▬ European Region
▬ EU-10
▬ European Union
▬ EU-15
▬ CIS
0
25
35
20
30
15
1990 1995 2000 2005 2010
40% of hospital discharges is
due to CVD

Length of Hospital Stay
6
8
10
12
14
16
18
1985 1990 1995 2000 2005
Days
▬ European Region
▬ EU-10
▬ European Union
▬ EU-15
▬ CIS
0
12
18
10
16
8
14
1985 1990 1995 2000 2005 2010

CVD patients often suffer
from comorbidity

Underlying Heart Diseases in AFib
61
31 3025
70
41 40
29
0
20
40
60
80
Hypertension Heart failure CAD Valvular HD
≤ 75 years > 75 years
%
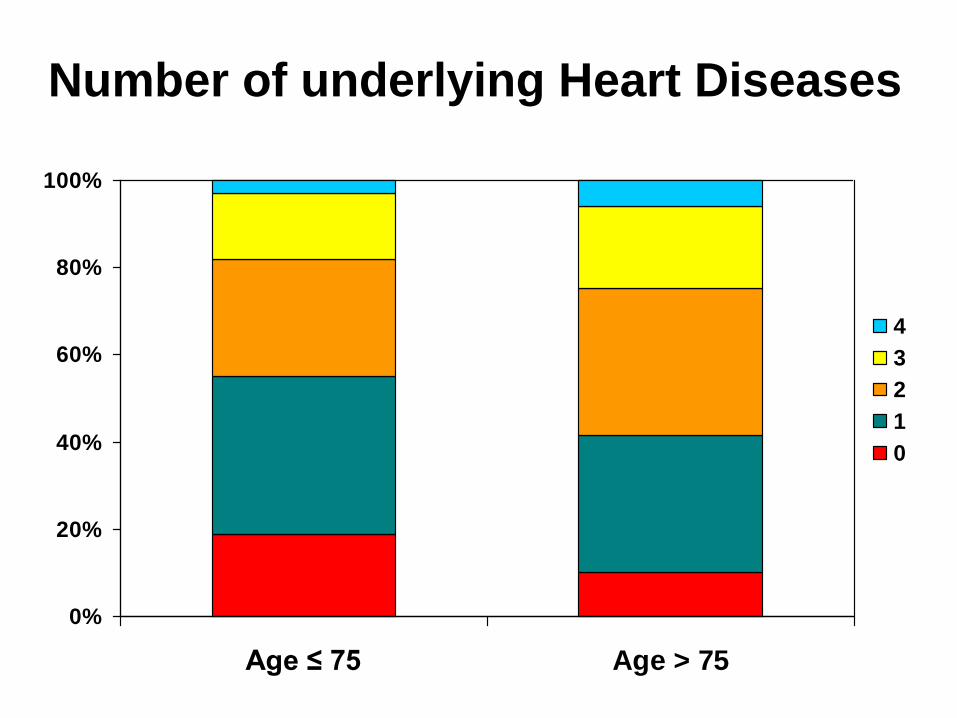
Number of underlying Heart Diseases
0%
20%
40%
60%
80%
100%
Age ≤ 75 Age > 75
4
3
2
1
0

Increasing number of
persons at risk

30 to 3525 to 30
< 2020 to 25
35 to 40No data
DAILY SMOKERS, AGE 15+
Percentage
20 to 2515 to 20
< 1010 to 15
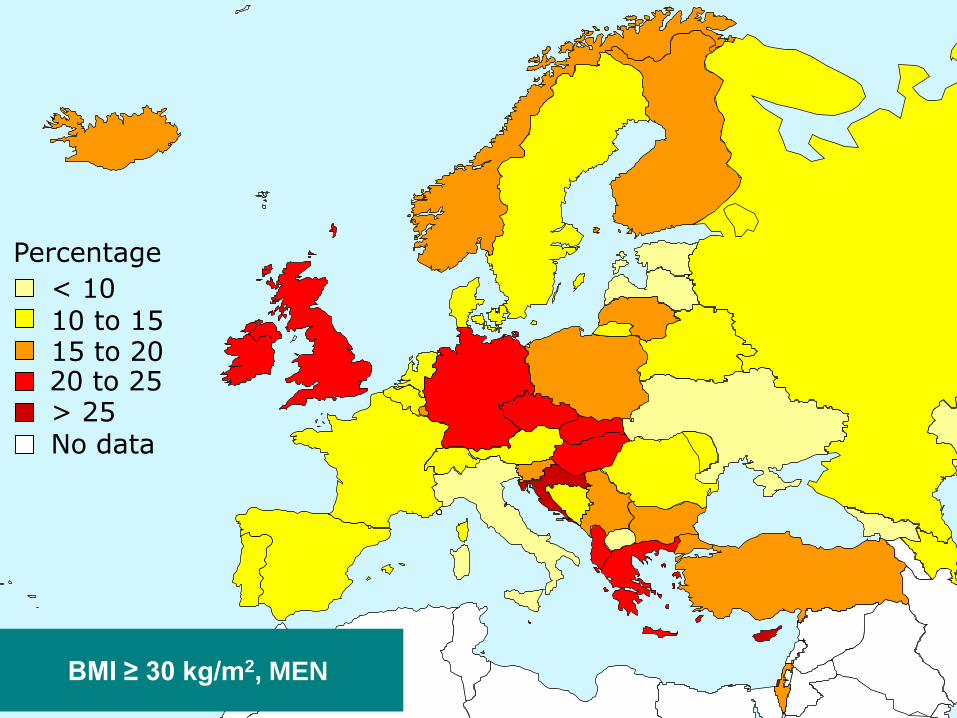
> 25No data
BMI ≥ 30 kg/m2, MEN
Percentage
20 to 2515 to 20
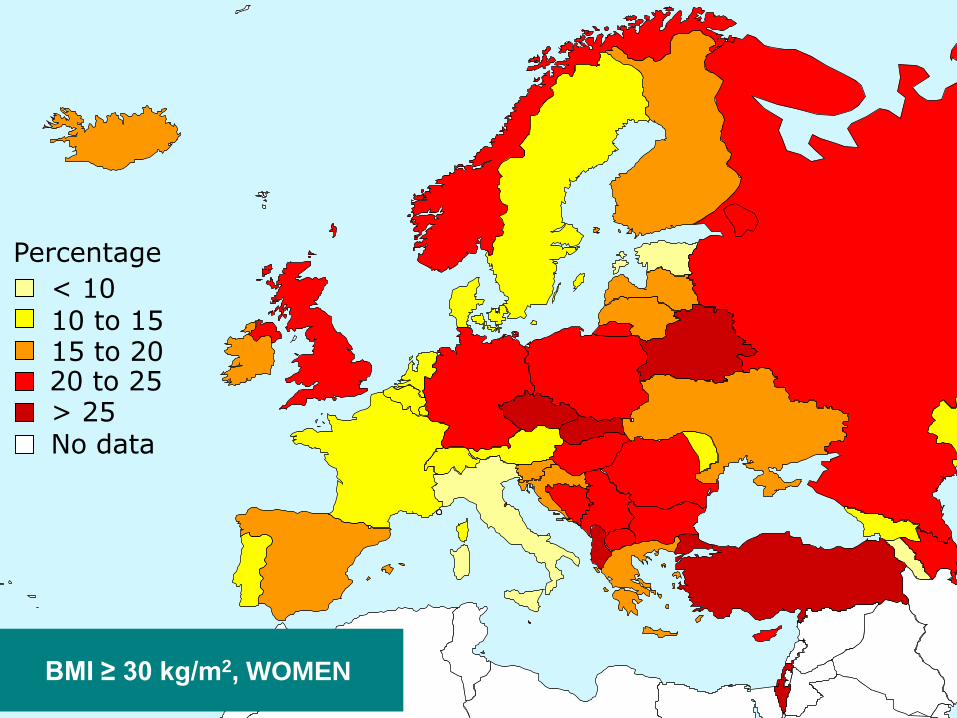
< 1010 to 15
> 25No data
BMI ≥ 30 kg/m2, WOMEN
Percentage

Prevalence of Diabetes in Adults (Age 20-29)
0
2
4
6
8
10
12
Africa Eastern
Mediterranean
and Middle
East Region
Europe North America South &
Central
America
South-East
Asia
Western
Pacific
2003 2025
%

Also increasing number of
caregivers ?

4.2 to 5.62.8 to 4.2
1 to 1.41.4 to 2.8
5.6 to 7.0No data
PHYSICIANS PER 1,000 INHABITANTS

4.2 to 5.62.8 to 4.2
1 to 1.41.4 to 2.8
5.6 to 7.0No data
PHYSICIANS PER 1,000 INHABITANTS
Average number of physicians
in European Region
per 1,000 inhabitants:
1985: 3,0
2008: 3,5
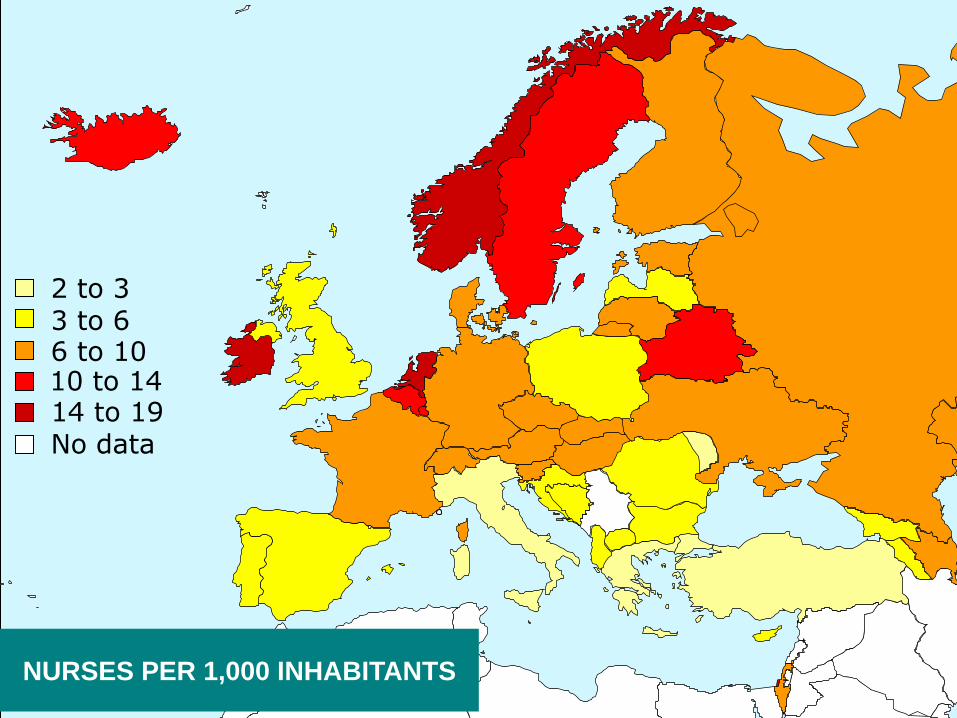
10 to 146 to 10
2 to 33 to 6
14 to 19No data
NURSES PER 1,000 INHABITANTS

10 to 146 to 10
2 to 33 to 6
14 to 19No data
NURSES PER 1,000 INHABITANTS
6.8 nurses to 1 physician in Ireland
0.5 nurses to 1 physician in Italy
4.5 nurses to 1 physician in the Netherlands

10 to 146 to 10
2 to 33 to 6
14 to 19No data
NURSES PER 1,000 INHABITANTS
Average number of nurses
in European Region
per 1,000 inhabitants:
1985: 6,8
2008: 6,7


Thank you


