Annals of the Rheumatic Diseases, 1989; 48, 271-280 Scientific papers Epidemiology of osteoarthritis: Zoetermeer survey. Comparison of radiological osteoarthritis in a Dutch population with that in 10 other populations JAN L C M VAN SAASE,13 LEO K J VAN ROMUNDE,1 ARNOLD CATS ,2 JAN P VANDENBROUCKE,3 AND HANS A VALKENBURG1 From the 'Department of Epidemiology, Erasmus University Medical School, Rotterdam, The Netherlands; and the Departments of 2Rheumatology and 3Clinical Epidemiology, Leiden State University, Leiden, The Netherlands SUMMARY The prevalence of mild and severe radiological osteoarthritis was investigated in a random sample of 6585 inhabitants of a Dutch village. Radiographs were graded 0-4 according to the criteria described by Kellgren and Lawrence. The prevalence of radiological osteoarthritis increased strongly with age and was highest for cervical spine (peak: men 84.8%, women 84-3%), lumbar spine (peak: 71-9%, women 67.3%), and distal interphalangeal joints of the hands (peak: men 64-4%, women 76%). Prevalence did not exceed 10% in sacroiliac joints, lateral carpometacarpal joints, and tarsometatarsal joints. Severe radiological osteoarthritis (grade 3 or grade 4) was uncommon under age 45; in elderly persons the prevalence of severe radiological osteoarthritis did not exceed 20% except for the cervical and lumbar spine, distal interphalangeal joints of the hands and, in women only, metacarpophalangeal joints, first carpometacarpal joints, first metatarsophalangeal joints, and knees. Overall, differences between men and women were small except for hips and knees; however, severe radiological osteoarthritis was found in a higher proportion in most of the joints in women. Our data were compared with data from similar population surveys. The slope between joint involvement and age was strikingly constant for most of the joints. Differences between populations were mainly differences in level. These differences of prevalence of radiological osteoarthritis may be attributed to interobserver differences-that is, different criteria used to establish radiological osteoarthritis, in addition to genetic or environmental factors, or both. Key words: prevalence, human. Osteoarthritis causes morbidity that will be of increasing importance in populations with greater proportions of elderly people. Epidemiology can help establish the causes of chronic diseases like osteoarthritis.1 One of the major tools used by epidemiologists to accomplish this is a comparison of populations. Epidemiological studies have shown that radiological osteoarthritis is a ubiquitous dis- order. Although present in some individuals around Accepted for publication 4 August 1988. Correspondence to Dr Jan L C M van Saase, Department of Clinical Epidemiology, Leiden State University, PO Box 9600, 2300 RC Leiden, The Netherlands. age 25. osteoarthritis mainly affects older age groups.2 3 Several investigations compared the pre- valence of osteoarthritis in different races, different populations, and different geographic areas. Although a number of carefully conducted large population surveys are available, only a limited number of these were adequately compared.7 In this paper we describe the prevalence of radiological osteoarthritis of 22 joints and groups of joints in a random population sample of 6585 inhabitants of Zoetermeer in the Netherlands. The results are compared with results from 10 similar population surveys. 271 on 9 January 2019 by guest. Protected by copyright. http://ard.bmj.com/ Ann Rheum Dis: first published as 10.1136/ard.48.4.271 on 1 April 1989. Downloaded from
Transcript
Annals of the Rheumatic Diseases, 1989; 48, 271-280
Scientific papers
Epidemiology of osteoarthritis: Zoetermeer survey.Comparison of radiological osteoarthritis in a Dutchpopulation with that in 10 other populationsJAN L C M VAN SAASE,13 LEO K J VAN ROMUNDE,1 ARNOLD CATS ,2JAN P VANDENBROUCKE,3 AND HANS A VALKENBURG1
From the 'Department of Epidemiology, Erasmus University Medical School, Rotterdam, The Netherlands;and the Departments of 2Rheumatology and 3Clinical Epidemiology, Leiden State University, Leiden, TheNetherlands
SUMMARY The prevalence of mild and severe radiological osteoarthritis was investigated in arandom sample of 6585 inhabitants of a Dutch village. Radiographs were graded 0-4 according tothe criteria described by Kellgren and Lawrence. The prevalence of radiological osteoarthritisincreased strongly with age and was highest for cervical spine (peak: men 84.8%, women 84-3%),lumbar spine (peak: 71-9%, women 67.3%), and distal interphalangeal joints of the hands (peak:men 64-4%, women 76%). Prevalence did not exceed 10% in sacroiliac joints, lateralcarpometacarpal joints, and tarsometatarsal joints. Severe radiological osteoarthritis (grade 3 orgrade 4) was uncommon under age 45; in elderly persons the prevalence of severe radiologicalosteoarthritis did not exceed 20% except for the cervical and lumbar spine, distal interphalangealjoints of the hands and, in women only, metacarpophalangeal joints, first carpometacarpal joints,first metatarsophalangeal joints, and knees. Overall, differences between men and women weresmall except for hips and knees; however, severe radiological osteoarthritis was found in a higherproportion in most of the joints in women. Our data were compared with data from similarpopulation surveys. The slope between joint involvement and age was strikingly constant formost of the joints. Differences between populations were mainly differences in level. Thesedifferences of prevalence of radiological osteoarthritis may be attributed to interobserverdifferences-that is, different criteria used to establish radiological osteoarthritis, in addition togenetic or environmental factors, or both.
Key words: prevalence, human.
Osteoarthritis causes morbidity that will be ofincreasing importance in populations with greaterproportions of elderly people. Epidemiology canhelp establish the causes of chronic diseases likeosteoarthritis.1 One of the major tools used byepidemiologists to accomplish this is a comparisonof populations. Epidemiological studies have shownthat radiological osteoarthritis is a ubiquitous dis-order. Although present in some individuals around
Accepted for publication 4 August 1988.Correspondence to Dr Jan L C M van Saase, Department ofClinical Epidemiology, Leiden State University, PO Box 9600,2300 RC Leiden, The Netherlands.
age 25. osteoarthritis mainly affects older agegroups.2 3 Several investigations compared the pre-valence of osteoarthritis in different races, differentpopulations, and different geographic areas.Although a number of carefully conducted largepopulation surveys are available, only a limitednumber of these were adequately compared.7 Inthis paper we describe the prevalence of radiologicalosteoarthritis of 22 joints and groups of joints in arandom population sample of 6585 inhabitants ofZoetermeer in the Netherlands. The results arecompared with results from 10 similar populationsurveys.
271
on 9 January 2019 by guest. Protected by copyright.
http://ard.bmj.com
/A
nn Rheum
Dis: first published as 10.1136/ard.48.4.271 on 1 A
272 van Saase, van Romunde, Cats, Vandenbroucke, Valkenburg
Subjects and methods
ZOETERMEER POPULATIONTo study the prevalence and determinants ofrheumatic and cardiovascular diseases a populationsurvey was conducted between 1975 and 1978 in twodistricts of Zoetermeer, a suburban metropolitanarea near The Hague in The Netherlands.8 Respon-dents were inhabitants of the original agriculturalvillage and the recently built parts, which were
principally inhabited by white collar workers. Allinhabitants of the old village centre and one part ofthe new area were invited to participate in thissurvey. Of 4134 eligible men and 4523 eligiblewomen of 19 years and older, 6585 (76-1%) partici-pated in the study (3109 men, 3476 women). Surveycompletion was greatest between 20 and 64 years ofage (78.2%) and was only 61% in those over 65.Information was gathered on previous medical
ZOETERMEER POPULATION (EPOZ)
a
.e
coI
0
2
a,
0
m
ZOETERMEEI(B)Men: handjointradiological osl
... I
20 30 40 S0 00 70 s0 20 30 40AGE IN YEARS AGE I
ZOETERMEER POPULATION (EPOZ) ZOETERMEEI(D)Men: feetlointiradiologIcal osi
history, rheumatic complaints, profession, dailyactivities, drug use, schooling history, and lifestylehabits by a questionnaire. In a specially equippedcentre joints were investigated, blood pressure,weight, and height were measured, and radiographswere taken of all 6585 participants. Blood wasobtained for determination of rheumatoid factor,total serum cholesterol, and uric acid.
RADIOGRAPHSRadiographs were obtained of hands, forefeet, andlateral cervical spine. Several additional radiographswere taken of all respondents of 45 years and older:lumbar spine in anteflexion and dorsiflexion andpelvis and knees in anteroposterior and standingposition. During the last year of the survey radio-graphs of both shoulders were taken of all respon-dents of 45 years and older. Examination of radio-graphs was performed by two investigators indepen-
R POPULATION (EPOZ)
tsteoarthritis grade > 2
DIP
MCP
CMC-I Fig. 1 Age specific prevalences ofWRIST osteoarthritis ofhands andfeetforPIPCARPUS inhabitants ofZoetermeer.
DIP=distal interphalangeal joints;w C CMC-L CMC-I=first carpometacarpalINY0 70 joint; MCP=metacarpophalangealIN YEARS joints; PIP=proximal
R POPULATION (EPOZ) interphalangeal joints;CMC-L=second to fifth
dently, based on the grading system for radiologicalosteoarthritis according to the Atlas of StandardRadiographs of arthritis.9 This atlas contains radio-graphic examples of osteoarthritis of several jointsin several stages of the disease. A five point scalehas been used for staging (O=absent, 1=dubious,2=mild, 3=moderate, 4=severe). Small joints ofhands and feet were graded as groups (Figs 1 and 2)according to the most affected joint of the wholegroup. Right and left side were not separated,except for hips, knees, shoulders, and sacroiliacjoints. When a one point difference in gradingoccurred between both investigators the higherscore was accepted, but where there was greaterdisagreement about the grading or when one obser-ver scored grade 1 and the other grade 2 the filmswere reassessed at a joint reading session until afinal score was agreed. Interobserver and intraob-server agreement has been discussed elsewhere.10
CRITERIA FOR CHOICE OF COMPARISONPOPULATIONSPopulation surveys suited for comparison were crosssectional and contained random or stratified popula-tion samples. Not all surveys could be used: radio-graphs had to be available of nearly all respondentswithout regard to complaints; an acceptable samplesize of above 500 participants was necessary; sex andage specific information about radiological osteo-arthritis had to be available; and the radiologicalosteoarthritis data had to be presented for individualjoints or groups of joints. Furthermore, informationabout the origin of the population, the sample size,the sampling technique, and the range of age and ofjoints for which radiographs had been taken had tobe available. Table 1 presents the basic data of 10populations with a total of 22 629 participants. Twolarge surveys, the Alaskan Eskimo1 and theJamaican survey,12 were not included because no
ZOETERMEER POPULATION (EPOZ)
(A)Women: hips, knees, shoulders and SI-jointsradiological osteoarthritis grade > 2
100'
t 80ao
0
0.o0
a
CO 70-
Y 100
40 SI 60 70YAAGE IN YEARS
ZOETERMEER POPULATION (EPOZ)(C)Women: spine-radiological osteoarthritisand disc degeneration grade > 2
t*oo
._ ,o
ZOETERMEER POPULATION (EPOZ)
(B)Men: hips, knees, shoulders and Si-jointsradiological osteoarthritis grade > 2
Population Age Radiographs* Sample Method(reference) size
Leigh 55-64 h,f,c,l,p(35+) 1343 Stratified(3, 13) 1954 England sample 200/decade
Wensleydale 15+ h,f,c,1(35+), 891 Village (urban(3, 13) 1958 England p(35+) and rural)
Blackfeet Indians 30+ h,f,c,p(45+) 1101 Tribe(14) 1961 USA
Pima Indians 30+ h,f,c,p(45+) 969 Tribe(14) 1965 USA
Tecumseh 35+ h,c 4415 Age and social class(15) 1962 USA strata
Sofia 15+ h,f,c,l,p 4318 Age stratified(16) 1964 Bulgaria random sample
Tswana 30+ h,f,p(55+), 801 Village(6) 1970 South Africa 1(55+)
HANES I 25+ k,p 6913 Representative sample(17, 18) 1971-1974 USA
Iwata Kamitonda 30+ h,f,p 1335 Village(personal communication)1972 Japan
Tsikundamalema 18+ h,f 543 Village(7) 1984 South Africa
*h=hands; f=forefeet; c=cervical spine; l=lumbar spine; k=knee; p=pelvis; s=shoulders; (45+)=from the age of 45.
age and sex specific prevalences were presented forindividual joints.
Japanese population data from Kamitonda (KShichikawa, personal communication) were in-cluded despite the lack of radiological informationin 45% because no other acceptable populationsurvey data were available about Asian people. TheSofia data are the only ones from Eastern Europe,but they were presented while the survey was notfully completed and it is uncertain whether this wasreason for bias. The Atlas of Standard Radiographswas used in all surveys except the Tecumseh study. 15Most radiographs were interpreted by investigatorsoriginally trained by J S Lawrence or J H Kellgren.
Results
Sex and age specific prevalences of radiologicalosteoarthritis of 22 joints and joint groups of theZoetermeer population are presented as graphs(Figs 1 and 2). Age specific prevalences for bothmild and severe osteoarthritis, which we obtained inthis survey, are given in full in Tables 2 and 3.Kellgren's grades 0 and 1 were considered asabsence and grade 2, 3, and 4 as presence ofradiological osteoarthritis. Shoulders were includedin the graphs, though radiographs were taken inonly one third of the total population sample andonly few subjects in the higher age categories werepresent. The standard errors of the prevalence ofthese joints will therefore be larger.
Increased radiological osteoarthritis is stronglyrelated to aging. This holds both for small joints andfor large weight bearing joints and for both men andwomen. Small joints of the hands, tarsometatarsal,and lateral metatarsophalangeal joints of the feetand both knees were more often involved in womenof all ages. The hips were more often involved inmiddle aged men and the lumbar and cervical spinewere more often involved in all men. There was nosignificant sex difference except for knees, hips inthose aged 65 and over, and distal interphalangealjoints of the hands.
Considerable differences were found for the ageof onset and the prevalence of radiological osteo-arthritis with age of different joints. Distal inter-phalangeal and metacarpophalangeal joints werealready affected in 10% and first metatarsopha-langeal joints even in 20% of the normal populationat the age of 40. Disc degeneration of lumbar andcervical spine was more often present than absent inboth men and women above the age of 50.To compare differences and similarities of preva-
lences of radiological osteoarthritis between thepopulations studied so far graphs were used in whichthe percentages of involved, joints were plottedagainst age. Not all joints about which data wereavailable are presented here. Very different jointsare given as examples (Figs 3 and 4). Standarderrors are not indicated on the graphs because theywere not always available and because of the densityof the lines. During assessment of the graphs it mustbe remembered that sample sizes were sometimes
on 9 January 2019 by guest. Protected by copyright.
http://ard.bmj.com
/A
nn Rheum
Dis: first published as 10.1136/ard.48.4.271 on 1 A
276 van Saase, van Romunde, Cats, Vandenbroucke, Valkenburg
+ Ot mt ) aN - r- Tr 4 tc r- -t ,o m O m O N 0-t Ot r- m m O t -t ,0 £o a-, so 0- s 11 N 't
1- en W) 00 tn t 00 C, 00 0 -t ON C4 tn r- 00 tn 0^ o0 0 en tn 4 )boontn eno tn CIN I- CN r- _
R~~~~~~~~~~~~~~~~~~~~~~~~~~~~~~~; l8 C; Cm X; 6 8 Ob_: lXobC o 6 a C;moci 4 4 60 C- C moFo
X~ ~ ~~~~~~~~~_
t I"on It 11 r- enN o£ as 0 It ON__ NoIC C1 Xnr- 00 a- No as 0 0 en 'I 'I %£
E~~~~~~~~~~~~- 1-:11 ;)N 11 tF t;- 11 4 'l 4tb k; 4 ;, 4 6O) b;£ :. 4 [;I~-t 4 4 Xb 4 O b ,b C; O 6 11 N C- c.0~~~~~~~~S C:IDOlb en r. r:- eqc w) _1I- W)_ _ _-- e-n_-4 5::
u~~~~~~~~~~~~z 4 :. csl11lb(£>":)C-nn 'A
-OC;)C- C-nOOt£_no o
4 v 11 b_ I~r~~~~~~~~~~~~r- C4 r4 I 0 O,N "o _DXo £ s ON 0 as t as _ 0 0 o 00 C1 X0 r- X) _) N mm>
E I ;111gonn 11£N 11OmowOtO_I>^XI<_X>>IoI^_^_zaxoIN111o^tI~~~~~~~~~~~~~~~~~~~~~~~~~~~en le
u~~~~~~~~~~~~ 41 'A ob (6 6_1_l 4 lb 6 6 o ;.o 6- ~ 6 %Ao ^oCoo 4 d>t o F -F- o.C- -
2 ~ ~ ~~~~~~~cn r-o l 111 -4 c- tl tn r-o) en M r- r- = M O' C) ,I M ". m r- r-o CD CD ONmS W ~~~~~~~116' C6 410 <5110 6O 6 b6 e; r: tA 6O;6 O~C N _~ C-_, CIN 11 6 _
E I tF 1$ __£ oNt NXC:S: tn en S:
A~~~~~~~~~eIn 00 en1 t Q11XOIC X,l0 00a, -O-OtS W) 'ISOO i w'O
E~~~~~~~~~~~~~~~~~~~~~~~~CI;I6 e;cW r:.W>noCN 6CS4 6Co4 c-N r
s0 ffi 11 X~~S: n - : n 11 1-- -4 N I- I^.t~~~~~~~~00t~~~~~~~~C>ttKl 11~~~~~~~~~~~~~~~~~~~Il084 C1 0011 \0 C1 lrV 4 0 all 00 C4 ~-
%I 181="°°I~~~rW ='o obtsIIIloolo1 lo1
Z. C7.,1tn0t c^ d>ll o sI,o2('=l '2>~~~~~~~~0 r
Y~~~~~~~~~~+++++ + + ++++++++++++++++++++++++++++++++++ ++++810 J ts ^ N n~~~~~~~~~~~C1 en en ts4 en en " enth en ts en eSn q en t4 en cn cntS en M C1tS M en Cq en enN nt
x _~~~~~~~~~~~~~~~~~~~~~~~~~~~~~~~~~~~~~~~~~~~~~~~~~~~~~~~~~~~~~~~~~~~~~~~~
a: n 2 a ;, 9 t o y E E S i X a - Y ° = <@Y,~~~~~~~~~~~~~u u
on 9 January 2019 by guest. Protected by copyright.
http://ard.bmj.com
/A
nn Rheum
Dis: first published as 10.1136/ard.48.4.271 on 1 A
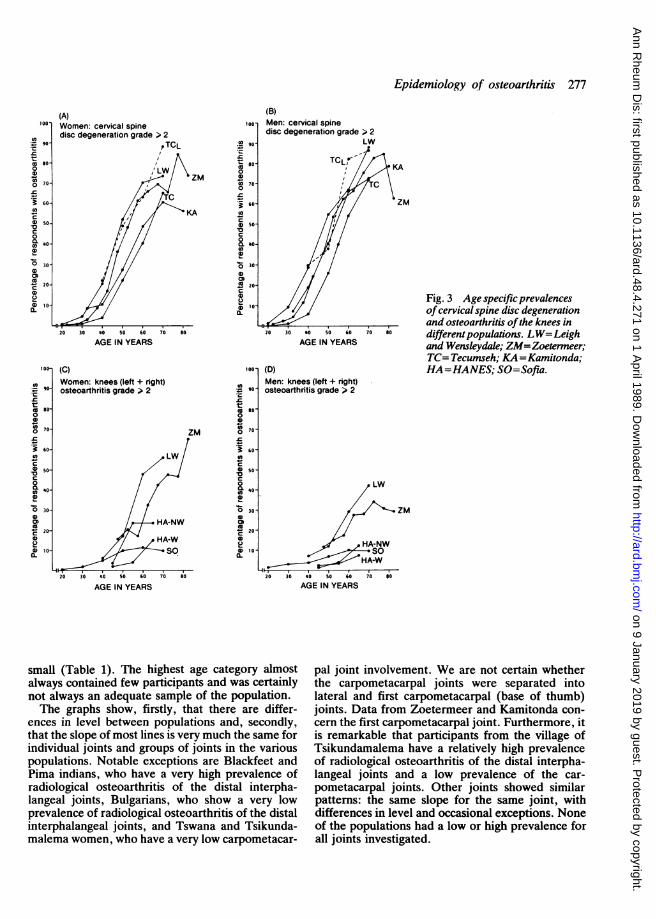
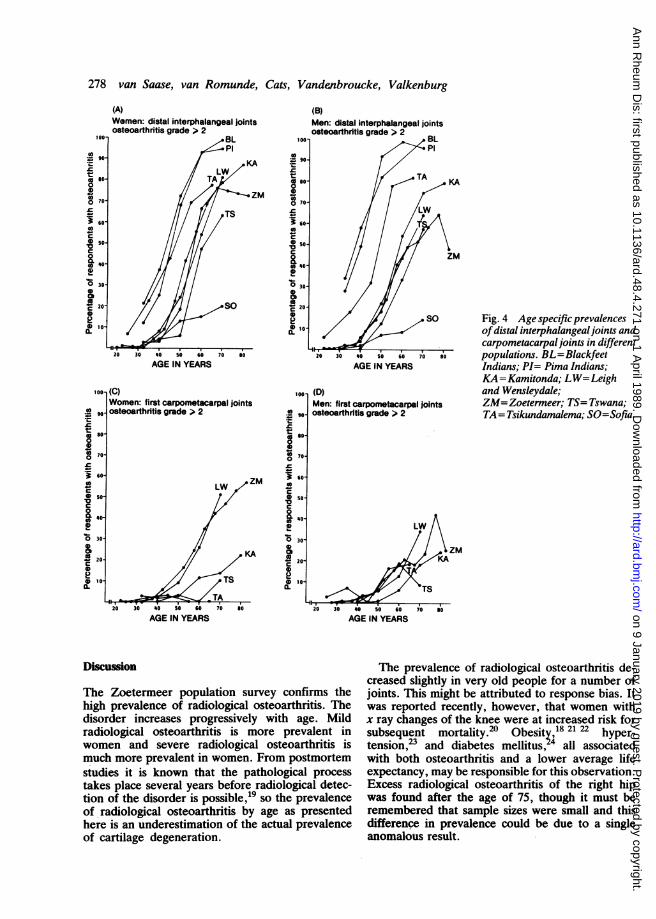
Fig. 3 Age specific prevalencesofcervical spine disc degenerationand osteoarthritis ofthe knees indifferentpopulations. LW=Leighand Wensleydale; ZM=Zoetermeer;TC= Tecumseh; KA=Kamitonda;HA=HANES; SO=Sofia.
so
20 30 40 50 60 70 80AGE IN YEARS
small (Table 1). The highest age category almostalways contained few participants and was certainlynot always an adequate sample of the population.The graphs show, firstly, that there are differ-
ences in level between populations and, secondly,that the slope of most lines is very much the same forindividual joints and groups of joints in the variouspopulations. Notable exceptions are Blackfeet andPima indians, who have a very high prevalence ofradiological osteoarthritis of the distal interpha-langeal joints, Bulgarians, who show a very lowprevalence of radiological osteoarthritis of the distalinterphalangeal joints, and Tswana and Tsikunda-malema women, who have a very low carpometacar-
pal joint involvement. We are not certain whetherthe carpometacarpal joints were separated intolateral and first carpometacarpal (base of thumb)joints. Data from Zoetermeer and Kamitonda con-cern the first carpometacarpal joint. Furthermore, itis remarkable that participants from the village ofTsikundamalema have a relatively high prevalenceof radiological osteoarthritis of the distal interpha-langeal joints and a low prevalence of the car-pometacarpal joints. Other joints showed similarpatterns: the same slope for the same joint, withdifferences in level and occasional exceptions. Noneof the populations had a low or high prevalence forall joints investigated.
*oo-
.I W
on 9 January 2019 by guest. Protected by copyright.
http://ard.bmj.com
/A
nn Rheum
Dis: first published as 10.1136/ard.48.4.271 on 1 A
(D)Men: first carpometacarpal jointsosteoarthritis grade > 2
Fig. 4 Age specific prevalencesofdistal interphalangeal joints andcarpometacarpal joints in differentpopulations. BL=BlackfeetIndians; PI= Pima Indians;KA=Kamitonda; LW=Leighand Wensleydale;ZM=Zoetermeer; TS= Tswana;TA= Tsikundamalema; SO=Sofia.
ZM
AGE IN YEARS
Discussion
The Zoetermeer population survey confirms thehigh prevalence of radiological osteoarthritis. Thedisorder increases progressively with age. Mildradiological osteoarthritis is more prevalent inwomen and severe radiological osteoarthritis ismuch more prevalent in women. From postmortemstudies it is known that the pathological processtakes place several years before radiological detec-tion of the disorder is possible,'9 so the prevalenceof radiological osteoarthritis by age as presentedhere is an underestimation of the actual prevalenceof cartilage degeneration.
The prevalence of radiological osteoarthritis de-creased slightly in very old people for a number ofjoints. This might be attributed to response bias. Itwas reported recently, however, that women withx ray changes of the knee were at increased risk forsubsequent mortality.20 Obesity 18 21 22 hyper-tension,23 and diabetes mellitus, ' all associatedwith both osteoarthritis and a lower average lifeexpectancy, may be responsible for this observation.Excess radiological osteoarthritis of the right hipwas found after the age of 75, though it must beremembered that sample sizes were small and thisdifference in prevalence could be due to a singleanomalous result.
0).a
0
20
a
0
C
0
tL
0o
c
0
c
0
2
a
0
0.
D
S.Na
c
20
0a0
I.02e)40.,
AGE IN YEARS
on 9 January 2019 by guest. Protected by copyright.
http://ard.bmj.com
/A
nn Rheum
Dis: first published as 10.1136/ard.48.4.271 on 1 A
All data were obtained from cross sectionalpopulation surveys and were therefore less suitedfor evaluation of the process of joint involvement byage. Conclusions about joint involvement and agecan therefore only be drawn from these data if birthcohort effects are negligible. This may be a source ofbias, for example, for populations where selectivemortality occurred during periods of starvation orwar. As no follow up surveys are available, how-ever, we ignored possible birth cohort effects andcompared the results of the Zoetermeer survey withthose of 10 other population surveys. Figures 2Aand 2B demonstrate identical slopes (parallelism)together with differences in level for most joints.This means that when the process of osteoarthritisfirst occurs in a certain joint or group of joints therate of increase of degeneration of that joint orgroup of joints per unit of time is the same in allpopulations from that point on. A higher levelmeans that the radiological appearance of osteo-arthritis occurs at younger ages. Differences in levelshowed a tendency to increase while differences ofslope remained minimal when several joints wereconsidered together, as shown for all the joints ofthe hand.4
Differences between populations can be ex-plained in several ways. Firstly, different investiga-tors may be more or less inclined to give a higher orlower score, and interobserver variation is probablein the interpretation of radiographs. Furthermore,the freedom of interpretation of the standardisingatlas is rather large. Interobserver variation as thesole cause for differences in level is less probable.Lawrence and Sebo read radiographs from 17surveys with a total of 7919 participants.5 Theyfound important differences between populations,though it was not stated whether these were differ-ences in level or differences of slope. Secondly, it isquite possible that differences between populationsare not artificial. Evidence from genetic as well asenvironmental studies indicates that differences are,at least in part, true differences. An increased ordecreased presence of risk factors or protectivefactors may be responsible for these differences inlevel. Osteoporosis for instance seems to protectagainst osteoarthritis.25 Factors that influence(subchondral) bone density, like vitamin D, alcoholconsumption, and anthropometric status, differbetween races and populations.26-- Furthermore,differences in level may in part be explained by adifferent distribution of these risk factors. Obesity isa strong risk factor for osteoarthritis for a number ofjoints.f 22 Between populations with a high and alow percentage of obese persons a level difference islikely. If this obesity-osteoarthritis relation were notlinear a difference of slope would exist.
Another explanation for differences in level is thedistinction, as proposed by the American Rheuma-tism Association, between idiopathic and secon-dary types of osteoarthritis. This distinction was notreported separately in any of the populations.Therefore it is even more surprising that evenwithout information about the distribution ofidiopathic and secondary osteoarthritis the graphsshow such strong parallelism. This may suggest thatsecondary osteoarthritis has more or less the sameprevalence in different populations or that theprevalence of secondary osteoarthritis is low anddoes not influence the slope. Lack of informationabout risk factors and about the prevalence ofsecondary osteoarthritis limits causal inferencesbased on these comparison data. Surveys in areaswhere the prevalence of osteoarthritis is determinedby the occurrence of special joint diseases likeMseleni joint disease3o and Kashin-Beck disease3' 32were not included in this study.
Osteoarthritis is a slowly developing process,which makes it very difficult to approach theproblem by intervention studies. We had hoped thatcomparison data of very different populations wouldgive solutions for the many problems that surroundthe causes and development of this disease or groupof diseases. The only data that could be comparedfrom a reasonable number of surveys were theradiological data. Data on body mass index, pain,limitation of movement, bone mass, etc are notavailable from most of the populations. Furtherepidemiological studies of osteoarthritis, especiallywhen prevention is one of the ultimate goals, shouldbe directed towards differentiating the types ofosteoarthritis. Secondary types, like crystal arthro-pathy, osteoarthritis developing in the course ofendocrine disorders, and psoriasis, should be sepa-rated from so called idiopathic osteoarthritis. For anumber of population surveys it is probably suffi-cient to re-evaluate the existing data and reread theradiographs.We conclude that osteoarthritis is a worldwide
disease and that no population investigated so farhas been spared. Differences exist between popula-tions. These differences are differences in level andwhether they are real differences or due to interob-server variation or to differences in the distributionof risk factors or genetic differences has yet to beestablished. Joints with a low prevalence of osteoar-thritis in one population are relatively spared in allpopulations, while frequently affected joints showsigns of degeneration in all populations. It istherefore most likely that the aetiology of mostosteoarthritis is the same in all populations. Cartil-age changes are the result of longstanding metabolicand mechanical processes. The relative importance
on 9 January 2019 by guest. Protected by copyright.
http://ard.bmj.com
/A
nn Rheum
Dis: first published as 10.1136/ard.48.4.271 on 1 A
280 van Saase, van Romunde, Cats, Vandenbroucke, Valkenburg
of each of these processes can, unfortunately, not becompared because they are rarely available andeven when available lack methodological standard-isation. Similarities of slopes argue in favour of thepossibility of extrapolating results from one popula-tion survey to others. Thus conclusions drawn aboutthis Dutch population can be applied to otherpopulations.
The authors wish to thank Dr H C M Haanen who was the secondreader of most of the radiographs and Dr K Shichikawa whosupplied the data from the Kamitonda study. This study was
supported by grants from The Netherlands Prevention Fund andThe Netherlands Foundation against Rheumatism.
1 Acheson R. Heberden oration 1981. Epidemiology and thearthritides. Ann Rheum Dis 1982; 41: 325-34.
2 Kelsey J L. Prevalence studies of the epidemiology of osteoar-thritis. In: Lawrence R C, Shulman L E, eds. Epidemiology ofthe rheumatic diseases. 1st ed. New York: Gower Medical, 1984:282-8.
3 Lawrence J S, Bremner J M, Bier F. Osteoarthrosis. Preva-lence in the population and relationship between symptoms andx-ray changes. Ann Rheum Dis 1966; 25: 1-24.
4 National Centre for Health Statistics. Prevalence of osteoarthri-tis by age, sex, race and geographic area. United States1960-1962. Public Health Service Publication No 1000. 1966:series 11, No 15: 1-11.
S Lawrence J S, Sebo M. The geography of osteoarthritis. In:Nuki G, ed. The aetiopathogenesis of osteoarthritis. 1st ed.London: Pitman Medical, 1980: 155-83.
6 Solomon L, Beighton P, Lawrence J S. Osteoarthrosis in a ruralSouth African negro population. Ann Rheum Dis 1976; 35:274-8.
7 Brighton S W, De La Harpe A L, Van Staden D A. Theprevalence of osteoarthrosis in a rural African community. Br JRheumatol 1985; 24: 321-5.
8 Valkenburg H A, Haanen H C M. The epidemiology of lowback pain. In: White A A, Gordon S L, eds. Symposium on
9 Kellgren J H, Jeffrey M R, Ball J. Atlas of standard radio-graphs. Vol II. The epidemiology of chronic rheumatism.Oxford: Blackwell Scientific, 1963.
10 Haanen H C M. An epidemiological survey on low back pain.Rotterdam: Erasmus University, 1984: 50-2. (Thesis.)
11 Blumberg B S, Bloch K J, Black R L, Dotter C. A study of theprevalence of arthritis in Alaskan eskimos. Arthritis Rheum1961; 4: 325-39.
12 Bremner J M, Lawrence J S, Miall W E. Degenerative jointdisease in a Jamaican rural population. Ann Rheum Dis 1968;27: 326-32.
13 Lawrence J S. Disc degeneration. Its frequency and relation tosymptoms. Ann Rheum Dis 1969; 28: 121-38.
14 Bennet P H, Burch T A. Osteoarthrosis in the Blackfeet andPima Indians. In: Kellgren J H, Jeffrey M R, Ball J, eds. Atlasof standard rediographs. Vol II. The epidemiology of chronicrheumatism. Oxford: Blackwell Scientific, 1963: 407-12.
15 Mikkelsen W M, Duff I F, Dodge H D. Age-specific prevalenceof radiographic abnormalities of the joints of the hands, wristsand cervical spine of adult residents of the Tecumseh, Michigan,community health study area, 1962-1965. J Chronic Dis 1970;23: 151-9.
16 Tzonchev V T, Pilossoff T, Kanev K. Prevalence of osteoarthri-tis in Bulgaria. In: Bennett P H, Wood P H N, eds. Populationstudies of the rheumatic diseases. 1st ed. New York: ExcerptaMedica, 1966: 413-6.
17 National Centre for Health Statistics. Basic data on arthritis,knee, hip and sacroiliac joints in adults ages 25-74 years. UnitedStates 1971-1975. Public Health Service Publication No 1000.1979: series 11, No 213: 1-8.
18 Hartz A J, Fisher M E, Bril G, et al. The association of obesitywith joint pain and osteoarthritis in the HANES data. J ChronicDis 1986; 39: 311-9.
19 Byers P D, Contepomi C A, Farkas T A. A post mortem studyof the hip joint. Ann Rheum Dis 1970; 29: 15-31.
20 Lawrence R C, Everett D F, Cornoni-Huntley J, HochbergM C. Excess mortality and decreased survival in females withosteoarthritis of the knee [Abstract]. Arthritis Rheum 1987; 30:S130.
21 Felson D T, Anderson J J, Naimark A, Walker A M, MeenanR F. Obesity and knee osteoarthritis. The Framingham study.Ann Intern Med 1988; 109: 18-24.
22 Saase J L C M van, Vandenbroucke J P, Romunde L K J van,Valkenburg H A. Osteoarthritis and obesity in the generalpopulation. A relationship calling for an explanation. JRheumatol 1988; 15: 1152-8.
23 Lawrence J S. Hypertension in relation to musculoskeletaldisorders. Ann Rheum Dis 1975; 34: 451-6.
24 Smythe H A. Osteoarthritis, insulin and bone density. JRheumatol 1987; 14: 91-3.
25 Dequeker J. The relationship between osteoporosis andosteoarthritis. Clin Rheum Dis 1985; 11: 271-96.
26 Solomon L. Bone density in ageing Caucasian and Africanpopulations. Lancet 1979; ii: 1326-9.
27 Horseman A. Bone mass. In: Nordin B E C, ed. Calcium,phosphate and magnesium metabolism. 1st ed. Edinburgh:Churchill Livingstone, 1976: 357-404.
28 Radin E L. Paul I L, Rose R M. Role of mechanical factors inpathogenesis of primary osteoarthrosis. Lancet 1972; i: 519-21.
29 Altman R, Asch E, Bloch D, et al. Development of criteria forthe classification and reporting of osteoarthritis. Classificationof osteoarthritis of the knee. Arthritis Rheum 1986; 29: 1039-49.
30 Yach D, Botha J L. Mseleni joint disease in 1981: decreasedprevalence rates, wider geographical location than before, andsocioeconomic impact of an endemic osteoarthrosis in anunderdeveloped community in South Africa. Int J Epidemiol1985; 14: 276-84.
31 Nesterov A I. The clinical course of Kashin-Beck disease.Arthritis Rheum 1964; 7: 29-40.
32 Sokoloff L. Endemic forms of osteoarthritis. Clin Rheum Dis1985; 11: 187-202.
on 9 January 2019 by guest. Protected by copyright.
http://ard.bmj.com
/A
nn Rheum
Dis: first published as 10.1136/ard.48.4.271 on 1 A