+ All Categories
Home > Documents > Epidemiology of varicella zoster virus infections in ...

Epidemiology of varicella zoster virus infections in ...

Date post: 16-Oct-2021
Category:
Upload: others
View: 3 times
Download: 0 times
Share this document with a friend
13
12-Jul-17 1 Epidemiology of varicella zoster virus infections in Australia, 1998-2015 Meru Sheel, Helen Quinn, Frank Beard, Aditi Dey, Martyn Kirk, Kristine Macartney MAE Scholar National Centre for Immunisation Research and Surveillance National Centre for Epidemiology and population Health, Australian National University Varicella (chicken pox) Primary infection with varicella zoster virus (VZV) Acute and self-limiting Severe complications November 2005, vaccine funded under the National Immunisation Program (NIP) Children aged 18 months
Transcript

12-Jul-17

1

Epidemiology of varicella

zoster virus infections in

Australia, 1998-2015

Meru Sheel, Helen Quinn, Frank Beard, Aditi Dey, Martyn Kirk,

Kristine Macartney

MAE Scholar

National Centre for Immunisation Research and Surveillance

National Centre for Epidemiology and population Health,

Australian National University

Varicella (chicken pox)

• Primary infection with varicella

zoster virus (VZV)

• Acute and self-limiting

• Severe complications

• November 2005, vaccine

funded under the National

Immunisation Program (NIP)

• Children aged 18 months

12-Jul-17

2

Herpes zoster (shingles)

• Reactivation of latent VZV

• Rash accompanied with acute pain

• Severe complications: Post-herpetic neuralgia (PHN)

• November 2016, vaccine funded under the NIP

• Adults aged 70-79 years

Study Aims

• Epidemiological review of varicella and herpes

zoster

• Baseline for herpes zoster

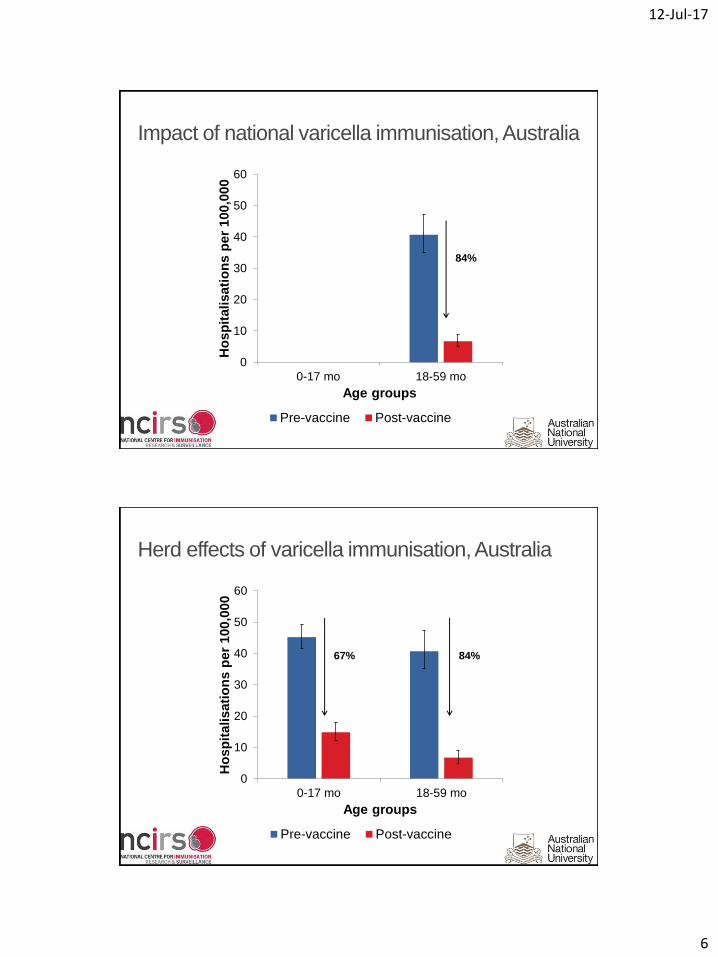
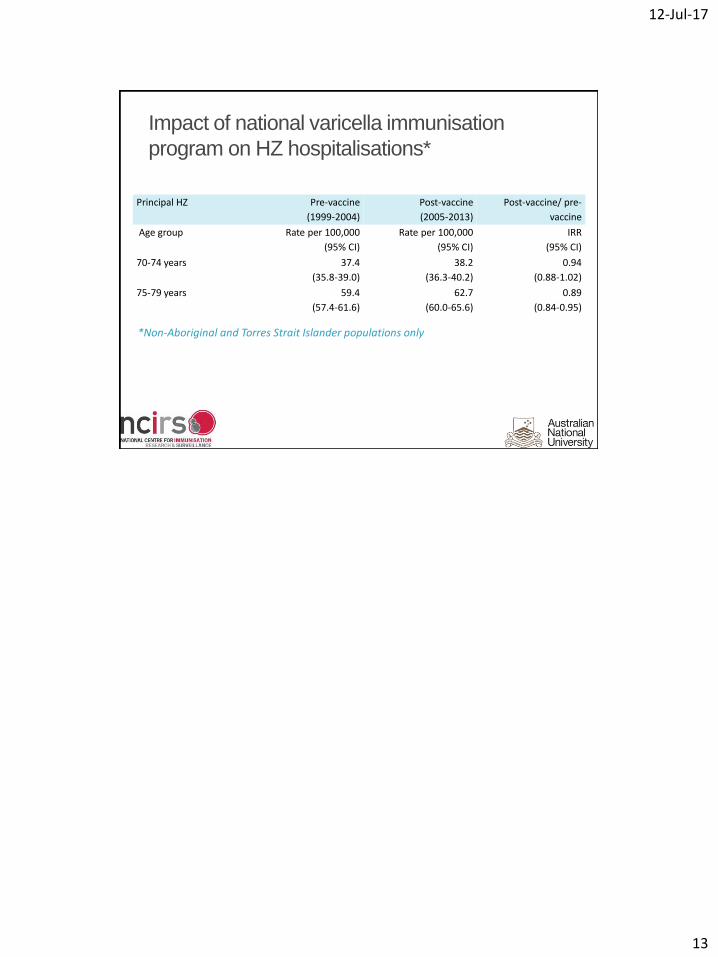
• Assess the impact of the national varicella

immunisation program

• Varicella

• Herpes zoster (HZ)

12-Jul-17

3

Data sources

National Notifiable Diseases Surveillance System (NNDSS)

2002-2015

National Mortality Database & Causes of Death Data, Australian

Coordinating Registry and Australian Bureau of Statistics

1998-2013

Mid-year population estimates from the Australian Bureau of Statistics

National Hospital Morbidity Database maintained by the Australian Institute of

Health and Welfare1999-2013

ICD-10-AMVaricella: B01.0- B01.9

HZ: B02.0- B02.9PHN: B022, G530, G531

Analyses

• Rates per 100,000

• Notifications

• Hospitalisations

• Principal diagnoses

• Negative binomial regression

• Pre-varicella vaccine (1999-2004) versus post-varicella

vaccine (2007-2013)

• Indigenous status

12-Jul-17

4

VZV notifications, Australia, 2002-2015

Chickenpox ShinglesUnspecified

VZV notifications, Australia, 2002-2015

Chickenpox ShinglesUnspecified

N/A

C 7.1%S 3.8%U 89.1%

C 41.9%S 56.4%U 1.8%

C 24.1%S 66.3%U 9.7%

C 17.1%S 38.9%U 44%

C 12.7%S 26.5%U 60.7%

C 11.4%S 63.8%U 24.8%C 13.2%

S 19.8%U 66.9%

12-Jul-17

5

Varicella notification rates, SA, 2002-2015

0

50

100

150

200

250

300

350

400

450

200

2

200

3

200

4

200

5

200

6

200

7

200

8

200

9

201

0

201

1

201

2

201

3

201

4

201

5

No

tifi

cati

on

s p

er

10

0,0

00

Year of notification

0-4 years

5-9 years

10-14 years

15-19 years

20-29 years

30-39 years

≥40 years

Vaccine funded

Varicella hospitalisation rates, Australia, 1999-2013

0

10

20

30

40

50

60

19

99

20

00

20

01

20

02

20

03

20

04

20

05

20

06

20

07

20

08

20

09

20

10

20

11

20

12

20

13

Ho

spit

alis

atio

ns

pe

r 1

00

,00

0

Year

0-17 months18-59 months5-9 years10-14 years15-19 years20-29 years30-39 years≥40 years

Vaccine funded

12-Jul-17

6

Impact of national varicella immunisation, Australia

0

10

20

30

40

50

60

0-17 mo 18-59 mo

Ho

sp

italisati

on

s p

er

100,0

00

Age groups

Pre-vaccine Post-vaccine

84%

Herd effects of varicella immunisation, Australia

0

10

20

30

40

50

60

0-17 mo 18-59 mo

Ho

sp

italisati

on

s p

er

100,0

00

Age groups

Pre-vaccine Post-vaccine

84%67%

12-Jul-17

7

0

0.5

1

1.5

2

2.5

3

0.0 0.0 0.0 0.0 0.0 0.0 0.0 0.0 0.0 0.0

Inci

de

nce

rat

e r

atio

*

Age groups

pre-varicella vaccine

post-varicella vaccine

0-17 months 18-59 months All ages

Varicella in Indigenous Australians, 2002-2013#

#QLD, WA, NT and SA* Indigenous vs non-Indigenous people

Varicella mortality, Australia, 1998-2013

• In persons aged <10 years

• 1998-2004: 6 deaths

• 2007-2013: <4 deaths

• In persons aged ≤40 years

• 1998-2004: 15 deaths

• 2007-2013: 5 deaths

12-Jul-17

8

HZ notification rates, SA, 2002-2015

0

50

100

150

200

250

300

350

400

20

02

20

03

20

04

20

05

20

06

20

07

20

08

20

09

20

10

20

11

20

12

20

13

20

14

20

15

No

tifi

cati

on

s p

er

10

0,0

00

Year of notification

0-49 years

50-59 years

60-69 years

70-79 years

≥80 years

HZ & PHN hospitalisations, Australia, 1999-2013

0

10

20

30

40

50

60

70

80

90

100

19

99

20

00

20

01

20

02

20

03

20

04

20

05

20

06

20

07

20

08

20

09

20

10

20

11

20

12

20

13

Ho

spit

alis

atio

ns

pe

r 1

00

,00

00

Year

PHN 70-74 years PHN ≥75 years PHN all ages

HZ 70-74 years HZ ≥75 years HZ all ages

12-Jul-17

9

Conclusions

• Varicella

• Reduced incidence

• Hospitalisations reduced by 84% in children aged 18-59

months

• ‘Plateaued’ hospitalisation rates

• ~ 300 hospitalisations in <40 year age group

• Herpes zoster

• Increased notifications

• Lack of useful data for monitoring disease epidemiology

and vaccine impact

Recommendations

• Establish robust surveillance for varicella, herpes

zoster and post-herpetic neuralgia

• Re-examine NIP funding of a 2nd dose of varicella

vaccine

12-Jul-17

10

Acknowledgements

• Peter McIntyre, NCIRS

• Ann Koehler, South Australia Health

• Peter Markey, Department of Health, Northern Territory

• Allison Cairns, Commonwealth Department of Health

• NCIRS & MAE colleagues

• Australian Coordinating Registry, state and territory registries of births, deaths

and marriages, state and territory coroners, and the National Coronial

Information System

12-Jul-17

11

Data Limitations

• Time lag in receiving administrative datasets

• Limited baseline data

• Poor reporting through the NNDSS

• Limited age-specific data for Indigenous

populations

• Incomplete Indigenous status for earlier years

• Only 3% cases of HZ are hospitalised

Varicella vaccine coverage, Australia, 2006-2015

0

10

20

30

40

50

60

70

80

90

100

30

Sep

06

31

Mar

07

30

Sep

07

31

Mar

08

30

Sep

08

31

Mar

09

30

Sep

09

31

Mar

10

30

Sep

10

31

Mar

11

30

Sep

11

31

Mar

12

30

Sep

12

31

Mar

13

30

Sep

13

31

Mar

14

30

Sep

14

31

Mar

15

30

Sep

15

Var

ice

lla v

acci

ne

co

vera

ge (

%)

Coverage assessment date

MMR-V

12-Jul-17

12

Varicella-related hospitalisations, Australia 1999-

2013

0

2

4

6

8

10

12

19

99

20

00

20

01

20

02

20

03

20

04

20

05

20

06

20

07

20

08

20

09

20

10

20

11

20

12

20

13

Ho

spit

ali

sati

on

s p

er

10

0,0

00

po

pu

lati

on

Year of admission

Principal diagonses All diagnoses

Varicella vaccinefundedPre-vaccine Post-vaccine

Reduced hospitalisation in children less than 10

years of age

Pre-vaccine

(1999-2004)

Post-vaccine

(2005-2013)

Post-vaccine/ pre-

vaccine

Age group Rate per 100,000

(95% CI)

Rate per 100,000

(95% CI)

IRR

(95% CI)

0-17 months 45.2

(41.6-549.1)

14.8

(12.1-18.1)

0.33

(0.26-0.40)

18-59 months 40.7

(35.1-47.2)

6.7

(5.0-8.9)

0.16

(0.12-0.23)

5-9 years 8.9

(7.82-10.2)

3.6

(2.5-5.0)

0.40

(0.27-0.58)

12-Jul-17

13

Impact of national varicella immunisation

program on HZ hospitalisations*

Principal HZ Pre-vaccine

(1999-2004)

Post-vaccine

(2005-2013)

Post-vaccine/ pre-

vaccine

Age group Rate per 100,000

(95% CI)

Rate per 100,000

(95% CI)

IRR

(95% CI)

70-74 years 37.4

(35.8-39.0)

38.2

(36.3-40.2)

0.94

(0.88-1.02)

75-79 years 59.4

(57.4-61.6)

62.7

(60.0-65.6)

0.89

(0.84-0.95)

*Non-Aboriginal and Torres Strait Islander populations only


Recommended