Epigeal spider responses to fertilization and plant litter: testing biodiversity theory at the ground level L. Brian Patrick 1 , Mark W. Kershner 2 and Lauchlan H. Fraser 3 : 1 Department of Biological Sciences, Dakota Wesleyan University, 1200 W. University Avenue, Mitchell, South Dakota 57301, USA. E-mail: [email protected]; 2 Department of Biological Sciences, Kent State University, Kent, Ohio 44242, USA; 3 Department of Natural Resource Sciences, Thompson Rivers University, 900 McGill Road, Kamloops, British Columbia V2C 5N3, Canada Abstract. Recent studies of nutrient additions to terrestrial ecosystems have focused on the ‘‘aerial’’ portion of the food web associated with living plants. These studies showed nutrient loading increased arthropod abundance and biomass, but decreased diversity. However, none of these studies explicitly examined nutrient loading effects on epigeal arthropods. To test nutrient loading effects on epigeal spiders and on individual species within a temperate-latitude grassland community, we used pitfall traps to sample spiders for four years within 24 large (314 m 2 ) plots in which we manipulated nutrients (NPK fertilizer) and plant litter (litter removed or left in place). We measured the diversity, abundance, biomass, and community structure responses of the spider community, and of wolf spiders (Lycosidae) and linyphiid spiders (Linyphiidae), as well as the abundance and biomass responses of the six most common species. We hypothesized increased nutrient loading would increase epigeal spider abundance and biomass but decrease diversity. Contrary to predictions, spider species richness, diversity, and biomass were not significantly affected by fertilization, while fertilization resulted in significantly increased abundance. Also contrary to predictions, plant litter did not affect any of these variables. Linyphiid spiders had the strongest responses to fertilization, with significantly increased abundance and biomass, and, contrary to predictions, increased species richness in fertilized plots. Wolf spiders responded more closely to predictions. Our results indicate that the epigeal spider community does not respond as would be predicted by biodiversity-productivity theory. This underscores the need to integrate the largely detritus-based epigeal community into current biodiversity-productivity theory. Keywords: Araneae, Linyphiidae, Lycosidae, enrichment, disturbance, nitrogen Human activity has resulted in a significant increase in the global nitrogen (N) pool through fertilization and increased atmospheric N deposition (Vitousek et al. 1997; Fenn et al. 2003; Galloway et al. 2003). Typical plant community responses include decreased plant species richness, increased standing crop biomass, and the limitation of community com- position to a few dominant species (Hector et al. 1999; Tilman et al. 2002; Suding et al. 2005; Patrick et al. 2008a). This research has provided substantive support for biodiversity- productivity theory, which predicts declines in local and regional richness as one moves from mesotrophic to eutrophic systems (Grime 1973; McCann 2000; Worm & Duffy 2003; Suding et al. 2005; Chalcraft et al. 2008). Similarly with terrestrial arthropods, increased nutrient loading has been linked with decreased species richness and increased abun- dance, particularly among those species most closely linked to the living-plant portion of the food web (Knops et al. 1999; Haddad et al. 2000, 2001; but see Patrick et al. 2008b). This ‘‘eutrophication effect’’ (Fenn et al. 2003) can result in significant biodiversity loss and potential decline in important ecosystem functions, such as ecosystem stability (McCann 2000; Larsen et al. 2005). Previous studies of nutrient loading have focused on the portions of the food web closely tied to living plant material; e.g., the ‘‘aerial’’ arthropod community associated with the upper portions (e.g., stems) of plants (Knops et al. 1999; Haddad et al. 2000, 2001). Although there is evidence to support the eutrophication effect on aerial arthropod diver- sity, less is known regarding how nutrient loading affects the epigeal (ground-level) arthropod community. A differential response by the epigeal arthropod community may result from it being more closely tied to the detritus-based portion of the food web (Halaj & Wise 2002). Despite the important role it may play, the epigeal arthropod community remains an under- studied food web component (Wardle 2002; Ha ¨ ttenschwiler et al. 2005; Cross et al. 2006). Nutrient loading also increases plant litter production (Long et al. 2003; Patrick et al. 2008a), which can increase the basal food resource for the detrital community and increase detritivore and epigeal predator abundances (Halaj et al. 2000; Halaj & Wise 2002; Moore et al. 2004). Furthermore, plant litter increases habitat complexity, which can also increase arthropod abundance and diversity (Lawton 1983; Strong et al. 1984; Rypstra et al. 1999). Although more plant litter production could increase detritivore and epigeal predator abundance and biomass (Halaj et al. 2000), a reduction in litter diversity could result in decreased diversity of detritivores and epigeal predators (Ha ¨ ttenschwiler & Gasser 2005; Wardle 2006), mirroring the aerial community response to nutrient loading. Spiders, in particular, are abundant generalist predators (Wise 1993) that can significantly impact terrestrial food webs (Wise et al. 1999), and epigeal spiders (e.g., Lycosidae and Linyphiidae) are closely linked to the detritivore community (Wise et al. 1999; Chen & Wise 1999; Wise 2006). The abundance of epigeal spiders is limited ultimately by the abundance of their mainly detritivorous prey via bottom-up forces through the detritus-based portion of the food web (Chen & Wise 1999; Wise et al. 1999; Wise 2004, 2006). Thus, increasing plant detritus can increase spider abundance by increasing the quantity of food available to their detritivorous prey (Chen & Wise 1999; Wise et al. 1999; Wise 2004). Increased detritus also enhances habitat structure for hiding and web building (Uetz 1979, 1991; Rypstra et al. 1999), which 2012. The Journal of Arachnology 40:309–324 309
Transcript
Epigeal spider responses to fertilization and plant litter: testing biodiversity theory at the ground level
L. Brian Patrick1, Mark W. Kershner2 and Lauchlan H. Fraser3: 1Department of Biological Sciences, Dakota Wesleyan
University, 1200 W. University Avenue, Mitchell, South Dakota 57301, USA. E-mail: [email protected]; 2Department
of Biological Sciences, Kent State University, Kent, Ohio 44242, USA; 3Department of Natural Resource Sciences,
Thompson Rivers University, 900 McGill Road, Kamloops, British Columbia V2C 5N3, Canada
Abstract. Recent studies of nutrient additions to terrestrial ecosystems have focused on the ‘‘aerial’’ portion of the foodweb associated with living plants. These studies showed nutrient loading increased arthropod abundance and biomass, butdecreased diversity. However, none of these studies explicitly examined nutrient loading effects on epigeal arthropods. Totest nutrient loading effects on epigeal spiders and on individual species within a temperate-latitude grassland community,we used pitfall traps to sample spiders for four years within 24 large (314 m2) plots in which we manipulated nutrients(NPK fertilizer) and plant litter (litter removed or left in place). We measured the diversity, abundance, biomass, andcommunity structure responses of the spider community, and of wolf spiders (Lycosidae) and linyphiid spiders(Linyphiidae), as well as the abundance and biomass responses of the six most common species. We hypothesized increasednutrient loading would increase epigeal spider abundance and biomass but decrease diversity. Contrary to predictions,spider species richness, diversity, and biomass were not significantly affected by fertilization, while fertilization resulted insignificantly increased abundance. Also contrary to predictions, plant litter did not affect any of these variables. Linyphiidspiders had the strongest responses to fertilization, with significantly increased abundance and biomass, and, contrary topredictions, increased species richness in fertilized plots. Wolf spiders responded more closely to predictions. Our resultsindicate that the epigeal spider community does not respond as would be predicted by biodiversity-productivity theory.This underscores the need to integrate the largely detritus-based epigeal community into current biodiversity-productivitytheory.
Human activity has resulted in a significant increase in theglobal nitrogen (N) pool through fertilization and increasedatmospheric N deposition (Vitousek et al. 1997; Fenn et al.2003; Galloway et al. 2003). Typical plant communityresponses include decreased plant species richness, increasedstanding crop biomass, and the limitation of community com-position to a few dominant species (Hector et al. 1999; Tilmanet al. 2002; Suding et al. 2005; Patrick et al. 2008a). Thisresearch has provided substantive support for biodiversity-productivity theory, which predicts declines in local andregional richness as one moves from mesotrophic to eutrophicsystems (Grime 1973; McCann 2000; Worm & Duffy 2003;Suding et al. 2005; Chalcraft et al. 2008). Similarly withterrestrial arthropods, increased nutrient loading has beenlinked with decreased species richness and increased abun-dance, particularly among those species most closely linked tothe living-plant portion of the food web (Knops et al. 1999;Haddad et al. 2000, 2001; but see Patrick et al. 2008b). This‘‘eutrophication effect’’ (Fenn et al. 2003) can result insignificant biodiversity loss and potential decline in importantecosystem functions, such as ecosystem stability (McCann2000; Larsen et al. 2005).
Previous studies of nutrient loading have focused on theportions of the food web closely tied to living plant material;e.g., the ‘‘aerial’’ arthropod community associated with theupper portions (e.g., stems) of plants (Knops et al. 1999;Haddad et al. 2000, 2001). Although there is evidence tosupport the eutrophication effect on aerial arthropod diver-sity, less is known regarding how nutrient loading affects theepigeal (ground-level) arthropod community. A differentialresponse by the epigeal arthropod community may result fromit being more closely tied to the detritus-based portion of the
food web (Halaj & Wise 2002). Despite the important role itmay play, the epigeal arthropod community remains an under-studied food web component (Wardle 2002; Hattenschwileret al. 2005; Cross et al. 2006).
Nutrient loading also increases plant litter production(Long et al. 2003; Patrick et al. 2008a), which can increasethe basal food resource for the detrital community andincrease detritivore and epigeal predator abundances (Halajet al. 2000; Halaj & Wise 2002; Moore et al. 2004).Furthermore, plant litter increases habitat complexity, whichcan also increase arthropod abundance and diversity (Lawton1983; Strong et al. 1984; Rypstra et al. 1999). Although moreplant litter production could increase detritivore and epigealpredator abundance and biomass (Halaj et al. 2000), areduction in litter diversity could result in decreased diversityof detritivores and epigeal predators (Hattenschwiler & Gasser2005; Wardle 2006), mirroring the aerial community responseto nutrient loading.
Spiders, in particular, are abundant generalist predators(Wise 1993) that can significantly impact terrestrial food webs(Wise et al. 1999), and epigeal spiders (e.g., Lycosidae andLinyphiidae) are closely linked to the detritivore community(Wise et al. 1999; Chen & Wise 1999; Wise 2006). Theabundance of epigeal spiders is limited ultimately by theabundance of their mainly detritivorous prey via bottom-upforces through the detritus-based portion of the food web(Chen & Wise 1999; Wise et al. 1999; Wise 2004, 2006). Thus,increasing plant detritus can increase spider abundance byincreasing the quantity of food available to their detritivorousprey (Chen & Wise 1999; Wise et al. 1999; Wise 2004).Increased detritus also enhances habitat structure for hidingand web building (Uetz 1979, 1991; Rypstra et al. 1999), which
2012. The Journal of Arachnology 40:309–324
309
can also moderately increase the local richness of the spidercommunity (Rypstra et al. 1999), also differentially affectingindividual spider species.
Even though spider abundance may increase, spiderdiversity may not increase proportionally because the reduceddiversity of plant detritus can limit predator diversity in thedetrital food web (Hattenschwiler & Gasser 2005; Wardle2006). Thus, it is reasonable to expect that predatorsdependent upon the detritivore food web may have the sameresponse to fertilization as predators more closely associatedwith the aerial food web. Even though more plant litter isproduced, increasing the resource base of the detritivore foodweb, lower litter diversity likely begets lower detritivore anddetritivore-predator diversity (Hattenschwiler & Gasser 2005;Wardle 2006). Interestingly, no epigeal spider studies (focusedstrictly on cursorial spiders; e.g., wolf spiders) have looked atthe spider diversity response to basal resource manipulation.Moreover, no studies have examined responses of thepredominantly epigeal spider family Linyphiidae (wanderingsheet/tangle-web builders) that may patrol multiple webs atground level (Uetz et al. 1999).
Here we report the results of a four-year study thatinvestigated the response of the epigeal spider community toexperimental manipulations of NPK fertilization and plantlitter availability in a temperate-latitude grassland. Wemeasured the diversity, abundance, biomass, and communitystructure responses of the entire epigeal spider community, thespider families Lycosidae and Linyphiidae, and the dominantindividual spider species. Our goal was to integrate the detritalfood web into biodiversity-productivity theory through insightgained from the responses of predators that rely largely on thedetritivore food web. Based on previous studies that sampledthe aerial arthropod community responses to nutrient loading(e.g., Knops et al. 1999; Haddad et al. 2000, 2001), we testedtwo hypotheses: (1) fertilization will cause spider biomass andabundance to increase and spider species richness to decrease,and (2) the presence of plant litter will moderately increasespider species richness, though this effect will be dampened infertilized plots.
METHODS
Study site and experimental design.—The study was done atthe 163.5 ha Bath Nature Preserve (BNP: 41u10936.20N,81u38958.70W), Bath Township, Summit County, Ohio, USA,in a 16 ha section of grassland. Until the early 1980s, the studysite was a hay meadow, harvested one or many times per year.Since then, the area has been mown annually in late August toearly September, and the mown vegetation has been left on thefield. The dominant vegetation is an herbaceous, graminoidcommunity largely dominated by cool-season C3 grasses,e.g., Bromus inermis Leyss., Lolium arundinaceum (Schreb.)Darbysh, Phleum pratense L., and Anthoxanthum odoratum L.The site is moderately productive relative to other grasslandswithin the upper Midwest and across the USA (Patrick et al.2008a). The dominant soil type is Ellsworth silt loam (ElB),which consists of moderately well drained, moderately deep todeep soils formed in silty clay loam or clay loam glacial till ofthe Wisconsin Age (Ritchie & Steiger 1974).
During August 2001, twenty-four 20-m diameter circularplots (314 m2) were established. These experimental plots were
separated by at least 20 m and were at least 30 m away fromany other habitat. Treatments were applied in a 2 3 2 factorialdesign of fertilizer (+F 5 fertilizer added, 2F 5 no fertilizer)and plant litter (2L 5 litter removed, +L 5 litter left in situafter yearly mowing) with control plots characterized as nofertilization and plant litter left in situ (+L/2F), resulting in sixreplicates per treatment. Hereafter, all references to ‘‘litter’’refer to the previous year’s mown vegetation and anyvegetation senesced and found within the sampling quadratafter standing crop removal. In April 2002 and continuingeach April through 2005, Scotts brand Osmocote 8–9 monthSlow Release Fertilizer 19-6-12 (NPK; Scotts, Marysville,Ohio USA) was applied at 20 gNm22 in fertilized plots, wellabove the Kochy & Wilson (2005) 15 g Nm22 yr21 thresholdnecessary to induce a eutrophication effect in grasslandsand other habitats. We could not exclude ambient wet/dryatmospheric N deposition, though deposition rates from 1990to 2005 were relatively low at ,1.01 g N m22 yr21 at a nearbymonitoring site in Lykens (162 km west of our study site),Ohio, USA, and ,0.93 g N m22 yr21 at another nearbymonitoring site in Mercer Co. (G.K. Goddard site, 96 km eastof our study site), Pennsylvania, USA (US EPA 2005). Withintwo days of annual mowing of the whole site by the localtownship with a large tractor and brush hog mower (autumn2001–2004), litter was removed from litter-removal treatmentsusing a small 23 hp lawn tractor with a pull-behind 8 hp Agri-Fab Mow-N-Vac trailer attachment (Agri-Fab, Sullivan,Illinois, USA).
Spider community sampling.—Spiders were collected usingfour pitfall traps in each of the 24 experimental plots (n 5 96total pitfall traps). Within each plot, a single trap was placed5 m from the center of the plot at each of four magneticcompass directions (northeast, northwest, southeast, andsouthwest). Each trap consisted of a 10 cm diameter, 18 cmtall PVC sleeve into which a 710-mL plastic cup was insertedand filled to ,4 cm with a 50/50 water/propylene glycolmixture. To deter trap raiders (e.g., microtine mammals),prevent captured spiders from climbing out of the trap, andprevent precipitation from directly flooding the trap, an 8-cmpowder funnel with a base enlarged to , 3 cm was insertedand a 15 cm 3 15 cm board was placed over each trap, leaving, 3 cm clearance. Starting mid to late May (mid-July during2004) and continuing through mid to late August, traps werealternately left open for two weeks and closed for two weeks.This resulted in three sampling periods each year during 2002,2003, and 2005. During 2004, only the second and thirdsampling periods were collected. When each two-weeksampling period ended, the plastic cups were removed, thecontents collected and preserved in 70% ethyl alcohol, and thePVC sleeve was tightly capped. Although pitfall traps do notcapture all spiders in the community, they are an effectivesampling technique for determining the relative abundanceand species richness of epigeal spiders (Greenslade 1964;Phillips & Cobb 2005). Spiders captured in each trap wereidentified to species for all mature specimens (taxonomicnames follow Platnick 2012), and to family for all immaturespecimens, and exact numbers of species/families within ineach trap were recorded and dried at 70uC for 72 h todetermine species-specific biomasses to the nearest 0.0001 g.Lacking sufficient numbers captured within a trap, some
310 THE JOURNAL OF ARACHNOLOGY
extremely small species did not register a biomass, and theirbiomass was recorded as ‘‘0.000001 g’’ to differentiate themfrom true zeroes in analyses.
Statistical analyses.—We tested the effects of fertilization,plant litter, and the interaction of fertilization and litter on theabundance, biomass, species richness (SR), and effectiveShannon’s diversity (eH9, where H9 is the Shannon diversityindex) of (1) all mature spiders (Araneae), (2) lycosid andlinyphiid spiders and (3) abundance and biomass of the sixmost abundant spider species. We used eH9 to correct fordifferences in species richness that might have resulted fromdifferential spider abundances (Ricklefs & Miller 2000;Haddad et al. 2000). To calculate the average SR within aplot, we summed the total number of spider species caught ineach trap, then averaged this SR for each of the four trapswithin a plot within a sampling period (including zeroes fortraps where no spiders were captured), then averaged theseSRs for each plot across sampling periods in a year, yieldingn 5 24 samples within each year. The same method was usedto calculate the average abundance, biomass and eH9 within aplot within a year, also yielding n 5 24 samples within eachyear. Correlations and regressions of these spider responseswith plant species richness (plant SR) and standing cropbiomass utilized data from Patrick et al. (2008a).
To analyze trends per year and per treatment in abundance,biomass, SR, and eH9 we used SAS software version 8.01 (SASInstitute, Inc. 1999) to calculate a Generalized Linear Mixed-effect Model (GLMM) in PROC MIXED with Type IIIeffects based upon the covariance structure of compoundsymmetry, and Gaussian distribution of errors. The variousmodels used the different response variables (biomass, SR, eH9,abundance), and for the predictor variables used fertilized vs.unfertilized, litter removed vs. litter left in situ, year, and theirfactorial interactions, with year as the repeated predictor.When year was detected as a significant effect for a responsevariable, we tested for treatment effects within a year andagain used SAS to calculate a GLMM in PROC MIXED withType III effects based upon the covariance structure ofcompound symmetry, Gaussian distribution of error, withfertilization, litter, and the factorial interaction of fertilizationand litter as predictor variables.
To assess treatment effects on aggregate biotic and abioticcomponents in our system, we applied nonmetric multidimen-sional scaling (NMS: Kruskal 1964) using PC-ORD (McCune& Mefford 2006). For 2005, variables used for each of the 24plots were average spider species richness per plot and fourvariables used in a previously published analysis (Patrick et al.2008a): average plant litter biomass, average PAR per plot,average percent soil moisture per plot, and average percentsoil organic content per plot, resulting in a matrix with fivecolumns and 24 rows (plots). The same analysis was run asecond time with the same variable, except Linyphiidae speciesrichness replaced spider species richness. Because (1) NMS isscale sensitive, (2) these variables are on radically differentmeasurement scales, and (3) variables have an enormous rangeof values between variables, data were transformed toproportions relative to the highest value for each variable(i.e., each value in a column was divided by the largest value inthat column, creating a unitless range from 0–1 for eachcolumn). The NMS analysis was run with Sørensen distance,
time as the random seed for the starting configuration, 9999runs stepping down from 5 to 1 dimensions with the real data,999 Monte Carlo runs to assess the probability of a similarfinal stress obtained by chance, and a 0.005 stability criterion.Additionally for 2005 and to support NMS analyses withstable results, we used PC-ORD (McCune & Mefford 2006)to run the multi-response permutation procedure (MRPP:Mielke 1984) to test for the hypothesis of no difference amongtreatments. The MRPP used Sørensen distance with the fourtreatments as the a priori groupings, resulting in a matrix withfive columns (biotic and abiotic variables) and 24 rows (plots)and was calculated with all four treatments together, and forpairwise comparisons between treatments to test for thestrength of difference between individual treatments.
RESULTS
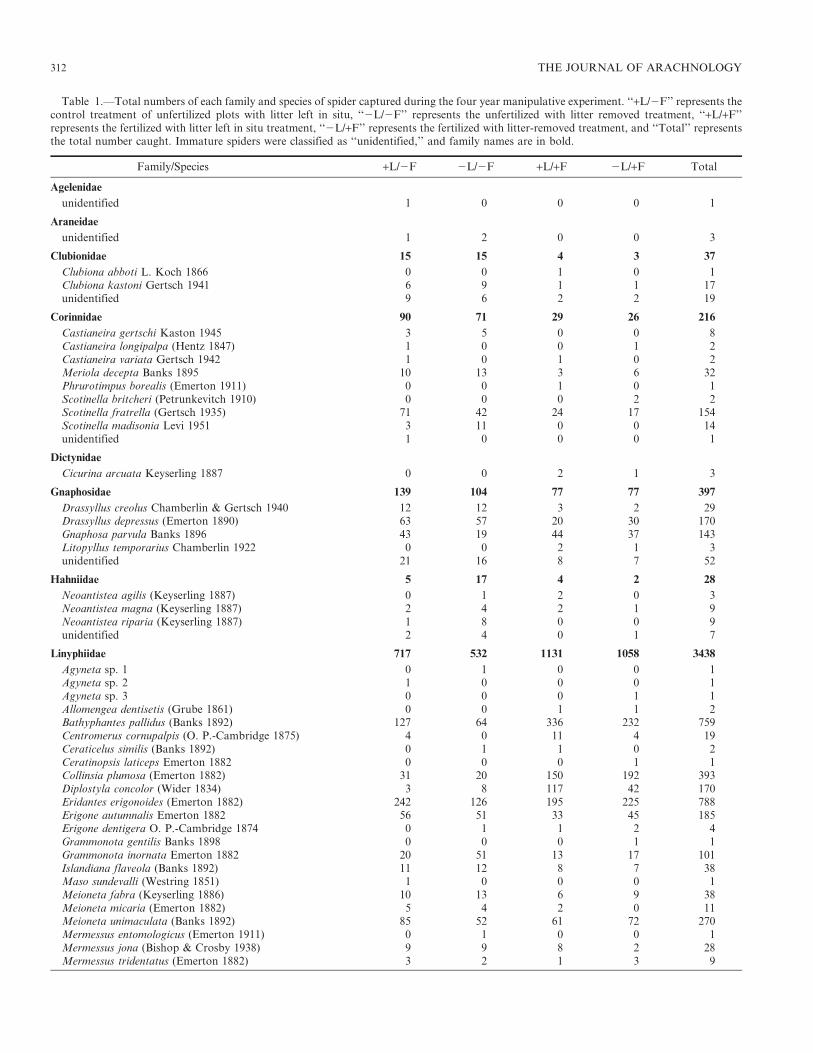
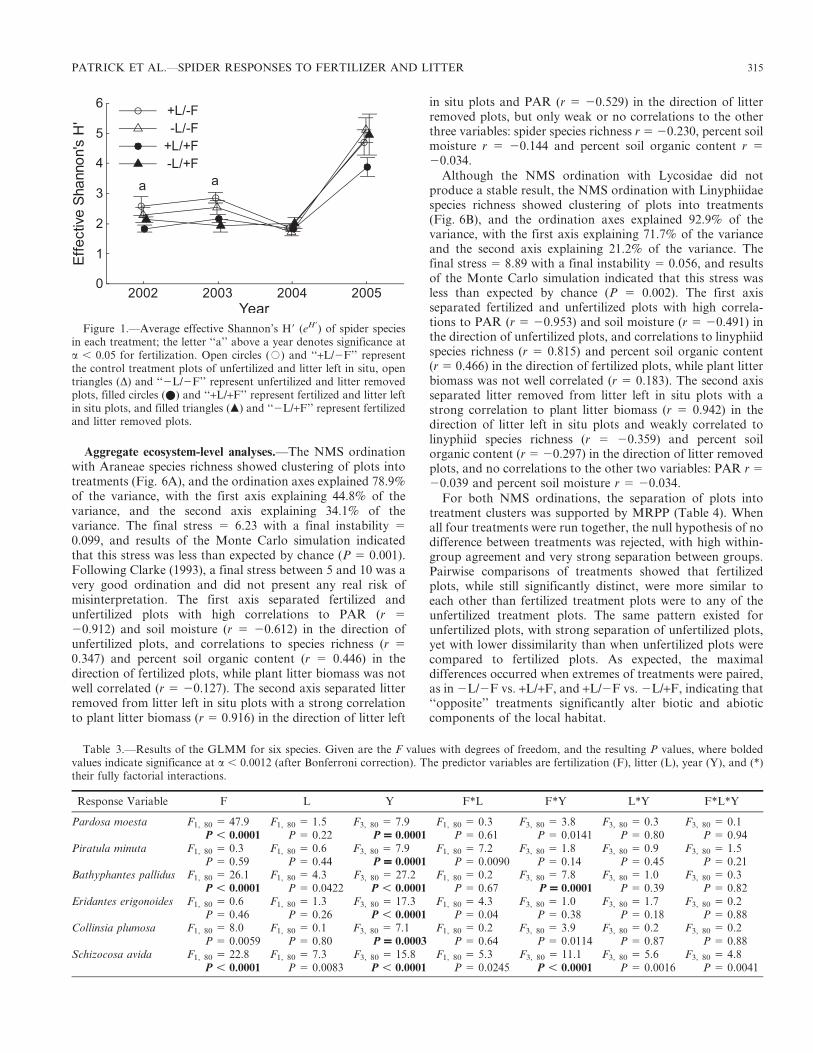
General trends.—A total of 13,174 spiders from 14 familieswas captured during 14,784 trap nights. Of this total, 2515spiders were immature and from 11 families, while theremaining 10,659 spiders were mature and from 94 speciesand 12 families (Table 1). Lycosidae was the most commonlycaptured spider family, with 6577 mature specimens (61.7% ofall mature spiders captured) from 20 species, while Linyphii-dae was the second most commonly captured spider familywith 3200 mature specimens (30.0% of all mature spiderscaptured) from 34 species. Together these two familiesrepresented 9777 (91.7% of all mature spiders captured)specimens from 54 species (57.4% of all species captured).Spider diversity, corrected for abundance with eH9, wassignificantly affected by fertilization and by year, but not bylitter (Table 2). The factorial interactions between fertilizationand year, fertilization and litter, litter and year, and the fullyfactorial interaction of fertilization by litter by year were notsignificant (Table 2). Because of the significance of year(Fig. 1), we tested for treatment effects on spider diversitywithin each year and by 2005 (Table 3) neither fertilization,nor litter nor their interaction was significant.
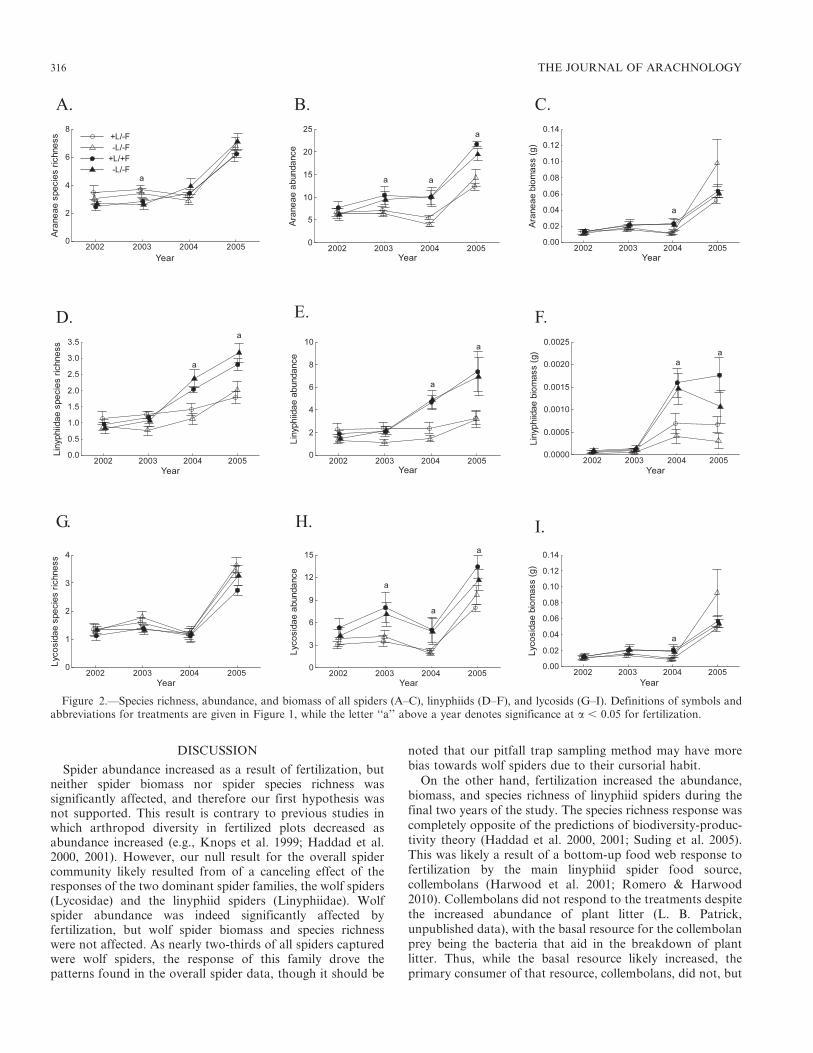
Fertilization significantly affected Araneae (all spiders)abundance but not Araneae SR or Araneae biomass (Table 2,Fig. 2A– C). Moreover, fertilization effects were significant forLinyphiidae SR, abundance and biomass (Table 2, Fig. 2D–F),as well as for Lycosidae SR and abundance (Table 2, Fig. 2G–H), but not for Lycosidae biomass (Table 2, Fig. 2I). All responsevariables were significantly affected by year (Table 2), andAraneae SR and abundance, and Linyphiidae SR, abundanceand biomass had significant fertilization and year interactions.
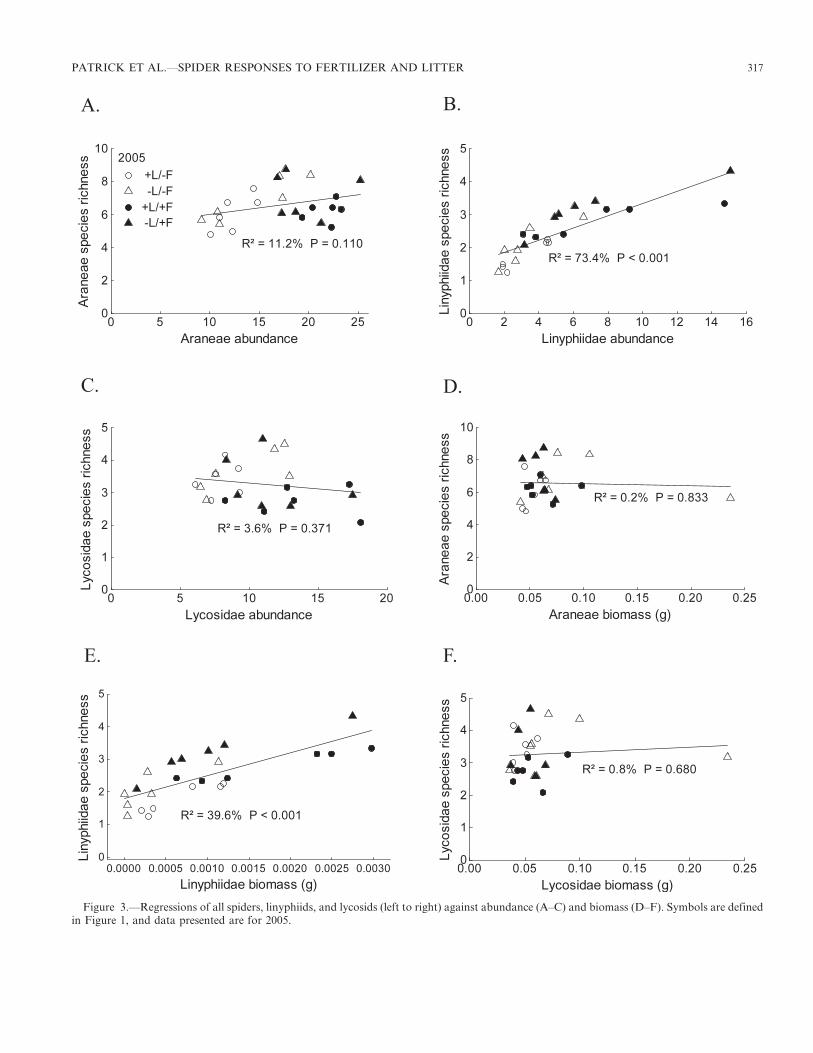
Neither Araneae SR nor Lycosidae SR were significantlycorrelated with abundance (r 5 0.335 and r 5 20.190,respectively), but Linyphiidae SR was well correlated withabundance (r 5 0.857; Fig. 3A–C). As with abundance,biomass was only correlated in the Linyphiidae SR (r 5
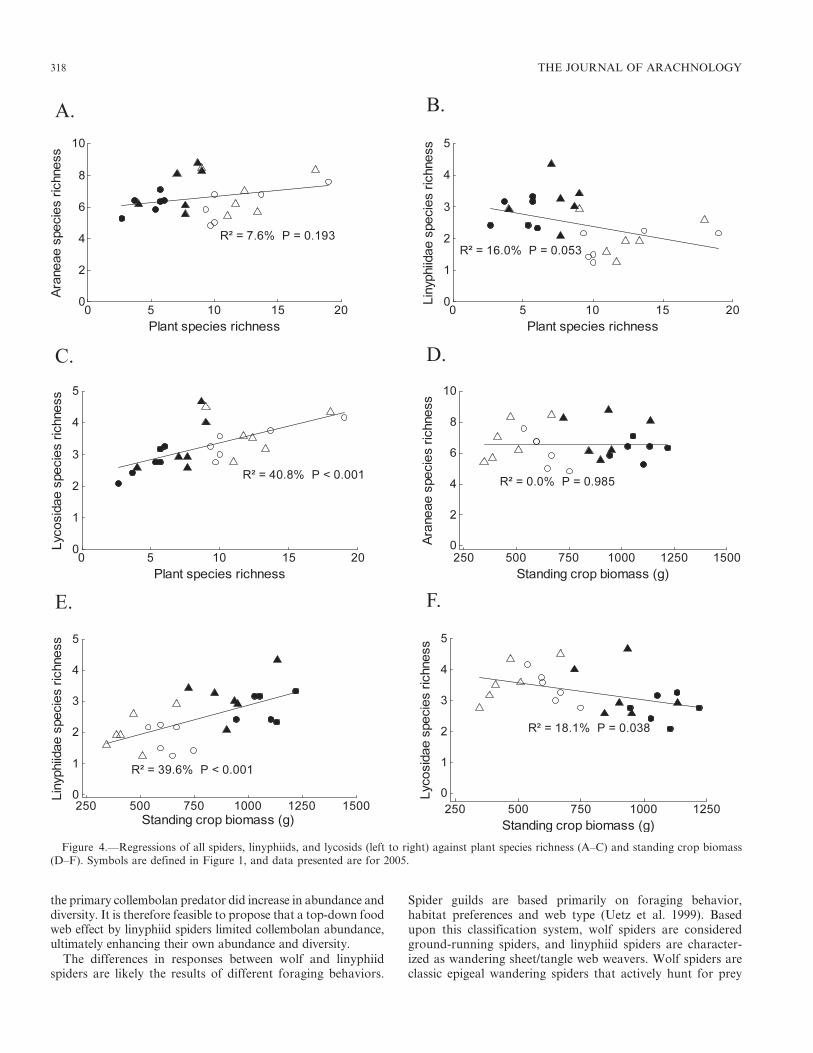
0.629; Fig. 3D–F). Although Araneae SR was not significantlycorrelated with plant SR (r 5 0.276; Fig 4A), Linyphiidae SRwas negatively correlated with plant SR (r 5 20.400), andLycosidae SR was positively correlated with plant SR (r 5
0.639; Fig. 4B–C). Araneae SR was also not correlated withstanding crop biomass (r 5 0; Fig. 4D), while Linyphiidae SRwas positively correlated and Lycosidae SR was negativelycorrelated with standing crop biomass (r 5 0.629 and r 5
20.425, respectively; Fig. 4E–F).
PATRICK ET AL.—SPIDER RESPONSES TO FERTILIZER AND LITTER 311
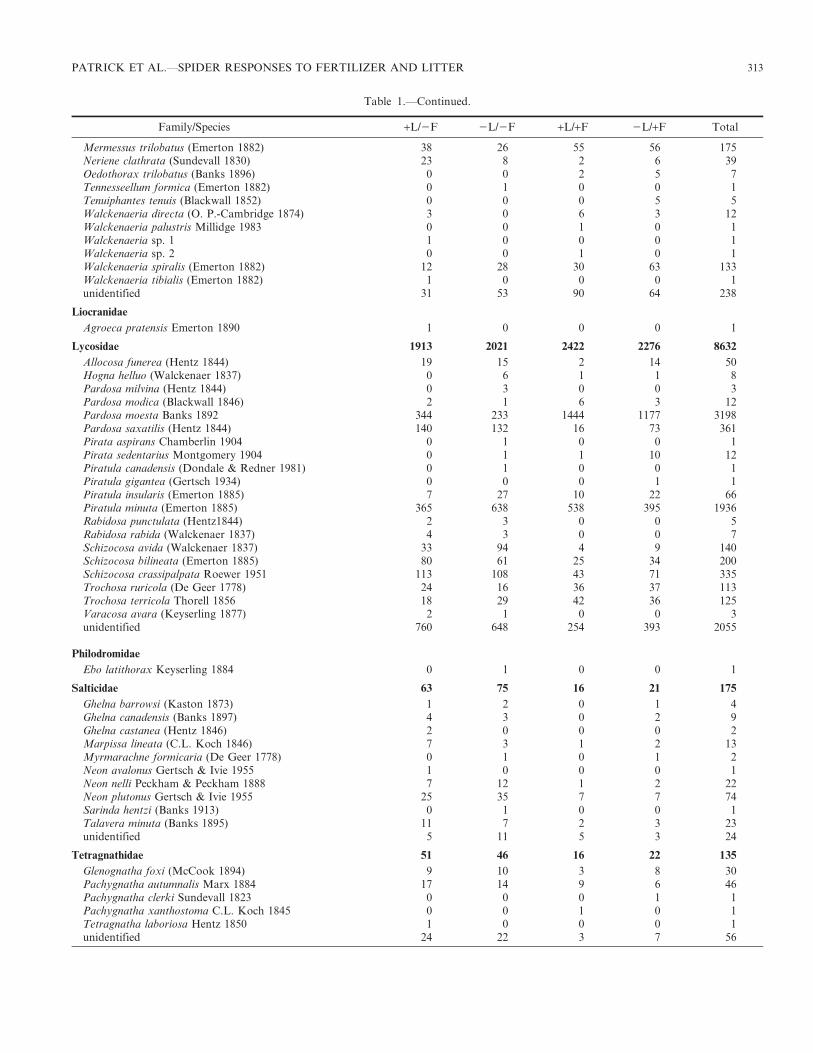
Table 1.—Total numbers of each family and species of spider captured during the four year manipulative experiment. ‘‘+L/2F’’ represents thecontrol treatment of unfertilized plots with litter left in situ, ‘‘2L/2F’’ represents the unfertilized with litter removed treatment, ‘‘+L/+F’’represents the fertilized with litter left in situ treatment, ‘‘2L/+F’’ represents the fertilized with litter-removed treatment, and ‘‘Total’’ representsthe total number caught. Immature spiders were classified as ‘‘unidentified,’’ and family names are in bold.
PATRICK ET AL.—SPIDER RESPONSES TO FERTILIZER AND LITTER 313
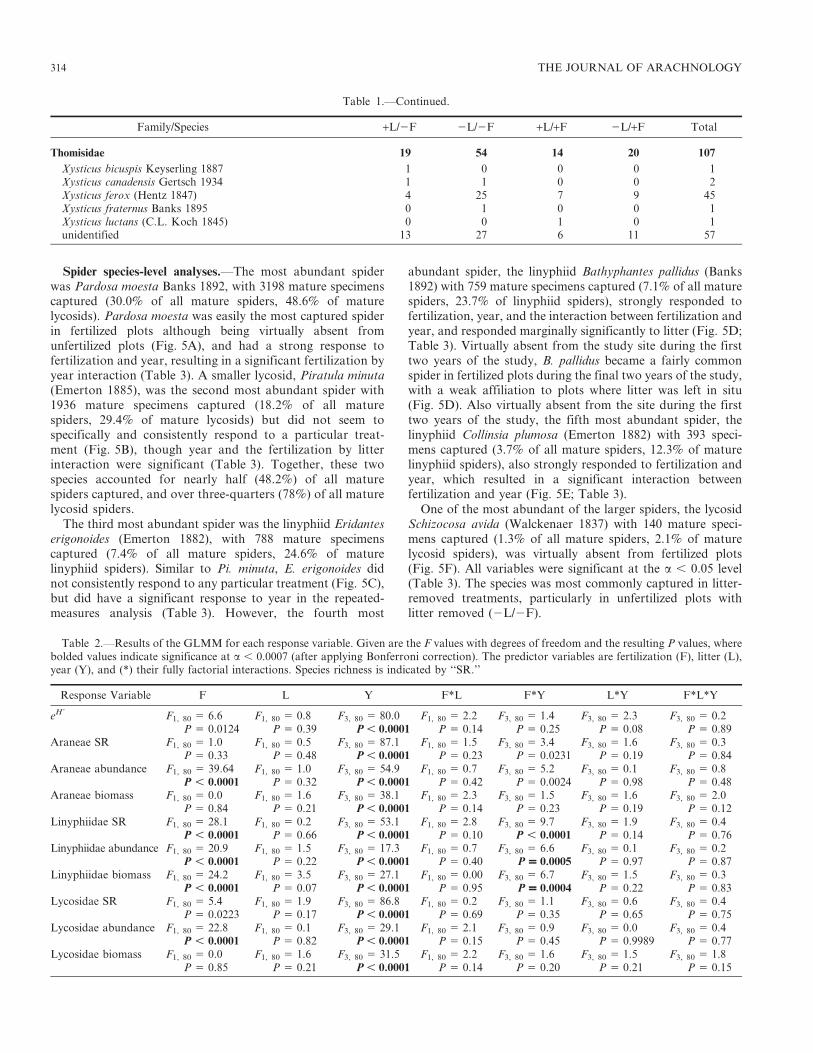
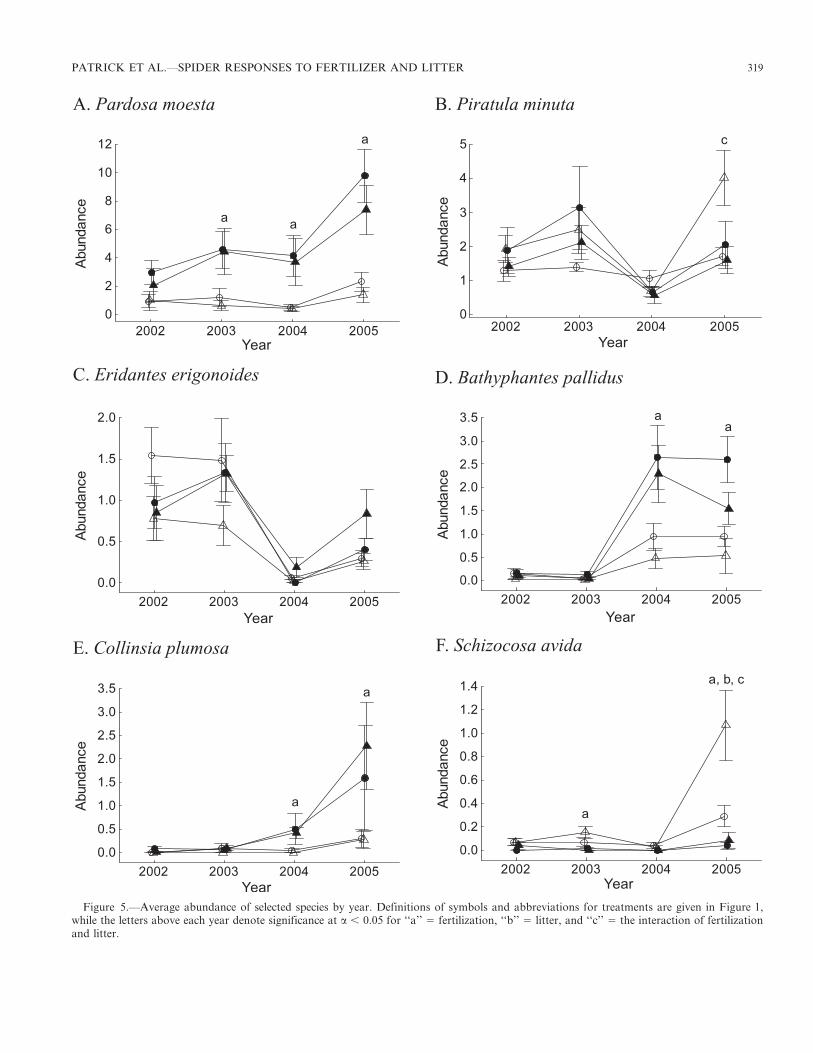
Spider species-level analyses.—The most abundant spiderwas Pardosa moesta Banks 1892, with 3198 mature specimenscaptured (30.0% of all mature spiders, 48.6% of maturelycosids). Pardosa moesta was easily the most captured spiderin fertilized plots although being virtually absent fromunfertilized plots (Fig. 5A), and had a strong response tofertilization and year, resulting in a significant fertilization byyear interaction (Table 3). A smaller lycosid, Piratula minuta(Emerton 1885), was the second most abundant spider with1936 mature specimens captured (18.2% of all maturespiders, 29.4% of mature lycosids) but did not seem tospecifically and consistently respond to a particular treat-ment (Fig. 5B), though year and the fertilization by litterinteraction were significant (Table 3). Together, these twospecies accounted for nearly half (48.2%) of all maturespiders captured, and over three-quarters (78%) of all maturelycosid spiders.
The third most abundant spider was the linyphiid Eridanteserigonoides (Emerton 1882), with 788 mature specimenscaptured (7.4% of all mature spiders, 24.6% of maturelinyphiid spiders). Similar to Pi. minuta, E. erigonoides didnot consistently respond to any particular treatment (Fig. 5C),but did have a significant response to year in the repeated-measures analysis (Table 3). However, the fourth most
abundant spider, the linyphiid Bathyphantes pallidus (Banks1892) with 759 mature specimens captured (7.1% of all maturespiders, 23.7% of linyphiid spiders), strongly responded tofertilization, year, and the interaction between fertilization andyear, and responded marginally significantly to litter (Fig. 5D;Table 3). Virtually absent from the study site during the firsttwo years of the study, B. pallidus became a fairly commonspider in fertilized plots during the final two years of the study,with a weak affiliation to plots where litter was left in situ(Fig. 5D). Also virtually absent from the site during the firsttwo years of the study, the fifth most abundant spider, thelinyphiid Collinsia plumosa (Emerton 1882) with 393 speci-mens captured (3.7% of all mature spiders, 12.3% of maturelinyphiid spiders), also strongly responded to fertilization andyear, which resulted in a significant interaction betweenfertilization and year (Fig. 5E; Table 3).
One of the most abundant of the larger spiders, the lycosidSchizocosa avida (Walckenaer 1837) with 140 mature speci-mens captured (1.3% of all mature spiders, 2.1% of maturelycosid spiders), was virtually absent from fertilized plots(Fig. 5F). All variables were significant at the a , 0.05 level(Table 3). The species was most commonly captured in litter-removed treatments, particularly in unfertilized plots withlitter removed (2L/2F).
Table 2.—Results of the GLMM for each response variable. Given are the F values with degrees of freedom and the resulting P values, wherebolded values indicate significance at a , 0.0007 (after applying Bonferroni correction). The predictor variables are fertilization (F), litter (L),year (Y), and (*) their fully factorial interactions. Species richness is indicated by ‘‘SR.’’
Response Variable F L Y F*L F*Y L*Y F*L*Y
eH’ F1, 80 5 6.6 F1, 80 5 0.8 F3, 80 5 80.0 F1, 80 5 2.2 F3, 80 5 1.4 F3, 80 5 2.3 F3, 80 5 0.2P 5 0.0124 P 5 0.39 P , 0.0001 P 5 0.14 P 5 0.25 P 5 0.08 P 5 0.89
Araneae SR F1, 80 5 1.0 F1, 80 5 0.5 F3, 80 5 87.1 F1, 80 5 1.5 F3, 80 5 3.4 F3, 80 5 1.6 F3, 80 5 0.3P 5 0.33 P 5 0.48 P , 0.0001 P 5 0.23 P 5 0.0231 P 5 0.19 P 5 0.84
Araneae abundance F1, 80 5 39.64 F1, 80 5 1.0 F3, 80 5 54.9 F1, 80 5 0.7 F3, 80 5 5.2 F3, 80 5 0.1 F3, 80 5 0.8P , 0.0001 P 5 0.32 P , 0.0001 P 5 0.42 P 5 0.0024 P 5 0.98 P 5 0.48
Araneae biomass F1, 80 5 0.0 F1, 80 5 1.6 F3, 80 5 38.1 F1, 80 5 2.3 F3, 80 5 1.5 F3, 80 5 1.6 F3, 80 5 2.0P 5 0.84 P 5 0.21 P , 0.0001 P 5 0.14 P 5 0.23 P 5 0.19 P 5 0.12
Linyphiidae SR F1, 80 5 28.1 F1, 80 5 0.2 F3, 80 5 53.1 F1, 80 5 2.8 F3, 80 5 9.7 F3, 80 5 1.9 F3, 80 5 0.4P , 0.0001 P 5 0.66 P , 0.0001 P 5 0.10 P , 0.0001 P 5 0.14 P 5 0.76
Linyphiidae abundance F1, 80 5 20.9 F1, 80 5 1.5 F3, 80 5 17.3 F1, 80 5 0.7 F3, 80 5 6.6 F3, 80 5 0.1 F3, 80 5 0.2P , 0.0001 P 5 0.22 P , 0.0001 P 5 0.40 P = 0.0005 P 5 0.97 P 5 0.87
Linyphiidae biomass F1, 80 5 24.2 F1, 80 5 3.5 F3, 80 5 27.1 F1, 80 5 0.00 F3, 80 5 6.7 F3, 80 5 1.5 F3, 80 5 0.3P , 0.0001 P 5 0.07 P , 0.0001 P 5 0.95 P = 0.0004 P 5 0.22 P 5 0.83
Lycosidae SR F1, 80 5 5.4 F1, 80 5 1.9 F3, 80 5 86.8 F1, 80 5 0.2 F3, 80 5 1.1 F3, 80 5 0.6 F3, 80 5 0.4P 5 0.0223 P 5 0.17 P , 0.0001 P 5 0.69 P 5 0.35 P 5 0.65 P 5 0.75
Lycosidae abundance F1, 80 5 22.8 F1, 80 5 0.1 F3, 80 5 29.1 F1, 80 5 2.1 F3, 80 5 0.9 F3, 80 5 0.0 F3, 80 5 0.4P , 0.0001 P 5 0.82 P , 0.0001 P 5 0.15 P 5 0.45 P 5 0.9989 P 5 0.77
Lycosidae biomass F1, 80 5 0.0 F1, 80 5 1.6 F3, 80 5 31.5 F1, 80 5 2.2 F3, 80 5 1.6 F3, 80 5 1.5 F3, 80 5 1.8P 5 0.85 P 5 0.21 P , 0.0001 P 5 0.14 P 5 0.20 P 5 0.21 P 5 0.15
314 THE JOURNAL OF ARACHNOLOGY
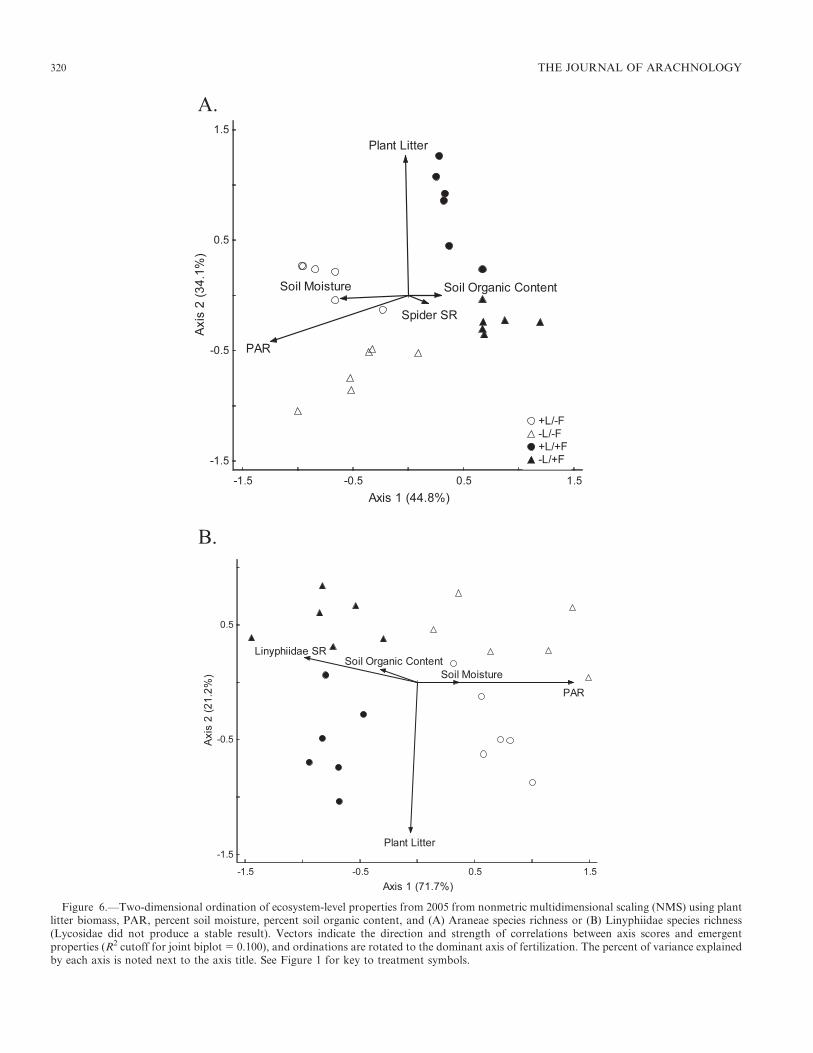
Aggregate ecosystem-level analyses.—The NMS ordinationwith Araneae species richness showed clustering of plots intotreatments (Fig. 6A), and the ordination axes explained 78.9%
of the variance, with the first axis explaining 44.8% of thevariance, and the second axis explaining 34.1% of thevariance. The final stress 5 6.23 with a final instability 5
0.099, and results of the Monte Carlo simulation indicatedthat this stress was less than expected by chance (P 5 0.001).Following Clarke (1993), a final stress between 5 and 10 was avery good ordination and did not present any real risk ofmisinterpretation. The first axis separated fertilized andunfertilized plots with high correlations to PAR (r 5
20.912) and soil moisture (r 5 20.612) in the direction ofunfertilized plots, and correlations to species richness (r 5
0.347) and percent soil organic content (r 5 0.446) in thedirection of fertilized plots, while plant litter biomass was notwell correlated (r 5 20.127). The second axis separated litterremoved from litter left in situ plots with a strong correlationto plant litter biomass (r 5 0.916) in the direction of litter left
in situ plots and PAR (r 5 20.529) in the direction of litterremoved plots, but only weak or no correlations to the otherthree variables: spider species richness r 5 20.230, percent soilmoisture r 5 20.144 and percent soil organic content r 5
20.034.
Although the NMS ordination with Lycosidae did notproduce a stable result, the NMS ordination with Linyphiidaespecies richness showed clustering of plots into treatments(Fig. 6B), and the ordination axes explained 92.9% of thevariance, with the first axis explaining 71.7% of the varianceand the second axis explaining 21.2% of the variance. Thefinal stress 5 8.89 with a final instability 5 0.056, and resultsof the Monte Carlo simulation indicated that this stress wasless than expected by chance (P 5 0.002). The first axisseparated fertilized and unfertilized plots with high correla-tions to PAR (r 5 20.953) and soil moisture (r 5 20.491) inthe direction of unfertilized plots, and correlations to linyphiidspecies richness (r 5 0.815) and percent soil organic content(r 5 0.466) in the direction of fertilized plots, while plant litterbiomass was not well correlated (r 5 0.183). The second axisseparated litter removed from litter left in situ plots with astrong correlation to plant litter biomass (r 5 0.942) in thedirection of litter left in situ plots and weakly correlated tolinyphiid species richness (r 5 20.359) and percent soilorganic content (r 5 20.297) in the direction of litter removedplots, and no correlations to the other two variables: PAR r 5
20.039 and percent soil moisture r 5 20.034.
For both NMS ordinations, the separation of plots intotreatment clusters was supported by MRPP (Table 4). Whenall four treatments were run together, the null hypothesis of nodifference between treatments was rejected, with high within-group agreement and very strong separation between groups.Pairwise comparisons of treatments showed that fertilizedplots, while still significantly distinct, were more similar toeach other than fertilized treatment plots were to any of theunfertilized treatment plots. The same pattern existed forunfertilized plots, with strong separation of unfertilized plots,yet with lower dissimilarity than when unfertilized plots werecompared to fertilized plots. As expected, the maximaldifferences occurred when extremes of treatments were paired,as in 2L/2F vs. +L/+F, and +L/2F vs. 2L/+F, indicating that‘‘opposite’’ treatments significantly alter biotic and abioticcomponents of the local habitat.
Figure 1.—Average effective Shannon’s H9 (eH9) of spider speciesin each treatment; the letter ‘‘a’’ above a year denotes significance ata , 0.05 for fertilization. Open circles (#) and ‘‘+L/2F’’ representthe control treatment plots of unfertilized and litter left in situ, opentriangles (D) and ‘‘2L/2F’’ represent unfertilized and litter removedplots, filled circles (N) and ‘‘+L/+F’’ represent fertilized and litter leftin situ plots, and filled triangles (m) and ‘‘2L/+F’’ represent fertilizedand litter removed plots.
Table 3.—Results of the GLMM for six species. Given are the F values with degrees of freedom, and the resulting P values, where boldedvalues indicate significance at a , 0.0012 (after Bonferroni correction). The predictor variables are fertilization (F), litter (L), year (Y), and (*)their fully factorial interactions.
Response Variable F L Y F*L F*Y L*Y F*L*Y
Pardosa moesta F1, 80 5 47.9 F1, 80 5 1.5 F3, 80 5 7.9 F1, 80 5 0.3 F3, 80 5 3.8 F3, 80 5 0.3 F3, 80 5 0.1P , 0.0001 P 5 0.22 P = 0.0001 P 5 0.61 P 5 0.0141 P 5 0.80 P 5 0.94
Piratula minuta F1, 80 5 0.3 F1, 80 5 0.6 F3, 80 5 7.9 F1, 80 5 7.2 F3, 80 5 1.8 F3, 80 5 0.9 F3, 80 5 1.5P 5 0.59 P 5 0.44 P = 0.0001 P 5 0.0090 P 5 0.14 P 5 0.45 P 5 0.21
Bathyphantes pallidus F1, 80 5 26.1 F1, 80 5 4.3 F3, 80 5 27.2 F1, 80 5 0.2 F3, 80 5 7.8 F3, 80 5 1.0 F3, 80 5 0.3P , 0.0001 P 5 0.0422 P , 0.0001 P 5 0.67 P = 0.0001 P 5 0.39 P 5 0.82
Eridantes erigonoides F1, 80 5 0.6 F1, 80 5 1.3 F3, 80 5 17.3 F1, 80 5 4.3 F3, 80 5 1.0 F3, 80 5 1.7 F3, 80 5 0.2P 5 0.46 P 5 0.26 P , 0.0001 P 5 0.04 P 5 0.38 P 5 0.18 P 5 0.88
Collinsia plumosa F1, 80 5 8.0 F1, 80 5 0.1 F3, 80 5 7.1 F1, 80 5 0.2 F3, 80 5 3.9 F3, 80 5 0.2 F3, 80 5 0.2P 5 0.0059 P 5 0.80 P = 0.0003 P 5 0.64 P 5 0.0114 P 5 0.87 P 5 0.88
Schizocosa avida F1, 80 5 22.8 F1, 80 5 7.3 F3, 80 5 15.8 F1, 80 5 5.3 F3, 80 5 11.1 F3, 80 5 5.6 F3, 80 5 4.8P , 0.0001 P 5 0.0083 P , 0.0001 P 5 0.0245 P , 0.0001 P 5 0.0016 P 5 0.0041
PATRICK ET AL.—SPIDER RESPONSES TO FERTILIZER AND LITTER 315
DISCUSSION
Spider abundance increased as a result of fertilization, butneither spider biomass nor spider species richness wassignificantly affected, and therefore our first hypothesis wasnot supported. This result is contrary to previous studies inwhich arthropod diversity in fertilized plots decreased asabundance increased (e.g., Knops et al. 1999; Haddad et al.2000, 2001). However, our null result for the overall spidercommunity likely resulted from of a canceling effect of theresponses of the two dominant spider families, the wolf spiders(Lycosidae) and the linyphiid spiders (Linyphiidae). Wolfspider abundance was indeed significantly affected byfertilization, but wolf spider biomass and species richnesswere not affected. As nearly two-thirds of all spiders capturedwere wolf spiders, the response of this family drove thepatterns found in the overall spider data, though it should be
noted that our pitfall trap sampling method may have morebias towards wolf spiders due to their cursorial habit.
On the other hand, fertilization increased the abundance,biomass, and species richness of linyphiid spiders during thefinal two years of the study. The species richness response wascompletely opposite of the predictions of biodiversity-produc-tivity theory (Haddad et al. 2000, 2001; Suding et al. 2005).This was likely a result of a bottom-up food web response tofertilization by the main linyphiid spider food source,collembolans (Harwood et al. 2001; Romero & Harwood2010). Collembolans did not respond to the treatments despitethe increased abundance of plant litter (L. B. Patrick,unpublished data), with the basal resource for the collembolanprey being the bacteria that aid in the breakdown of plantlitter. Thus, while the basal resource likely increased, theprimary consumer of that resource, collembolans, did not, but
Figure 2.—Species richness, abundance, and biomass of all spiders (A–C), linyphiids (D–F), and lycosids (G–I). Definitions of symbols andabbreviations for treatments are given in Figure 1, while the letter ‘‘a’’ above a year denotes significance at a , 0.05 for fertilization.
316 THE JOURNAL OF ARACHNOLOGY
Figure 3.—Regressions of all spiders, linyphiids, and lycosids (left to right) against abundance (A–C) and biomass (D–F). Symbols are definedin Figure 1, and data presented are for 2005.
PATRICK ET AL.—SPIDER RESPONSES TO FERTILIZER AND LITTER 317
the primary collembolan predator did increase in abundance anddiversity. It is therefore feasible to propose that a top-down foodweb effect by linyphiid spiders limited collembolan abundance,ultimately enhancing their own abundance and diversity.
The differences in responses between wolf and linyphiidspiders are likely the results of different foraging behaviors.
Spider guilds are based primarily on foraging behavior,habitat preferences and web type (Uetz et al. 1999). Basedupon this classification system, wolf spiders are consideredground-running spiders, and linyphiid spiders are character-ized as wandering sheet/tangle web weavers. Wolf spiders areclassic epigeal wandering spiders that actively hunt for prey
Figure 4.—Regressions of all spiders, linyphiids, and lycosids (left to right) against plant species richness (A–C) and standing crop biomass(D–F). Symbols are defined in Figure 1, and data presented are for 2005.
318 THE JOURNAL OF ARACHNOLOGY
Figure 5.—Average abundance of selected species by year. Definitions of symbols and abbreviations for treatments are given in Figure 1,while the letters above each year denote significance at a , 0.05 for ‘‘a’’ 5 fertilization, ‘‘b’’ 5 litter, and ‘‘c’’ 5 the interaction of fertilizationand litter.
PATRICK ET AL.—SPIDER RESPONSES TO FERTILIZER AND LITTER 319
Figure 6.—Two-dimensional ordination of ecosystem-level properties from 2005 from nonmetric multidimensional scaling (NMS) using plantlitter biomass, PAR, percent soil moisture, percent soil organic content, and (A) Araneae species richness or (B) Linyphiidae species richness(Lycosidae did not produce a stable result). Vectors indicate the direction and strength of correlations between axis scores and emergentproperties (R2 cutoff for joint biplot 5 0.100), and ordinations are rotated to the dominant axis of fertilization. The percent of variance explainedby each axis is noted next to the axis title. See Figure 1 for key to treatment symbols.
320 THE JOURNAL OF ARACHNOLOGY
and are largely restricted to hunting in two-dimensional space.Thus, habitat structure (i.e., the physical structure of thesurrounding environment, including plant litter and livingplant material) may enhance wolf spider hunting success byproviding additional hiding places for ambush hunting and forlairs (Rypstra et al. 1999; Halaj et al. 2000). However, toomuch habitat structure can also increase predation andintraguild predation risk through increased density responsesto habitat structure while inhibiting movement (Wise 2006;Rypstra et al. 2007). These factors reduce both abundance andhunting success, thereby reducing the numbers of wolf spidersin an area. In our study, the increased habitat structure thatresulted from fertilization seemed to moderately (but notsignificantly) reduce wolf spider species richness whileincreasing wolf spider abundance. However, this increasedabundance was likely due to the population explosion infertilized plots of the medium-sized wolf spider, P. moesta (seebelow).
Linyphiid spiders rely more upon webs for prey capture,sometimes maintaining and patrolling multiple webs (Uetzet al. 1999). Although these webs are generally constructed ator close to the ground level, the webs can enhance prey capturespace to include a portion of a third dimension. Moreover,increased habitat structure can provide additional structurefor web building (Rypstra et al. 1999). Thus, while fertilizedplots significantly reduced wolf spider species richness,probably due to the enhanced habitat structure that impededforaging ability, these plots may have provided the tiny webbuilding linyphiid spiders the habitat structure to flourishbecause of the increased structure for web building and, thus,increased prey capture rates.
A medium-sized wolf spider, P. moesta thrived in fertilizedplots probably due to decreased intraguild predation by larger
wolf spiders (e.g., S. avida) that became less abundant infertilized plots. Moreover, there was increased abundance ofpotential prey in fertilized plots (Patrick et al. 2008b). Thesetwo factors together likely released P. moesta from competi-tion and predation, resulting in an increased abundance infertilized plots. However, these microhabitat changes likelycaused the decreased abundance of S. avida in fertilized plots,as the increased habitat structure likely impeded this species’foraging abilities. Piratula minuta was one of the smallest wolfspiders captured at our site, and could have benefited from theincreased habitat structure in a similar way to P. moesta.Although it was the second most abundant spider capturedduring the course of our study, it did not significantly respondto a single habitat, except for unfertilized plots with litterremoved during 2005. Interestingly, Pi. minuta was observedon several occasions in the jaws of P. moesta and S. avida,making Pi. minuta a victim of intraguild predation.
Spider species richness was not significantly correlated witheither plant species richness or standing crop biomass.However, both dominant spider families responded tofertilization (by the fourth year of the study) in distinctlydifferent ways. Wolf spiders followed predictions of currentbiodiversity-productivity theory, with decreased species rich-ness associated with decreased plant species richness andincreased standing crop biomass. Although fertilizationincreased wolf spider abundance, wolf spider species richnesswas correlated with plant species richness and thereforedecreased as nutrient loading into the system increased.
Finally, despite documented effects of increased habitatstructure on arthropod abundances and diversity (e.g.,Lawton 1983; Halaj et al. 2000), particularly for spiders(e.g., Uetz 1991; Rypstra et al. 1999; Halaj et al. 2000), ourresults do not support our second hypothesis. Plant litter hadno significant effect on spider species richness. Most studies ofspider responses to plant litter have been conducted in plantmonocultures in agroecosystems (e.g., Rypstra et al. 1999).These managed ecosystems tend to have much higherdisturbance and more bare ground than would be expectedfrom a grassland. Thus, increased refugia via plant litteradditions to these agroecosystems would certainly providemore habitat than the existing bare ground, so it is perhapsnot surprising that there have been stronger responses to plantlitter in agroecosystems.
Analysis of the spider community and associated abioticvariables demonstrated strong treatment effects. These highlydifferentiated treatments are likely to have a strong effect onecosystem properties (e.g., nutrient cycling, carbon sequester-ing), an effect likely to increase through time as the treatmentplots further mature. Spiders have been shown to affectdetritivore abundance (Wise et al. 1999), thereby indirectlyaltering nutrient cycling within the system (Chen & Wise1999). The results of our ordinations clearly showed that ourplots responded to our treatments and that the spidercommunity affected ecosystem-level processes. The long-termimplications are unknown, but it is clear that the trajectoriesof each treatment are significantly different and may impactecosystem function and services. To our knowledge, this is thefirst time that these biotic and abiotic factors have beencoupled in a multivariate ordination to explicitly determinewhether they can define discrete and distinct predator
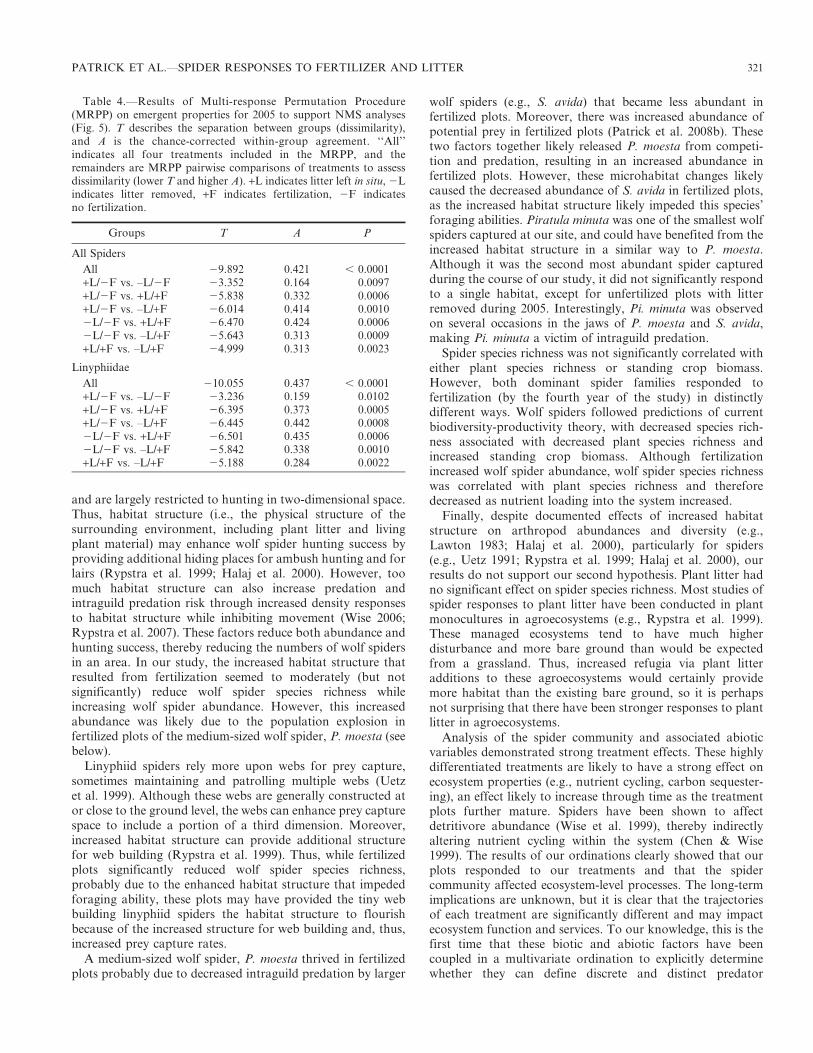
Table 4.—Results of Multi-response Permutation Procedure(MRPP) on emergent properties for 2005 to support NMS analyses(Fig. 5). T describes the separation between groups (dissimilarity),and A is the chance-corrected within-group agreement. ‘‘All’’indicates all four treatments included in the MRPP, and theremainders are MRPP pairwise comparisons of treatments to assessdissimilarity (lower T and higher A). +L indicates litter left in situ, 2Lindicates litter removed, +F indicates fertilization, 2F indicatesno fertilization.
Groups T A P
All Spiders
All 29.892 0.421 , 0.0001+L/2F vs. –L/2F 23.352 0.164 0.0097+L/2F vs. +L/+F 25.838 0.332 0.0006+L/2F vs. –L/+F 26.014 0.414 0.00102L/2F vs. +L/+F 26.470 0.424 0.00062L/2F vs. –L/+F 25.643 0.313 0.0009+L/+F vs. –L/+F 24.999 0.313 0.0023
Linyphiidae
All 210.055 0.437 , 0.0001+L/2F vs. –L/2F 23.236 0.159 0.0102+L/2F vs. +L/+F 26.395 0.373 0.0005+L/2F vs. –L/+F 26.445 0.442 0.00082L/2F vs. +L/+F 26.501 0.435 0.00062L/2F vs. –L/+F 25.842 0.338 0.0010+L/+F vs. –L/+F 25.188 0.284 0.0022
PATRICK ET AL.—SPIDER RESPONSES TO FERTILIZER AND LITTER 321
communities and their associated abiotic properties in thecontext of the biodiversity-productivity theory. Most previouswork (e.g., Haddad et al. 2000, 2001) did not attempt toassociate the invertebrate community with abiotic changesresulting from fertilization, and we know of no other studiesthat coupled fertilization and plant litter effects to testpredictions of biodiversity-productivity theory.
The diversity and community structure of spiders and otherarthropods are sensitive to plot size (Martinko et al. 2006).The large size of our experimental plots integrated importantdeterminants of the within-plot plant communities, includingspatial heterogeneity (De Boeck et al. 2006), leaching ofnutrients from litter (Berendse 1998), local nutrient cycling(Hooper & Vitousek 1998) and the translocation of nutrientswithin clumping and clonal plants (Hutchings & Bradbury1986), which are the primary growth forms of our dominantgraminoids (Patrick et al. 2008a). These spatial factors are alsoimportant to epigeal spiders because of their vagility and theirneed to find suitable food; the larger plot sizes morerealistically emulate natural habitat patches of varying qualityand can support higher insect diversity (Martinko et al. 2006).Other studies that examined the effects of nutrient loading onarthropod communities had plot sizes ranging from 9 m2–169 m2 (e.g., Knops et al. 1999; Haddad et al. 2001), makingour experimental plots (314 m2) nearly twice as large—animportant factor when considering the vagility of some spiderspecies.
However, we realize that our study has some distinctdifferences when compared to previous work. Our use of anNPK fertilizer, as opposed to N-only fertilizer, is likely to haveinduced a stronger response to fertilization due to the added Pand K. Nevertheless, our plant results (see Patrick et al. 2008a)were generally consistent with other plant studies that usedNPK fertilizers (e.g., Carson & Barrett 1988; Turkington et al.2002) and N-only fertilizers (e.g., Haddad et al. 2000; Tilmanet al. 2002), which allowed us to formulate our epigeal spiderhypotheses on the same bases as previous studies thatinvestigated the responses of arthropods to nutrient loading.Further, our running definition of litter (see Methods) includesthe vegetation mown in the previous year and not removedfrom litter left in situ treatment plots, potentially altering thenutritional quality of the litter relative to naturally senescedvegetation, and the physical structure of the litter as it layafter mowing (e.g., Semmartin et al. 2004). Because the timingof mowing was determined by the local township, litterfrom the annual mowing accumulated earlier than mightnormally be expected for this region of the USA. However,were the mowing to stop, the site would very quickly yieldto encroaching woody vegetation typical of early secondarysuccession.
Our study underscores the disjunct between conventional,plant-based biodiversity-productivity theory and the animalcomponent of the food web, particularly epigeal predators.This portion of the food web is more closely associated withthe quality of its basal resource (plant litter) than with thediversity of that resource (Cross et al. 2006; Seeber et al. 2008).This starkly contrasts with the more aerial portion of the foodweb that is more dependent on living plants, where specialistherbivores can be affected by plant diversity more than byplant quality. Ultimately, the loss of plant species with
increased nutrient loading may result in the loss of arthropodherbivores and their specialist predators and parasites.However, the increases in diversity may be balanced by theepigeal community and its different resource base.
ACKNOWLEDGMENTS
We sincerely thank C.D. Dondale for his help withidentifying spiders, particularly linyphiids, and for providingcomments on an earlier version of this paper. We also thank S.Pekar, F. Samu, and an anonymous reviewer for helpfulcomments. LBP would like to especially thank C.D. Dondalefor teaching him the subtleties of spider identification. We alsothank a multitude of graduate and undergraduate studentswho helped in the field, and B. Andreas for help identifyingplants. This study was partially funded by a CanaColl grantand two Kent State University travel grants to LBP, and by aUniversity of Akron Research II Initiative grant to LHF.
LITERATURE CITED
Berendse, F. 1998. Effects of dominant plant species on soil duringsuccession in nutrient-poor ecosystems. Biogeochemistry 42:73–88.
Carson, W.P. & G.W. Barrett. 1988. Succession in old-field plantcommunities: effects of contrasting types of nutrient enrichment.Ecology 69:984–994.
Chalcraft, D.R., S.B. Cox, C. Clark, E.E. Cleland, K.N. Suding, E.Weiher & D. Pennington. 2008. Scale-dependent responses of plantbiodiversity to nitrogen enrichment. Ecology 89:2165–2171.
Chen, B. & D.H. Wise. 1999. Bottom-up limitation of predaceousarthropods in a detritus-based terrestrial food web. Ecology80:761–772.
Clarke, K.R. 1993. Non-parametric multivariate analyses of changesin community structure. Australian Journal of Ecology 18:117–143.
Cross, W.F., J.B. Wallace, A.D. Rosemond & S.L. Eggert. 2006.Whole-system nutrient enrichment increases secondary productionin a detritus-based system. Ecology 87:1556–1565.
De Boeck, H.J., I. Nijs, C.M.H.M. Lemmens & R. Ceulemans. 2006.Underlying effects of spatial aggregation (clumping) in relation-ships between plant diversity and resource uptake. Oikos113:269–278.
Fenn, M.E., J.S. Baron, E.B. Allen, H.M. Rueth, K.R. Nydick, L.Geiser, W.D. Bowman, J.O. Sickman, T. Meixner, D.W. Johnson& P. Neitlich. 2003. Ecological effects of nitrogen deposition in thewestern United States. BioScience 53:404–420.
Greenslade, P.J.M. 1964. Pitfall trapping as a method for studyingpopulations of Carabidae (Coleoptera). Journal of AnimalEcology 33:301–310.
Grime, J.P. 1973. Control of species density in herbaceous vegetation.Journal of Environmental Management 1:151–167.
Haddad, N.M., J. Haarstad & D. Tilman. 2000. The effects of long-term nitrogen loading on grassland insect communities. Oecologia124:73–84.
Haddad, N.M., D. Tilman, J. Harstaad, M. Ritchie & J.M.H. Knops.2001. Contrasting effects of plant richness and compositionon insect communities: a field experiment. American Naturalist158:17–35.
Halaj, J. & D.H. Wise. 2002. Impact of a detrital subsidy on trophiccascades in a terrestrial grazing web. Ecology 83:3141–3151.
322 THE JOURNAL OF ARACHNOLOGY
Harwood, J.D., K.D. Sunderland & W.O.C. Symondson. 2001.Living where the food is: web-location by linyphiid spiders inrelation to prey availability in winter wheat. Journal of AppliedEcology 38:88–99.
Hattenschwiler, S. & P. Gasser. 2005. Soil animals alter plant litterdiversity effects on decomposition. Proceedings of the NationalAcademy of Sciences of the USA 102:1519–1524.
Hattenschwiler, S., A.V. Tiunov & S. Scheu. 2005. Biodiversity andlitter decomposition in terrestrial ecosystems. Annual Review ofEcology, Evolution and Systematics 36:191–218.
Hector, A., B. Schmid, C. Beierkuhnlein, M.C. Caldeira, M. Diemer,P.G. Dimitrkopoulos, J.A. Finn, H. Freitas, P.S. Giller, J. Good,R. Harris, P. Hogberg, K. Huss-Danell, J. Joshi, A. Jumpponen,C. Korner, P.W. Leadley, M. Loreau, A. Minns, C.P.H. Mulder,G. O’Donovan, S.J. Otway, J.S. Pereira, A. Prinz, D.J. Read, M.Scherer-Lorenzen, E-D. Schulze, A-S.D. Siamantziouras, E.M.Spehn, A.C. Terry, A.Y. Troumbis, F.I. Woodward, S. Yachi &J.H. Lawton. 1999. Plant diversity and productivity experiments inEuropean grasslands. Science 286:1123–1127.
Hooper, D.U. & P.M. Vitousek. 1998. Effects of plant competitionand diversity on nutrient cycling. Ecological Monographs68:121–149.
Knops, J.M.H., D. Tilman, N.M. Haddad, S. Naeem, C.E. Mitchell,J. Haarstad, M.E. Ritchie, K.M. Howe, P.B. Reich, E. Siemann &J. Groth. 1999. Effects of plant species richness on invasionsdynamics, disease outbreaks, insect abundances and diversity.Ecology Letters 2:286–293.
Kochy, M. & S.D. Wilson. 2005. Variation in nitrogen deposition andavailable soil nitrogen in a forest-grassland ecotone in Canada.Landscape Ecology 20:191–202.
Kruskal, J.B. 1964. Nonmetric multidimensional scaling: a numericalmethod. Psychometrika 29:115–129.
Larsen, T.H., N. Williams & C. Kremen. 2005. Extinction order andaltered community structure rapidly disrupt ecosystem function-ing. Ecology Letters 8:538–547.
Lawton, J.H. 1983. Plant architecture and the diversity of phytoph-agous insects. Annual Review of Entomology 28:23–29.
Martinko, E.A., R.H. Hagen & J.A. Griffith. 2006. Successionalchange in the insect community of a fragmented landscape.Landscape Ecology 21:711–721.
McCann, K.S. 2000. The diversity-stability debate. Nature405:228–233.
McCune, B. & M.J. Mefford. 2006. Multivariate Analysis ofEcological Data Version 5.14. MjM Software, Gleneden Beach,Oregon, USA.
Mielke, P.W., Jr. 1984. Meteorological applications of permutationstechniques based on distance functions. Pp. 813–830. In Handbookof Statistics, Volume 4. (P.R. Krishnaiah & P.K. Sen, eds.).Elsevier, St. Louis, Missouri, USA.
Moore, J.C., E.L. Berlow, D.C. Coleman, P.C. de Ruiter, Q. Dong,A. Hastings, N.C. Johnson, K.S. McCann, K. Melville, P.J. Morin,A.D. Rosemond, D.M. Post, J.L. Sabo, K.M. Scow, M.J. Vanni &D.H. Wall. 2004. Detritus, trophic dynamics, and biodiversity.Ecology Letters 7:584–600.
Patrick, L.B., L.H. Fraser & M.W. Kershner. 2008a. Large-scalemanipulation of plant litter and fertilizer in a managed succes-sional temperate grassland. Plant Ecology 197:183–195.
Patrick, L.B., L.H. Fraser & M.W. Kershner. 2008b. ‘‘Brown’’ worldinvertebrates contradict ‘‘green’’ world biodiversity theory. Re-search Letters in Ecology 2008, Article ID 694638. doi:10.11155/2008/694638.
Phillips, I.D. & T.P. Cobb. 2005. Effect of habitat structure and lidtransparency on pitfall catches. Environmental Entomology34:875–882.
Platnick, N.I. 2012. The World Spider Catalog, version 12.5.American Museum of Natural History, online at http://research.amnh.org/entomology/spiders/catalog/index.html
Ricklefs, R.E. & G.L. Miller. 2000. Ecology. Freeman, New York,USA.
Ritchie, A. & J.R. Steiger. 1974. Soil Survey of Summit County, Ohio.United States Department of Agriculture, Soil ConservationService in cooperation with Ohio Department of NaturalResources, Division of Lands and Soil and the Ohio AgriculturalResearch and Development Center.
Romero, S. & J.D. Harwood. 2010. Prey utilization by a communityof linyphiid spiders: variation across diel and seasonal gradients.Biological Control 52:84–90.
Rypstra, A.L., P.E. Carter, R.A. Balfour & S.D. Marshall. 1999.Architectural modifications of agricultural habitats and theirimpact on the spider inhabitants. Journal of Arachnology27:371–377.
Rypstra, A.L., J.M. Schmidt, B.D. Reif, J. DeVito & M.H. Persons.2007. Tradeoffs involved in site selection and foraging in a wolfspider: effects of substrate structure and predation risk. Oikos116:853–863.
SAS Institute Inc. 1999. SAS System for Windows. SAS Institute Inc,Cary, North Carolina, USA.
Seeber, J., G.U.H. Seeber, R. Langel, S. Scheu & E. Meyer. 2008. Theeffect of macro-invertebrates and plant litter of different quality onthe release of N from litter to plant on alpine pastureland. Biologyand Fertility of Soils 44:783–790.
Semmartin, M., M.R. Aguiar, R.A. Distel, A.S. Moretto & C.M.Ghersa. 2004. Litter quality and nutrient cycling affected bygrazing-induced species replacements along a precipitation gradi-ent. Oikos 107:148–160.
Strong, D.R., J.H. Lawton & R. Southwood. 1984. Insects on Plants:Community Patterns and Mechanisms. Harvard University Press,Cambridge, Massachusetts, USA.
Suding, K.N., S.L. Collins, L. Gough, C. Clark, E.E. Cleland, K.L.Gross, D.G. Milchunas & S. Pennings. 2005. Functional- andabundance-based mechanisms explain diversity loss due to Nfertilization. Proceedings of the National Academy of Sciences ofthe USA 102:4387–4392.
Tilman, D., J. Knops, D. Wedin & P. Reich. 2002. Experimental andobservational studies of diversity, productivity, and stability.Pp. 42–70. In The Functional Consequences of Biodiversity.(A.P. Kinzig, S.W. Pacala & D. Tilman, eds.). Princeton UniversityPress, Princeton, New Jersey, USA.
Turkington, R., E. John, S. Watson & P. Seccombe-Hett. 2002. Theeffects of fertilization and herbivory on the herbaceous vegetationof the boreal forest in north-western Canada: a 10-year study.Journal of Ecology 90:325–337.
Uetz, G.W. 1979. The influence of variation in litter habitats onspider communities. Oecologia 40:29–42.
Uetz, G.W. 1991. Habitat structure and spider foraging. Pp. 325–348.In Habitat Structure: The Physical Arrangement of Objects inSpace. (S.S. Bell, E.D. McCoy & H.R. Mushinsky, eds.). Chapmanand Hall, London, UK.
Uetz, G.W., J. Halaj & A.B. Cady. 1999. Guild structure of spiders inmajor crops. Journal of Arachnology 27:270–280.
US EPA. 2005. Clean air status and trends network (CAST-NET).Online at http://www.epa.gov/castnet/
Vitousek, P.M., H.A. Mooney, J. Lubchenco & J.M. Melillo. 1997.Human domination of Earth’s ecosystems. Science 277:494–499.
Wardle, D.A. 2002. Communities and Ecosystems: Linking theAboveground and Belowground Components. Princeton Univer-sity Press, Princeton, New Jersey, USA.
PATRICK ET AL.—SPIDER RESPONSES TO FERTILIZER AND LITTER 323
Wardle, D.A. 2006. The influence of biotic interactions on soilbiodiversity. Ecology Letters 9:870–886.
Wise, D.H. 2004. Wandering spiders limit densities of a major microbe-detritivore in the forest-floor food web. Pedobiologia 48:181–188.
Wise, D.H. 2006. Cannibalism, food limitation, intraspecific compe-tition, and the regulation of spider populations. Annual Review ofEntomology 51:441–465.
Wise, D.H., W.E. Snyder, P. Tuntibunpakul & J. Halaj. 1999. Spidersin decomposition food webs of agroecosystems: theory andevidence. Journal of Arachnology 27:363–370.
Worm, B. & J.E. Duffy. 2003. Biodiversity, productivity, and stabilityin real food webs. Trends in Ecology and Evolution 18:628–632.
Manuscript received 19 December 2011, revised 7 August 2012.