2013: Volume 3, Number 3 A publication of the Centers for Medicare & Medicaid Services, Office of Information Products & Data Analytics Episode-Based Payment: Evaluating the Impact on Chronic Conditions Thomas J. O’Byrne, Nilay D. Shah, Douglas Wood, Robert E. Nesse, Patrick J. F. Killinger, William J. Litchy, Robert J. Stroebel, Amy E. Wagie, James M. Naessens Mayo Clinic Background: Policy makers are interested in aggregating fee-for-service reimbursement into episode-based bundle payments, hoping it will lead to greater efficiency in the provision of care. e focus of bundled payment initiatives has been upon surgical or discrete procedures. Relatively little is known about calculating and implementing episode-based payments for chronic conditions. Objective: Compare the differences in two different episode-creation algorithms for two common chronic conditions: diabetes and coronary artery disease (CAD). Study Design: We conducted a retrospective evaluation using enrollees with continuous coverage in a self-funded plan from 2003 to 2006, meeting Healthcare Effectiveness Data and Information Set (HEDIS) criteria for diabetes or CAD. For each condition, an annual episode-based payment was assessed using two algorithms: Episode Treatment Groups (ETGs) and the Prometheus model. Principal Findings: We began with 1,580 diabetes patients with a 4-year total payment mean of $67,280. ETGs identified 1,447 (92%) as having diabetes with 4-year episode-based mean payments of $12,731; while the Prometheus model identified 1,512 (96%) as having diabetes, but included only 1,195 of them in the Prometheus model with mean diabetes payments of $23,250. Beginning with 1,644 CAD patients with a 4-year total payment mean of $65,661, ETGs identified 983 patients (60%) with a 4-year episode- based mean of $24,362. The Prometheus model identified 1,135 (69%) as CAD patients with 948 CAD patients having a mean of $26,536. Conclusions: The two episode-based methods identify different patients with these two chronic conditions. In addition, there are significant differences in the episode-based payment estimates for diabetes, but similar estimates for CAD. Implementing episode-based payments for chronic conditions is challenging, and thoughtful discussions are needed to determine appropriate payments. Keywords: Bundled Payments, Episodes, Chronic Disease, Relevant Services ISSN: 2159-0354 doi: http://dx.doi.org/10.5600/mmrr.003.03.a07 O’Byrne,T. J., Shah, N. D., Wood, D., et al. E1
Transcript
2013: Volume 3, Number 3
A publication of the Centers for Medicare & Medicaid Services,Office of Information Products & Data Analytics
Episode-Based Payment: Evaluating the Impact on Chronic Conditions
Thomas J. O’Byrne, Nilay D. Shah, Douglas Wood, Robert E. Nesse,Patrick J. F. Killinger, William J. Litchy, Robert J. Stroebel, Amy E. Wagie, James M. Naessens
Mayo Clinic
Background: Policy makers are interested in aggregating fee-for-service reimbursement into episode-based bundle payments, hoping it will lead to greater efficiency in the provision of care. The focus of bundled payment initiatives has been upon surgical or discrete procedures. Relatively little is known about calculating and implementing episode-based payments for chronic conditions.Objective: Compare the differences in two different episode-creation algorithms for two common chronic conditions: diabetes and coronary artery disease (CAD).Study Design: We conducted a retrospective evaluation using enrollees with continuous coverage in a self-funded plan from 2003 to 2006, meeting Healthcare Effectiveness Data and Information Set (HEDIS) criteria for diabetes or CAD. For each condition, an annual episode-based payment was assessed using two algorithms: Episode Treatment Groups (ETGs) and the Prometheus model.Principal Findings: We began with 1,580 diabetes patients with a 4-year total payment mean of $67,280. ETGs identified 1,447 (92%) as
having diabetes with 4-year episode-based mean payments of $12,731; while the Prometheus model identified 1,512 (96%) as having diabetes, but included only 1,195 of them in the Prometheus model with mean diabetes payments of $23,250. Beginning with 1,644 CAD patients with a 4-year total payment mean of $65,661, ETGs identified 983 patients (60%) with a 4-year episode-based mean of $24,362. The Prometheus model identified 1,135 (69%) as CAD patients with 948 CAD patients having a mean of $26,536.Conclusions: The two episode-based methods identify different patients with these two chronic conditions. In addition, there are significant differences in the episode-based payment estimates for diabetes, but similar estimates for CAD. Implementing episode-based payments for chronic conditions is challenging, and thoughtful discussions are needed to determine appropriate payments.
Medicare & Medicaid Research Review2013: Volume 3, Number 3
Mission Statement
Medicare & Medicaid Research Review is a peer- reviewed, online journal reporting data and research that informs current and future directions of the Medicare, Medicaid, and Children’s Health Insurance programs. The journal seeks to examine and evaluate health care coverage, quality and access to care for beneficiaries, and payment for health services.
http://www.cms.gov/MMRR/
U.S. Department of Health & Human ServicesKathleen Sebelius
Secretary
Centers for Medicare & Medicaid ServicesMarilyn Tavenner
Administrator
Editor-in-ChiefDavid M. Bott, Ph.D.
The complete list of Editorial Staff and
Editorial Board members may be found on the MMRR Web site (click link):
Published by the Centers for Medicare & Medicaid Services.
All material in the Medicare & Medicaid Research
Review is in the public domain and may be duplicated
without permission. Citation to source is requested.
Introduction
Attention is now focused on bundled payments as a promising mechanism to align the incentives for healthcare delivery, while improving quality and addressing costs. Bundled payment defines a package of care and services over a specified timeframe for a particular condition, paid in a single payment, apportioned among multiple providers (professionals and facilities) across many settings (Painter, 2012). This bundled payment—or “episode-based payment”—would have a significant impact on the organization of services and could transform the focus from volume; i.e., number of services provided, to value; i.e., efficiently delivered, effective care. (Burton, 2012).
While episode-based payments have been tested and, in many cases, implemented for surgical procedures, there is little information to guide the use of this payment mechanism for chronic medical conditions (Hussey, Sorbero, Mehrotra, Liu, & Damberg, 2009). As opposed to procedures, there are no clear start- and end-dates to define episodes for chronic conditions. Co-occurring conditions, which are frequent among chronic disease patients, also complicate the classification of services to episodes. Additionally, there are other practical challenges to implementing episodes (Damberg et al., 2011; Hornbrook, Hurtado, & Johnson, 1985) and various ‘grouping’ methods have been devised to address these issues (Damberg, et al., 2011; Johnson & Becker, 1994; Miller, 2009).
In this paper, we explore some of the characteristics, challenges, and decisions involved with applying bundling strategies to chronic disease patients by applying two recognized episode creation algorithms—Episode Treatment Groups (ETG) from OptumInsight and Evidence-Informed Case Rates (ECR) created by Prometheus Payment,
Inc.—to four years of data among two HEDIS-defined chronic disease cohorts. In the course of this exploration, we compare the algorithms’ coverage, differences in the types of services considered relevant to these chronic conditions, and variability of payments within episodes over the timeframe.
Methods
Episode Creation Algorithms
Episode Treatment Groups (ETG) f rom OptumInsight is a disease classification system, introduced in the mid-1990s, developed to identify and allocate claims into discrete episodes of care for over five hundred conditions. It was intended to facilitate analysis of cost, quality, and efficiency of treatment (Symmetry, 2006). ETG tends to handle comorbidities by assigning selected services into different, potentially concurrent, episodes.
Evidence-Informed Case Rates (ECR) created by Prometheus Payment, Inc., introduced in 2006, are algorithms designed to create episodes containing relevant services and to determine appropriate reimbursement rates for payment, for a group of medical conditions and procedures in an episode-of-care system. For each patient, the ECR algorithms classify services into a) episodes appropriate to a given condition or procedure based on ‘well-accepted clinical guidelines’ for ‘typical’, non-comorbid patients; b) services related to Potentially Avoidable Complications (PAC); and c) services for other conditions not related to the case type (de Brantes & Camillus, 2007; De Brantes, Rastogi, & Painter, 2010). Prometheus handles comorbidities by assigning a patient with multiple conditions through a hierarchy among its developed ECRs (heart failure, diabetes, CAD, chronic obstructive pulmonary disease, asthma, gastroesophageal reflux disease, and hypertension) and treating each comorbidity as a risk factor.
Data
Healthcare claims data were analyzed for 52,854 employees and dependents at Mayo Clinic in Rochester, Minnesota, who had continuous enrollment in a self-funded health plan from January 1st 2003 to December 31st 2006.
Subjects
From these enrollees, Health Plan Employer Data and Information Set (HEDIS) criteria (National Committee for Quality Assurance, 2007) were used to identify Diabetes and Coronary Artery Disease (CAD) patients based on medical and pharmacy claims from 2000 to 2003. All claims were extracted for these cohorts and formatted according to specifications found in the ETG Windows Technical Guide, Version 7.0, and the Analytical Frameworks for Construction of ECRs for Diabetes and CAD, published by Prometheus(Prometheus Payment Inc, 2008a, 2008b). The Prometheus algorithms identified uncomplicated diabetes or CAD sufferers and all relevant payments for those patients. We allowed ETG to identify conditions and episodes for each patient using system defaults. We selected all patients with episodes for ETG number 163000 (diabetes) and 386500 (ischemic heart disease) for comparison with the diabetes and CAD Prometheus ECRs, respectively. For analytical purposes, we treated the two cohorts as independent, although 305 patients were in both the diabetes and CAD cohorts.
Analysis
Typically, episodes are triggered for a specific patient, and then services are included or excluded based on criteria. Because we are focusing on chronic medical conditions, most approaches capture all services “relevant” for a patient for an entire year; hence, the episode creation methods were compared on both
O’Byrne,T. J., Shah, N. D., Wood, D., et al. E3
MMRR 2013: Volume 3 (3)
the number and type of patient included in the algorithm, as well as the payments covered in each approach. To normalize for differences in cohort selection between the two strategies, comparisons were also performed for patients included as diabetes or CAD patients by both algorithms. Analyses were performed at the patient level. Payments per patient were analyzed overall (4-year total) and by calendar year from the payer perspective and represent insurance provider payments, patient payments (including coinsurance and copayments), and coordination of benefit payments. Payments were further categorized by type of service using the BETOS classification system, (www.cms.hhs.gov/HCPCSReleaseCodeSets/20_BETOS.asp). Total payments represent payments for all services for a patient irrespective of condition. To understand some of the differences between classification schemes in triggering events and episode bundling, we further examined the patients and services which were included in one method but not the other.
Results
Patient Coverage
Diabetes
Using the HEDIS criteria, the diabetes cohort included 1,580 patients with mean 4-year total payments of $67,280 covering all services (Exhibit 1a).
ETG identified 92% of our cohort as diabetics, while 96% were identified by Prometheus. Following Prometheus criteria, 21% of the diabetics, accounting for 34% of the total payments, are excluded from analysis due to complex comorbidities unrelated to diabetes, including HIV, cancer, suicide, end stage renal disease, or pregnancy. Among the 1,195 diabetes patients addressed by Prometheus, the model further excluded 60% of payments due to non-diabetic services or inpatient care, resulting
in mean 4-year diabetes payments of $23,250. In comparison, the 1,447 patients identified as diabetics using ETGs had mean 4-year payments within diabetes-related ETGs of $12,731.
CAD
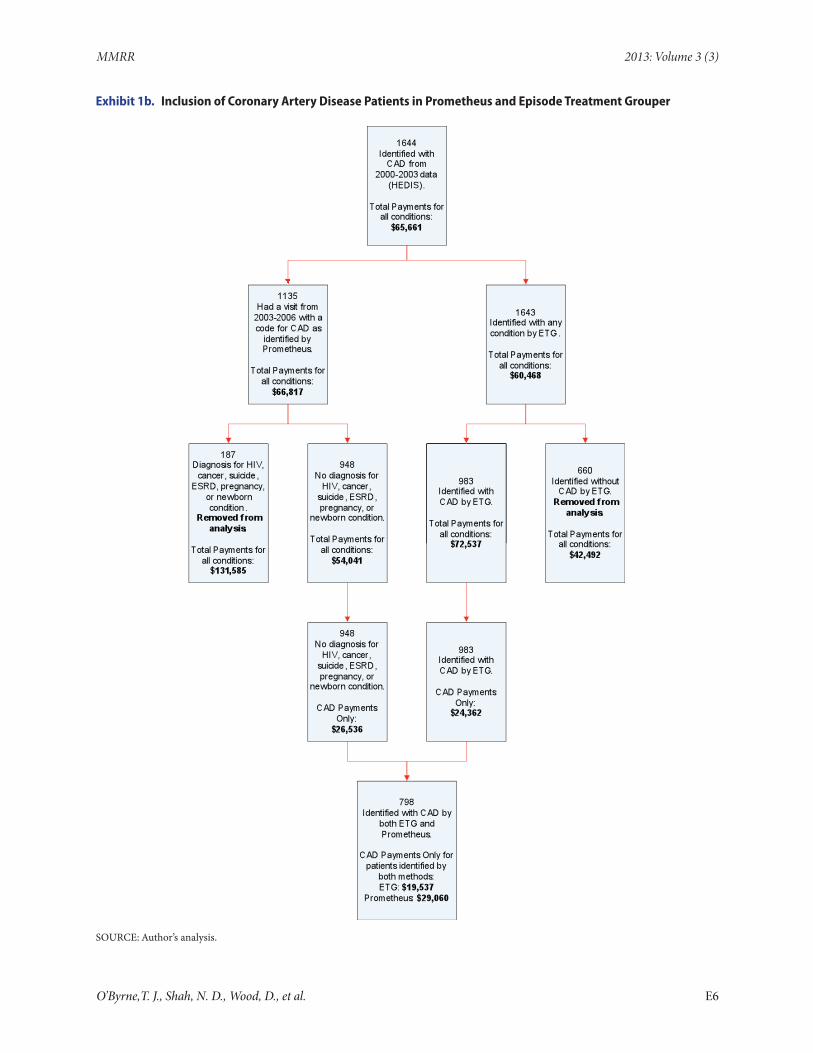
For CAD 1,644 patients with mean 4-year total payments of $65,661 were identified using HEDIS criteria (Exhibit 1b).
ETG identified 983 patients (60%) of our cohort with CAD while Prometheus identified 1,135 (69%). We excluded from the analysis 16% of the patients from Prometheus due to complex comorbidities unrelated to CAD, accounting for 32% of the total payments. Of the 948 CAD patients included by Prometheus, 51% of payments were classified as services unrelated to CAD. After exclusions, the remaining CAD patients identified by Prometheus had mean 4-year payments of $26,536. In comparison, using ETGs, the 983 patients identified had mean 4-year payments within CAD-related ETGs of $24,362.
Episode Payment Comparison
Diabetes
The 1,145 people identified with diabetes by both methods had mean 4-year payments of $60,056. Mean payments of $41,487 were considered relevant to diabetes by Prometheus (see Exhibit 2, for chart see Exhibit A1 in Appendix 1), while only $12,273 were assigned to diabetes episodes by ETGs. All diabetes hospitalization payments are considered potentially avoidable complications by Prometheus. In addition, other services related to an acute exacerbation of the index condition or comorbidity, as well as potential patient safety failures, are considered potentially avoidable complications. Excluding hospital services from its payment model for diabetes resulted in mean diabetes 4-year payments of $23,951. Accounting for 41% of total diabetes-related payments, 98.5% of these diabetics
Exhibit 1a. Inclusion of Diabetes Patients in Prometheus and Episode Treatment Grouper
SOURCE: Author’s analysis.
O’Byrne,T. J., Shah, N. D., Wood, D., et al. E5
MMRR 2013: Volume 3 (3)
Exhibit 1b. Inclusion of Coronary Artery Disease Patients in Prometheus and Episode Treatment Grouper
SOURCE: Author’s analysis.
O’Byrne,T. J., Shah, N. D., Wood, D., et al. E6
E7O’Byrne,T. J., Shah, N. D., Wood, D., et al.
MMRR 2013: Volume 3 (3)
Exhibit 2. Capture of Diabetes Healthcare Payments by Type of Service by Classification System by Year for Patients Assigned to Both Prometheus and Episode Treatment Grouper
were identified as having potentially avoidable complications. Overall, Prometheus included 69% of total payments (40% when excluding inpatient services) for these patients, while only 20% of total payments were captured by diabetes-related ETGs. Prometheus identified as “relevant” 93% of pharmacy payments, 86% of inpatient services, and from 63–69% of lab and primary or specialty care E&M payments. Diabetes-related ETGs captured only 45% of pharmacy payments, 7% of inpatient services, 35% of lab, 36% of primary care E&M payments, and 43% of specialty care E&M payments. The percent of services captured by each system were fairly consistent over time (Exhibit 2).
CAD
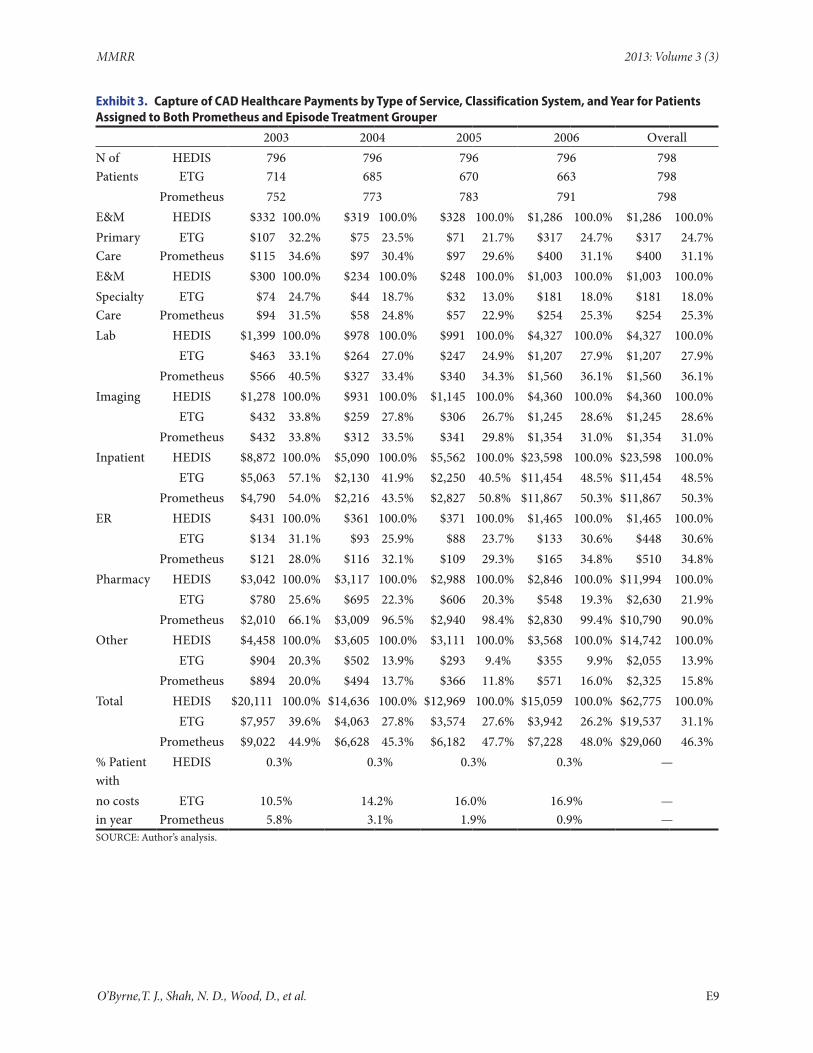
Among CAD patients, the 798 people identified by both methods had mean 4-year total payments of $62,775. Mean payments of $29,060 were considered relevant to CAD by Prometheus, while mean payments of $19,537 were assigned to CAD episodes. Payments by year are provided in Exhibit 3, and Exhibit A2 of Appendix 1. Prometheus and ETGs capture similar percentages of the various types of services except for pharmacy (Prometheus–90%, ETG–22%). Prometheus captured a larger proportion of E&M, inpatient and lab payments, but smaller proportions of ER and pharmacy payments in 2003 compared to subsequent years. The pattern of ETG capture over time was similar to Prometheus, with the exception of pharmacy, where ETG captured a slightly larger proportion (26%) in 2003 than in later years (~20%; see Exhibit 3). Accounting for only 9.6% of total CAD-related payments, 28.5% of CAD patients had potentially avoidable complications.
What seems to lead to differences between HEDIS, ETG, and Prometheus?
To assess the differences between the three classification methods, we addressed three issues:
O’Byrne,T. J., Shah, N. D., Wood, D., et al.
a) validity of trigger events for episodes—did the patients appear to have the reported condition? b) treatment of comorbidities and complications—do the services get coded under a “related” condition? and c) specific services—are selected, relevant services captured?
Validity of Trigger Event for Episode
The cases excluded by ETG, but included by Prometheus, as well as the HEDIS cases excluded by both episode systems, had lower mean payments than other patients (Exhibit 4).
Different diagnosis codes were used by each grouper to identify the episode triggers resulting in a different proportion of payments assigned by each method. Seventy-one (85.5%) of the 83 diabetics and 458 (89.6%) of the 511 CAD patients captured only by HEDIS had relevant historical diagnosis codes (2000–2002), but no relevant diagnoses included on bills from 2003–2006. ETG and Prometheus have similar code ranges for diabetes. HEDIS, but not Prometheus or ETG, includes diabetic complications outside the ICD-9 250 series, as well as gestational diabetes, whereas only Prometheus includes codes for abnormal glucose or glucosuria. However, for CAD the diagnosis codes included by ETG and Prometheus have more differences. ETG includes a broader range of cardiovascular disease (e.g., pulmonary embolism, cardiomyopathy and hypotension) not included in the other classifications. Prometheus does not include diagnosis codes for acute myocardial infarction (ICD-9 code 410) or angina (ICD-9 code 411), where ETG and HEDIS include these conditions in CAD. Detailed lists of included ICD-9 diagnosis codes by each classification are included in Appendix 2.
Handling of Comorbidity and Disease Complexity
ETG tends to handle comorbidity by assigning services into different episodes. Prometheus assigns a patient with multiple ECRs by a hierarchy (heart failure, diabetes, CAD, chronic obstructive
E8
E9O’Byrne,T. J., Shah, N. D., Wood, D., et al.
MMRR 2013: Volume 3 (3)
Exhibit 3. Capture of CAD Healthcare Payments by Type of Service, Classification System, and Year for Patients Assigned to Both Prometheus and Episode Treatment Grouper
Exhibit 4. Number of Patients and Extent of Payments for Patients Classified by Each System Using All HEDIS Cases
Diabetes Identified by NDisease
Assignment byMean 4-year
Included PaymentsMean 4-year
Total Payments
ETG and Prometheus 1145
ETG$ 12,273
$ 60,056(17.8%)
Prometheus
$ 41,487
$ 60,056(60.2%)*$ 23,951
(34.8%)#
Prometheus Only 50 Prometheus
$ 9,662
$ 26,194(30.3%)*
$ 7,181(22.5%)#
ETG Only 302 ETG$ 14,465
$ 109,066(12.0%)
Neither ETG or Prometheus 83 Neither (0.0%) $ 39,655CAD Identified by
ETG and Prometheus 798ETG
$ 19,537 $ 62,775
(31.1%)
Prometheus$ 29,060
$ 62,775(46.3%)
Prometheus Only 150 Prometheus$ 13,113
$ 41,249(31.8%)
ETG Only 185 ETG$ 45,177
$141,376(32.0%)
Neither ETG or Prometheus 511 Neither (0.0%) $ 49,922NOTES:* Including Inpatient services # Excluding Inpatient servicesSOURCE: Author’s analysis.
pulmonary disease, asthma, gastroesophageal reflux disease, and hypertension) and then treats the comorbidity as a risk factor.
Patients included by ETG, but excluded by Prometheus, have much higher total payments for diabetes and both higher total and higher case type payments for CAD patients (See Exhibit 4).
Diabetes patients were excluded from Prometheus due to complex comorbidities of concurrent cancer (n = 294) and pregnancy (n = 28), but not heart failure. There were 77 diabetes Prometheus patients who also had heart failure.
Among the 187 CAD patients excluded with “case-breaker” conditions, 185 had heart failure and 2 had pregnancy codes. However, 7 heart failure patients were not excluded.
There were 134 patients who qualified for both CAD and diabetes Prometheus ECRs. These patients had mean 4-year total payments of $258,107, while the total 4-year payments for patients with only diabetes averaged $52,322 and those with only CAD averaged $60,162.
Among patients captured in both ETG and Prometheus, more services were attributed to the
O’Byrne,T. J., Shah, N. D., Wood, D., et al. E10
MMRR 2013: Volume 3 (3)
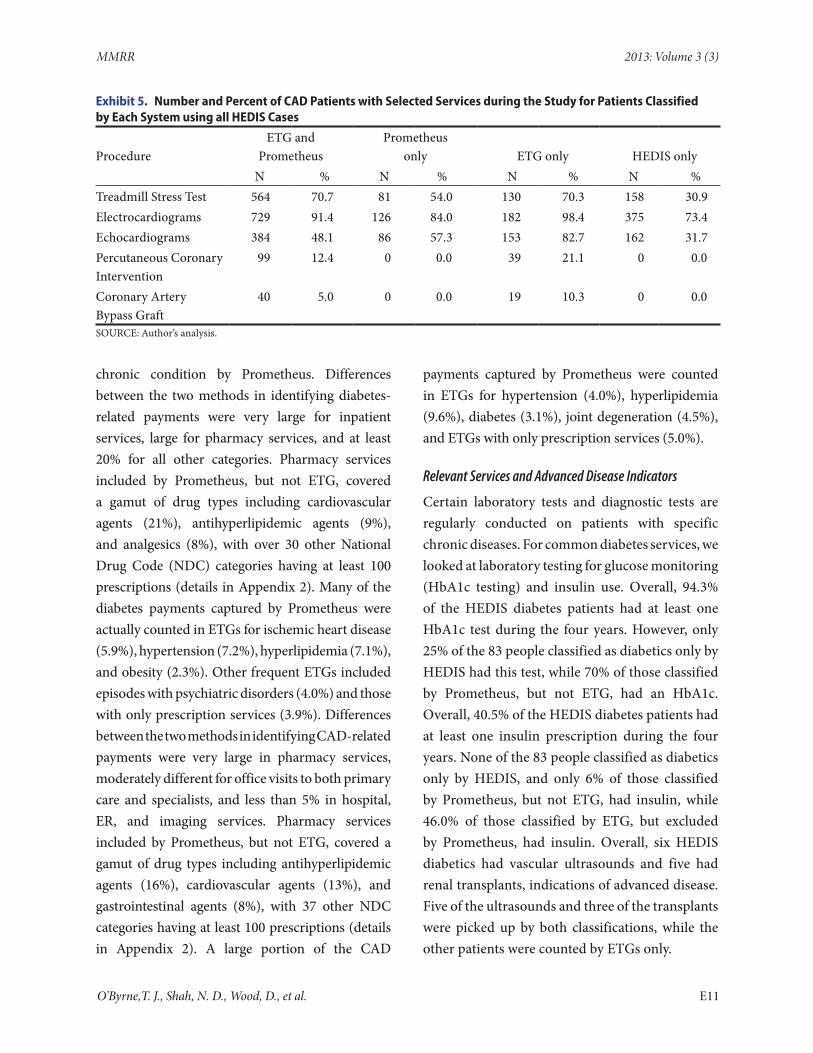
Exhibit 5. Number and Percent of CAD Patients with Selected Services during the Study for Patients Classified by Each System using all HEDIS Cases
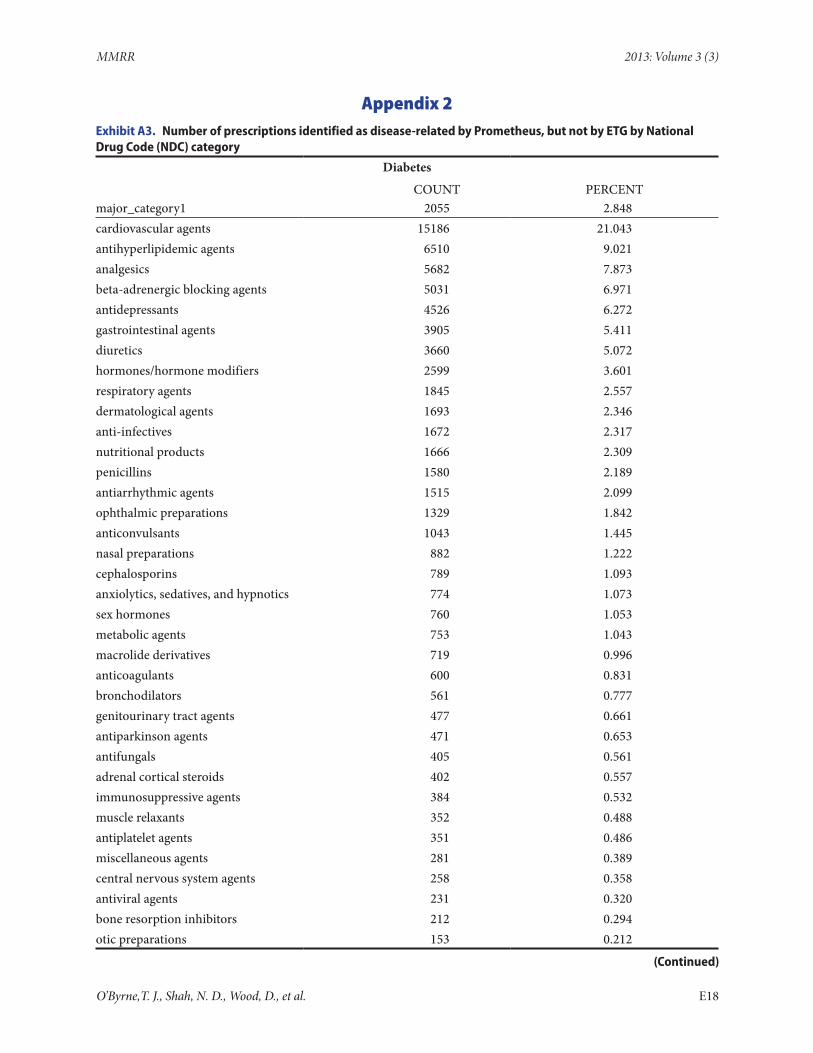
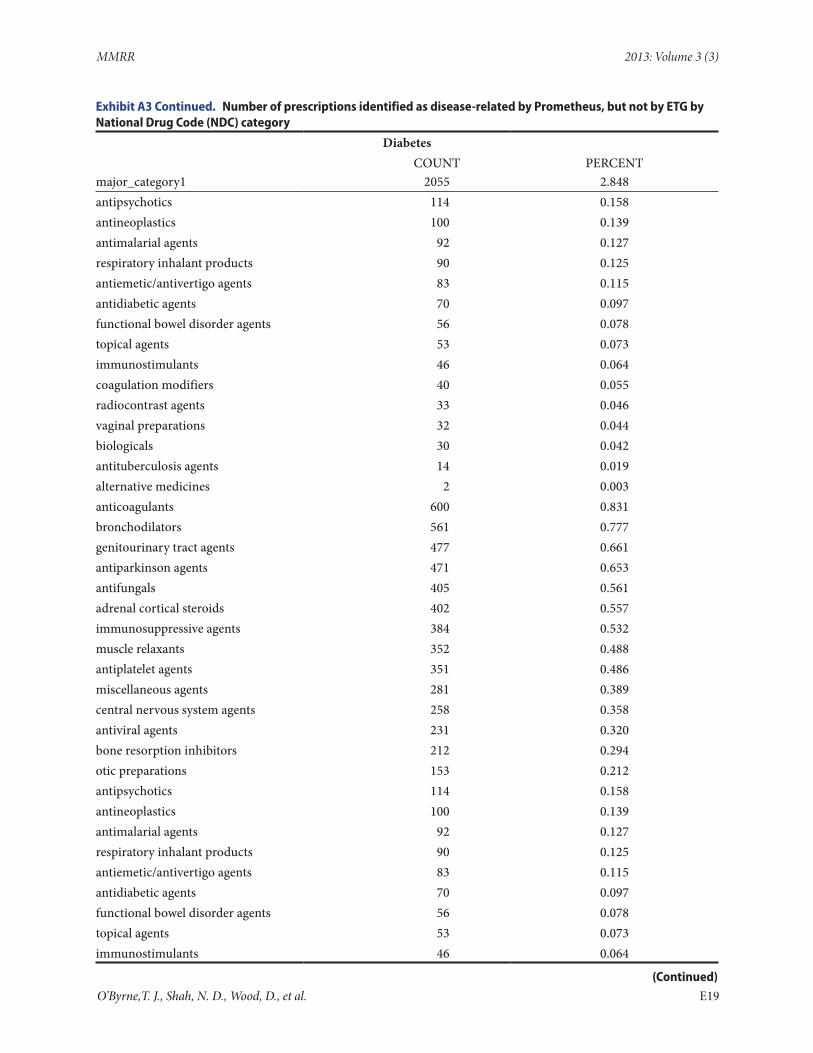
chronic condition by Prometheus. Differences between the two methods in identifying diabetes-related payments were very large for inpatient services, large for pharmacy services, and at least 20% for all other categories. Pharmacy services included by Prometheus, but not ETG, covered a gamut of drug types including cardiovascular agents (21%), antihyperlipidemic agents (9%), and analgesics (8%), with over 30 other National Drug Code (NDC) categories having at least 100 prescriptions (details in Appendix 2). Many of the diabetes payments captured by Prometheus were actually counted in ETGs for ischemic heart disease (5.9%), hypertension (7.2%), hyperlipidemia (7.1%), and obesity (2.3%). Other frequent ETGs included episodes with psychiatric disorders (4.0%) and those with only prescription services (3.9%). Differences between the two methods in identifying CAD-related payments were very large in pharmacy services, moderately different for office visits to both primary care and specialists, and less than 5% in hospital, ER, and imaging services. Pharmacy services included by Prometheus, but not ETG, covered a gamut of drug types including antihyperlipidemic agents (16%), cardiovascular agents (13%), and gastrointestinal agents (8%), with 37 other NDC categories having at least 100 prescriptions (details in Appendix 2). A large portion of the CAD
payments captured by Prometheus were counted in ETGs for hypertension (4.0%), hyperlipidemia (9.6%), diabetes (3.1%), joint degeneration (4.5%), and ETGs with only prescription services (5.0%).
Relevant Services and Advanced Disease Indicators
Certain laboratory tests and diagnostic tests are regularly conducted on patients with specific chronic diseases. For common diabetes services, we looked at laboratory testing for glucose monitoring (HbA1c testing) and insulin use. Overall, 94.3% of the HEDIS diabetes patients had at least one HbA1c test during the four years. However, only 25% of the 83 people classified as diabetics only by HEDIS had this test, while 70% of those classified by Prometheus, but not ETG, had an HbA1c. Overall, 40.5% of the HEDIS diabetes patients had at least one insulin prescription during the four years. None of the 83 people classified as diabetics only by HEDIS, and only 6% of those classified by Prometheus, but not ETG, had insulin, while 46.0% of those classified by ETG, but excluded by Prometheus, had insulin. Overall, six HEDIS diabetics had vascular ultrasounds and five had renal transplants, indications of advanced disease. Five of the ultrasounds and three of the transplants were picked up by both classifications, while the other patients were counted by ETGs only.
O’Byrne,T. J., Shah, N. D., Wood, D., et al. E11
MMRR 2013: Volume 3 (3)
For CAD, we looked at treadmill stress tests, electrocardiograms, and echocardiography as common services, and percutaneous coronary artery interventions and coronary bypass grafts as indicators of advanced disease. Exhibit 5 provides information on the number of patients with each of these procedures counted by ETGs and Prometheus among the CAD cohort during the study. Similar patterns were seen as with diabetes.
Grouper Comparison
Both Prometheus algorithms and ETG allow stratification by episode severity, although this was not available in our version of Prometheus. Only 33% of diabetes-relevant and 54% of the CAD-relevant payments identified by Prometheus were also assigned to patients identified with the lowest two severity levels of ETG.
ETG assigns each service with a diagnosis code as primary to only one episode treatment group (Symmetry, 2006), while services with the same diagnosis code can be used by Prometheus algorithms for multiple conditions. However, Prometheus assigns patients to specific ECRs based on a hierarchy, with heart failure being assigned as the ECR before either CAD or diabetes. Diabetes currently gets assigned before CAD. Although we included all adults, Prometheus currently includes patients aged between 18 and 65. ETG includes all ages, often having specific ETGs for certain age groups. Prometheus has minimum/maximum cost requirements for claims/episodes. ETG has no similar restrictions. Prometheus utilizes a fixed episode length of 365 days for both diabetes and CAD, whereas ETG utilizes an open-ended inclusion period using a 365 day clean period to define the end of an episode. Lapses in eligibility are handled differently, with Prometheus excluding an episode if there is more than a 30 day lapse. ETG will terminate one episode and begin a new one when eligibility resumes.
Patients with both diabetes and CAD can be assigned ETGs covering both conditions. Prometheus covers both diseases, but in its implementation, a person with both conditions will be assigned to diabetes at higher risk. We counted these 77 patients in both groups.
O’Byrne,T. J., Shah, N. D., Wood, D., et al.
Discussion
Episode of illness payments or bundled payments is gaining interest as a potential method for managing increased healthcare costs. However, where these methods look encouraging for elective surgeries, limited information is available for using these methods for patients with chronic disease. We undertook to examine how two episode systems, one developed for analysis and the other developed for payment, classified costs and services for two cohorts of patients with chronic disease. When examining the health care services used from 2003–2006 among cohorts defined by HEDIS criteria from 2000–2003, we found that both Prometheus and ETGs identified over 90% of patients with diabetes, but less than 70% of patients with CAD. However, although many patients were jointly identified with the chronic disease, most of their service payments were not captured as disease-related costs. Using matching cohorts, less than 50% of total payments were related to the chronic disease using Prometheus and from 21–31% of total payments were attributed to related ETGs (see Appendix 1). Should a bundling method be comprehensive? To be an effective reimbursement model, Prometheus will have to be expanded to cover many more conditions and the effectiveness of its risk adjustment will need to be better understood. In our study, patients with both diabetes and CAD had average total payments much greater than the sum of the average payments for those with only diabetes and those with only CAD. Prometheus identifies selected services as relevant—but potentially avoidable—complications;
E12
MMRR 2013: Volume 3 (3)
these include inpatient services for diabetes patients and acute exacerbations of the index condition or comorbidities. Prometheus also captured over 90% of pharmacy charges for both cohorts, while condition-related ETGs captured from 22–45% of pharmacy payments. Comparing three different identification systems (HEDIS, ETG, Prometheus) and obtaining such differing results from the same cohort of patients highlights the importance of agreeing on identification criteria (episode triggers) in establishing the basis of episode reimbursement strategy, especially for chronic disease. Such different perspectives on what is covered as “relevant” for chronic diseases will not be easily understood or accepted by clinicians. Widespread agreement on the criteria to identify conditions and how to handle comorbid conditions will encourage acceptance of episode reimbursement.
When we focused on cases identified as diabetes or CAD by one system and not the other, we saw three issues. Some diagnosis codes are included by HEDIS and not by either ETGs or Prometheus (e.g., gestational diabetes). For CAD, ETGs include a much wider range of cardiovascular conditions not included in HEDIS or Prometheus; however, these patients would not have been included in our study based on our starting with HEDIS cohorts. The majority of patients included only in our HEDIS cohorts did not have qualifying billing diagnosis codes from 2003–2006. It is possible (although unlikely) that the chronic condition diagnosed in 2000–2002 were resolved. Many of these patients had few encounters and may have been detected by HEDIS when the diagnosis was used in a “rule-out” manner. Furthermore, HEDIS definitions are much more “lenient” in detecting CAD than diabetes, requiring only a single visit with CAD, but two coded visits for diabetes. Meanwhile, most of the cases included by ETG but not Prometheus were “case breakers” with complex comorbidities. Among diabetics, these patients had cancer or
O’Byrne,T. J., Shah, N. D., Wood, D., et al.
a pregnancy and were intentionally excluded by Prometheus. For CAD, the differences were driven more from coexisting diagnoses of heart failure.
When we focused on common services, it appears that many patients identified in our HEDIS cohort, but not by either classification, are appropriately not included, as they are not being actively treated for the underlying condition. Meanwhile, based on diagnostic and therapeutic services for advanced disease, it appears that Prometheus is excluding some, but not all, of the complex patients.
Other issues affect the differing assignment methods for considering which services should not be included in the episode. Many conditions indicative of advanced diabetes, such as cardiovascular problems, ophthalmologic conditions, and renal problems, get counted by ETGs as separate conditions, while Prometheus captures some of these diabetes complications within the diabetes case rate. Some of the conditions included in the CAD ETG, but not in Prometheus, include pulmonary embolism, cardiomyopathy, and hypotension, conditions not directly related to CAD. Patients captured as relevant only by Prometheus and not by ETG appeared to include some who may not be actively treated for the condition (i.e., fewer patients with electrocardiograms or glucose monitoring).
Direct comparison of ETG and Prometheus emphasizes differences in content and focus of the two methods. The unit of analysis for ETG is a collection of all relevant claims for a given episode of care. Rigorous selection of services results in not including selected services that are included by Prometheus; however, few patient, medical, or procedural exclusion criteria exist for ETG. This approach may allow better comparisons of ETG episodes within and between institutions and, in the case of severity mix and efficiency, between healthcare specialties. However, the exclusion of costs from episodes may
E13
MMRR 2013: Volume 3 (3)
result in ETGs having unrepresentative expenditure rates for a given condition.
Prometheus has been proposed as a potential candidate for a practical episode-based reimbursement strategy. The Prometheus selection algorithms have been designed to determine a “reasonable” rate to reimburse each episode and focus on “typical” patients by excluding patients and episodes that would be outliers. This approach also generally underestimates the overall mean expenditure rate for a specific condition, but may be reasonable if the mechanism for outlier payments is widely accepted. By incorporating the costs of readmissions and preventable complications into a single payment based on uncomplicated patients, incentives exist to reduce unnecessary care, but yet balance quality with efficiency. The systematic approach of Prometheus could provide transparent reimbursement rates, fostering negotiation for episode payments between health care providers and payers. The focus on uncomplicated patients, however, appears to exclude the majority of patients and their costs in several cohorts (de Brantes & Camillus, 2007), making Prometheus-determined reimbursement rates less representative of true costs. Most of our CAD patients with heart failure were excluded from the Prometheus CAD ECR, and captured in a different ECR. Furthermore, we were unable to assess how well the risk adjustments improve Prometheus reimbursement rate calculations.
In order to minimize selection bias and encourage participation, particularly among providers in rural geriatric facilities or in tertiary care centers, reimbursement plans need to be specified for complex /complicated patients who are otherwise excluded from payment models. Further complicating this issue will be the fact that many high cost patients have multiple comorbidities, as we saw in those with both diabetes and CAD. It is unclear how episode reimbursement will cover the costs of care
O’Byrne,T. J., Shah, N. D., Wood, D., et al.
coordination for comorbid patients. (Naessens et al., 2011; Thorpe & Howard, 2006)
As expected with their development for different purposes, there are both methodological and condition-specific differences in assignments between the Prometheus and ETG grouping algorithms. ETG is a retrospective analysis tool, assigning claims records into specific conditions to identify concurrent episodes. Prometheus is applied to historical data to calculate prospective reimbursement rates for selected conditions. ETG’s use of a “clean period” allows episodes to continuously include relevant new services and enables all costs for a given episode to be consolidated into a comparable unit of measurement. To understand the nature, duration, and complexity of a patient’s condition, ETGs have been presented as highly effective, facilitating a truer analysis of ‘medical care episodes’ (Hornbrook, et al., 1985) spanning the entire period of a patient’s treatment. However, this episode-based approach would be difficult to use for chronic condition reimbursement. Many complications or related services were classified under different conditions by the different systems.
Many patients are followed several years with hyperglycemia before meeting the diagnostic criteria for type 2 diabetes. How will episodic reimbursement handle transition from one condition to another and how will start and end dates be assessed when payment disbursement ramifications exist across the participating physicians? If a patient is diagnosed partway through a coverage period with type 2 diabetes after having hyperglycemia, will they be eligible for both episode payments or will payments be pro-rated? ETG is able to identify when a patient escalates from one condition to a more serious one (Symmetry, 2006). Prometheus ECRs for chronic conditions are designed to span a one year period and would prioritize one
E14
MMRR 2013: Volume 3 (3)
condition over the other, using the lower-priority condition to risk-adjust the physicians’ payment (ETG Clinical Knowledge Base, 7.0; Prometheus Payment Inc, 2008c).
One aspect of a practical episode reimbursement system, that is not immediately apparent in ETG or Prometheus, is the idea of ‘phasing’ (Hornbrook, et al., 1985). Both Diabetes and CAD are chronic conditions with distinct ‘diagnostic’ (emerging condition; symptoms first noted) and ‘treatment’ phases (diagnosis confirmed; treatment underway). Resource use may differ substantially between these two phases. For CAD in particular, extensive testing is commonly performed at the time of diagnosis and initial management. Once the patient’s disease is properly diagnosed and under control, the number of tests will decrease and the treatment phase will center on evaluation and management visits, with healthcare payments shifting to pharmaceutical reimbursements. This could explain the higher payments we saw in CAD patients in the first study year. If a single rate is used for each episode, providers could be penalized for making an initial diagnosis of a chronic condition if the rate is set too low to cover diagnostic phase services, or could be rewarded disproportionately if the reimbursement rate is set too high for the treatment phase. Because severity challenges can span both phases of a patient’s condition, severity adjustment will need to be rigorous.
This analysis has several limitations. ICD9 procedure codes, required by the Prometheus ECR playbook, were unavailable in the claims data used for this analysis. To apply the Prometheus algorithms to our data, we mapped the ICD9 procedure codes to CPT4 codes. However, this should not have had a large impact for chronic disease cohorts. Although we have a large number of patients in our cohort, another limitation is the single site setting and
highly integrated nature of the medical practice. Although many of the issues we found are unlikely to be restricted to our setting, the generalizability of specific results may be limited, particularly to smaller and/or rural healthcare providers. Several strengths balance these limitations. The data were very complete for tracking a large group of enrollees over four years, and we were able to link clinical data with healthcare claims.
Conclusions
Both episode of care tools we examined have shown promise, but have limitations, as aids to understanding issues surrounding episode reimbursement implementation. ETGs have been developed for a wide range of conditions, but they utilize strict rules to associate services with each condition and could potentially underestimate relevant costs by assigning services to different ETGs. The Prometheus ECRs are a more fully realized system for reimbursement strategy, but have relatively few chronic disease conditions currently available for use.
Among the three classification schemes used, different patients and different service payments were identified in the two disease cohorts. Differences in method and classification between ETG and Prometheus suggest that any implementation for chronic disease reimbursement will have definitional issues. Further research should be carried out to investigate these issues in more detail. When dealing with payments for chronic disease, many issues need to be considered to provide adequate payments to best serve complex patients.
CorrespondenceJames M. Naessens, Sc.D., Mayo Clinic—Health Care Policy & Research, 200 First Street SW, Rochester, MN 55905, [email protected], Tel. 507-284-8993
Painter, M. W. (2012). Bundles payment across the U.S. Today: Status of Implementations and Operational Findings. Newtown, Conn: Health Care Incentives Improvement Institute.
Burton, R. (2012). Payment reform: Bundles episodes vs. global payments (a debate between Francois de Brantes and Robert Berenson). In R. B. (moderator) (Ed.), Timely analysis of immediate health policy issues: Urban Institute.
Damberg, C. L., Sorbero, M. E., Hussey, P. S., Lovejoy, S., Liu, H., & Mehrotra, A. (2011). Exploring Episode-Based Approaches for Medicare Performance Measurement, Accountability and Payment. RAND Health working paper series. U.S. Department of Health and Human Services.
de Brantes, F., & Camillus, J. A. (2007). Evidence-Informed Case Rates: A New Health Care Payment Model. The Commonwealth Fund, 57.
De Brantes, F., Rastogi, A., & Painter, M. (2010). Reducing potentially avoidable complications in patients with chronic diseases: the Prometheus Payment approach. Health Services Research, 45(6 Pt. 2), 1854–1871. PubMed http://dx.doi.org/10.1111/j.1475-6773.2010.01136.x
ETG Clinical Knowledge Base. (Version 7.0).Hornbrook, M. C., Hurtado, A. V., & Johnson,
R. E. (1985). Health care episodes: definition, measurement and use. Medical Care Review, 42(2), 163–218. PubMed http://dx.doi.org/ 10.1177/107755878504200202
Hussey, P. S., Sorbero, M. E., Mehrotra, A., Liu, H., & Damberg, C. L. (2009). Episode-based performance measurement and payment: making it a reality. Health Affairs (Project Hope), 28(5), 1406–1417. PubMed http://dx.doi.org/10.1377/hlthaff.28.5.1406
Johnson, L. L., & Becker, R. L. (1994). An alternative health-care reimbursement system—application of arthroscopy and financial warranty: results of a 2-year pilot study. Arthroscopy, 10(4), 462–470. PubMed http://dx.doi.org/10.1016/S0749-8063(05)80200-2
Miller, H. D. (2009). From volume to value: better ways to pay for health care. Health Affairs (Project Hope), 28(5), 1418–1428. PubMed http://dx.doi.org/10.1377/hlthaff.28.5.1418
Naessens, J. M., Stroebel, R. J., Finnie, D. M., Shah, N. D., Wagie, A. E., Litchy, W. J., & Nesse, R. E. (2011). Effect of multiple chronic conditions among working-age adults. The American Journal of Managed Care, 17(2), 118–122. PubMed
National Committee for Quality Assurance (2007). HEDIS 2007: Technical Specifications (Vol. Vol. 2). Washington, DC: National Committee for Quality Assurance.
Prometheus Payment Inc. (2008c). Chronic Medical ECRs Retrieved from http://www.hci3.org/?q=node/66/#/2.
Symmetry. (2006). A condition classification and episode building system. Retrieved from http://www.symmetry-health.com/downloads/ETG_WhitePaper.pdf
Thorpe, K. E., & Howard, D. H. (2006). The rise in spending among Medicare beneficiaries: the role of chronic disease prevalence and changes in treatment intensity. Health Affairs (Project Hope), 25(5), w378–w388. PubMed http://dx.doi.org/10.1377/hlthaff.25.w378