EPR Third Quarter Report: Strategic Measures Summary Dashboard The CalPERS 2017-22 Strategic Plan encompasses 27 Strategic Measures (Measures) that enable us to track our progress towards achieving our strategic goals and objectives. The Strategic Measures Summary Dashboard provides a brief synopsis of how all 27 Measures are performing for the third quarter (January 1,2021 – March 31, 2021). Additional performance details can be found on the summary sheets for each Measure. Third Quarter Measure Performance: • 19 Pending Refresh • 4 On-Target • 3 Under Development • 1 Closed Session item The Strategic Measures Summary Dashboard also provides trend analysis data that captures performance from year three (FY 2019-20). A visual depiction of all Strategic Measures can be found on the Alignment Map. Status Key On-Target At-Risk Off-Target Pending Refresh Data Not Available Under Development Third Quarter Report - Strategic Measures - 1 of 58
Transcript
EPR Third Quarter Report: Strategic Measures Summary Dashboard
The CalPERS 2017-22 Strategic Plan encompasses 27 Strategic Measures (Measures) that enable us to track our progress towards achieving our strategic goals and objectives. The Strategic Measures Summary Dashboard provides a brief synopsis of how all 27 Measures are performing for the third quarter (January 1,2021 – March 31, 2021). Additional performance details can be found on the summary sheets for each Measure.
Third Quarter Measure Performance: • 19 Pending Refresh• 4 On-Target• 3 Under Development• 1 Closed Session item
The Strategic Measures Summary Dashboard also provides trend analysis data that captures performance from year three (FY 2019-20). A visual depiction of all Strategic Measures can be found on the Alignment Map.
Status Key On-Target At-Risk Off-Target Pending Refresh Data Not Available Under Development
Third Quarter Report - Strategic Measures - 1 of 58
Third Quarter Report - Strategic Measures - 4 of 58
Risk Management Q1
Status Q2
Status Q3
Status Q4
Status
Trend Analysis
(FY 2019-20)
Page Number
Stakeholder assessment survey – compliance and risk
Coming in Q4 35
Risk employee awareness survey
Coming in Q4 37
Risk program maturity assessment
Coming in Q4 39
Compliance employee awareness survey
Coming in Q4 41
Compliance program maturity assessment
Coming in Q4 43
Composite security health score within range
Closed Session
Closed Session
Closed Session
Coming in Q4 Closed Session 45
Third Quarter Report - Strategic Measures - 5 of 58
Talent Management Q1
Status Q2
Status Q3
Status Q4
Status
Trend Analysis
(FY 2019-20)
Page Number
Effectiveness of outreach activities
Coming in Q4 46
Engagement survey results and action items – diversity & inclusion
48
Engagement survey results and action items – performance management
Coming in Q4 51
Engagement survey results and action items – clarity of direction
Coming in Q4 54
Proficiency in CalPERS leadership competencies
Coming in Q4 57
Third Quarter Report - Strategic Measures - 6 of 58
2020-21 Strategic Measure Summary (Quarter 3)
Measure Title: Funded Status Executive Owner: Michael Cohen Strategic Goal: Fund Sustainability Strategic Objective: Fund the system through an integrated view of pension assets and liabilities Associated Initiative(s): Alignment of Asset Liability Management
Status: Pending Refresh (in August 2021) Numeric Status: 70.1% (as of June 30, 2019)
Description: Funded status is a measure of a pension system’s health and is determined by dividing the market value of assets by the actuarial accrued liability. This measure will evaluate overall Funded Status for the three major components of the Public Employees’ Retirement Fund (PERF): State, School, and Public Agency employers.
As part of the CalPERS ALM cycle, the Board will examine the current funded status of the system and make decisions in alignment with the goal of strengthening the long-term sustainability of the pension fund. CalPERS is also focused on reducing complexity and system costs which will contribute positively to the Funded Status of the PERF.
Annually the Actuarial Office provides the Funded Status of the previous fiscal year and Projected Funded Status of the current fiscal year. The inputs for this metric are influenced by five main factors:
• Payment of unfunded liabilities• Actual vs. expected investment returns• Change in actuarial methods and assumptions• Benefit changes• Actuarial experience
The funded status is based on a 7.0% discount rate.
Baseline: PERF 67.9% (as of 6/30/17)
Target: Long-term (beyond the current strategic plan) funded status of 100%
Refresh Frequency: Annually, August
Reporting Range: 07/01/18 - 06/30/2019
Third Quarter Report - Strategic Measures - 7 of 58
Thresholds: On-Target: >100% Funded Status At-Risk: 80% to 100% Funded Status Off-Target: <80% Funded Status
Status Narrative: The funded status was off-target at 70.1% (as of June 30, 2019), however it did rise 0.4% from the previous year, which is in line with the projected funded status targets. Performance Trend Chart:
67.969.7 70.1
2017 2018 201940
50
60
70
80
90
100
% of Funded Status
Funded Status
Baseline Off-Target Target Trendline
Third Quarter Report - Strategic Measures - 8 of 58
2020-21 Strategic Measure Summary (Quarter 3)
Measure Title: Projected Funded Status Executive Owner: Michael Cohen Strategic Goal: Fund Sustainability
Strategic Objective: Fund the system through an integrated view of pension assets and liabilities Associated Initiative(s): Alignment of asset liability management; actuarial valuation system-advanced analytics
Status: Pending Refresh (in August 2021) Numeric Status: 0.06 % below (as of June 2019)
Description: Monitor the variance between actual and projected funded status of the PERF to determine if the 100% funded status projection is on track.
Annually, the Actuarial Office provides the actual funded status of the previous fiscal year and the projected funded status of the current fiscal year.
The inputs for this measure are influenced by five main factors: • Investment returns • Payment of unfunded liabilities (including additional discretionary payments) • Changes in actuarial methods and assumptions • Benefit changes • Actual experience
Annually, the Actuarial Office produces valuation reports for the State, Schools, and Public Agency employers to determine the employer contribution requirements and the funded status of each plan. Because the funded status changes slowly, it is important to monitor performance trends to indicate if long-term funding goals are on track. The funded status is based on a 7% projected investment return. Based on the valuations at June 30, 2018, the PERF is projected to reach 100% funded status by June 30, 2041.
Baseline: The June 30, 2018 projected funded status was 68.7%.
Target: To meet the annual projected funded status
Refresh Frequency: Annually, August
Reporting Range: 07/01/18-06/30/19
Thresholds: On-Target: Less than or equal to 1% above or below the projected funded status At-Risk: Greater than 1% or less than or equal to 3% above or below the projected
funded status Off-Target: Greater than 3% above or below the projected funded status
Third Quarter Report - Strategic Measures - 9 of 58
Status Narrative: The June 30, 2019 projected funded status was 70.7%. The June 30, 2019 actual funded status was 70.1%, which is less than the target by 0.06%, making this measure on-target. Performance Trend Chart:
Third Quarter Report - Strategic Measures - 10 of 58
2020-21 Strategic Measure Summary (Quarter 3)
Measure Title: 1-Year Total Expected Fund Volatility Executive Owner: Dan Bienvenue Strategic Goal: Fund Sustainability
Strategic Objective: Mitigate the risk of significant investment loss Associated Initiative: Investment risk management and performance attribution
Status: Pending Refresh (in September 2021) Numeric Status: 11.5% (for FY 2019-20)
Description: The total (gross) risk of the Total Fund (Fund) expressed in the standard deviation (1-year) of the Funds’ total return distribution, expressed in percent. Reported on a fiscal year-end basis, the metric will measure the expected volatility of the Total Fund returns. The current target was derived through the Capital Market Assumption (CMA) process used in the November 2017 Asset Liability Management (ALM) Cycle, to be effective 7/1/18. The ALM process occurs every four years.
Baseline: Current Barra volatility estimate for PERF is 7.6%, as of 6/30/18
Target: Current total expected fund volatility is 8% or less, as of 7/1/18.
Refresh Frequency: Annually, September
Reporting Range: 07/01/19 - 06/30/20
Thresholds: On-Target: Equal to or less than the target At-Risk: 1-50 basis points excess of target Off-Target: 51 basis points or more excess of target
Status Narrative: As of July 1, 2020, this measure was Off-Target compared to the target of 8%. Current forecast volatility of 11.5% vs. 7.7% in prior year
• 3.8% risk increase over prior year is indicative of the plan’s expected short-term return dispersion given the current market environment.
• Growth assets, especially public equities, remain the primary drivers of total volatility. • This measure was off target due in large part to concern surrounding impact of COVID-19 and changes
to the risk model to align its calibration with PERF long-term investment horizon. We are continuing review of investment capabilities to capitalize on strengths and reduce active risks that historically have not contributed positively to total fund outcome.
Third Quarter Report - Strategic Measures - 11 of 58
Performance Trend Chart:
8.37.6 7.7
11.5
-1
1
3
5
7
9
11
13
15
2016 2017 2018 2019
Current total fund volatility
1-Year Total Expected Fund Volatility
Baseline On-Target Off-Target Target Trendline
Third Quarter Report - Strategic Measures - 12 of 58
2020-21 Strategic Measure Summary (Quarter 3)
Measure Title: Annualized (5-Year) Excess Investment Returns Relative to Total Fund Policy Benchmark
Executive Owner: Dan Bienvenue Strategic Goal: Fund Sustainability
Strategic Objective: Deliver target risk-adjusted investment returns Associated Initiative(s): Enhance capital allocation framework; Enhance investment platform and controls;
Investment program long-term planning
Status: Pending Refresh (in September 2021) Numeric Status: Underperformed policy benchmark by 13 basis points (for FY 2019-20)
Description: Measures annualized 5-year excess investment returns relative to the Total Fund policy benchmark, which is a composite established by the Investment Committee-assigned asset class benchmarks and the target weights derived from the Asset Liability Management (ALM) process.
Reported on a fiscal year-end basis, the metric will measure the effectiveness of the Investment Office in meeting the objective of achieving investment performance relative to relevant targets. The actual performance generated by the portfolio is affected by both the active under- or over-weighting of the asset classes within their policy ranges, as well as the performance of the individual asset classes vs. their specified policy benchmark.
Baseline: The Total Fund policy benchmark will be recalculated on a rolling 5-year period.
Target: Meet or exceed the Total Fund policy benchmark.
Policy benchmark weights are fixed and do not vary except by Investment Committee action, such as the approval of interim target weights.
Refresh Frequency: Annually, September
Reporting Range: FY 2015-16 through FY 2019-20
Thresholds: On-Target: Exceed Total Fund Policy Benchmark At-Risk: Meet or Trail Total Fund Policy Benchmark by up to 10 basis points Off-Target: Trail Total Fund Policy Benchmark by 10 basis points or more
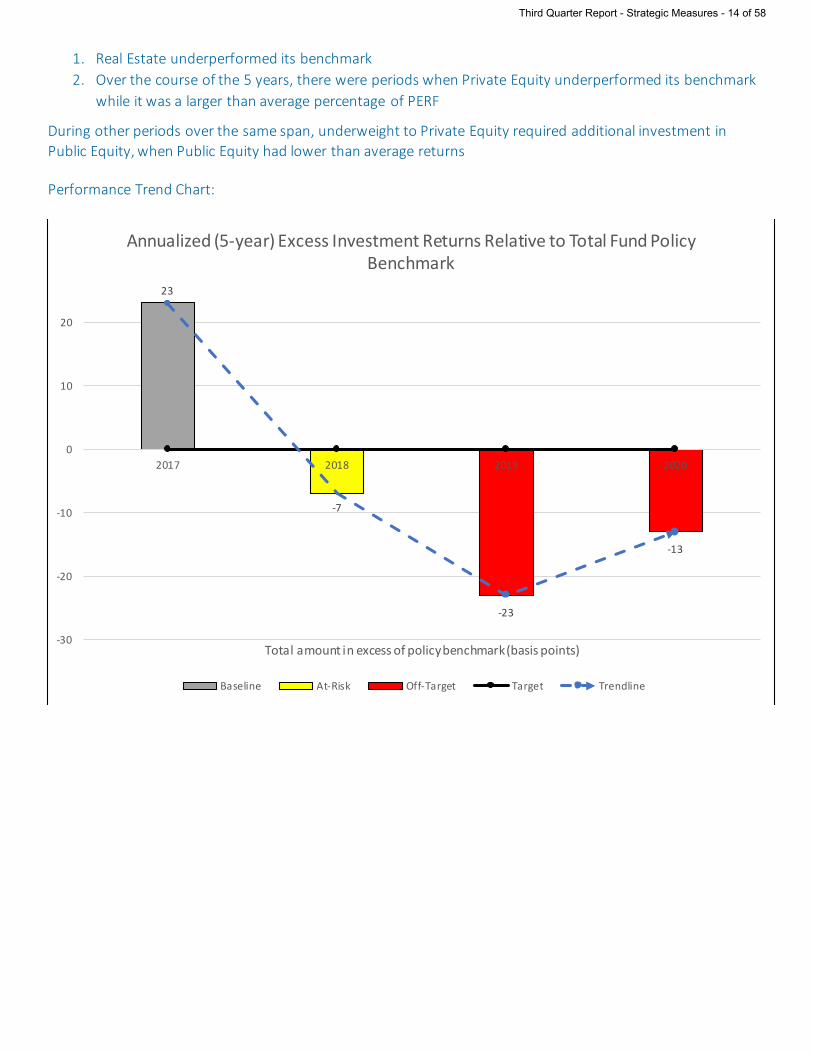
Status Narrative: As of June 2020, this measure was reported as Off-Target. The PERF generated a 5-year annualized Total Net Return of 6.3% and underperformed the policy benchmark by 13 basis points. This measure was Off-Target for three reasons:
Third Quarter Report - Strategic Measures - 13 of 58
1. Real Estate underperformed its benchmark 2. Over the course of the 5 years, there were periods when Private Equity underperformed its benchmark
while it was a larger than average percentage of PERF
During other periods over the same span, underweight to Private Equity required additional investment in Public Equity, when Public Equity had lower than average returns Performance Trend Chart:
23
-7
-23
-13
-30
-20
-10
0
10
20
2017 2018 2019 2020
Total amount in excess of policy benchmark (basis points)
Annualized (5-year) Excess Investment Returns Relative to Total Fund Policy Benchmark
Baseline At-Risk Off-Target Target Trendline
Third Quarter Report - Strategic Measures - 14 of 58
Strategic Objective: Educate employers, members, and stakeholders on system risks and mitigation strategies Associated Initiative(s): Stakeholder education on system risks & mitigation
Status: Pending Refresh (in June 2021) Numeric Status: 5.32 (as of March 2020)
Description: The measure scores the overall stakeholder perception of CalPERS' success in explaining and mitigating risks to the System. Data is gathered through the annual Stakeholder Perception Survey in response to the statement "I understand the risks inherent in the System and I am confident CalPERS is taking steps to reduce the risks." The target will be met through continued stakeholder engagement, proactive communications with our various member/employer/retiree populations, and through focused efforts to share our risks and risk mitigation strategies.
Baseline: 5.17 out of 7 possible points
Target: Five-year goal: achieve a score of 5.43 out of 7 points; a 5% increase from the baseline. Annual increases of 1% (0.05 points).
Refresh Frequency: Annually, June
Reporting Range: 04/2019 – 03/2020
Thresholds: On-Target: Annual increase of 0.05 or more points from the baseline figure each year At-Risk: Annual increase of 0.0 – 0.04 points from the baseline figure each year Off-Target: Decrease from the baseline figure
Status Narrative: This strategic measure was on target.
Third Quarter Report - Strategic Measures - 15 of 58
Performance Trend Chart:
5.17
5.17 5.22 5.27 5.32
5.015.27 5.32
1
2
3
4
5
6
7
2017 2018 2019 2020
Score out of 7 possible points
Stakeholder Assessment Survey - Risk
Baseline On-Target Off-Target Target Trendline
Third Quarter Report - Strategic Measures - 16 of 58
2020-21 Strategic Measure Summary (Quarter 3)
Measure Title: Investment Managers Policies and Procedures for ESG Factor Integration Executive Owner: Dan Bienvenue Strategic Goal: Fund Sustainability
Strategic Objective: Integrate environmental, social, and governance considerations into investment decision making
Associated Initiative(s): Investment beliefs and environmental, social, and governance risk integration
Status: Pending Refresh (in September 2021) Numeric Status: 96% (for FY 2019-20)
Description: CalPERS team members developed an annual survey of internal and external strategic managers on their policies and procedures related to ESG risk and opportunity considerations. This was established as a Strategic Priority in August 2016 as part of CalPERS’ Environmental Social and Governance (ESG) strategy. Asset classes are continuing to refine and evolve ESG integration efforts, including continued sharing of best practices internally and amongst external investment managers. This annual survey is to determine the percentage of internal and external strategic managers that have policies and procedures articulating how ESG risk and opportunity considerations are incorporated into investment processes and decisions.
Baseline: For FY 2016-17, the baseline for this measure was 96% with a target of 100% integration, as established by the INVO Sustainable Investments (SI) staff responsible for central monitoring, external communication, and establishment of measurement processes and reporting.
Target: 100% of internal and external investment managers have policies and procedures in place to integrate ESG factors into investment decisions.
Refresh Frequency: Annually, September
Reporting Range: 07/01/19 - 06/30/20
Thresholds: On-Target: 80% and above At-Risk: 50-79% Off-Target: Less than 50%
Status Narrative: The ESG integration score, measuring the percentage of internal and external managers with ESG policies in place, remains at or above 96% for 2019-20.
This conclusion was derived from a comprehensive review of ESG integration activities conducted by the Sustainable Investments team during the year (split into INVO/RSG Sustain and Executive Office/GBS teams in mid-2020).
Staff produced significant progress along three main dimensions contributing to ESG integration:
Third Quarter Report - Strategic Measures - 17 of 58
• Internal Sustainable Investing Guidelines (SIPGs) refresh • Total Fund-level GHG exposure estimation • Sourcing and implementation of ESG analytics across asset classes.
The “no lower than 96%” assessment is also supported by the outcome of the Total Fund review of sources of active risk conducted in 2019-20 which led to a significant reduction in the number of external strategies. Additionally, all internally managed strategies, whose relative allocation increased as a percentage of the Total Fund in 2019-20, are covered by ESG policies (SIPG). Performance Trend Chart:
96 96 96 96
65
70
75
80
85
90
95
100
2017 2018 2019 2020
% of ESG policies and procedures in place
Investment managers policies and procedures for ESG factor integration performance
Baseline On-Target Target Trendline
Third Quarter Report - Strategic Measures - 18 of 58
2020-21 Strategic Measure Summary (Quarter 3)
Measure Title: Chronic Disease Prevention and Management Executive Owner: Donald Moulds Strategic Goal: High-Quality Affordable Health Care
Strategic Objective: Ensure our members receive high-quality care Associated Initiative(s): Update health plan contract measures; Clinical quality improvement programs; Health
data quality management; Health equity Status: Pending Refresh (in July 2021) Numeric Status: N/A
Description: More than half of all Californians suffer from one or more chronic diseases and the rate continues to increase. Accompanying this increase are associated direct costs such as hospitalization, medical care and treatment supplies, and indirect costs, such as disability and lost time from work.
Diabetes, high-blood pressure, and obesity are the three highest prevalence chronic diseases among CalPERS health care members. This composite measure evaluates the quality of diabetes, hypertension, and obesity treatment and prevention reported by our CalPERS health plans. The measure utilizes the following three Healthcare Effectiveness Data and Information (HEDIS) measures reported by our health plans to create the composite result:
Status Narrative: As of July 2020, this is a new strategic measure and performance data and the performance trend chart will be available in July 2021.
Third Quarter Report - Strategic Measures - 19 of 58
2020-21 Strategic Measure Summary (Quarter 3)
Measure Title: Behavioral Health Quality Executive Owner: Donald Moulds Strategic Goal: High-Quality Affordable Health Care
Strategic Objective: Ensure our members receive high-quality care Associated Initiative(s): Behavioral health access and quality; Health Equity Status: Under Development Numeric Status: N/A
Description: Mental health disorders are among the most common health conditions Californians face as one in six California adults experiences a mental illness of some kind; one in 24 has a serious mental illness that makes it difficult to carry out major life activities; and one in 13 children has an emotional disturbance that limits participation in daily activities. In 2018, $349 million was spent on mental health disorders for Basic health plan members; the most common mental health condition was depression.
This composite measure evaluates the quality of behavioral health prevention and treatment delivered to CalPERS health care members. It utilizes the following three Healthcare Effectiveness Data and Information Set (HEDIS) measures reported by our health plans to create a composite result:
Depression management
Mental health acute care follow-up
Substance use treatment and engagement
Baseline: To be determined.
Target: 75%
Refresh Frequency: Annually, July
Reporting Range: Not applicable at this time.
Thresholds: To be determined. Status Narrative: As of July 2020, this is a new strategic measure and the data to develop the baseline and thresholds will be completed by June 2021. Performance data and the performance trend chart will be available in July 2021 when this measure is fully built out.
Third Quarter Report - Strategic Measures - 20 of 58
2020-21 Strategic Measure Summary (Quarter 3)
Measure Title: Measuring Access to Care Executive Owner: Donald Moulds Strategic Goal: High-Quality Affordable Health Care Strategic Objective: Ensure our members have access to care when and where they need it Associated Initiative(s): Telehealth access; Behavioral health access and quality; Health data quality Management; Health Equity
Status: Pending Refresh (in June 2021) Numeric Status: 86.4% (covering experience in 2019)
Description: Percentage of CalPERS health care members who answered “Usually” or “Always” to the Health Plan Member Survey (HPMS) question, “In the last 12 months, how often did you get an appointment for a check-up or routine care at a doctors’ office or clinic as soon as you needed?”
This measure provides the percentage of CalPERS health care members responding that they received routine care as soon as they needed it in the last 12 months. This metric represents the perception of CalPERS members’ access to care when needed. A higher percentage is considered good. Factors that can influence this measure include enforcement of contractual requirements and collaborative efforts with CalPERS health plan partners.
Measure trend: • 86.4% (covering experience in 2016) • 86.6% (covering experience in 2017) • 86.2% (covering experience in 2018) • 86.4% (covering experience in 2019)
Status Narrative: As of June 2020, this measure reported at 86.4% and was On-Target.
Third Quarter Report - Strategic Measures - 21 of 58
Performance Trend Chart:
86 86.4 86.6 86.2 86.4
65
70
75
80
85
90
95
100
2015 2016 2017 2018 2019
% of CalPERS members receiving routine care as needed
Measuring Access To Care
Baseline On-Target Target Trendline
Third Quarter Report - Strategic Measures - 22 of 58
2020-21 Strategic Measure Summary (Quarter 3)
Measure Title: Member Experience Executive Owner: Donald Moulds Strategic Goal: High-Quality Affordable Health Care
Strategic Objective: Ensure our members have access to care when and where they need it Associated Initiative(s): Telehealth access; Behavioral health access and quality; Update health plan contract
measures; Health Equity
Status: Pending Refresh (in June 2021) Numeric Status: N/A
Description: Percentage of CalPERS health care members who answered eight or higher on a zero to 10 scale, with 10 being the best health care possible, to the Health Plan Member Survey (HPMS) question, “Using any number from 0 to 10, where 0 is the worst health care possible and 10 is the best health care possible, what number would you use to rate all your health care in the last 12 months?”
This metric represents the percentage of CalPERS health care members who rated their health care as positive. A higher percentage is considered good. Factors that can influence this measure include enforcement of contractual requirements and collaborative efforts with CalPERS health plan partners.
Baseline: 80.3 % (covering experience in 2015)
Target: 85%
Refresh Frequency: Annually, June
Reporting Range: January 2019 – December 2019
Thresholds: On-Target: 82% or above
At-Risk: 80 – 81.9%
Off-Target: Below 80%
Status Narrative: As of July 2020, this strategic measure was previously the Rating of Health Care Key Performance Indicator (KPI). Targets and thresholds were newly created to align with the National Committee for Quality Assurance (NCQA) benchmarks.
Third Quarter Report - Strategic Measures - 23 of 58
2020-21 Strategic Measure Summary (Quarter 3)
Measure Title: Health Care Premium Affordability Executive Owner: Donald Moulds Strategic Goal: High-Quality Affordable Health Care
Strategic Objective: Ensure the care we provide is affordable Associated Initiative(s): Increase competition; Risk mitigation; Pharmaceutical strategies; Update health plan
contract measures; Health data quality management Status: Under Development Numeric Status: N/A
Description: This measure evaluates the year-over-year change in total premium costs for the CalPERS Health Benefits Program against a benchmark trend developed by an external consulting firm or firms.
Factors that can influence trends include member utilization, unit costs, new technologies, cost-shifting from public payers and leveraging of member cost sharing. Innovations and efficiencies such as promoting efficient hospital plan networks, value-based purchasing and integrated health models help mitigate medical trend increases.
The target and thresholds are updated on an annual basis and are dependent upon data reported by insurance companies as well as changing conditions in the health care market place.
Baseline: To be determined.
Target: To be determined.
Refresh Frequency: Annually, June
Reporting Range: Not applicable at this time.
Thresholds: To be determined. Status Narrative: As of July 2020, this is a new strategic measure and the data to develop the baseline, target and thresholds will be available by June 2021. Performance data and the performance trend chart will be available in June 2021 when this measure has been fully built out.
Third Quarter Report - Strategic Measures - 24 of 58
2020-21 Strategic Measure Summary (Quarter 3)
Measure Title: CEM Pension Complexity Score Executive Owner: Anthony Suine
Strategic Goal: Reduce Complexity Strategic Objective: Simplify Programs to improve service and/or reduce cost Associated Initiative(s): Complexity reduction
Status: Pending Refresh (in June 2021) Numeric Status: 59 (as of June 2020)
Description: The total Cost Effectiveness Measurement (CEM) complexity score represents the weighted average of CEM’s complexity measure by cause, from the annual CEM Pension Administration Benchmarking Survey.
Baseline: Weighted average complexity score 59.8 points (Fiscal Year 2016-17)
Target: Maintain weighted average complexity score between 58 – 62 points
Status Narrative: This strategic measure was on target as of June 2020.
Third Quarter Report - Strategic Measures - 25 of 58
Performance Trend Chart:
59.8 59.5 59
2017 2018 201920
30
40
50
60
70
80
Weighted average complexity score
CEM Pension Complexity Score
Baseline On-Target Target Trendline
Third Quarter Report - Strategic Measures - 26 of 58
2020-21 Strategic Measure Summary (Quarter 3)
Measure Title: CEM Information Technology Capability Score Executive Owner: Doug Hoffner Strategic Goal: Reduce Complexity
Strategic Objective: Simplify programs to improve service and/or reduce cost Associated Initiative(s): Mature targeted information technology capabilities
Status: Pending Refresh (in June 2021) Numeric Status: 87 (for FY 2018-19)
Description: This measures the overall contribution of the value IT provides to business capability. Drivers of this metric include website and contact center access to member data, as well as data accuracy and completeness.
Baseline: The baseline is the FY 2015-16 CEM IT Capability Score of 85 points.
Target: CalPERS target is to stay within the range of 80-90 points.
Refresh Frequency: Annually, June
Reporting Range: 07/01/18-06/30/19
Thresholds: On-Target: 80 points or above At-Risk: 75 to 79 points Off-Target: Less than 75 points
Status Narrative: The score for FY 2018-19 was 87. This score was above peer median of 79 and has remained reasonably consistent for the past four years.
Third Quarter Report - Strategic Measures - 27 of 58
Performance Trend Chart:
85
84
87
85
75
80
85
90
2016 2017 2018 2019
IT Capability Score
CEM Information Technology Capability Score
Baseline On-Target Target Trendline
Third Quarter Report - Strategic Measures - 28 of 58
2020-21 Strategic Measure Summary (Quarter 3)
Measure Title: CEM Cost Per Member Executive Owner: Michael Cohen Strategic Goal: Reduce Complexity
Strategic Objective: Streamline operations to gain efficiencies, improve productivity, and reduce costs Associated Initiative(s): Develop and implement continuous process improvement framework; Develop
Information Technology Service Level Agreements
Status: Pending Refresh (in June 2021) Numeric Status: $209 (for FY 2018-19)
Description: From the annual CEM Pension Administration Benchmarking Survey, reduce cost per member, exclusively to pension administration, and does not include health and investment.
Baseline: $207 cost per member for FY 2016-17
Target: Reduce by 2% annually
Refresh Frequency: Annually, June
Reporting Range: 07/01/18-6/30/19
Thresholds: On-Target: Reduced by 2.0% annually At-Risk: Reduced by 1.5-1.99% annually Off-Target: Reduced by less than 1.5% annually
Status Narrative: This measure continues to be off-target. While the cost-per-member declined $2.00 per member, from $211 in 2017-18 to $209 in 2018-19, it is higher than the target of $199. The 1.1% decrease is attributed to a slight increase in membership calculated over a mostly-steady expenditure level.
Third Quarter Report - Strategic Measures - 29 of 58
Performance Trend Chart:
207
211209
202.86
198.8
2017 2018 2019170
180
190
200
210
220
Cost per Member
CEM Cost Per Member
Baseline Off-Target Target Trendline
Third Quarter Report - Strategic Measures - 30 of 58
Strategic Objective: Streamline operations to gain efficiencies, improve productivity, and reduce costs Associated Initiative(s): Develop and implement continuous process improvement framework
Status: Pending Refresh (in September 2021) Numeric Status: $206.6 million (2.9 % over target as of June 2020)
Description: Overhead operational costs calculated for pension administration and health.
Baseline: The overhead operational costs for FY 2016-17 was $210,114,665.
Target: Reduce by 1.5% - 2% annually
Refresh Frequency: Annually, September
Reporting Range: 07/01/19-06/30/20
Thresholds: On-Target: Reduced by 1.5% - 2.0% annually At-Risk: Reduced by 1.0% - 1.49% annually Off-Target: Reduced by less than 1.0% annually
Status Narrative: This measure was Off-Target for fiscal year 2019-20. Overhead operational costs, as adjusted for statewide employee compensation increases, totaled $206.6 million. This is $5.8 million, or 2.9%, over the targeted range of $200.8 million to $197.8 million.
Third Quarter Report - Strategic Measures - 31 of 58
Performance Trend Chart:
$200.8
$197.8
$206.6
$195
$200
$205
$210
$215
FY 2016-17 FY 2017-18 FY 2018-19 FY 2019-20
Mill
ions
Overhead Operational Costs
1.5% Target
2.0% Target
Adjusted Actuals
Third Quarter Report - Strategic Measures - 32 of 58
2020-21 Strategic Measure Summary (Quarter 3)
Measure Title: 5-Year Net Value Added Executive Owner: Dan Bienvenue Strategic Goal: Reduce Complexity
Strategic Objective: Streamline operations to gain efficiencies, improve productivity, and reduce costs Associated Initiative(s): Enhance business effectiveness, resource allocation, and efficiency of investment
programs
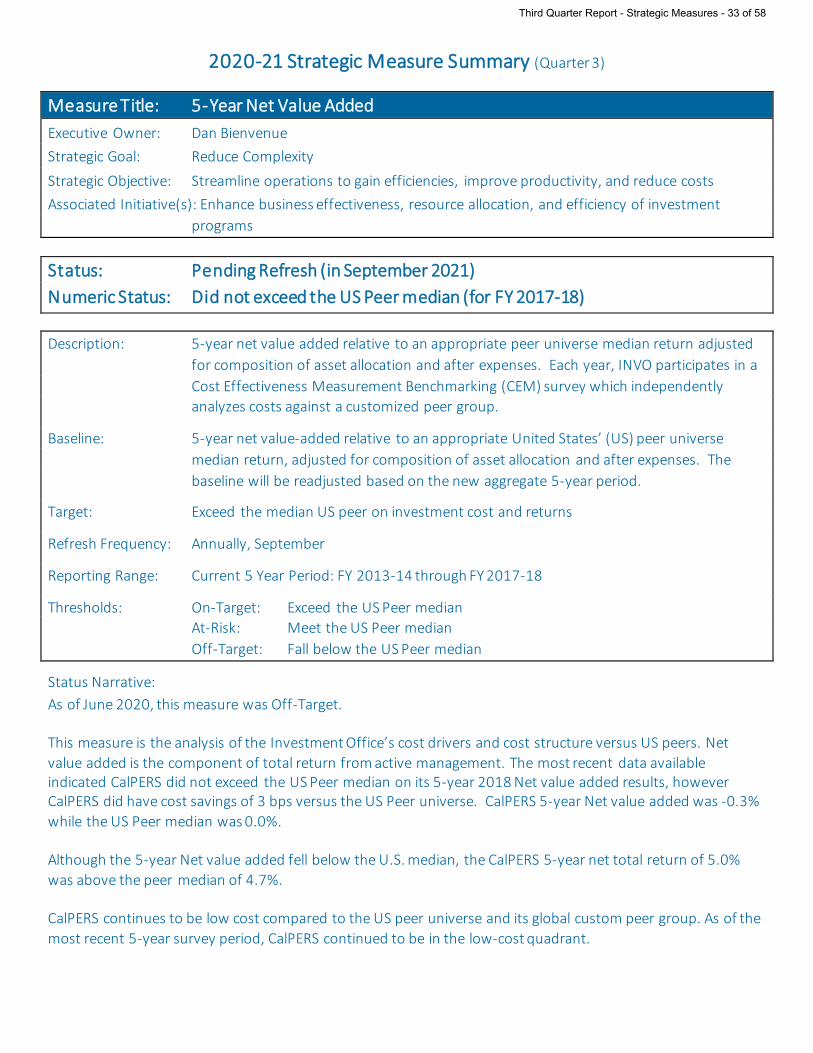
Status: Pending Refresh (in September 2021) Numeric Status: Did not exceed the US Peer median (for FY 2017-18)
Description: 5-year net value added relative to an appropriate peer universe median return adjusted for composition of asset allocation and after expenses. Each year, INVO participates in a Cost Effectiveness Measurement Benchmarking (CEM) survey which independently analyzes costs against a customized peer group.
Baseline: 5-year net value-added relative to an appropriate United States’ (US) peer universe median return, adjusted for composition of asset allocation and after expenses. The baseline will be readjusted based on the new aggregate 5-year period.
Target: Exceed the median US peer on investment cost and returns
Refresh Frequency: Annually, September
Reporting Range: Current 5 Year Period: FY 2013-14 through FY 2017-18
Thresholds: On-Target: Exceed the US Peer median At-Risk: Meet the US Peer median Off-Target: Fall below the US Peer median
Status Narrative: As of June 2020, this measure was Off-Target. This measure is the analysis of the Investment Office’s cost drivers and cost structure versus US peers. Net value added is the component of total return from active management. The most recent data available indicated CalPERS did not exceed the US Peer median on its 5-year 2018 Net value added results, however CalPERS did have cost savings of 3 bps versus the US Peer universe. CalPERS 5-year Net value added was -0.3% while the US Peer median was 0.0%. Although the 5-year Net value added fell below the U.S. median, the CalPERS 5-year net total return of 5.0% was above the peer median of 4.7%. CalPERS continues to be low cost compared to the US peer universe and its global custom peer group. As of the most recent 5-year survey period, CalPERS continued to be in the low-cost quadrant.
Third Quarter Report - Strategic Measures - 33 of 58
Performance Trend Chart:
Equal to TargetCalPERS 10 bps
-31 bps Wor seCalPERS -11 bps
+6 bps BetterCalPERS 16 bps
-30 bps Wor seCalPERS -30 bps
+5 bps BetterCalPERS 5 bps +4 bps Better
CalPERS 4 bps+4 bps Better
CalPERS 4 bps +3 bps BetterCalPERS 3 bps
-35 bps
-30 bps
-25 bps
-20 bps
-15 bps
-10 bps
-5 bps
0 bps
5 bps
10 bps
2015 2016 2017 2018
+Bet
ter/–
Wor
se R
elativ
e to T
arge
t (bp
s)CalPERS 5-Yr Net Value Added and Excess Cost/Savings
Better/Worse Relative to Target
CalPERS 5-Yr Net Value Added CalPERS 5-Yr Excess Cost/Savings
Targ Tar get 10 Tar get 20 bps Tar get 10
bps
Tar get 0 bps
Third Quarter Report - Strategic Measures - 34 of 58
Strategic Objective: Enhance compliance and risk functions throughout the enterprise Associated Initiative(s): Increase enterprise-wide compliance awareness
Status: Pending Refresh (in June 2021) Numeric Status: 5.34 (as of March 2020)
Description: The measure scores the overall stakeholder perception of CalPERS' success in implementing functions and programs that support compliance and risk. Data is gathered through the annual Stakeholder Perception Survey in response to the statement: "CalPERS has effective functions and programs to address compliance and risk." The target will be met through continued stakeholder engagement and the consistent demonstration of our commitment to a culture of compliance and risk as an organization and as a system.
Baseline: 5.16 out of 7 possible points
Target: Five-year goal: 5.43 out of 7 points; a 5% increase from the baseline. Annual increases of 1% (0.05 points)
Refresh Frequency: Annually, June
Reporting Range: 04/2019-03/2020
Thresholds: On-Target: Annual increase of 0.05 or more points from the baseline figure each year At-Risk: Annual increase of 0.0-0.04 points from the baseline figure each year Off-Target: Decrease from the baseline figure
Status Narrative: This strategic measure was on target.
Third Quarter Report - Strategic Measures - 35 of 58
Performance Trend Chart:
5.16
5.34 5.34
5.04
5.21
5.26 5.31
1
2
3
4
5
6
2017 2018 2019 2020
Score out of 7 possible points
Stakeholder Assessment Survey - Compliance & Risk
Baseline On-Target Off-Target Target Trendline
Third Quarter Report - Strategic Measures - 36 of 58
Description: Annual Employee survey example question: “I am aware of CalPERS risk program. I incorporate risk functions into my daily work.”
Each division has education and communication components intended to increase team member and leadership awareness and understanding of CalPERS’ expectations and their personal responsibilities under the risk functions on an annual basis. The metric is the percentage of CalPERS employees, including team members, managers, and executives, that respond “Yes” to the question: “I am aware of CalPERS risk program. I incorporate risk functions into my daily work.” on the annual employee survey.
Baseline: Based on the 2018 CalPERS Compliance & Risk Annual survey, 78% of respondents answered “Yes” to the question, “I am aware of CalPERS risk program. I incorporate risk functions into my daily work.”
Target: Incrementally increase the baseline by 2% annually (8% from 2019-2022), with a target of 86%.
Refresh Frequency: Annually, February
Reporting Range: FY 2020-21
Thresholds: On-Target: Annual increase of ≥2% At-Risk: Annual increase of 0.1% - 1.9% Off-Target: No annual increase
Status Narrative: As of February 2021, the Compliance & Risk Annual Employee survey reported out 94%, which exceeded the 2022 target of 86% for the fourth consecutive year. The survey reflected the efforts of the Enterprise Risk Management Division (ERMD) team to continue to educate CalPERS team members and stakeholders to cultivate a risk-intelligent organization through the implementation of the ERMD Communication Plan. ERMD has accomplished this by implementing the Operational Risk Event Reporting: Phase III which most notably included the Notice Something, Say Something campaign to promote first line of defense reporting across the enterprise.
Third Quarter Report - Strategic Measures - 37 of 58
ERMD continues to create awareness by communicating through CalPERS compliance and risk liaisons, training new employees at New Employee Orientation (NEO), and educating CalPERS team members through risk webinars to promote risk awareness in a remote work environment. Updated performance data will be available in February 2022. Performance Trend Chart:
78
89 89
94
86 86
70
75
80
85
90
95
100
2018 2019 2020 2021
% of "Yes" responses to " I am aware of CalPERS risk program..."
Risk Employee Awareness Survey
Baseline On-Target Target Trendline
Third Quarter Report - Strategic Measures - 38 of 58
Strategic Goal: Risk Management Strategic Objective: Enhance compliance and risk functions throughout the enterprise Associated Initiative(s): Supported by Core Workload
Status: Pending Refresh (in June 2021) Numeric Status: 4 (for FY 2019-20) Description: Risk program maturity model assessments are completed annually to assess risk
functions throughout the enterprise. Maturity scores are refined with a (+) or (-) to indicate intermediate levels of maturity.
Baseline: The baseline is a 3 on a point scale of 1 (low) to 5 (high) based on the 2017-18 Gartner Corporate Executive Board’s Maturity Survey results.
Target: CalPERS risk program maturity assessment scores are targeted to increase one point by 2021-22, from the baseline scores set in FY 2017-18.
Refresh Frequency: Annually, June
Reporting Range: FY 2019-20
Thresholds: On-Target: Year-over-year increase in score At-Risk: No change in score Off-Target: Year-over-year decrease in score
Status Narrative: Maturity scores are refined with a (+) or (-) to indicate intermediate levels of maturity. The Risk Program Maturity Assessment score increased from 3+ to 4 for FY 2019-2020. The refresh frequency for this measure was changed from January to June to align with the Compliance Program Maturity Assessment measure.
Third Quarter Report - Strategic Measures - 39 of 58
Performance Trend Chart:
3
3.33
4
0
0.5
1
1.5
2
2.5
3
3.5
4
4.5
2018 2019 2020
Maturity Assessment Score
Risk Program Maturity Assessment
Baseline On-Target Target Trendline
Third Quarter Report - Strategic Measures - 40 of 58
Strategic Objective: Enhance compliance and risk functions throughout the enterprise Associated Initiative(s): Increase enterprise-wide compliance awareness; Increase compliance program maturity
Status: On-Target Numeric Status: 94%
Description: Annual Employee survey example question: “I am aware of CalPERS’ compliance program. I incorporate compliance functions into my daily work.”
Baseline: Based on the 2018 CalPERS Compliance & Risk Annual survey, 87% of respondents answered “Yes” to the question, “I am aware of CalPERS’ compliance program. I incorporate compliance functions into my daily work.”
Target: Maintain 90% or greater positive response rate to the compliance survey question through June 2022.
Status Narrative: The positive response rate of the survey increased by 3% and remained above our targeted rate of 90% for the third consecutive year.
The survey results reflected the efforts of the Enterprise Compliance team to promote compliance awareness through our comprehensive communication and training plan. Major efforts contributing enterprise-wide awareness of CalPERS’ compliance program included regular training sessions for Form 700 and Personal Trading regulations, and Targeted Annual Compliance Training sessions for all team members.
Additionally, CalPERS compliance and risk liaisons continued to provide support and communications for compliance functions within the enterprise’s largest branches. Enterprise Compliance will use the results of the survey to build the FY 2021-22 Communications and Training Plan. Updated performance data will be available in February 2022.
Performance Trend Chart:
Third Quarter Report - Strategic Measures - 41 of 58
87
93 91
2018 2019 202080
82
84
86
88
90
92
94
96
98
100
% of "Yes" responses to "I am aware of CalPERS' compliance program"
Compliance Employee Awareness Survey
Baseline On-Target Target Trendline
Third Quarter Report - Strategic Measures - 42 of 58
Strategic Objective: Enhance compliance and risk functions throughout the enterprise Associated Initiative(s): Increase enterprise-wide compliance awareness; Increase compliance program maturity
Status: Pending Refresh (in June 2021) Numeric Status: 3.27 (for FY 2019-20)
Description: Assesses the compliance and ethics program’s functional performance against a structured framework. Measured on a scale ranging from 1 (low) to 5 (high), maturity is an organization’s performance relative to Gartner’s best practice research.
Baseline: The Fiscal Year 2017-18 baseline for Enterprise Compliance (ECOM) is a 2.33 on a point scale of 1 (low) and 5 (high)
Target: CalPERS compliance maturity assessment score is targeted to increase one point by FY 2021-22, from the baseline scores set in FY 2017-18
Refresh Frequency: Annually, June
Reporting Range: July 1, 2019 to June 30, 2020
Thresholds: On-Target: Year-over-year increase in score. At-Risk: No change in score. Off-Target: Year-over-year decrease in score.
Status Narrative: The industry benchmark set by Gartner is 3.00. There were 228 other organizations who took the assessment during FY 2019-20. Enterprise Compliance’s score increased to 3.27. The program continues to engage in the right activities to mature the organization’s compliance program. This includes partnering with IT to build a policy repository for the enterprise, providing tools to program areas to monitor legislative changes that affect CalPERS, and continued enhancement of the Form 700 filing processes, including improving the outreach and timeliness of filings.
Third Quarter Report - Strategic Measures - 43 of 58
Performance Trend Chart:
2.33
3
3.27
3.33 3.33
2018 2019 20201
2
3
4
5
Maturity Assessment Score
Compliance Program Maturity Assessment
Baseline On-Target Target Trendline
Third Quarter Report - Strategic Measures - 44 of 58
2020-21 Strategic Measure Summary (Quarter 3)
Reported in Closed Session
Measure Title: Composite Security Health Score within Range Executive Owner: Matt Jacobs Strategic Goal: Risk Management Strategic Objective: Continue to evolve Cyber Security program Associated Initiative(s): Information security roadmap
Status: Information to be provided in closed session
Third Quarter Report - Strategic Measures - 45 of 58
Strategic Objective: Recruit and empower a broad range of talents to meet organization priorities Associated Initiative(s): Talent outreach activities
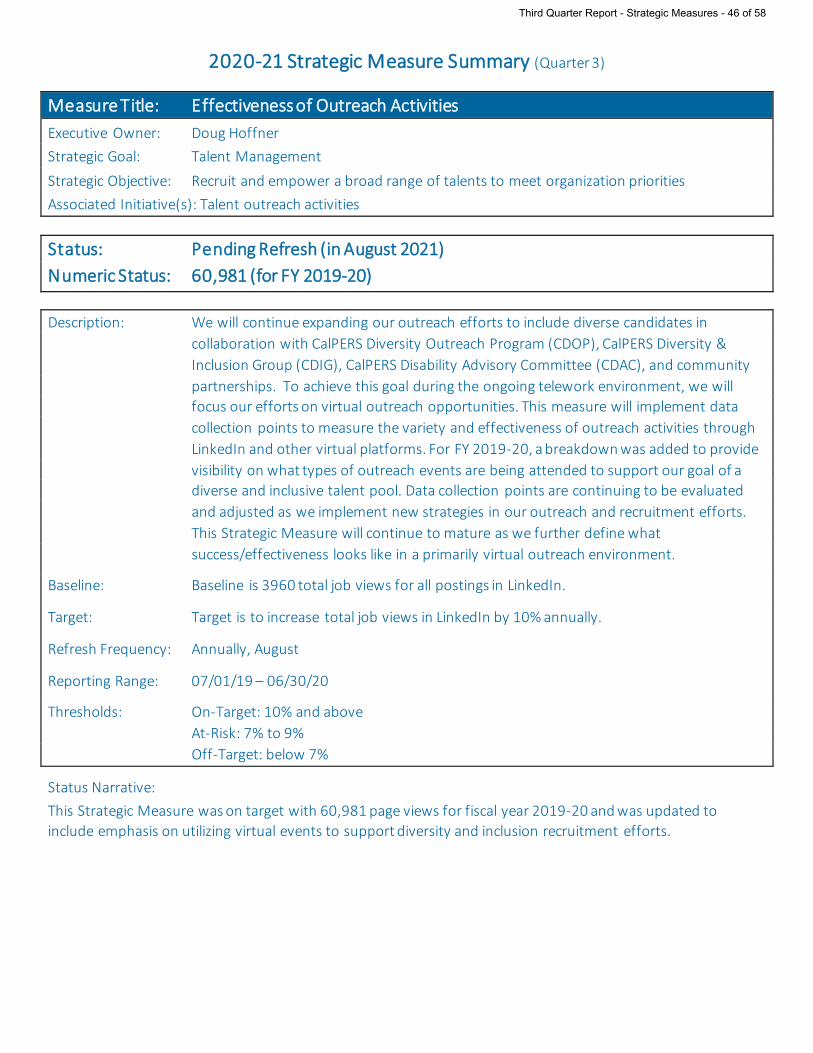
Status: Pending Refresh (in August 2021) Numeric Status: 60,981 (for FY 2019-20)
Description: We will continue expanding our outreach efforts to include diverse candidates in collaboration with CalPERS Diversity Outreach Program (CDOP), CalPERS Diversity & Inclusion Group (CDIG), CalPERS Disability Advisory Committee (CDAC), and community partnerships. To achieve this goal during the ongoing telework environment, we will focus our efforts on virtual outreach opportunities. This measure will implement data collection points to measure the variety and effectiveness of outreach activities through LinkedIn and other virtual platforms. For FY 2019-20, a breakdown was added to provide visibility on what types of outreach events are being attended to support our goal of a diverse and inclusive talent pool. Data collection points are continuing to be evaluated and adjusted as we implement new strategies in our outreach and recruitment efforts. This Strategic Measure will continue to mature as we further define what success/effectiveness looks like in a primarily virtual outreach environment.
Baseline: Baseline is 3960 total job views for all postings in LinkedIn.
Target: Target is to increase total job views in LinkedIn by 10% annually.
Refresh Frequency: Annually, August
Reporting Range: 07/01/19 – 06/30/20
Thresholds: On-Target: 10% and above At-Risk: 7% to 9% Off-Target: below 7%
Status Narrative: This Strategic Measure was on target with 60,981 page views for fiscal year 2019-20 and was updated to include emphasis on utilizing virtual events to support diversity and inclusion recruitment efforts.
Third Quarter Report - Strategic Measures - 46 of 58
Performance Trend Chart:
Third Quarter Report - Strategic Measures - 47 of 58
Strategic Objective: Recruit and empower a broad range of talents to meet organization priorities Associated Initiative(s): Expand diversity & inclusion program
Status: On-Target Numeric Status: 80.2% (as of December 2020)
Description: This measure focuses on our efforts to help foster a culture of inclusion that welcomes diversity of thought, experience, and background. We have learned that diversity within an inclusive working environment enhances the relevance of our work, increases productivity, and improves the value of services we provide. The annual Employee Engagement Survey has several specific questions aimed at gauging the success of our diversity and inclusion (D&I) efforts.
CalPERS is committed to ensuring accessibility to all of our team members. The Employee Engagement vendor used from 2017-2019, McLean & Company, did not meet the CalPERS Web Content Accessibility Guidelines (WCAG) and they had no immediate plans to make the content accessible.
Our new survey vendor, Perceptyx, meets these guidelines, offers advanced technology and innovative tools such as a dashboard with survey results and action planning framework. With this transition, the baseline results reported to the Board will change. Perceptyx uses a 5-point rating scale whereas the previous vendor used a 6-point rating scale which means the results for the survey will not be directly compared with previous years’ results. The 5-point scale has the benefits of making it easier for survey participants to respond more quickly, enhances the comparability of scores with peers, and utilizes industry best practices to differentiate employee sentiment. To help mitigate the impact of not having a direct comparison of years, we have included the trend chart results from the previous survey and created a new trend chart tracking the new survey results in the summary sheet. We have also updated the title of the Strategic Measure/KPI to match the category within the survey for ease of reference.
A survey score above 59% represents a high-performing organization.
Third Quarter Report - Strategic Measures - 48 of 58
Thresholds: On-Target: Above 59% represents high performance At-Risk: 40-59% represents average performance Off-Target: Under 40% represents low performance
Status Narrative: We have achieved year over year improvement measured by favorable responses from team members to D&I statements in CalPERS Employee Engagement Survey with a score of 80.2%.
Strategic Objective: Recruit and empower a broad range of talents to meet organization priorities Associated Initiative(s): Implement engagement survey action items
Status: On-Target Numeric Status: 84% (as of December 2020)
Description: This measure focuses on our annual employee engagement survey which supports our efforts to foster a culture of engagement at CalPERS. The questions in the survey correspond to engagement and retention drivers, such as manager relationships, learning and development, culture, and organization potential.
CalPERS is committed to ensuring accessibility to all of our team members. The Employee Engagement vendor used from 2017-2019, McLean & Company, did not meet the CalPERS Web Content Accessibility Guidelines (WCAG) and they had no immediate plans to make the content accessible.
Our new survey vendor, Perceptyx, meets these guidelines, offers advanced technology and innovative tools such as a dashboard with survey results and action planning framework. With this transition, the baseline results reported to the Board will change. Perceptyx uses a 5-point rating scale whereas the previous vendor used a 6-point rating scale which means the results for the survey will not be directly compared with previous years’ results. The 5-point scale has the benefits of making it easier for survey participants to respond more quickly, enhances the comparability of scores with peers, and utilizes industry best practices to differentiate employee sentiment. To help mitigate the impact of not having a direct comparison of years, we have included the trend chart results from the previous survey and created a new trend chart tracking the new survey results in the summary sheet. We have also updated the title of the Strategic Measure to match the category within the survey for ease of reference.
Baseline: Performance Management: 84% as of December 2020.
Target: High performing status of > 59%
Refresh Frequency: Annually, December
Reporting Range: November 2019 - October 2020
Thresholds: On-Target: Above 59% represents high performance At-Risk: 40-59% represents average performance Off-Target: Under 40% represents low performance
Third Quarter Report - Strategic Measures - 51 of 58
Status Narrative: With the transition to the new engagement survey vendor, Perceptyx, the goal for this BPI has been met with a survey score of 84%. Updated data from the next survey will be available December 2021.
Performance Trend Chart:
Third Quarter Report - Strategic Measures - 52 of 58
Third Quarter Report - Strategic Measures - 53 of 58
2020-21 Strategic Measure Summary (Quarter 3)
Measure Title: Engagement Survey Results & Action Items – Clarity of Direction Executive Owner: Doug Hoffner Strategic Goal: Talent Management
Strategic Objective: Recruit and empower a broad range of talents to meet organization priorities Associated Initiative(s): Implement engagement survey action items
Status: On-Target Numeric Status: 90.2% (as of December 2020)
Description: This measure focuses on our annual employee engagement survey which supports our efforts to foster a culture of engagement at CalPERS. The questions in the survey correspond to engagement and retention drivers, such as manager relationships, learning and development, culture, and organization potential.
CalPERS is committed to ensuring accessibility to all of our team members. The Employee Engagement vendor used from 2017-2019, McLean & Company, did not meet the CalPERS Web Content Accessibility Guidelines (WCAG) and they had no immediate plans to make the content accessible.
Our new survey vendor, Perceptyx, meets these guidelines, offers advanced technology and innovative tools such as a dashboard with survey results and action planning framework. With this transition, the baseline results reported to the Board will change. Perceptyx uses a 5-point rating scale whereas the previous vendor used a 6-point rating scale which means the results for the survey will not be directly compared with previous years’ results. The 5-point scale has the benefits of making it easier for survey participants to respond more quickly, enhances the comparability of scores with peers, and utilizes industry best practices to differentiate employee sentiment. To help mitigate the impact of not having a direct comparison of years, we have included the trend chart results from the previous survey and created a new trend chart tracking the new survey results in the summary sheet. We have also updated the title of the Strategic Measure to match the category within the survey for ease of reference.
Baseline: Clarity of Direction: 90.2% as of December 2020
Target: High performing status of > 59%
Refresh Frequency: Annually, December
Reporting Range: November 2019 - October 2020
Thresholds: On-Target: Above 59% represents high performance At-Risk: 40-59% represents average performance Off-Target: Under 40% represents low performance
Third Quarter Report - Strategic Measures - 54 of 58
Status Narrative: As of January 2021, this measure reported at 90.2 % and is On-Target. Updated data will follow results from the next Engagement Survey in December 2021
Performance Trend Chart:
Third Quarter Report - Strategic Measures - 55 of 58
Status Narrative: Currently, we measure leadership competency proficiency for those leaders who participate in an incentive program. CalPERS team members are working on an approach to measure proficiency in leadership competencies for all other leaders. Once the new HRSD Chief role is filled, the new chief will review, evaluate, and make recommendations on next steps.
New HRSD Chief hired as of 3/2/2020.
Project team participated in two demos of a proposed tool using existing software.
In July of 2020, the new HRSD Division Chief was briefed on the proposed tools. Potential next steps are being discussed and evaluated with leaders in Talent Engagement & Development (TED) and the Performance Management Unit (PMU).
In June of 2020, the leadership competency assessment tool utilizing GoLearn was piloted with volunteer Staff Services Manager Is and their managers in the Human Resources Division. The assessment process is intended to quantitatively capture leaders’ proficiency in CalPERS leadership competencies, develop leaders around a common set of expectations, and identify trends that can help inform training and development strategies. After the completion of the pilot, feedback was collected to improve the tool and process before further piloting across the enterprise. Next steps include executing deliverables in the 2020-21 Business Plan.
Third Quarter Report - Strategic Measures - 57 of 58
Measures under development
On-Target At-Risk Off-Target
* Pending refresh
** Data not available
- Status as of 3/31/2021 - Quarter 3
Strategic Objectives
Business Plan Initiatives
Strategic Measuresand Targets Le
gend
Fund the System through an
integrated view of pension assets and liabilities
Ensure our members receive high-quality
care
Chronic disease prevention & management
Behavioral health quality Overhead operational
cost
Risk employee awareness survey
5 - year net value added
Risk program maturity assessment
Engagement survey results & action
items - performance management
Mitigate the risk of significant
investment loss
Ensure our members have access to care when and
where they need it
Simplify programs to improve service
and/or reduce cost
Enhance compliance and risk functions
throughout the enterprise
Recruit and empower a broad range of talents to meet
organization priorities
1 - year total expected fund volatility
Deliver target risk-adjusted
investment returns
Ensure the care we provide is affordable
Streamline operations to gain efficiencies,
improve productivity, and reduce costs
Continue to evolve cyber security
program
Implement 2018-22 workforce
plan strategies
Implement engagement survey action items
Increase compliance program maturity
Expand diversity & inclusion program
Increase enterprise-wide compliance
awareness
Cultivate leadership competencies and
develop succession plans across the
enterprise
Total fund investment decision-making
processes (Process)
Annualized (5-year) excess investment
returns relative to total fund policy benchmark
Continuous process improvement
Alignment of asset liability management
Measuring access to care
Member experience
Educate employers, members, and
stakeholders on system risks and mitigation
strategies
Stakeholder assessment survey -
risk
Total fund portfolio design
(Portfolio)
Stakeholder assessment survey - compliance and risk
Effectiveness ofoutreach activities
Integrate environmental, social, and governance
(ESG) considerations into investment decision
making
Investment managers policies and procedures
for ESG factor integration
Health care premium affordabillity
Cost effectiveness measurement
cost per member
Total fund portfolio design
(Portfolio)
Composite security health score within
range(Closed Session)
Proficiency in CalPERS leadership
competencies
Total fund investment strategy
(Performance)
Health data quality management
Clinical quality improvement
programs
Update health plan contract measures
Behavioral health access & quality
Engagement survey results & action items -
diversity & inclusion
Information security strategy
(Closed Session)
Enterprise data management
Cost effectiveness measurement
information technology capability score
Stakeholder education on system risks &
mitigation
Cost effectiveness measurement
pension complexity score
Funded status
Projected funded status
Complexity reduction
Mature targeted information technology
capabilities
Compliance employee awareness survey
Compliance program maturity assessment
Engagement survey results & action items -
clarity of direction
Develop leadership competencies
measurement tool
Total fund portfolio resources (People)
Telehealth access
Increase competition
Risk mitigation
Pharmaceutical strategies
Health equity
2020
-21
Busi
ness
Pla
n In
itiat
ives
Stra
tegi
c M
easu
res
Stra
tegi
c O
bjec
tives
Strategic Goals
TALENT MANAGEMENTPromote a high-performing
and diverse workforce
RISK MANAGEMENTCultivate a risk-intelligent
organization
REDUCE COMPLEXITYReduce complexity across
the enterprise
HIGH-QUALITY AFFORDABLE HEALTH CARE
Improve health care quality, access & affordability
FUND SUSTAINABILITYStrengthen the long-term sustainability
of the pension fund
*
*
*
*
**
*
*
*
**
* *
*
*
**
*
*
Last updated 04.14.2021
VISION: A respected partner, providing a sustainable retirement system and health care program for those who serve CaliforniaMISSION: Deliver retirement and health care benefits to members and their beneficiariesCORE VALUES: Quality, Respect, Accountability, Integrity, Openness, Balance
2017-22 Strategic Plan Alignment Map (FY 2020-21)
Third Quarter Report - Strategic Measures - 58 of 58