+ All Categories
Home > Documents > Eprints Cover Sheet - QUTeprints.qut.edu.au/6356/1/6356.pdf · virtue of greater experience with...

Eprints Cover Sheet - QUTeprints.qut.edu.au/6356/1/6356.pdf · virtue of greater experience with...

Date post: 23-Apr-2018
Category:
Upload: nguyennguyet
View: 222 times
Download: 4 times
Share this document with a friend
31
COVER SHEET This is the author-version of article published as: Pike, Steven D (2004) The use of repertory grid analysis and importance-performance analysis to identify potential determinant university attributes. . Journal of Marketing for Higher Education 14(2):pp. 1-18. Accessed from http://eprints.qut.edu.au Copyright 2004 Haworth Press
Transcript

COVER SHEET

This is the author-version of article published as:

Pike, Steven D (2004) The use of repertory grid analysis and importance-performance analysis to identify potential determinant university attributes. . Journal of Marketing for Higher Education 14(2):pp. 1-18.

Accessed from http://eprints.qut.edu.au Copyright 2004 Haworth Press

1

The use of Repertory Grid Analysis and Importance-Performance

Analysis to Identify Determinant Attributes of Universities

Pike, S. (2004). The use of repertory grid analysis and importance- performance analysis to identify potential determinant university attributes. Journal of Marketing for Higher Education. 14(2): 1-18.

Dr Steven Pike

Acknowledgement

The author acknowledges Deirdre Fagan-Pagliano of Central Queensland

University for administrative support during this project.

2

The use of Repertory Grid Analysis and Importance-Performance

Analysis to Identify Determinant Attributes of Universities

ABSTRACT

In the increasingly competitive Australian tertiary education market, a

consumer orientation is essential. This is particularly so for small regional

campuses that compete with larger universities in the state capitals. Campus

management need to carefully monitor both the perceptions of prospective

students within the catchment area, and the (dis)satisfaction levels of current

students. This study reports the results of an exploratory investigation into the

perceptions held of a small regional campus, using two techniques that have

arguably been underutilized in the education marketing literature. Repertory

Grid Analysis, a technique developed fifty years ago, was used to identify

attributes deemed salient to year 12 high school students at the time they

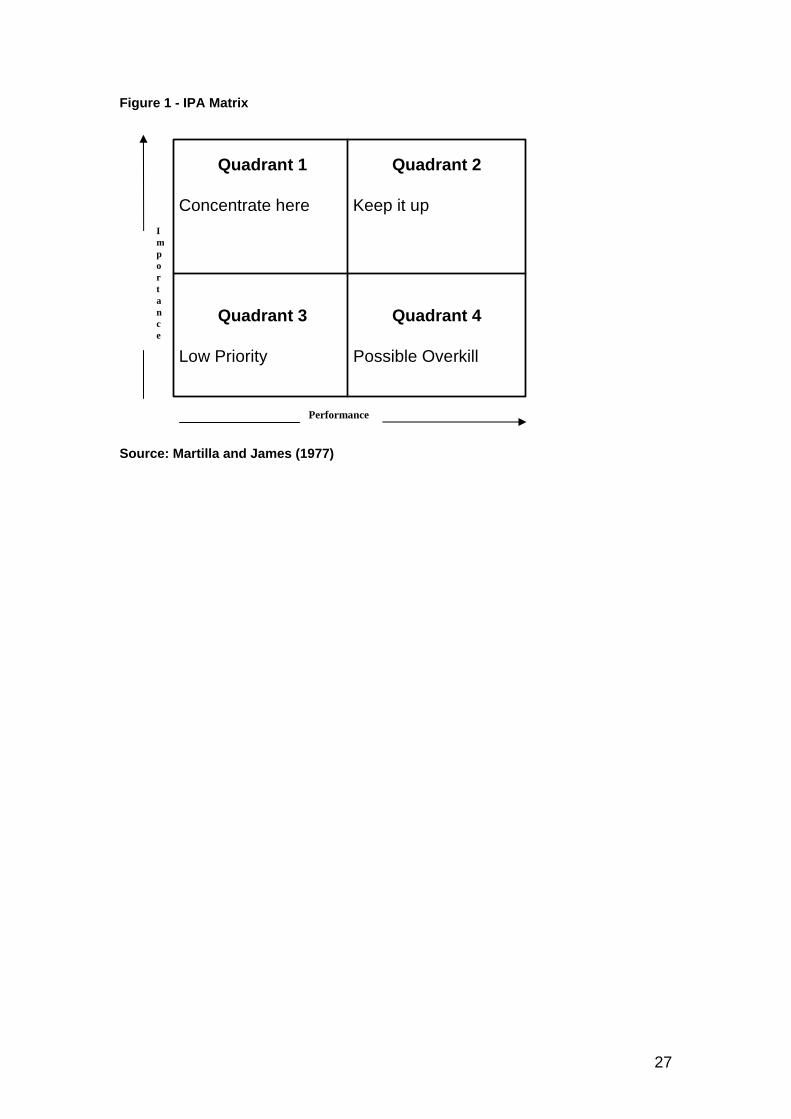
were applying for university places. Importance-performance analysis (IPA),

developed three decades ago, was then used to identify attributes that were

determinant for a new cohort of first year undergraduate students. The paper

concludes that group applications of Repertory Grid offer education market

researchers a useful technique for identifying attributes used by high school

students to differentiate universities; and that IPA is a useful technique for

guiding promotional decision making. In this case the two techniques provided

a quick, economical and effective snapshot of market perceptions, which can

be used as a foundation for the development of an ongoing market research

program. Practical steps for such a program are summarized.

3

Key words

Perceptions of universities. Repertory Grid. Importance-performance

analysis. Determinant attributes.

4

The Australian tertiary education system is increasingly viewed as a

competitive market (James, 2001). In particular, small regional campuses face

many challenges in competing with the broader range of learning and social

opportunities available at larger universities in the state capital cities. Tertiary

students, like any other consumer decision makers, are presented with a

diverse range of offerings in the education product purchase process. Clearly,

a market orientation is as much a necessity for university management as it is

for other consumer products. A marketing orientation is a philosophy that

recognizes the achievement of organizational goals requires an understanding

of the needs and wants of the target market, and then delivering satisfaction

more effectively than rivals (Kotler, Adam, Brown & Armstrong, 2003). This

concept is relevant to the Australian tertiary sector:

What is needed is for all universities to conduct an honest analysis of

their strengths and the populations they wish to serve, and use this to

define a genuinely distinctive mission, rather than the bland pieties now

found in most mission statements which are indistinguishable from

each other. Their competitiveness would then be focused on getting

through to those prospective students who have been defined as the

target market, and convincing them that this is the type of university

they should attend (Baldwin & James, 2000, p. 147).

Two quite different research approaches are required to effectively monitor

this process. Firstly, it is important to analyze perceptions held of the

university, from the perspective of the needs of prospective students in the

target community (see for example Lawley and Blight, 1997). This audience

5

will include those who will choose the university and those who won’t.

Therefore the goal will be to identify the attributes used to differentiate

available tertiary institutions, and then to identify both positively and negatively

held perceptions of the university. It is important to recognize this involves

individuals who may or may not have any direct experience of the university.

In this regard, Baldwin and James (2000) found Australian students must

make some decisions about considerations that they have little or no

knowledge about. Secondly, it is important to track the (dis)satisfaction levels

of existing students over time (see for example McInnis & James, 1999). By

virtue of greater experience with the university, this group will likely hold

stronger opinions about more detailed aspects of university life, than those

who do not have the benefit of such experience. Therefore, in structured

attitudinal surveys, the attributes used will vary between a perceptions study

of prospective ‘customers’ and a satisfaction study of existing students. In the

consumer behavior literature, the purchase process has been described as

progressing through the stages of awareness, information gathering, desire

and action (AIDA). This study is concerned with the issue of gaining a better

understanding of perceptions held by high school students at the time they are

considering their tertiary options.

An enhanced understanding was sought, by a small regional campus of one

Queensland university, of how prospective year 12 high school students

differentiate universities. Since universities are multi-attributed entities, of

particular interest was identifying ‘determinant’ attributes. While a number of

attributes will be important, the smaller subset of determinant attributes are

those are most closely related to purchase preference, and thus determine

6

product choice (Myers & Alpert, 1968). In a heterogeneous market place,

these will likely vary between segments. Witness any of the seasonal

education and career expos and note the crowded tables of available options

and techniques used to attract student attention. Note too the crowded nature

of the many education supplements in the media, and consider the challenge

of reaching the various target groups with the appropriate message(s). To do

so requires universities to develop a clear position for their products in the

market place. Effective positioning can be a source of competitive advantage

(Porter, 1980). There are essentially seven ways to position a university,

following Aaker and Shansby (1982) and Wind (1980):

• By attributes of the university such as courses and facilities

• By attributes of the geographic location such as climate and proximity

to recreation facilities

• By benefits, such as opportunities for socializing and enhanced career

prospects

• By price, value and/or quality, such as lower course fees, course

materials or distinguished faculty members

• By segmentation

• Against another class of university. For example, a smaller campus

might offer smaller class sizes and more personal interaction with

lecturers.

• Any combination of the above.

7

Promotional messages to prospective students must succinctly communicate

the benefits of an often diverse portfolio of products, to an ever expanding

range of market segments, in increasingly competitive markets. Once the

range of determinant attributes is known, a decision on which to focus on in

communications must be made. This means making trade-offs: "You can't

stand for something if you chase after everything" (Ries, 1992, p. 7). Success

is most likely when the range of differentiated features emphasized is small

(Aaker & Shansby, 1982). Ries and Trout (1986) emphasized the need for

marketers to think in terms of ‘differentness’ rather than ‘betterness’.

The university product is essentially an intangible service, where perceptions

play an important role in the decision process. While initiatives such as open

days enable prospective students to gain a pre-taste of a campus, prior to

actually participating in university life, it will be perceptions used in decisions.

Since expectations of a university product can only be realized after

consumption, perceptions play an important role in the decision process.

Unfortunately for the marketer, perceptions may only have a tenuous and

indirect relationship to fact (Reynolds, 1965). However, whether an

individual’s perceptions are correct is not as important as what the consumer

actually believes to be true (Hunt, 1975). In other words, ‘perception is reality’.

Baldwin and James (2000, p. 147) suggested most Australian applicants’

perceptions of university reputations are based on “very flimsy hearsay

evidence”.

This study represents one stage in the development of an ongoing

perceptions and satisfaction monitoring program by a relatively small regional

8

campus. Impetus for the project was an estimate that only around 20 per cent

of school leavers in the catchment area, who enrolled in tertiary courses, did

so at the regional campus. The paper reports the findings of initial steps taken

to identify the range of attributes used to differentiate Australian universities,

and how the campus is perceived by one segment. The target group was local

year 12 high school students, at the time they were considering their

university options. The regional campus of interest is the only university facility

in the district. Other tertiary providers include a polytechnic, distance

education, regional campuses of other universities at neighboring cities, as

well as larger universities in the state capital, which is a four hour drive away.

METHOD – Stage 1

Since no previous valid set of determinant university attributes had been

developed in this region, the first research stage required a qualitative method

of engaging with potential students. Repertory Grid was selected as an

established qualitative method, suitable for market research (Frost & Braine

1967), but which appears to have been under-utilized in the education

marketing literature. Repertory Grid is underpinned by the conceptual

foundations in Kelly’s (1955) Personal Construct Theory (PCT), and offers the

operational advantage of being a structured qualitative method with economy

of data for analysis (Stewart & Stewart, 1981). The technique was considered

ideal for an investigation of how year 12 students, in decision mode,

differentiate available universities.

In Kelly’s field of clinical psychology, Repertory Grid was designed for use in

applications to a single individual. However, due to the technique’s flexibility in

9

application and analysis (Frost & Braine, 1967), Repertory Gird is also

suitable for generating group data by pooling individual responses (Bannister

& Fransella, 1971). Within a standardized framework, participants have

freedom to respond, which enables a comparison between participants in the

group (Smith & Leach, 1972). Also, of interest to this project were suggestions

about the potential of the technique for administering in a group setting (Kelly

1955, Levy & Duggan 1956), although relatively few studies have reported this

application. With most group studies, interviews have still generally been

conducted on an individual basis. However, the technique has also been

applied to groups of around eight people (see Honey 1979, Stewart & Stewart

1981).

Initially developed by Kelly (1955) for use in clinical psychology, Repertory

Grid has been applied in many other fields, including such diverse topics as

managerial effectiveness (Stewart and Stewart 1981), perceptions of God

(Preston & Viney, 1986), retail store attributes (Mitchell & Kiral, 1999) and an

investigation of how people differentiate holiday destinations (Pike, 2003). In

market research applications, the technique has been shown to identify

attributes of importance to the consumer, which the researcher may not have

thought of (Ryan, 1991), with descriptions of products provided in the

consumer's language (Stewart & Stewart, 1981). Frost & Braine (1967) even

suggested that the method had been as important to market research as the

development of the questionnaire.

While there is no rule regarding the appropriate sample size in qualitative

studies (Patton, 1990), it is important that sampling is undertaken to achieve a

10

redundancy of data. Applications of Repertory Grid have consistently

demonstrated that a large sample is not required to reach a point of data

redundancy, where no significant new data is elicited from any additional

participants (Downs 1976, Frost & Braine 1967, Young 1995, Pike 2003).

Frost and Braine suggested that due to a commonality of responses, no new

constructs are elicited after 20-40 interviews, except those that are

idiosyncratic. In November 2002 an invitation was extended to year 12

students, at one major local high school, who had applied for admission to a

tertiary institution in 2003. These students had recently lodged their

Queensland Tertiary Admissions Centre (QTAC) applications for 2003

university courses. Following a meeting with the school principal to explain the

purpose of the project, approval also sought from Education Queensland and

then from students’ parents. A movie pass was offered to each participant as

a token of appreciation. Thirty participants were interviewed, in a trial of a

group format, of which 19 were female and 11 were male. The regional

campus was rated the first choice for study in 2003 by only 10 of the 30

students.

In PCT, Kelly defined a construct as “a way in which things are construed as

being alike and yet different from others” (Kelly, 1955, p. 105). For this

reason the triad card method has been the most common approach used to

elicit salient constructs (Fransella & Bannister, 1977). Elements are

presented to subjects in groups of three, using symbols such as verbal labels,

printed on individual cards. An element is the category of object that is the

focus of the study, which in this case were tertiary education institutions. Nine

institutions were selected by campus management, comprising the regional

11

campus and those considered to be the major competitors. Using all triad

combinations of 9 elements a total of 84 triads would be required, which was

considered impractical. Instead, Burton and Nerlove’s (1976) balanced

incomplete design formula was used to reduce number of triad combinations

to 24.

In a group setting all students were handed a self completing form containing

the 24 triad combinations, preceded by the question “When considering your

studies in 2003, for each group of three institutions, in what IMPORTANT way

are two of these alike and different to the third?” Students were encouraged to

supply more than one similarity/difference for each triad, with no repeated

statements permitted. Prior to commencement the procedure was described

and a practice example of cars was used to demonstrate the type of response

required.

The simplicity of responses elicited from subjects is an advantage of the

technique (Burton and Nerlove, 1976). Therefore the recording system

enables one researcher’s results to be quickly understood by others (Stewart

& Stewart 1981). Students averaged 17 minutes to complete an average of 15

out of 24 triads. A total of 309 statements were elicited. To analyze this data,

the list of statements was reduced to 102 themes of similar wording, using a

simple cut and paste method. Frequency and content analyses of these

themes was used to produce eight attribute labels. Of interest was the

commonality of label categories, rather than the extremes of idiosyncratic

individual constructs, of which there were a few, including ‘hot chicks’ for

example. Guba’s (1978) categorization criteria, which proposed that

12

categories should feature internal homogeneity and external heterogeneity,

was used. The eight attribute labels are:

• good location

• good reputation

• courses of interest

• modern campus facilities

• high standard of teaching

• social opportunities

• close to a beach

• large campus

Method - Stage 2

Understanding how well a university is perceived across a range of attributes

is not sufficient to guide positioning, if they are not evaluated in terms of

importance to the student. Satisfaction results from expectations about

important attributes and the perceived performance of those attributes (Myers

& Alpert, 1968). For this reason, Importance-Performance analysis (IPA) was

selected as a valid method. IPA was first reported in the marketing literature

by Martilla and James (1977), and has arguably been under-utilized in the

education marketing literature. The technique considers both the importance

of product attributes to the individual as well as the perceived product

performance on those attributes. IPA’s versatility has been demonstrated in a

range of applications, including for example: the evaluation of: breakfast food

13

brands (Sethna, 1982), therapeutic recreation services (Kennedy, 1986),

dental practices (Nitse & Bush, 1993) and holiday destinations (Pike & Ryan,

2003). In the education field, IPA has previously been reported in an

evaluation of business schools (Ford, Joseph & Joseph, 1999) and tertiary

students’ perceptions of service quality (Wright & O’Neill, 2002).

The IPA matrix, which is presented in Figure 1, represents the two dimensions

of attribute importance and performance in four quadrants. The Y-axis plots

respondents’ importance of the attributes, while the X-axis highlights the

perceived product performance on the same attributes. Quadrant 1 features

attributes rated most important, but where the product is not perceived to

perform strongly. This signals a need for remedial action to improve perceived

performance. Quadrant 2 features attributes rated important, and where the

product is perceived to perform strongly. It is these attributes that should be

reinforced in promotions. Quadrants 3 and 4 feature attributes rated less

important, and which should therefore have a lower priority in promotions.

(INSERT FIGURE 1 ABOUT HERE)

To investigate the potential determinance of the attributes, it was decided to

survey first year undergraduate students during the first week of their studies

at the campus, during March 2003. Students were firstly asked to rate the

importance of 20 university attributes when they were considering their 2003

course options. The eight attributes from the Repertory Grid were

supplemented with 12 further attributes, emanating from staff opinion and a

review of previous studies of university perceptions. A seven point scale was

14

used, anchored at ‘Not important’ (1) and ‘Very important’ (7). In a separate

section students were then asked to rate their perceptions of the campus’

performance across the same range of attributes, excluding ‘in this city’.

Again, a seven point scale was used. For both sets of scales a non-response

option (0) was provided for students who may have no opinion regarding any

individual attribute. This was considered a useful option for students who

might otherwise use the neutral scale mid-point.

Results

A total of 272 of the 349 first year undergraduate students participated, of

which 78 (29%) were male and 194 (71%) were female. This is representative

of the gender balance of the 2003 first year cohort. These students were

involved in 20 different degree programs across four faculties. The majority of

these students (82%) had enrolled while residents of the local post code area,

reinforcing the importance of this market. The campus was the first choice for

85% of participants.

The mean attribute importance and campus performance ratings are listed in

Table 1. The highest ranking attribute importance ratings are for ‘courses of

interest’, ‘opportunity to complete all of the degree at one campus’, ‘high

standard of teaching’, ‘good job prospects for graduates’ and ‘in this city’ .

Other than ‘in this city’ the highest perceived mean performance rating for the

campus is for ‘courses of interest’. No attribute performance means are

below the scale mid-point. Importantly, paired-sample t-tests indicate there

are no significant negative performance gaps for the campus. The grand

15

mean for campus performance (5.6) is higher than the grand mean for

attribute importance (5.0).

(INSERT TABLE 1 ABOUT HERE)

These attribute importance and campus performance means have been

applied to an IPA matrix, which is presented in Figure 2. It is important to note

that placement of the cross hairs is subjective, and in this case the grand

means for attribute importance and campus performance are used. The all

important Quadrant 2 features 12 attributes, which, while a positive result for

the campus, does not clearly identify a small subset of determinant attributes

that could be used in succinct promotional communications. The numbers

used to code each data point are the attribute importance ratings. For

example, the attribute ‘courses of interest’ is coded as number 1.

(INSERT FIGURE 2 ABOUT HERE)

To identify a smaller subset of determinant attributes, exploratory factor

analysis of the attribute importance items was undertaken, using principal

components analysis with a varimax rotation. The Kaiser-Meyer-Olkin (KMO)

measure of sampling adequacy is .81, which Kaiser would have regarded as

‘meritorious’ and suitable for factor analysis (George & Mallery 2000). An

examination of the correlations of coefficients revealed all attributes correlated

with others at the recommended .30 level (see Coakes & Steed 1999,

Tabachnick & Fidell, 1996). Also, the anti-image correlation matrix indicated

16

no variables were below the .50 measure of sampling adequacy (Coakes &

Steed, 1999). Communalities range from .71 to .22.

Factor analysis is a technique for exploring data (Pallant 2001, p.161), and

“the interpretation and the use you put it to is up to your judgement, rather

than any hard and fast statistical rules”. Therefore a number of other factor

analyses were trialled by removing attributes with low communalities. In

searching for a simple structure (see Kline, 1994), where factors have a few

high loadings, the cleanest rotated component matrix was generated from a

factor analysis using 17 attributes. Three attributes, ‘courses of interest’,

‘flexible course options’ and ‘opportunity to complete all of the degree on one

campus’, were not included due to lower correlations with other attributes. The

combined alpha for the remaining 17 items is .80. A four-factor solution was

generated, which explains 59 per cent of total variance. As shown in Table 2

the four factors are labeled ‘Campus quality’, ‘Fun stuff’, ‘Located in this city’

and ‘Financial survival’. Communalities range from .76 to .46.

(INSERT TABLE 2 ABOUT HERE)

The factor means, presented in Table 3, were then applied to an IPA matrix.

This factor analytic IPA is presented in Figure 3, where it can be seen that two

factors are plotted in Quadrant 2. The first is Factor 3 – In this city, which

features three attributes: ‘in this city’, ‘close to family/friends’ and good

location’. The second is Factor 1 – Campus quality, which features eight

attributes: ‘high standard of teaching’, ‘good campus atmosphere’,

‘safe/secure environment’, ‘modern campus facilities’, ‘good computer

17

facilities’, ‘good student support’, ‘good job prospects for graduates’ and ‘good

reputation’. These two factors are therefore considered determinant for the

sample in general. The implication is that it is these attributes should be used

in communications to the local market, since they represent sources of value.

The remaining two factors, located in quadrant 3 are not considered

determinant for the sample in general, but represent important considerations

for smaller segments within the sample.

(INSERT TABLE 3 ABOUT HERE)

(INSERT FIGURE 3 ABOUT HERE)

DISCUSSION

The market competitiveness of Australian universities is an emerging field of

study. However, the complexity of positioning multi-attributed universities in

heterogeneous, dynamic and increasingly competitive markets is also a

challenge faced globally by institutions of all sizes and locations. The paper

reports the results of the first formal investigation of perceptions held by one

target segment, about a regional university campus that competes with larger

universities in the nearby state capital. It had been suggested increasing

numbers of local high school students were attracted to the course offerings at

the larger universities. An enhanced understanding of the reasons for this is

required through investigations of the perceptions held towards the campus by

those who made the decision to attend the campus as well as those who

choose not too. This paper has been interested in the former group. A

combination of qualitative and quantitative techniques was used to identify a

18

range of attributes deemed salient to year 12 high school students when

considering their 2003 tertiary education options, and then to identify a smaller

subset of attributes that were determinant in the decision process for a group

of first year under graduate students.

The results indicate that, for the sample in general, the important

considerations are that the campus offers courses they are interested in, has

an appropriate standard of teaching and facilities, and is based in their home

town. This provides students with the opportunity for tertiary study while

remaining close to family and friends. The implication of this is that on the

understanding that a proportion of current year 12 high school students will

seek similar benefits; a succinct and focused promotional message can be

used to reinforce these positive perceptions. Conceptually, the study

demonstrates the value of combining Repertory Grid and Importance-

Performance Analysis in studies of student perceptions. Both have been

under-utilized in the education marketing literature.

A comparison of the literature, practitioner opinion and Repertory Grid findings

indicated differences between supply-side and demand-side perceptions of

attribute salience. While discussion of the differences between the three

outputs is beyond the scope of this paper, it is important to note the Repertory

Grid results generated four attributes that were not a strong feature of either

the literature or the academic opinion: ‘modern campus facilities’ ‘social

opportunities’, ‘large campus, and ‘close to the beach’. It was felt that the

elicitation of these attributes confirmed the value of seeking consumer input.

For example, while the mean for only one of these attributes rated above the

19

scale mid-point, significant numbers of students rated the items as being

important, that is rating 5,6 or 7 on the importance scale: ‘modern campus

facilities’ (70%), ‘social activities’ (28% of students), ‘large campus’ (12%),

and ‘close to a beach’ (10%). It is also significant that the means for only four

attributes rated below the scale midpoint: ‘social activities’, ‘availability of

accommodation nearby’, ‘large campus’ and ‘close to a beach’.

In individual applications of Repertory Grid, additional probing may be used at

the time the response is elicited. The use of a group application significantly

reduced the amount of time that would have been involved in interviewing 30

students individually using the triad card method. However, a weakness of the

group approach to Repertory Grid in this application was the inability during

data analysis to obtain explanations of statements that appeared vague. While

these were few in number and did not affect the data analysis, this problem

could be overcome in future by using a group discussion at the conclusion.

This would in effect be a form of structured focus group, with the discussion

focusing on key and/or ambiguous themes identified from a scan of responses

on individual forms. Given the short time used by students to complete the

form, such a discussion would probably not be too onerous. Also, since the

sample was enlisted from only one high school, the results may not be

representative of the entire local year 12 student market. However, the

redundancy of new data should be considered. For example there were no

new themes provided after 17 students’ forms were analyzed, except those

that were idiosyncratic.

20

While the results help aid understanding of perceptions of new customers, two

further weaknesses of the approach used are acknowledged. Firstly, the

results do not fully identify the market position of the campus, since this

requires a frame of reference with the competition. A position is a product’s

perceived performance, relative to competitors, on specific attributes

(Lovelock, 1991). Additional research is required in this regard, such as

asking prospective students to rate the campus, along with other universities

they will probably consider, across the range of attributes developed. This of

course assumes that student’s decision sets of probable universities is limited

in number. Secondly, the IPA data relates only to those who chose to

undertake studies at the campus, and excludes the views of those first year

students in the catchment area who enrolled at other universities. This could

be addressed in future by surveying a representative sample of students at

the end of the QTAC application process.

Key results and recommendations were presented to campus management

and other interested staff during April 2003. As previously indicated, the

results represented the first data relating to the perceptions held by first year

undergraduate students for the campus. From a practical perspective it is felt

the combination of techniques used proved both economical and effective in

terms of data analysis and the presentation of results to campus staff. In

particular the IPA matrix proved readily communicable, not only to

management in terms of supporting recommendations relating to future

promotional messages and research requirements, but also to other

interested staff members such as allied staff involved in campus promotions.

The data can also be used as a benchmark in future satisfaction surveys. This

21

could be undertaken longitudinally by surveying the same students over time,

to monitor whether experience with the campus changes any perceptions,

either positively or negatively. A practical example of this utility was reported

by Guadangalo (1985) who used IPA to evaluate perceptions relating to

running event over three consecutive years. Recommendations from the first

year’s study were implemented, and then tracked for improved performance in

the following year.

Education marketers should consider the efficient, economical and effective

manner in which Repertory Grid and IPA were in this case able to provide a

snapshot of market perceptions, which can be used as a foundation for the

development of an ongoing market research program. It is suggested this

approach could be adapted using with a minimal budget by individual schools

or faculties without a full time marketing department. In doing so the following

steps are recommended to track the positioning process, incorporating both

the identification of market perceptions and monitoring actual delivery of the

positioning promise:

1. Clearly identify the market segment(s) of interest.

2. Identify the competitive set of universities available to the target

segment(s).

3. Use group applications of Repertory Grid as structured focus groups to

identify important differentiating attributes.

4. Use staff opinion and existing student opinion to identify attributes

deemed important by those with actual experience of the university

system.

22

5. Use IPA questionnaires, i) for market perceptions of the competitive set

of universities to identify positioning gap opportunities, and ii) a campus

only version for samples of existing students.

6. Stay in touch with the target market and existing students. The initial

data can be used as a benchmark for future tracking studies; i) in the

target market to identify the effectiveness of communications used to

reinforce positively held perceptions or attempts to correct negative

perceptions, and ii) longitudinal investigations of cohort perceptions as

they progress through their period of study.

23

REFERENCES Aaker, D.A., & Shansby, J.G. (1982). Positioning your product. Business

Horizons. May/June: 56-62.

Bannister, D., & Fransella, F. (1971). Inquiring Man: The Theory of Personal

Constructs. Harmondsworth, Middlesex: Penguin.

Baldwin, G., & James, R. (2000). The market in Australian higher education

and the concept of student as informed consumer. Journal of Higher

Education Policy and Management. 22(2): 139-148.

Burton, M. L., & Nerlove, S. B. (1976). Balanced Designs for Triads Tests:

Two Examples from English. Social Science Research. 5: 247-267.

Coakes, S. J., & Steed, L. G. (1999). SPSS: Analysis without anguish –

versions 7.0, 7.5,8.0 for Windows. Milton, Queensland: Jacaranda

Wiley.

Downs, R. M. (1976). Personal constructions of personal construct theory.

In Moore, G. T., and Golledge, R. G. (Eds). Environmental Knowing:

Theories, Research, and Methods. Stroudsburg, Pennsylvania:

Dowden, Hutchison & Ross.

Ford, J. B., Joseph, M., & Joseph, B. (1999). Importance-performance

analysis as a strategic marketing tool for service marketers: the case

of service quality perceptions of business students in New Zealand

and the USA. The Journal of Services Marketing. 13(2): 171-186.

Fransella, F., & Bannister, D. (1977). A Manual for Repertory Grid

Technique. London: Academic Press.

Frost, W. A. K., & Braine, R. L. (1967). The application of the repertory grid

technique to problems in market research. Commentary. 9(3):161-175.

George, D. & Mallery, P. (2000). SPSS For Windows Step By Step. Needham

Heights, Massachusetts: Allyn and Bacon.

Guadagnolo, F. (1985). The importance-performance analysis: an

evaluation and marketing tool. Journal of Park and Recreation

Administration. 3(2): 13-22.

Guba, E. G. (1978). Toward a Methodology of Naturalistic Inquiry in Education

Evaluation. Los Angeles: UCLA Center for the Study of Evaluation.

Honey, P. (1979). The repertory grid inaction – how to use it to conduct an

attitude survey. Industrial and Commercial Training. 11: 452-459.

24

Hunt, J. D. (1975). Image as a factor in tourism development. Journal of

Travel research. Winter: 1-7.

James, R. (2001). Understanding prospective student decision making in

higher education and the implications for marketing strategies.

Marketing Education Conference. Sydney. October.

Kelly, G. A. (1955). The Psychology of Personal Constructs. New York:

Norton.

Kennedy, D. W. (1986). Importance-performance analysis in marketing and

evaluating therapeutic recreation services. Therapeutic Recreation

Journal. 20(3): 30-36.

Kline, P. (1994). An Easy Guide to Factor Analysis. London: Routledge.

Kotler, P., Adam, S., Brown, L., & Armstrong, G. (2003). Principles of

Marketing. (2nd Ed). Pearson Education Australia.

Lawley, M., & Blight, D. (1997). International students: reasons for choice of

an overseas study destination. 11th Annual Australian International

Education Conference. Melbourne. September.

Levy, L. H., & Dugan, R. D. (1956). A factorial study of personal constructs.

Journal of Consulting Psychology. 20(1): 53-57.

Lovelock, C.H. (1991). Services Marketing. Englewood Cliffs, NJ: Prentice-

Hall.

Martilla, J. A., & James, J. C. (1977). Importance-performance analysis.

Journal of Marketing. January: 77-79.

McInnis, C., & James, R. (1999). Transition from secondary to tertiary: a

performance study. Higher Education Series. Department of Training

and Youth Affairs Higher Education Division. Report 36. August.

Mitchell, V.W., & Kiral, H.R. (1999). Risk positioning of UK grocery multiple

retailers. The International Review of Retail, Distribution and Consumer

Research. 9(1): 17-39.

Myers, J. H. & M. I. Alpert (1968). Determinant buying attitudes: meaning

and measurement. Journal of Marketing 32(October): 13-20.

Nitse, P. S., & Bush, R. P. (1993). An examination of retail dental practices

versus private dental practices using an importance-performance

analysis. Health Marketing Quarterly. 11(1/2): 207-221.

Pallant, J. (2001). SPSS Survival Manual. Crows Nest, NSW: Allen & Unwin.

25

Pike, S. (2003). The use of Repertory Grid Analysis to Elicit Salient Short-

Break Holiday Destination Attributes in New Zealand. Journal of Travel

Research. 41(3): 315-319.

Pike, S., and Ryan, C. (2003). Dimensions of short break destination

attractiveness – a comparison of cognitive, affective and conative

perceptions. The Council for Australian University Tourism and

Hospitality Education (CAUTHE) Annual Conference. Coffs Harbour:

Southern Cross University. February.

Porter, M.E. (1980). Competitive Strategy. New York: The Free Press.

Preston, C. A., & Viney, L. L. (1986). Construing God: an exploration of the

Relationships between Reported Interaction with God and Emotional

Experience. Journal of Psychology and Theology. 14(4): 319-329.

Reynolds, W. H. (1965). The role of the consumer in image building.

California Management Review. Spring: 69-76.

Ries, A. (1992). The discipline of the narrow focus. Journal of Business

Strategy. Nov/Dec: 3-9.

Ries, A., & Trout, J. (1986). Positioning: The Battle for your Mind. New York:

McGraw-Hill.

Ryan, C. (1991). Recreational Tourism: A Social Science Perspective.

London: Routledge.

Sethna, B. N. (1982). Extensions and testing of importance-performance

analysis. Business Economics. September: 28-31.

Smith, S., & Leach, C. (1972). A hierarchical measure of cognitive complexity.

British Journal of Psychology. 63(4): 561-568.

Stewart, V., & Stewart, A. (1981). Business Applications of Repertory Grid.

Berkshire: McGraw-Hill.

Tabachnick, B.G., & Fidell, L.S. (1996). Using Multivariate Statistics. New

York: HarpurCollins.

Wind, Y. (1980). New twists for some old tricks. The Wharton Magazine.

Spring: 34-39.

Wright, C., & O’Neill, M. (2002). Service quality evaluation in the higher

education sector: an empirical investigation of students’ perceptions.

Higher Education Research & Development. 21(1): 2002.

Young, M. (1995). Evaluative constructions of domestic tourism places.

26

Australian Geographical Studies. 33(2): 272-286.

27

Figure 1 - IPA Matrix

Quadrant 1 Quadrant 2

Concentrate here Keep it up

Quadrant 3 Quadrant 4

Low Priority Possible Overkill

Importance

Performance

Source: Martilla and James (1977)

28

Table 1 – Attribute Importance and Performance Ratings Attribute importance Rank Mean Std n Campus

Perf. Rank

Mean Std n

Courses of interest 1 6.3 1.1 269 2 6.1 1.2 256 Complete all degree on one campus 2 6.2 1.6 255 5 6.0 1.6 250 High standard of teaching 3 6.0 1.2 262 3 6.0 1.1 246 Good job prospects for graduates 4 6.0 1.4 263 9 5.8 1.3 240 In this city 5 6.0 1.8 261 1 7.0 Close to family/friends 6 5.9 1.8 258 4 6.0 1.6 240 Good location 7 5.7 1.7 263 13 5.6 1.5 254 Good student support services 8 5.5 1.5 265 10 5.8 1.2 243 Good campus atmosphere 9 5.5 1.5 263 7 5.9 1.1 249 Good computer facilities 10 5.4 1.5 266 8 5.8 1.6 248 Modern campus facilities 11 5.4 1.4 265 6 5.9 1.2 254 Safe/secure environment 12 5.3 1.6 263 12 5.7 1.3 241 Good reputation 13 5.2 1.6 257 11 5.7 1.3 246 Flexible course options 14 5.0 1.7 257 14 5.4 1.5 238 Lower course fees 15 4.5 2.0 255 16 5.0 1.5 224 Part time work available 16 4.1 2.2 247 15 5.0 1.8 211 Social activities 17 3.5 1.8 259 18 4.7 1.6 234 Accommodation nearby 18 3.1 2.2 238 17 4.8 1.7 198 Large campus 19 2.7 1.7 245 20 4.0 1.6 240 Close to a beach 20 2.2 1.8 244 19 4.2 2.1 226 Grand mean 5.0 5.6 Figure 2 - Campus IPA

Importance

1198

10

36

4

1312

21

5

20

19

18

17

16

15

14

7

2

3

4

5

6

7

3 4 5 6 7Performance

29

Table 2 – Exploratory Factor Analysis Factor Alpha Factor

Loadings Eigenvalue Variance Comm.

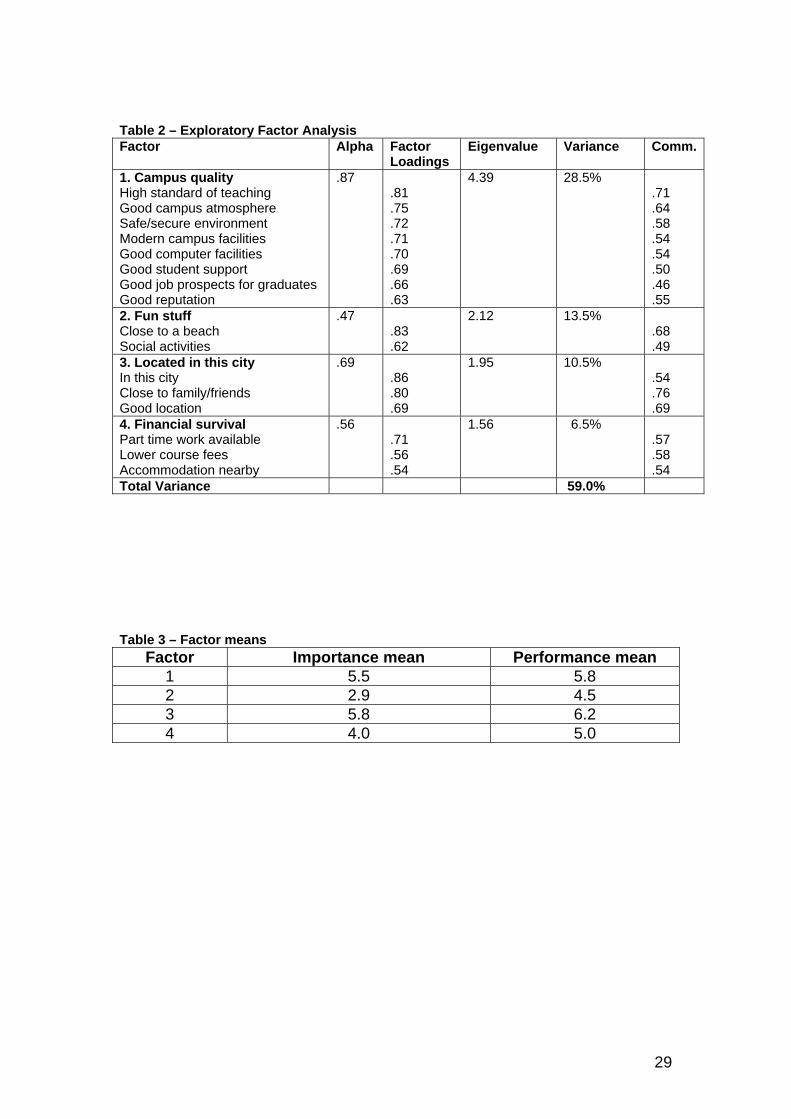
1. Campus quality High standard of teaching Good campus atmosphere Safe/secure environment Modern campus facilities Good computer facilities Good student support Good job prospects for graduates Good reputation

.87 .81 .75 .72 .71 .70 .69 .66 .63

4.39 28.5% .71 .64 .58 .54 .54 .50 .46 .55

2. Fun stuff Close to a beach Social activities

.47 .83 .62

2.12 13.5% .68 .49

3. Located in this city In this city Close to family/friends Good location

.69 .86 .80 .69

1.95 10.5% .54 .76 .69

4. Financial survival Part time work available Lower course fees Accommodation nearby

.56 .71 .56 .54

1.56 6.5% .57 .58 .54

Total Variance 59.0%

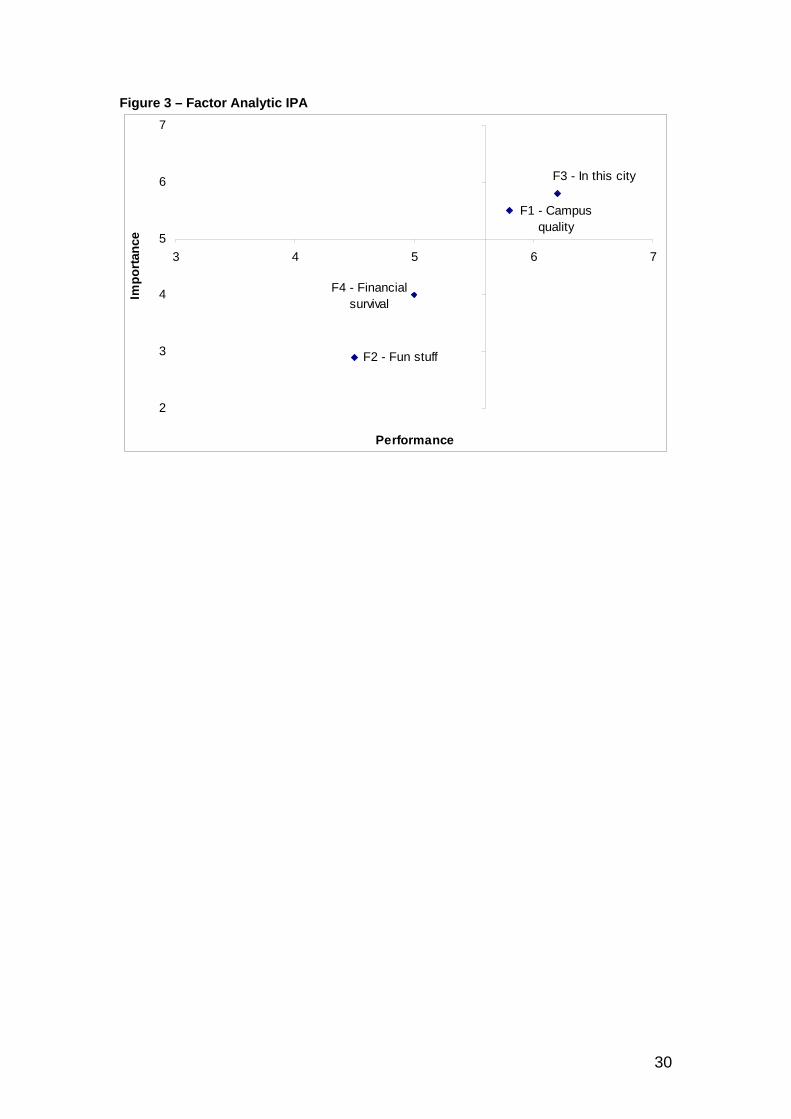
Table 3 – Factor means

Factor Importance mean Performance mean 1 5.5 5.8 2 2.9 4.5 3 5.8 6.2 4 4.0 5.0

30

Figure 3 – Factor Analytic IPA

F2 - Fun stuff

F4 - Financial survival

F1 - Campus quality

F3 - In this city

2

3

4

5

6

7

3 4 5 6 7

Performance

Impo

rtanc

e


Recommended