INTERNATIONAL ISSN 2231- 0940 Wind Energy Overview In India And The Way Forward Wind Energy Forecasting - Technology and Value Map of Wind Turbine Manufacturers in INDIA Wind Energy Special Suppliment - March 2011
Transcript
EQINTERNATIONAL
ISSN 2231- 0940
Wind Energy Overview In India And The Way Forward
Wind Energy Forecasting - Technology and Value
Map of Wind Turbine Manufacturers in INDIA
Wind Energy Special Suppliment - March 2011
ww
w.E
QM
ag
Liv
e.c
om
Wind blows in favour of the industry
Very true! With the worldwide capacity addition in 2010 is estimated to be 38.610 GW, the total installed wind capacity has touched 194.4 GW scale. In 2009, the installed capacity was 158.7 GW, as per the GWEC. Considering the statistics, there is 22% jump in capacity addition.
Fastest moving economy, China reported the maximum 16.5 GW of the capacity addition in the year 2010, according to GWEC report. Wind was also the fastest-growing source of power supplies in China. The 43 TWh of wind generation recorded in 2010 was 73.4% higher than in 2009.
US reported to have secured second position in capacity addition. It has added capacity of 5.5 GW in 2010, which is 50% of the wind capacity addition undertaken in 2009. US had added 10 GW capacity in 2009. The reason for this downfall is being considered slowdown in US market. Alike US, European countries also reported slow growth. The capacity addition in Europe was dropped by 7.5%.
Securing a place among top ten countries, which have added capacity substantially, in 2010, India added 2.1 GW. Following the suite other developing countries like Brazil and Mexico added 326 MW& 316 MW respectively. Around 213 MW were installed in North Africa (Egypt, Morocco and Tunisia).
Unquestionably, the wind industry is growing worldwide with rapid pace. But if we compare capacity addition in 2009 with 2010, disappointment is there. In 2009, the worldwide capacity addition, as per the GWEC was 38,610 MW, while that of in 2010 was reported to be 35,805 MW.
While US and European countries reported nose-dive, China reported robust installations in 2010 affirming the belief that wind is blowing in favour of the industry.
We are happy to announce our new website www.EQMagLive.com, which disseminates information about latest developments in power and energy sector worldwide.
With these updates, we leave you with the wind special suppliment, which discusses technology, policy, REC mechanism, wind market et al.
Happy reading…………….
EDITORIAL
Wind Energy Overview In India And The Way Forward
Amol Kotwal, Deputy Director, Energy & Power Systems, South Asia & Middle East, Frost & Sullivan ............................................................................6
REC Mechanism – Driving Growth Of Wind Energy
Satish Kashyap, Co-Founder & Director, General Carbon ...........................................................................................10
Practical Performance Monitoring for Asset Optimization
Dr Peter Clive, Technical Development Consultant, SgurrEnergy Ltd ........................................................................12
Wind Energy Forecasting - Technology and Value
Michael C Brower, Principal & Chief Technology Officer John Zack, Principal John Manobianco, Director of Research .....................14
Designing large diameter, closely coupled 2-row tapered roller bearings for supporting wind turbine rotor loading
The Timken Company, Douglas Lucas, Thierry Pontius .......................................................................................... 20
Acceleration Of Renewable Energy With Emphasis On Wind Energy Through Pro-Active National Policies In India
K.V.S.Subrahmanyam, General Manager (Power), MSPL Limited .............................................................................26
Editorial Contributions: Amol Kotwal, Satish Kashyap, Dr Peter Clive, Michael C Brower, John Zack, John Manobianco, Douglas Lucas, Thierry Pontius, K.V.S.Subrahmanyam, Ea Dyr-bye, Søren Stubkier
Disclaimer,Limitations of LiabilityWhile every efforts has been made to ensure the high quality and accuracy of EQ international and all our authors research articles with the greatest of care and attention ,we make no warranty concerning its content,and the magazine is provided on an>> as is <<basis.EQ international contains advertising and third –party contents.EQ International is not liable for any third- party content or error,omission or inaccuracy in any advertising material ,nor is it responsible for the availability of external web sites or their contents
The data and information presented in this magazine is provided for informational purpose only.neither EQ INTERNATINAL , Its affiliates,Information providers nor content providers shall have any liability for investment decisions based up on or the results obtained from the information provided. Nothing contained in this magazine should be construed as a recommendation to buy or sale any securities. The facts and opinions stated in this magazine do not constitute an offer on the part of EQ International for the sale or purchase of any securities, nor any such offer intended or implied
Restriction on use
The material in this magazine is protected by international copyright and trademark laws. You may not modify,copy,reproduce,republish,post,transmit,or distribute any part of the magazine in any way.you may only use material for your personall,Non-Commercial use, provided you keep intact all copyright and other proprietary notices.If you want to use material for any non-personel,non commercial purpose,you need written permission from EQ International.
Australia +61 3-85 61 56 00 Belgium +32 23 00 07 93 Brasil +55 11-41 86 95 00 Cesko +420 37 80 51 400 China +852 34 26 33 66 Danmark +45 58 10 35 56 Deutschland +49 911-65 59-0 España +34 9 36 33 58 90 France +33 1-30 86 80 00 India +91 222 76 28 600 Italia +39 06-9 11 42 41 Japan +81 68 95 13 96 Korea +82 32-3 46 28 30 Mexico +52 55-53 00 11 51 Nederland +31 55-5 29 52 95 Österreich +43 1-58 63 65 80 Polska +48 22-6 15 79 84 Russia +7 38 33 55 58 69 Schweiz +41 44-9 14 13 33 Slovensko +421 3 37 97 03 05 Suid-Afrika +27 12-3 45 60 60 Suomi +358 9-7 74 38 80 Sverige +46 8-59 4768 50 Türkiye +90 21 6-688 32 88 United Kingdom +44 19 92-58 46 77 USA +1 603-8 83 81 02 [email protected] www.semikron.com
33% more power, same volume
SKiiP®4th generation
Intelligent Power Module: IPM
3 in 1: Driver, semiconductor, cooling
400 kW – 1,8 MW
5 x higher thermal cycling capability
Sintered chips, for high operation temperature
www.EQMagLive.com4
Suzlon reports US$ 7.3 billion orderbook
Gamesa Receives GL Certification For Its G52-850 Kw 60hz Turbine
Vestas on track with a record-high order intake of 8,673 MW in 2010
GE’s new 2.75-103 Wind Turbine Commissioned in the Netherlands
Suzlon Group, the world’s third largest wind turbine supplier, reported its earnings recently for the quarter ended December 31, 2010.
Tulsi R. Tanti, Chairman and Managing Director – Suzlon Group, said: “I am pleased to report that our Group performance is steadily improving. Emerging, offshore and key matured markets are showing sustained momentum. Our strategy to focus on these markets is delivering for us, as evidenced by our steady inflow of major orders over the past few months in India, Brazil, Canada and Belgium. Our US$ 7.3 billion orderbook (~5,000 MW) is one
Gamesa, the world’s leading wind energy technology company, recently received a certificate from GL Renewables Certification (GL) for its G52-850 kW Class I 60 HZ wind turbine. The certification ceremony, held recently at Gamesa’s stand at the EWEA 2011 international trade fair in Brussels, featured Gamesa Chairman Jorge Calvet and GL Vice President Mike Woebbeking.
The year’s order intake of 8,673 MW had a value of EUR 8.6bn, corresponding to EUR 1m per MW, which is on level with 2009, with an order intake of 3,072 MW at a value of EUR 3.2bn. Measured in MW, the order intake rose by 182 per cent. In 2010, Vestas reached its expected revenue, earnings and net working capital as per announcement of 22 November 2010. After record-high deliveries of 2,557 MW in the fourth quarter, the year’s total deliveries to the customers in 2010 rose by 1,078 MW to 5,842 MW from 4,764 MW in 2009. The 36 per cent increase in revenue to EUR 6.9bn is due to the 23 per cent increase in deliveries. However, according to the wind organisation, GWEC, the total wind power market fell from 38.6 GW in 2009 to an installed capacity of 35.8 GW in 2010.The service business, which as per 31
GE’s first 2.75-103 wind turbine recently was commissioned at the Energy Research Center of the Netherlands (ECN) wind farm in Wieringermeer, Netherlands. Wieringermeer is located in Northern Netherlands near Ijsselmeer.
The new turbine features electrical system uprates and GE’s 50.2 meter proprietary blade
of the best in the industry, and gives us strong visibility for future growth.
“Whi le t he bu s ine s s environment remains challenging, particularly in the US and parts of Europe, our competitive position remains strong with a global sales and service organization – spanning 32 countries and 15 GW operating wind capacity worldwide – which is delivering in excess of 97 per cent availability. Our customer focus, comprehensive product portfolio and low cost supply chain has allowed us, in just 15 years, to build a base of over 1,800 customers, including 11 out of 15 of the largest wind customers worldwide.”
The Gamesa G52-850 kW 60 Hz turbine is designed for the most problematic locations: difficult-to-access sites, high elevations (even above 3,000 metres), locations with high concentrations of particulates and corrosive atmospheric conditions or sites with stringent seismic requirements. “This certification will allow us to better position ourselves in emerging wind markets, such as Central America, South America and East Asia,” said Gamesa’s chairman.
December 2010 comprised 31,000
MW, generated revenue of EUR
623m – an increase of 24 per
cent. The EBIT margin was 6.8
per cent before and 4.5 per cent
after one-off costs of EUR 158m
for closure of factories and lay-offs
as announced on 26 October 2010.
Free cash flow was EUR (733)
m after investments of a total of
EUR 789m in regionalisation and
quality, research and technology
development. During the second
half of 2010, Vestas generated a
free cash flow of EUR 325m, of
which EUR 145m was generated
in the fourth quarter. The free
cash flow was EUR (842)m in
2009. The interest-bearing net
debt, which rose to EUR 896m as
at 30 June 2010, stood at EUR
579m at the end of 2010, which
is equivalent to the corporate bond
of EUR 600m.
Alstom Collaborates With Belwind To Test Its New 6 Mw Direct Drive Offshore Wind Turbine At Belgian Wind Farm
Global leader in power generation equipment and services Alstom has announced it will collaborate with Belgian wind farm developer Belwind with a view to
demonstrating its next generation 6 MW direct drive offshore wind turbine as part of a demonstrator project in Belgium of approximately 40 megawatt (MW).
design that offers an annual energy production (AEP) increase of more than 9% at 7.5 m/s over the 2.5-100 machine. One 2.75-103 wind turbine can provide energy for approximately 2000 German homes.
“Following our announcement last year to introduce the new 2.75-103 wind turbine, we have our first unit fully commissioned, and ready
for delivery this summer,” said Stephan Ritter, general manager for GE’s Renewable Energy business in Europe. “This product marks a solid addition to our product portfolio. The design of the 2.75MW turbine is built on the core design of the 2.5 MW series with minor electrical changes, which reflects our evolutionary product strategy: to create value for our customers by building on proven
performance and reliability.”GE’s 2.75-103 utilizes GE’s
50.2 meter proprietary blade design that offers the latest enhancements in aerodynamics, reduced acoustic emissions and robust performance. Featuring a 103-meter rotor, the new wind turbine is optimized for IEC* Sb and DIBT WZ2 standards. It is available for 50 and 60 Hz applications with 75, 85 and 98-meter hub heights.
Business & Financial News
www.EQMagLive.com 5
Siemens Launches New Gearless Wind Turbine For Low To Moderate Wind Speeds
WE 20 by 2020 concludes on good note
Wind Power India 2011’ To Chart Roadmap For Additional 50 GW By 2020
Mr. Rajiv Wahi New Executive Chairman of Vestas India
CLP India Expands Its Wind Portfolio By 152.8MW With Two New Wind Farms
Siemens Energy recently launched a new direct drive gearless wind turbine for low to moderate wind speeds at the EWEA 2011 wind power exhibition and conference in Brussels. The core feature of the new SWT-2.3-113 wind turbine is an innovative drive concept with a compact permanent magnet generator. This type of generator is characterized by its simple, robust design, requiring no excitation power, slip rings or excitation control systems.
International conference and exhibition on wind energy WE by 2020, held from Feb 15-17, 2011, concluded on good note. Organised at Pragati Maidan, the conference gave reasons to ponder upon the ways to augmenting wind penetration to 20% of the renewable energy mix by 2020. Inaugurating the conference, Union Minister for New and Renewable Energy, Dr.Farooq Abdullah said, “The wind power potential of the country has been estimated to be 48000 MW. This is a conservative estimation based on the assumption that only 1% of potential land could be used for Wind Power projects. However, with the availability of better and efficient wind turbines
The National Action Plan on Climate Change (NAPCC) announced in June 2008 by the Govt. of India proposes increasing the share of renewable energy(RE) in the total energy mix to 15% by 2020. In order to achieve this, NAPCC recommends pegging the minimum share of RE in the national grid at 5%,starting from 2009-10, to be increased by 1% per annum in the following years so as to reach 15% by 2020. This requires a quantum jump inRE generation across the country. Wind power which has witnessed a phenomenal growth in India over the past few years could make a significant contribution towards the shift to a low-carbon and energy secure future. The country’s current cumulative installed capacity is 13 GW (as on Dec 2010), reaching 64 GW by 2020 (as per GWEC estimates).
Achievement of the NAPCC target thus poses several challenges to the states as well as policy makers and regulators, and wind industry stakeholders in India, who would need to rise up to the occasion and develop suitable strategies, policies and regulations to meet the NAPCC target. This includes
Vestas India, announced some days
before the appointment of Mr. Rajiv
Wahi as its executive Chairman,
with immediate effect.
Rajiv’s main role will be to
drive the business towards the
ambitious goals that have been set
for Vestas in the vibrant Indian
CLP India, one of the largest foreign private power players in India, recently announced that it will develop two new wind farms – one in Rajasthan and the other in Andhra Pradesh. The 102.4MW Sipla Wind Farm will be located at Jaisalmer District in the state of Rajasthan, and the 50.4MW Narmada Wind Farm will be located at Nallakonda, Anantapura District in Andhra Pradesh. CLP India
This results in high efficiency even at low loads. With a capacity of 2.3 megawatts (MW) and a rotor diameter of 113 meters the new wind turbine is designed to maximize power production at sites with low to moderate wind speeds. The SWT-2.3-113 is fitted with the new Siemens B55 Quantum Blades. This new blade design boosts efficiency and optimizes performance. A prototype of the new machine was installed in the Netherlands in March.
wind market. He will also play an
important part in engaging and
strengthening existing relationships
with customers, business partners,
the Indian government and industry
stake-holders. Rajiv will report to
Mr Sean Sutton, President, Vestas
Asia Pacific.
suitable for our moderate wind regimes and availability of increased infrastructure for power evacuation, the potential could go up. We should also initiate to reestablish our wind potential in the country so that higher capacity could be installed. We should explore possibility of low wind regime areas also with improved technology and lower cost. “.“The vision of the Ministry is to enable India to be a global leader in renewable energy, particularly in wind sector. I am confident that this conference will come with a road map and specific recommendations for the growth of the sector from the present level of three percent of the grid connected power”, he added.
a major focus on augmenting the power evacuation/grid facilities and transmission planning, availability of non-recourse project financing and skilled manpower, speedy and appropriate implementation of the latest policy/regulatory measures such as renewable energy certificates (RECs) [linked with state-specific renewable purchase specification (RPS) with penal provisions for non-compliance], the Indian Electricity Grid Code (IEGC) 2010, etc.
To understand, deliberate and discuss all these critical issues and challenges related to the role of wind power in attaining the 50 GW mark by 2020,the World Institute of Sustainable Energy (WISE), Pune, in association with the Global Wind Energy Council (GWEC), and the Indian Wind Turbine Manufacturers’ Association (IWTMA) is organising WIND POWER INDIA 2011 from 7–9 April 2011 at the Chennai Trade Centre, Chennai. The event would witness the presence of 1000+ delegates, around 100 exhibitors and nearly 100+ renowned speakers from the national and international wind industry.
has entered into agreements with major wind turbine manufacturer, Enercon India Ltd to develop these greenfield projects.The Sipla and Narmada Wind Farms will use 128 and 63 Enercon Gearless E53 800kW wind turbines respectively. Both projects will be developed and constructed under a comprehensive EPC arrangement and will be commercially operational by March 2012.
Business & Financial News
www.EQMagLive.com6
The power deficit situation beleaguering India for a number of years, coupled
with the increasing focus on ensuring energy security and low carbon economy, necessitates increasing the share of renewable sources in the nation’s energy mix.
Mirroring the global situation, Renewable Energy (RE) has been gaining prominence in India, and the “Chart 1” below depicts the increasing share of RE in India’s energy mix. At the end of 2010, RE contributed ~10 percent share to India’s total energy mix.
Amongst the various RE sources – small hydropower, bio-
mass, wind, solar, etc. – Wind Energy dominates India’s RE basket, with a share of almost 70 percent. Key factors leading to the dominance of wind in the renewable energy mix are:
1. Relatively mature technology, as compared to other RE sources
2. Low setup, operating, and
Wind Energy Overview In India And The Way ForwardAmol Kotwal, Deputy Director, Energy & Power Systems, South Asia & Middle East, Frost & Sullivan
running costs (since wind energy does not require any fuel)
3. Huge installed base
Wind Energy Capacity In India
India is the 5th largest Wind Energy market globally, with a cumulative installed capacity of 13,067 MW at the end of 2010. The “Chart 2” given below depicts the growth of Wind Energy installed capacity in India over the past 7 years. Wind Energy capacity addition over the last 3-4 years has grown at an average of 1,500-1,600 MW per year.
The global financial meltdown of 2008-2009, did have an impact, (relatively lower than the impact on other developed markets like Europe and Americas) on the wind energy capacity addition in India, since some developers shelved their investment plans.
Industry estimates indicate a capacity addition to the tune of 2,000-2,200 MW for the year 2010-11, driven by developers’ plans to seek benefit
under the Accelerated Depreciation Scheme, before it is withdrawn under the Direct Tax code in 2012. The average size of Wind Turbine Generators (WTG) has been increasing. From an average WTG of 600 kW in 2002-03, it increased to ~800 kW by 2005-06, and in 2010 the average WTG size was ~930 MW. The key drivers for this are:
• Bettercosteconomicsofferedby large-size WTGs
• Technology developmentsby WTG OEMs operating in India
• EntryofIndependentPowerProducers (IPP) investments in wind power projects leading to large-size projects
Regulatory Environment – Drivers For Development Of Wind Power In India
Strong policy support and regulatory framework have aided the growth of wind energy in India, as is the trend globally. Some of the key policies/regulations are:
(1) Accelerated Depreciation
• TheAcceleratedDepreciation(AD) benefit launched almost 15 years back has been a major driver to push wind capacity build-up in the country. The scheme was framed to provide benefit to developers to cope with unproven technology at that point of time
• The benefit which wasinitially100 percent during the
launching phase has now been reduced to 80 percent. The flip side of the AD scheme was that it promoted only installation of capacity without any incentives for generating wind power
• Thisresultedinonlybuildofidle capacity, leveraged well by industrial users for income tax benefits
(2) G e n e r a t i o n - B a s e d Incentive (GBI) Scheme
• Toovercometheshortcomingsof the AD scheme, the GBI scheme was introduced in late 2009 to provide developers incentives to generate wind power
• Asperthescheme,windpowerdevelopers were offered a cost incentive of 50 paisa/unit (kWh) of wind power generated (grid-connected plants), over and above the feed-in-tariff for a period of 10 years
• TheGBIschemeiscurrentlyvalid for wind farms installed before 31 March, 2012.
Chart 1: Electricity Installed Capacity Contribution by Fuel Type, India
Developers can claim incentives/benefits on either AD or GBI schemes for projects, since both schemes are mutually exclusive of each other
AD vs. GBI Scheme Debate
• Atthecurrentrateof50paisa/kWh, the GBI scheme is less financially attractive than the AD scheme, resulting in the slow uptake (current wind projects registered under the GBI scheme approximately 260 MW only)
• GBI scheme has foundpreference with the IPP segment, where the developers are assured of cash flows based on the wind power generation pattern
The AD scheme on the other hand has found preference with captive and industrial users who are keen to reduce their tax liability, thereby impacting their business profitability
(3) RPO (Renewable Portfolio Obligat ion) And REC ( R e n e w a b l e E n e r g y Certificates)
• UndertheaegisoftheNationalAction Plan on Climate Change (NAPCC), the Government has plans for RE to constitute about 15 percent of India’s energy mix by 2020. The NAPCC had also recommended increasing the share of renewable energy by 1 percent every year, starting 2008-09
Key regulations under the NAPCC are:
RPO (Renewable Portfolio Obligation)
• Accordingtothemandateslaiddown by the State Electricity Regulatory Commission (SERC) for states, Renewable Energy should constitute a certain minimum percentage of their total power consumption in the area of a distribution licensee. This concept has the potential
to develop into a marketplace for Renewable Energy, so that states with higher potential can supply power to states with lower or no potential
• Currently 18 of the 25State Electricity Regulatory Commissions (SERCs) have issued feed-in tariffs for wind power. Around 17 SERCs have also specified state-wide Renewable Purchase Obligations (RPOs). Both these measures have helped to create long-term policy certainty and investor confidence, which have had a positive impact on the wind energy capacity additions in those states
The “Chart 3” given below compares feed-in tariffs and RPO across various states in India
Renewable Energy Certificates (REC)
Since renewable energy resources are widely dispersed across India, not all states are
endowed with the same potential. This challenge acted as a hindrance for few RE resource-deficient states to meet their RPO targets.
To overcome this challenge, the Ministry of New and Renewable Energy (MNRE) and Central Electricity Regulatory Commission (CERC) launched the Renewable Energy Certif icate (REC) mechanism in November 2010:
• OneRECwillbeequivalentto1 MWh of electricity injected into the grid. The distribution companies, Open Access
consumers, Captive Power Plants (CPPs) will have the option of purchasing the REC to meet their Renewable Purchase Obligations (RPO)
• States can fulfill theirRenewable Energy obligation by purchasing the RECs in the Power Exchanges approved by CERC. The REC will be exchanged only in the Power Exchanges approved by CERC within a minimum and maximum price band to be determined by CERC
The REC mechanism is likely to give renewable energy development a further push in the coming years, as it would enable states which do not meet their RPOs through renewable energy installations to fill the gap by purchasing RECs.
Besides the REC mechanism could work well for a developer, since this is likely to generate higher revenues (1. Sale of Wind Energy to the grid at a preferential tariff and 2. Sale of REC through
power exchanges at the CERC determined tariffs)
Other Support FrameworkClean Energy Fund
• The Indian Government,while recognizing the role of renewable energy in addressing climate change and reducing dependence on fossil fuels, introduced a tax/cess of Rs. 50 on every metric ton of coal imported or produced in India, in the budget for 2010
• TheCleanEnergyFundisbeingcreated annually using this tax/cess, which will then be used by the MNRE to establish a Green Bank. The Green Bank shall work in tandem with IREDA to finance/fund wind energy projects
India’s Changing Wind Energy Market Structure
Development of wind energy in India has been largely driven by Accelerated Depreciation benefits. The industrial sector has leveraged this benefit with the purpose of tax savings. With the new phase of IPP investments in wind power, the IPP-based model has lately been gaining prominence in the Indian market.
The IPP segment has the capability to augment bigger wind power capacities quickly. In contrast to the approximately 10 MW-scale of wind projects being setup by industrial units, entry of IPPs has led to large-size capacity additions with project size of 50 MW+. The GBI scheme is popular with the IPP segment, since it gives returns on the power generated unlike the Accelerated Depreciation.
Some prominent IPPs operating in the wind energy business in India are
1. TATA Power
2. MSPL
3. Orient Green
4. China Light & Power (CLP)
5. Green Infra
6. Caparo Energy
7. Techno Electric
Wind Turbine Manufacturing Space – Buzzing Activity
India is currently host to a large number of domestic as well as multinational wind turbine OEMs. The wind turbine manufacturing segment has been abuzz with activity over the last 2-3 years, with new players entering the market.
Chart 3: Wind Energy Tariff Vs RPO, India
Overview
www.EQMagLive.com8
Suzlon has been at the forefront of wind energy development in India and has been successful in sustaining its leadership position for approximately 12 years. Put together, Suzlon, Enercon, and Vestas control 75-80 percent of the wind turbine market in India. Suzlon, in fact in Q4 2010, reached the landmark of having installed 5,000 MW of wind capacity in India.
Some suppliers are actively pursuing opportunities in the Wind Energy space in India, and some of them have already setup shops. Gamesa, Win Wind, Leitner Shriram, Global Wind Power, Kenersys, Siemens, GE, etc. are few noted companies making a foray in the Indian market.
The “Chart 4” given below depicts some of the major expansion/new facility plans of major suppliers in India over the last 12-14 months.
As per MNRE, at the end of 2010, there were almost 15-17 suppliers operating in India, and their combined capacity for wind turbine manufacturing was ~7500 MW. A few more suppliers are expected to setup base in India, taking India’s total WTG production capacity to 17,000-18,000 MW by 2012-2013.
A reference case based on RPO target by 2017 indicates that approximately 6,000 MW of incremental wind energy capacity per annum would be required, to reach the cumulative installed capacity of ~58,000 MW.
Achieving these levels of wind energy capacity could be a challenge, given that the technical potential as assessed by C-WET stands at ~48,000 MW. This essentially pushes the case for reassessing the technical potential and also exploring other options – wind turbine installations at higher hub heights, etc.
A few areas where opportunities could be leveraged and the industry is currently working on are as follows:
Wind Energy Opportunities And Future Trends In India
• Re-powering Wind Farms
The re-powering initiative aims at using the existing wind energy resources available on-site more efficiently with technically-advanced and high-performance turbines. Since 50-60 percent of
wind farms in India have first or second generation wind turbines (< 600 KW), which have been relatively less efficient, there is tremendous potential for enhancing wind power generation through re-powering.
Gamesa India is pioneering the re-powering initiative with the first re-powering project in India being undertaken in Tamil Nadu. Gamesa India also has five more re-powering projects in the pipeline.
• Offshore Wind Installation
Opportunity
In contrast to the steady
development of offshore wind
energy projects in Europe, India
currently has no offshore wind
capacity. But, some initiatives are
being taken by various agencies to
assess the offshore wind potential
for India.
• CenterforWindEnergy
Technology (C-WET) has taken
up projects to study the feasibility
of offshore windmills and map
potential zones off the Indian coast to setup such projects
• TATA Power, in late2010, submitted a proposal to develop India’s first offshore wind farm off the coast of Gujarat
It is imperative that the offshore wind power potential be tapped, especially as India has 7,000 km-plus long coastline. Although more expensive (2-2.5x) than onshore installations, offshore turbines can derive greater economic mileage due to higher and more stable wind speeds.
Under the National Action Plan on Climate Change (NAPCC), the Government of India has already set targets for RE capacity addition. The RPO and REC have helped to create long-term policy certainty and investor confidence, which have had a positive impact on the wind energy capacity additions, and are expected to be a key driver for the future growth of wind energy in India.
Success in this sector will depend on quick and effective implementation, which would include setting specific timelines for all states to implement these measures.
4. China Light & Power (CLP)5. Green Infra6. Caparo Energy7. Techno Electric
Wind Turbine Manufacturing Space – Buzzing Activity
India is currently host to a large number of domestic as well as multinational wind turbine OEMs. Thewind turbine manufacturing segment has been abuzz with activity over the last 2 3 years, with newplayers entering the market.
Suzlon has been at the forefront of wind energy development in India and has been successful insustaining its leadership position for approximately 12 years. Put together, Suzlon, Enercon, and Vestascontrol 75 80 percent of the wind turbine market in India. Suzlon, in fact in Q4 2010, reached thelandmark of having installed 5,000 MW of wind capacity in India.
Some suppliers are actively pursuing opportunities in the Wind Energy space in India, and some ofthem have already setup shops. Gamesa, Win Wind, Leitner Shriram, Global Wind Power, Kenersys,Siemens, GE, etc. are few noted companies making a foray in the Indian market.
The “Chart 4” given below depicts some of the major expansion/new facility plans of major suppliers inIndia over the last 12 14 months.
Chart 4: Indian Wind Turbine Suppliers Investment / Expansion Plans
WTGOEM/SUPPLIER
LOCATION EXPANSION/NEW FACILITY PLAN
RRB EnergyPoonamallee,Chennai
2nd phase of expansion at its existing facility. Enhancingproduction capacity up to 700MW for producing 1.8 MWscale WTG, by end of fiscal 2011 12
Kenersys Baramati New facility with a capacity to 250 turbines/year
Gamesa ChennaiInitial capacity of 200 MW scaled up to 500 MW by end of2010. Plan to scale capacity to 800 MW by end of 2013
Gamesa GujaratNew plant to manufacture WTG blades (components) withinitial capacity of 300 MW
ABB Vadodara100 units of generators (component) per month for WindTurbines with a rating of upto 2.5 MW
Siemens Gujarat 250 MW. Plant to go on stream by 2012
GE EnergySetting up an annual capacity of 450 MW, at their upcomingplant in Southern India
GhodawatEnergy
MaharashtraManufacturing of 1.65 MW turbine (under license fromAMSC), with an annual capacity of 500 MW
Inox Una, HP WTG manufacturing/assembly
Inox Bawla, Gujarat WTG blades and towers (WTG components)
Chart 4: Indian Wind Turbine Suppliers Investment / Expansion Plans
CHALLENGES FOR ACCELERATED WIND POWER DEVELOPMENT
Skilled Manpower
Power Evacuation & Grid connectivity
Infrastructure issues affecting large WTG
transportationLand Acquisition
Project FinancingAccurate wind
potential assessment
Chart 5: Indian Wind Turbine Industry Challenges
Annual Generation Requirement as per 17th EPS 1,392,008 Mn UnitsRPO Target by 2017 12%
Annual RE req. by Y2017 167,041 Mn UnitsAssuming PLF of 22 23% for RE projectRE installed capacity by 2017 82,900 MWAssuming Wind accounts for 70% of RE mixWind Energy capacity reqd by Y2017 58,000 MWCurrent installed capacity 13,000 MWCapacity increment required over the next 7 years 45,000 MW
Capacity increment required p.a. over the next 7 years6,000 MW/
year
Achieving these levels of wind energy capacity could be a challenge, given that the technical potentialas assessed by C WET stands at ~48,000 MW. This essentially pushes the case for reassessing thetechnical potential and also exploring other options – wind turbine installations at higher hub heights,etc.
A few areas where opportunities could be leveraged and the industry is currently working on are asfollows:
Wind Energy Opportunities And Future Trends In India
(1) Re powering Wind Farms
The re powering initiative aims at using the existing wind energy resources available on sitemore efficiently with technically advanced and high performance turbines. Since 50 60 percentof wind farms in India have first or second generation wind turbines (< 600 KW), which havebeen relatively less efficient, there is tremendous potential for enhancing wind powergeneration through re powering.
Gamesa India is pioneering the re powering initiative with the first re powering project in Indiabeing undertaken in Tamil Nadu. Gamesa India also has five more re powering projects in thepipeline.
(2) Offshore Wind Installation Opportunity
In contrast to the steady development of offshore wind energy projects in Europe, Indiacurrently has no offshore wind capacity. But, some initiatives are being taken by variousagencies to assess the offshore wind potential for India.
Overview
5 - 7 MAY 2011, PRAGATI MAIDAN, NEW DELHI, INDIA
www.power-genindia.com
GEARING UP FOR THE POWER CHALLENGE
OF INDIA’S 12TH PLAN
INVITATION TO PARTICIPATERegister now for this unique business opportunity which has already sold 80 per cent exhibition space and expects 7000 high calibre attendees.
POWER-GEN India & Central Asia is one of the region’s most important power industry events and the largest ‘POWER-GEN’ conference and exhibition outside of Europe and North America
Well established as the region’s premier event, POWER-GEN India & Central Asia 2011 provides the ideal opportunity to discuss the important technical and logistical issues related to the modernization of India’s power infrastructure, as well as how to meet the country’s exponential growth in energy demand.
POWER-GEN India & Central Asia comprises a world-class exhibition �oor offering unrivalled networking and business opportunities for attendees and exhibitors alike, plus the chance to present the latest equipment and pioneering technologies for the Indian and international energy sectors.
Take advantage of the vast growth in India and by exhibiting at POWER-GEN India & Central Asia and network with the major players in the Indian and international power sector.
Who will by your audience?
• Policy-Makers from the Energy Sector• Electricity Boards/ Power Utilities• Independent Power Producers (IPPs)• Energy Managers and Consultants• EPC Contractors • Venture Capitalists• Coal & Gas Operators• OEMs • Operations & Maintenance Managers
If your organization is currently working or considering operating, investing or developing business in India and Central Asia, then an exhibiting presence at POWER-GEN India & Central Asia 2011 is essential to establish or further your business interests in one of the world’s most dynamic power markets.
For further information, please visit www.power-genindia.com
Flagship Media Sponsors Supporting Organisation
Event Organisers
Co Located
www.EQMagLive.com10
As cost of renewable energy is higher than conventional (non-renewable) sources,
an incentive structure has been necessary to assist the growth of renewable energy capacity. Over the years, the approach to incentivize renewable energy development has shifted from a capital subsidy model to a generation based model. Also, renewable energy sources are not evenly spread across different parts of the country. On the one hand there are States like Delhi where the potential of renewable energy is not significant while on the other hand there are States like Rajasthan and Tamil Nadu where there is very high potential for renewable energy. Distributing the higher cost of renewable energy across States in a meaningful way while also moving the subsidy to a generation based model has been some of the key reasons for the development of Renewable Energy Certificates (RECs).
The concept of REC seeks to address the mismatch between availability of renewable energy sources and the requirements of obligated entities to meet their Renewable Purchase Obligation (RPO). The REC framework is expected to encourage RE capacity addition in states where there is potential for renewable energy generation as the REC framework seeks to create a national market for such generators to recover/spread their cost. Central Electricity Regulatory Commission (CERC) has notified regulation on REC in fulfillment of its mandate to promote renewable sources of energy and development of market
Policies under “The Electricity Act, 2003” and the “National Action Plan on Climate Change (NAPCC)” provide for a roadmap for increasing the share of renewable energy in the total generation capacity in India.
REC Mechanism – Driving Growth Of Wind EnergySatish Kashyap, Co-Founder & Director, General Carbon
in electricity. The REC framework is expected to give further impetus to the growth of renewable energy in the country.
Renewable Energy: The story so far
Indian power sector has grown from less than 2 GW installed capacity post-independence to the current level of over 170 GW. The major source of power generation in India has always been coal with some share from gas and hydro based power generation. In view with the limited nature of coal resources and the environmental damages from coal, India has been steadily moving ahead on the path towards increasing the share of renewable based power in the total generation. The major highlights during the course of its efforts to boost renewable energy generation are as follows:
• Capitalsubsidies
• AcceleratedDepreciation inwind projects
• 80IAIncomeTaxHolidayfor10 years
• MNESCapitalSubsidyofferedfor small hydro
• GenerationBasedincentiveof
50p per unit for wind IPPs
• Preferentialtariffsforpowerproduced from renewable sources
• Renewab l e Pu r c h a s eObligations: SERCs to source specified percentage of electricity purchased from renewable sources
• JawaharlalNehruNationalSolar Mission
• R e n ew a b l e E n e r g yCertificates
Challenges for renewable growth in future:• Highcapitalcostsascompared
to the conventional source of energy.
• Difficulties in financing
renewable energy projects due to high risk, especially those under REC Mechanism (due to deferred revenue and non-establishment of the scheme).
• Seasonalattributesofsomeforms of renewable energy sources.
• Wind is seen as themajorcontributor in the growth with lesser focus on other technologies.
• Thebestofthesitesforwindmills are already tapped.
• GapbetweenRPOsetbyallstates put together against the national target by NAPCC.
REC Mechanism• NLDC has been authorized
as the Central Agency for registration of RE generators participating in the REC Mechanism.
• The RE generators havetwo options - either to sell the renewable energy at preferential tariff fixed by the concerned Electricity Regulatory Commission or to sell the electricity generation and environmental attributes
• On choosing the secondoption, the environmental attributes can be exchanged in the form of REC. Price of electricity component, if sold to distribution licensee would be equivalent to weighted average power purchase cost of the distribution company including short-term power purchase but excluding renewable power purchase cost. Price of electricity component, if sold to other licensee or open access consumer would be the mutually agreed price, or if sold through power exchange would be the market determined price.
• EligibleREgeneratorwillhaveto apply for accreditation to the relevant State Agency and on successful accreditation these projects needs to register with the NLDC for the purpose issuance of RECs.
• Aregisteredprojectneedstoapply for issuance of RECs within three months of the
date of injection of electricity to the grid.
• The value of REC will beequivalent to 1 MWh of electricity injected into the
grid from renewable energy sources.
• TheRECwillbeexchangedonly in the Power Exchanges approved by CERC within the band of a floor price and a forbearance (ceiling) price to be determined by CERC from time to time.
• Thedistributioncompanies,Open Access consumer, Captive Power Plants (CPPs) will have option of purchasing the REC to meet their Renewable Purchase Obligations (RPO).
• Therewillalsobecomplianceauditors to ensure compliance of the requirement of the REC by the participants of the scheme.
REC - Current StatusThe REC mechanism was
launched in November 2010. It has already seen a surge in number of projects applying for the scheme. As on 21st March 2011 -
• Infifteenoutof twenty-fiveSERCs, the REC regulation and State Agency is finalized.
• FiveStates have already started accreditation of projects: G u j a r a t , Chhattisgarh, Maharashtra, Haryana and Rajasthan.
• Fiftyprojectsareaccreditedaccounting to ~280MW aggregate capacity.
• Fifteen of these projects
accounting to ~140MW aggregate capacity are registered by NLDC for issuance.
• Maharashtra leadswiththemaximum (i.e. 86% of total) projects in the pipeline.
• Most projects (i.e. 60%of total) applying for the scheme are based on wind technology.
• TheissuanceofRECshasalsostarted and the first REC trade is expected on 30th March 2011.
Interesting Times AheadAs per NAPCC target, by
2015, India will need to source
at least 10% of its energy from solar, wind, hydro power and other renewable energy sources and 15% by 2020. Coupled with this is the mammoth solar mission, which mandates 20GW of solar energy in the country by 2022. India has huge potential for renewable energy sources, especially solar energy. Theoretically, India has solar potential of 5 trillion kWh per year. The potential for non-solar resources is another 85,000MW, according to various analyst
REC Price Non Solar REC Solar REC (Rs/MWh) (Rs/MWh)
Forbearance Price 3,900 17,000
Floor Price 1,500 12,000
estimates. Of that, only around 17,220MW has been tapped. This includes 69% from wind energy, 16% from small hydropower units and 8% from co- generation. The remaining 7% covers solar energy and other sources.
• Theinitialgrowthinrenewableenergy capacity is expected to be slower than demand
• InFY2010thegapwasover1.2% with respect to the NAPCC target of 5%
• This gap is expected to bereducedto1.1%inFY2011
when the NAPCC target is 6%
• Till2013demandisexpectedto outstrip supply
• As playersdevelop s trong execution skills supply will catch up with demand (~2015)
The wind project proponents see a lot of options at their disposal including a c c e l e r a t e d d e p r e c i a t i o n benefit, GBI scheme,
Clean Development Mechanism (CDM), and now REC Mechanism. The accelerated depreciation is mutually exclusive with GBI but same is not the case with CDM and REC Mechanism. There are a few CDM Registered projects which are also registered under REC. Furthermore numerous projects are pursuing both CDM as well as REC, simultaneously. If projects are structured appropriately they can avail dual environmental benefits.
771 836 908 987 1066 1145
29 41 56 73 93 1153.8%4.9%
6.2%7.4%
8.7%10.0%
0%
5%
10%
15%
0
500
1,000
1,500
FY10 FY11 FY12 FY13 FY14 FY15
Billion UnitsTotal Gen (BU) RE Gen (BU) RE (%)
REC Mechanism
www.EQMagLive.com12
We are not dealing with a small number of optimally configured
turbines in the controlled environment of a turbine hall situated close to O&M infrastructure being routinely inspected and exploiting a relatively benign and constant resource. Rather, we are operating orders of magnitude more turbines widely distributed in remote locations with access issues exploiting in an often sub-optimal manner an intrinsically highly intermittent and variable resource with damaging characteristics imposing dynamic load cases that can destroy our assets. As offshore wind power projects move from planning and development through construction to operation it becomes even more evident that we can’t afford to adopt a conventional reactive strategy and simply wait for things to break. A proactive strategy that enables prompt targeted interventions is necessary to avoid catastrophic downtime. Various sources of information and asset intelligence are available to support such a strategy, but currently remain chronically underused. Condition Monitoring Systems (CMS) provide a detailed picture using a signal acquisition and processing approach to give early warnings about deterioration in the status of key components. Another approach is Performance Monitoring (PM). This does not require capital expenditure or the installation of sensors and instrumentation, as it
Meeting the challenges presented by wind power assets with regard to performance optimization and O&M requires a paradigm shift compared to the approaches that have traditionally been adopted in other industries such as thermal power generation.
Practical Performance Monitoring for Asset OptimizationDr Peter Clive, Technical Development Consultant, SgurrEnergy Ltd
is based on the thorough statistical analysis of the operational data already routinely being acquired by the wind farm’s SCADA system. The information available in the SCADA data represents a greatly under-exploited resource the value of which performance monitoring makes available.
The basic performance monitoring procedure is cyclical. SCADA data are retrieved and analyzed to identify any anomalous features of performance and indicate possible diagnoses. The results are then reported in the form of alerts and more detailed reports on a weekly or monthly basis to prompt interventions in the form of inspection and maintenance scheduling, inform the disposition of spare parts and support infrastructure, and allow the optimization of control parameters. The positive results of these actions can then be audited during the next iteration of the performance monitoring cycle. In this process, traditional lines of demarcation separating the various interests in wind turbine performance must be to some extent set to one side to reap the maximum benefit offered by performance monitoring. If a conflict between the interests of turbine manufacturers, O&M personnel, SCADA analysts, and other stakeholders is perceived this may limit communication. The various insights provided by these diverse perspectives will not then be brought to bear in the
most effective manner. Everyone knows something useful but no-one knows everything. To achieve optimal performance, everyone who has something to contribute to the understanding of the response of wind power assets to the varying characteristics of the complex resource being exploited must be able to make that contribution. Relationships and contracts must be forged on the basis that optimal productivity and longevity is in everyone’s interest.
Performance monitoring, as distinct from condition monitoring, is fundamentally a statistical exercise. Observed power performance is evident in
the power curves that are built up over a period of operation during which the response of the turbine to variations in inflow can be investigated. SCADA data typically record average values every 10
minutes, so a single point on a power curve can be plotted every 10 minutes. The duration of the period over which these points are accumulated to form a graph representing power performance, the power curve, should be of the order of a week in order to represent a sufficient variety of wind speeds and circumstances while being short enough to permit a rapid response to any incipient faults manifested in the power curve. The statistical analysis of the differences between the observed power curves and a reference power curve that is taken to represent normal satisfactory operation can be very informative. A variety of performance metrics
can be derived from these analyses which allow the performance of each turbine during each week of operation in the period under investigation to be represented by a point in a metric plot in a way that
Figure 1: Response Deficit Analysis power performance metrics plot
Asset Optimization
www.EQMagLive.com 13
facilitates the rapid identification of anomalies. An example of such a metric plot is shown in Figure 1. Power performance that is typical of healthy assets is found to produce metrics that lie on the “main sequence”. If the observed power curve matched the reference exactly the metrics would lie at the point (0, 0). However, variations in wind shear and veer, flow inclination, turbulence, and other inflow characteristics, and the variations in response to this evident in the power performance of assets that are nevertheless healthy, result in the smearing of this point along the main sequence. Periods of anomalous power performance are immediately obvious and so the analyst can rapidly focus their investigation in the most cost-effective manner on the most revenue-affecting issues.
The analysis illustrated by Figure 1 is an example of Response Deficit Analysis used to investigate the variation in active power production in response to variation in inflow hub height wind speeds. These techniques can be applied equally to other operational parameters recorded in the SCADA data, such as rotor rpm, blade pitch, bearing temperatures, and so on, to allow the rapid identification of deviations from normal operating conditions that may be evidence of deterioration preceding catastrophic component failure. The analysis can then precipitate timely intervention to avert costly downtime; the replacement of a bearing before it can fail and take out an entire generator or gearbox for example. Prior to the introduction of Response Deficit Analysis the task of monitoring the parameters reported in the SCADA data could seem too onerous and costly to undertake; multiple graphs of power curves for different periods and turbines were inspected and compared by eye. Response Deficit Analysis effectively provides us with a “graph of graphs” which radically
accelerates this process and facilitates its automation, as is seen in Figure 1, each point in the metric plot represents the graph of the power curve for a specific turbine representing its power performance during a particular week. This supports the paradigm shift needed to implement practical and effective performance monitoring on a routine basis.
By contrast, condition monitoring is more concerned with signal processing. Both approaches enable trending over similar timescales, such that the gradual deterioration in the status of the asset can be tracked. Each approach offers different strengths when identifying the cause of that deterioration, however, and should be viewed as complementary. However if the signals from the condition monitoring sensors are reported in the SCADA data their analysis can be conducted under the aegis of a performance monitoring code. For example, the variation in bearing temperatures with power production, or the relationship between the temperatures of drive-end and non-drive end bearings can depart from the main sequence in the relevant Response Deficit Analysis plot weeks or even months prior to a failure which could result in, for example, the replacement of a generator or a gearbox. Observation of these anomalies and prompt action as a result can avert losses amounting to hundreds of thousands of dollars. This is particularly true for offshore, where access for maintenance may be severely restricted for several months of the year at precisely the time when both the stresses on the equipment and the power output are at their maximum.
One focus of O&M hitherto has been the charting of asset availability according to an approved definition suitable for determining the liability of turbine manufacturers for liquidated damages in the case of poor availability. However this emphasis can lead to a failure to identify
sources of revenue variance that occur while assets are 100% available. It has been customary to think in terms of lost yield arising during downtime, calculated on the basis of the power that would have been produced given the recorded wind speed had the asset been available, when investigating the deviation of revenues from budget. A more useful concept is yield deficit, which can include shortfalls due to both downtime and under-performance. Given that downtime is often preceded by a period of poor performance that occurs due to the deteriorating status of a component or sub-system, a renewed focus on performance is required. Poor performance now can mean poor availability later - why wait for the downtime.
In general SCADA data contain two broad categories of data
• Timeseriesdata,recording,forexample, 10 minute averages of hub height wind speed and active power production
• Event data, which reportspecific incidents, warnings and alarms according to their detection and reset times
Once yield deficit has been identified, the SCADA alarm log allows its attribution to instances of specific alarms and therefore inspections can be prioritized to investigate the most revenue-affecting issues. The analysis of the SCADA alarm log can also reveal other useful aspects of turbine condition. For example, observing cascades of events and alarms can indicate the root causes of failures.
In addition, one alarm code can indicate issues with unrelated subsystems. For example, a persistent tower accelerometer trip at a certain wind speed can indicate rotor imbalance arising as a result of a blade pitch error. The effective analysis and interpretation of SCADA data will always require the experience of expert personnel and so performance monitoring software is generally used as a
tool to leverage maximum value from a consultant’s time, using a “Software as a Service” model.
In addition to the avoidance of cost, performance monitoring also enhances revenues. Control parameters and algorithms can be optimized and overall gains in production across an array of wind power assets of 1% to 3% can be achieved. For example, chronic blade pitch errors can incur a loss of several percent of Annual Energy Production (AEP). These can arise for a variety of reasons, including sub-optimal control algorithms and sensor faults. Premature over-speed conditions which can impact AEP by around 1% can also occur as a result of wind speed sensor faults, and in general performance monitoring practitioners and forensic SCADA analysts find an alarming number of sensor faults underlying many causes of poor performance. If the controller does not know what the wind speed is, the wind turbine cannot be controlled in an optimal fashion. Sensor faults can arise due to factors as simple as poor instrument calibration and the lack of a nacelle transfer function, and it is often advisable when assessing the power performance of an operational asset to deploy Lidar to obtain an independent measurement of the inflow wind speed.
Performance monitoring has historically been neglected through a combination of a failure to acknowledge the challenges of operating wind farms and a perception that detailed forensic analysis of SCADA data is onerous, time-consuming and costly. Pioneering and innovative software tools are now available which implement techniques such as Response Deficit Analysis to automate rapid and economic SCADA analysis and enable routine performance monitoring in support of precisely the sort of proactive O&M and asset optimization strategies the nature of the challenges now facing the industry calls for.
Asset Optimization
www.EQMagLive.com14
The variability of wind energy production presents a special challenge for utility system operations. While conventional power plants can produce a near constant output – barring rare emergency outages – the output of a wind plant fluctuates widely. To the extent the fluctuations are not predicted, they create costs for the electricity system and consumers as well as potential risks to the reliability of electricity supply. Depending on the level of wind penetration relative to overall electricity load, the costs may range up to several US dollars per megawatt-hour (MWh) of wind generation.
These issues create a strong demand for accurate wind power forecasts.
The market has responded to this demand with a wide variety of different forecasting methods and system architectures from different providers and effective wind forecasting systems are now in place in many countries. Where it used to be the exception, wind forecasting is becoming the norm.
Studies have demonstrated that wind forecasts can offer a substantial value to utility systems. For example, Figure 1 presents the results of a study of the California electricity system under several scenarios of high wind penetration.[1] It shows that the total annual cost savings for state-of-the-art next-day wind forecasts for the California system would range up to $175 million, compared to no forecasts at all, for a scenario with 12.5 GW of in-state wind. This is at a very rough guess, at least 100 times the cost of a system to provide those forecasts, suggesting a benefit:cost ratio of over 100:1.
This paper presents an overview of the forecasting challenge for different forecast time horizons; describes some leading forecasting methods and system architectures; and discusses the data requirements for a state-of-the-art forecasting system.
Wind Energy Forecasting - Technology and ValueMichael C Brower, Principal & Chief Technology Officer John Zack, PrincipalJohn Manobianco, Director of Research
The forecasting problemThe wind forecasting problem
is enormously challenging due to the wide variety of spatial and temporal scales of atmospheric motion. In order to understand the different issues involved in wind energy forecasting, it is useful to divide the problem into three time scales:
• Veryshort-term(0-6hours),
• Short-term(6-72hours),and
• Mediumrange(3-10days).
The skill in very short-term forecasting is related to the prediction of small-scale atmospheric features (< 200 km in size) in the vicinity of the wind plant. The major challenge is that very little data are typically gathered on the scale of these features. As a result, it is usually difficult to
define the spatial structure and extent of these features.
Given the lack of regional data, wind forecasters must infer information about these features using a time series of meteorological and generation data from the wind plant. For this reason, real-time data from the wind plant is usually crucial to producing highly accurate very
short-term forecasts. In fact, the 0- to 6-hour time scale is the period when persistence forecasts - those based on a simple assumption that current wind conditions will continue - typically outperform wind energy forecasts derived solely from predictions of the regional atmospheric circulation. Thus, the benchmark for the very short-term time scale is a persistence forecast.
The ability to forecast the wind energy generation over short-term time scales (6-72 hours) is tied to the skill of forecasting regional scale atmospheric features. These features are often referred to as synoptic weather systems, and are the ones typically depicted in newspaper and TV weather presentations. It is necessary to gather data over a large volume of the atmosphere in order to define the structure of these systems. This is usually accomplished using a variety of sensor platforms, including satellites, aircraft, weather balloons, and surface weather stations. Many of these platforms are operated by national meteorological agencies (such as the India Meteorological Department).
T h e i m p o r t a n c e o f measurements from the wind plant itself rapidly decreases over the 6-72 hour period. This is because information that determines variations in meteorological parameters for periods greater than 12 hours comes from locations that are hundreds of kilometers away. Therefore, the benchmark for this forecast time horizon changes from persistence to climatology (i.e. the average of weather conditions for that location and season). A climatology forecast typically outperforms a persistence forecast after about 12 to 18 hours.
Precise medium- range forecasts are generally beyond
2010T A
-
50
100
150
200
250
Tota
l Var
iabl
e C
ost c
hang
es ($
M)
2010T B 2010T C 2010X A 2010X B 2010X C
no forecast - perfect forecast
no forecast - estimated forecast
estimated forecast - perfect forecast
Figure 1. Comparison of differential variable operating costs in the California electric grid under six wind scenarios, for different assumed forecasting systems: perfect forecasts, state-of-the-art forecasts, and no forecasts.
Forecasting
www.EQMagLive.com 15
current weather forecasting technology because of the difficulty of accurately predicting far in advance the local effects of evolving continental, hemispheric, and global-scale atmospheric circulation systems. Most medium-range forecasts are therefore based on statistical time-lag relationships, and are limited to predicting above-average or below-average conditions. The benchmark for this time scale is a climatological forecast.
The remainder of this paper focuses on the very short-term and short-term time horizons. These are often referred to as next-hour and next-day forecasts, respectively.
Next-hour forecasting
A wide variety of methods are being used to produce very short-term (next-hour) wind energy generation forecasts. Figure 2 provides a schematic depiction with many components of the very short-term forecasting process and the ways they can be linked together.
The simplest type of next-hour forecast uses a time series of power generation data from the wind plant and a statistical procedure, such as multiple linear regressions or a neural network, to generate predictions of the future power output. These are often referred to as “persistence” or “autoregressive” models since their only source of information is the history of the plant power
output. Sophisticated statistical models, such as neural networks, may be superior to simpler models such as linear regressions in some cases, but they can also be more prone to “over-fitting” if the training sample is not sufficiently large or diverse. (Over-fitting means that the model is able to fit the training data very well, but fails severely when presented with new data that fall outside the training envelope.) Ultimately, all of these methods are limited by the fact that the input information is derived only from a history of conditions at the wind plant.
The next level of sophistication is to use meteorological data from other sources outside the wind project, such as nearby met towers or remote sensing systems. The statistical models employed are generally similar, but the number of predictors is larger. Another possibility is to use forecast output from a regional scale weather forecasting model. Such models provide information about large-scale meteorological trends and features but do not incorporate local data. Some large-scale trends are well correlated with local wind behavior, and hence the regional model data can, at times, add skill to next-hour forecasts.
An approach that has yet to be thoroughly tested for very short-term wind power forecasting is to use a custom high-resolution weather forecasting model to produce next-hour forecasts. Ideally, all available local-area data are assimilated into the initial state used to start the model run. This type of procedure has the potential to simulate the atmospheric features that cause very short-term wind fluctuations, but its effectiveness has not been fully demonstrated.
Another technique is a forecast ensemble. This is a method of combining forecasts created by different methods. There is an extensive body of research showing that in many cases, ensemble forecasts are better than any single forecasting method over the long run.
After considering the various methods for producing next-hour forecasts, two questions arise: (1) What is the typical accuracy that can be expected from such forecasting methods; and (2) What is the variation in performance due to differences in methods, locations, seasons, and weather regimes? Most published performance evaluations have been done by the forecast providers themselves. They rarely consider more than one method. In addition, the methods, locations, and forecast time horizons have varied widely, making it difficult to draw broad conclusions. Nevertheless, there have been some rigorous studies of next-hour forecast accuracy using a variety of methods under diverse atmospheric conditions.[2]
As an illustration, the accuracy of several next-hour forecasting methods for a wind plant in the San Gorgonio Pass of California, USA, is presented in Figure 3. In this case, all methods yield a small improvement over persistence during the first couple of hours of the forecast period. The methods that use regional physical model data become significantly better than persistence after about 4 hours. This pattern is typical for this site and season, but experience shows that there can be large variations in performance from site to site and season to season.
Next-day forecastingNext-day forecast methods use
essentially the same tools as next-hour forecasts, with two important differences:
• Theimportanceofreal-timedata from the wind plant and its immediate environment is significantly reduced
• Regional and sub-regionalsimulations with a physics-based atmospheric model play a much more important role.
Almost all short-term forecast procedures begin with the grid point output from a regional-scale physics-based atmospheric model. Typically, these models are
Figure 2. A schematic depiction of the interrelationship of the components of a very short-term forecast system.
Figure 3. The mean absolute error (MAE) by forecast hour during July 2003 for five very short-term forecast meth ods and a simple persistence benchmark forecast for a wind plant in San Gorgonio Pass, California, USA. The “SMLR” acronym refers to a screening multiple linear regression procedure. “O-PM” refers to the use of both observational and regional physical model data as input to the statistical procedures.
Forecasting
www.EQMagLive.com16
executed at a national forecast center. They ingest data from a wide variety of sources over a large area, and produce forecasts of regional-scale weather systems over period of several days. However, these models do not resolve the physical processes occurring in the local or mesoscale areas around individual wind plants. (The mesoscale scale is between the large-scale weather systems and the local scale approximately 5 - 100 km).
The forecast methods differ substantially from this point. Some attempt to go directly from the regional-scale forecast data to the local scale through the use of either diagnostic physical models, statistical models, or a combination of both. This method can be effective in areas of relatively simple terrain and wind climate; however, it can miss important processes occurring at the sub-regional or mesoscale.
Another approach is to execute high-resolution weather simulations with a physics-based model to account for the mesoscale processes. This is the approach used by AWS Truewind (AWST) in its eWind system. A schematic depiction of the eWind system is presented in Figure 4. This approach has had considerable success in forecasting the variations in winds attributable to mesoscale processes but it has
a much higher computational cost than the regional-to-local forecast schemes.
Both the regional-to-local and mesoscale simulation methods typically employ statistical models (also called model output statistics, or MOS) to predict the wind speed and direction at the wind plant’s met towers or turbines. Using data from the wind plant, the statistical models correct for biases in the “raw” model predictions.
It is possible to predict the energy generation directly from physical model output using a MOS process. However, most forecasts occur in two steps - first, the wind at the site is predicted, and second, the wind is converted to plant output using a wind plant output model. The plant output model can be either physical (e.g., accounting explicitly for topography and turbine wakes) or statistical (based on past relationships between the observed winds and plant output). The eWind system uses a statistical wind plant output model.
As in the case of very short-term forecast performance, a rigorous, quantitative assessment of the performance of various next-day forecasting methods is difficult to obtain. Here we restrict ourselves to some typical examples. Figure 5 and Figure 6 depict the mean absolute error (MAE) of forecasts produced by
AWS Truewind in a study managed and evaluated independently by the Electric Power Research Institute (EPRI) [3]. The Mountain View wind plant is located in San Gorgonio Pass, and the Altamont plant in Altamont Pass, both in California, USA.
It can be seen that persistence forecasts are best in the first few hours for both plants because no real-time information from the plant or its immediate environment was available for use in the forecast process. After the initial period, the next-day forecast outperforms the persistence and climatology forecasts by a substantial margin. This result is typical of next-day forecasts at most sites.
These figures also provide an indication of the forecast error growth rate with look-ahead period. The error growth for the San Gorgonio Pass wind plant (2% of installed capacity per 24 hours) is approximately twice as large as the rate for the Altamont Pass plant. This difference is most likely attributable to the physical properties of the site and its immediate environment as well as differences in weather regimes affecting the two areas over the course of the year.
This study served to document the expected level of performance of short-term wind energy forecast systems. It indicated that current forecasting systems
have considerable skill over climatology and persistence forecasts for 1- to 2-day periods. It also demonstrated that 1- to 2-day forecast performance can vary substantially by location, season, and the attributes of the forecast system used to generate the predictions.
Early-warning ramp forecasting system
As the amount of wind generation increases on grid systems, the occurrence of large and rapid changes in power production (ramps) becomes a significant grid management issue. A good operational ramp definition is a change in power output that has high enough amplitude over a short enough period to cause short-term grid management issues. The operators must ensure there is always sufficient rapid-response conventional generation and load ramping capability to compensate for ramps in wind power output. Thus, from a grid management perspective, accurate forecasting of ramps may be more important than minimizing the overall MAE of the typical power production forecasts.
Forecasting techniques that are designed to minimize MAE under typical wind conditions do not do well in forecasting the rapid changes in wind that cause power ramps. Since ramps have such a great impact on power
eWindR eg io nal/ Glo balW eather Models
R awAtm os ph er ic Data
Surfac eC ha rac t er is t ic s Data
Plant Output Models
Statistical Models
Physical Models USER
WindForecast
WindForecast
Adjusted Wind Forecast
Power O utput Data
Meas ured Wind Data
Adjusted Wind Forecast
Power OutputFo rec as t
Figure 4. A schematic depiction of the major components of one next-day wind power forecasting system, eWind.
Wind Energy Forecast Mean Absolute ErrorMountain View I and II: Oct 2001 - Sept 2002
0%
5%
10%
15%
20%
25%
30%
35%
40%
Forecast Hour
TrueWind Persistence Climatology
Figure 5. The mean absolute error by forecast hour for 12 months of AWST (eWind), persistence, and climatology energy generation forecasts for a wind plant in San Gorgonio Pass, California. The eWind forecast did not use real-time plant data.
Forecasting
www.EQMagLive.com 17
production forecasts, ramp forecasting needs to be considered as a separate forecasting problem, with a method and system designed specifically for the task. In addition to forecasts of the likelihood of a ramp event, AWST experience suggests that grid operators want the meteorological cause of the event (front, thunderstorm line, etc.) so they can track it in real time.
Ramps in wind power production are caused by several different types of meteorological processes. Each type of ramp has a unique set of characteristics and forecast issues. The data and type of forecast method required to optimally predict each type of ramp event are dependent on the meteorological process that caused them.
Large-scale processes that cause ramps include cold fronts and upper tropospheric shortwave troughs of low pressure. Smaller scale processes include phenomena such as outflow boundaries from thunderstorms, changes in wind direction across a mountain range, and formation or erosion of shallow pools of cold air. Some processes, such as those associated with fronts, tend to move horizontally across the plant area. These events can be identified and tracked with,
e.g., radars and satellites. Some processes, however, are vertical in nature; examples include the formation of a shallow pool of cold air or the vertical mixing of the atmosphere. They are more difficult to track and forecast. The vertical profile of wind and temperature is the most useful parameter to monitor for these events.
A ramp forecasting system should alert operators about the occurrence of a ramp at the earliest possible time. For days 3 though 7, only a daily probability of an above-normal ramp is generally possible. The day-head ramp forecast should be more precise, giving the probability of a ramp event for each hour. Within 24 hours, forecasts should include the probability, amplitude (magnitude), and duration of the event. The 24-hour forecast should also include the meteorological feature causing the ramp to aid operators in tracking the event in real time. Finally, the alert system should include hourly ramp forecast updates for situations when a ramp event has been forecasted within 24 hours.
The ramp forecasting system needs to be different from the forecasting system designed to reduce typical errors by
minimizing MAE or other standard metrics. Inevitable phase errors in features causing ramps (such as cold fronts) can produce large errors especially when considering squared quantities such as root-mean-square error (RMSE). For this reason, a forecast system that minimizes MAE or RMSE tends to smooth out power ramps over many hours.
For an aggregate of wind plants, ramps tend to be less rapid (in terms of the percent change in aggregate capacity in a given time period). This is because strong upward ramps at some wind plants tend to be offset or washed out by weaker ramps or steady production at other plants.
Centralized vs. Decentralized forecasting system
One of the most basic issues is whether the forecasts should be provided through a centralized or decentralized forecasting system. In a purely centralized system, one (or more) providers are contracted through a single central entity (such as the grid operator) to provide forecasts for all wind generation facilities within the electric system. The central entity may then provide the forecast information to the individual wind generation resources as well as use the information for its own purposes. In a purely decentralized system, each wind generation resource would contract with a forecast provider or potentially produce forecasts internally without a provider. Each generation facility would then supply the forecast (schedule) to the system operator. Both centralized and decentralized systems have advantages and disadvantages but it is certainly possible to have a hybrid approach that incorporates elements of both.
A primary factor is cost. A centralized system is likely to have a lower total cost because of economies of scale, although that is not guaranteed. A second factor is forecast quality. Forecasts
for larger plant aggregates tend to be more accurate than those for a single plant. However, the aggregation benefit can be achieved in both centralized and decentralized forecast systems. In theory, decentralized systems benefit from greater competition in the market. In practice, however, individual wind project owners may go with the least-cost, not necessarily best, forecast provider. In a centralized system, the grid operator can guarantee quality and reliability by setting appropriate standards, and competition can be achieved through an appropriate bidding process.
A third factor is data utilization. In a centralized system, it is likely that data from all wind generation facilities will be available for use in forecast generation at other facilities. This attribute can occasionally have significant benefit for forecast accuracy since data from an “upstream” facility might be a useful predictor for future variations at a “downstream” facility. In a decentralized system, it is likely that proprietary issues will prevent a vendor from using data at one facility to benefit forecasts at another facility even if both use the same forecast provider. The situation would be even more difficult if the facilities used different forecast providers.
A centralized system will probably ensure more uniform quality. It is also possible that benefits of site-specific customization will not be very significant and that much of the useful customization will be similar at nearby sites. In practice, most customization benefits for individual sites occur for the very short-term look-ahead periods. The centralized system also provides more opportunity to implement a multi-forecaster ensemble since two or more providers could forecast for all generation facilities. This scenario is unlikely to occur in a purely decentralized system. The recommendation is for ISO-NE to implement a centralized forecasting system.
Figure 6. The mean absolute error by forecast hour for 12 months of AWS Truewind (eWind), persistence, and climatology energy generation forecasts for a wind plant in Altamont Pass, California. The eWind forecast did not use real-time plant data.
Wind Energy Forecast Mean Absolute ErrorAltamont All Clusters: Oct. 2001 - Sept. 2002
Proposed control room integration of wind power forecasting
The addition of wind energy to a power system grid increases the amount of variability and uncertainty in net load as compared to the use of energy produced by conventional means. Accurate weather forecasts can reduce this uncertainty, thereby allowing for more efficient use of conventionally produced energy. As the penetration of wind into the power markets increases, the need for a sophisticated integration of wind forecasting for the grid operator also increases. Requirements for high reliability and safety make this integration especially challenging.
The following factors should be considered when integrating wind power forecast systems into the control room:
• Routine forecasts: Routineforecasts would be provided for three look-ahead periods: 0-6 hours (“next hour”), 6-72 hours (“next day”), and beyond 72 hours (medium range).
• RampWarningForecasts:Aseparate ramp potential warning system is recommended. When there is a high probability of a significant ramp event within 24 hours, the system should provide hourly ramp alert updates, giving detailed forecasts that would include the probability, amplitude (magnitude), duration, type, and cause of the ramp event. The day-ahead and medium-range forecasts would only provide probabilities of ramp occurrences.
• SevereWeatherForecasts:A severe weather warning system would indicate the likelihood of events such as high winds, thunderstorms, icing, and heavy snow for at least the next 48 hours. When there is a potential for severe weather within 24 hours, the warning system should deliver hourly updates to operators.
For day-ahead forecasts, only the general potential of high, moderate, or low risk would be provided for each category of severe weather.
• Monitoring:Toenhancebothsafety and reliability, an operator in the grid control room should be dedicated to the monitoring of all of the renewable (variable) power generations resources (primarily wind and solar).
• Visualization Tools: Userfriendly visualization would be needed for the proper monitoring of events that could cause ramp and/or severe weather impacting individual plants and the grid as a whole.
• PlantClustering:Itissuggestedthat pooling of wind plants into clusters will make it easier for an optimized integration of wind power. The geographically distributed clusters would be treated as one large (virtual) wind power plant. The plant cluster could be viewed as a “super plant”. For this purpose, it is suggested that all wind plants that are directly or indirectly connected to one transmission network node will be associated with one wind plant cluster. A wind plant cluster manager would assist the grid operator by operating the cluster according to the requirements of the power generation and transmission system. This approach would have particular value if there were transmission congestion in an area that might require curtailment when a specific aggregate of plants exceeded threshold output.
• Educationandtraining:Inmostgrid systems with substantial amounts of wind power, there is a large need for education and training on how to use wind forecasts effectively. Training topics should address a number of areas such as interpreting e r r o r c h a r a c t e r i s t i c s
for deterministic versus probabilistic forecasts of ramps and/or other events. The discussion should cover the overall forecasting process and a high level review of physical versus statistical models as well as the use of observational data for validation and correcting model biases.
Data requirements The successful operation of a
wind power production forecast system - particularly a centralized system serving multiple wind projects - requires high quality data collection as well as timely and secure communication of input data for the forecasting process and forecasts that result from this process. The exact nature of the data collection and data communication requirements will depend upon the specific objectives and design of the forecast system. The following represents the ideal. Forecasting systems can function with less data, but their accuracy and reliability may be affected.
Categories of Information Required
There are two categories of information required from the wind plant: wind plant parameters and meteorology. The wind plant parameters must include a general description of the plant specifications (provided initially) and a quantification of operating conditions (provided continuously at specified intervals). These data should include the following parameters:
Specifications:
- Nameplate capacity
- Turbine model
- Number of turbines
- Turbine hub height
- Coordinates and elevation of individual turbines and met structures (towers or masts)
Operating Conditions:
- Wind plant status and future availability factor
- Number or percentage of turbines on-line
- Plant curtailment status
- Average plant power or total energy produced for the specified time intervals
- Average plant wind speed as measured by nacelle-mounted anemometers
- Average plant wind direction as measured by nacelle-mounted wind vanes or by turbine yaw orientation
The operating condition data should be provided at intervals that are equal to or less than the intervals for which the forecast is desired. Evidence suggests that providing data at shorter intervals than the desired forecast period may be beneficial for very short-term forecast performance. For example, if short-term forecasts are desired in 15-minute intervals, then operating condition data should be provided at intervals of 15 minutes or less. Ideally, the interval should be at most one half the forecast frequency or more often.
The meteorological parameters should consist of a general description of the meteorological measurement system(s) (provided initially) and the monitoring of ongoing environmental conditions (provided continuously at specified intervals). The parameters should be measured at a separate on-site met structure (tower or mast). More than one met structure is often beneficial for wind plants spread over large areas. A rough guideline is that each turbine in the wind plant should be within 5 km of a met structure. However, it is challenging to give exact spacing criteria as they depend on factors such as local weather regimes, terrain complexity, and availability of nacelle data. If nacelle data are provided, fewer met towers would be needed and only one may be sufficient. Thus, the recommended number and location of met towers should be based on weather regimes, terrain complexity, and availability of nacelle data.
Forecasting
www.EQMagLive.com 19
In general, the met structures should be located at a well-exposed site generally upwind of the wind plant and no closer than two rotor diameters from the nearest wind turbine. The following parameters should be provided.
Meteorological Structure (Tower or Mast) Specifications:
• Dimensions (height, width,depth)
• Type(lattice,tubular,other)
• Sensormakesandmodels
• Sensor levels (heightsabove ground) and azimuth orientation of sensor mounting arms
• Coordinatesandbaseelevation(above mean sea level)
Meteorological Conditions:
Data parameters required at two or more levels:
- Average (scalar) wind speed (m/s +/-1 m/s)
- Peak wind speed (one-, two-, or three-second duration) over measurement interval
- Average (vector) wind direction (degrees from True North +/- 5 degrees)
Data parameter required at one or more levels:
- Air temperature (°C +/1 °C)
- Air pressure (HPa +/- 60 Pa)
- Relative humidity (%) or other atmospheric moisture parameter
Wind measurements on the met structure should be taken at two or more levels, with the levels at least 20 m apart. One level should be within 20 m of hub height. To improve data quality and reliability, sensor redundancy for wind speed measurement at two levels should be practiced. The redundant wind speed sensor at each applicable level should be mounted at a height within one meter of the primary speed sensor.
It is also recommended that at least one of the wind speed sensors nearest the hub-height level be heated to prevent ice accumulation from affecting the accuracy of wind speed measurements.
The meteorological condition data should be provided at intervals that are equal to or less than the intervals for which the power production forecast is desired. For example, if short-term power production forecasts are desired in 15-minute intervals, then meteorological condition data should be provided at intervals of 15 minutes or less. It is also useful if the met data uses the same interval as the generation data or a factor of the interval (e.g. 5 minute met and 15 minute generation data, but not 10 minute met and 15 minute generation data).
In addition to data from the met structure, wind speed and direction data (as well as temperature and pressure if available) from nacelle-mounted instruments should be provided from a representative selection of turbines. Each turbine should be within 75 m in elevation and five average turbine spacings of a turbine designated to provide nacelle data.
T i m e l y a n d S e c u r e Communication
All operational wind plant and meteorological conditions should be recorded and communicated by a central computing system (e.g., wind plant supervisory control and data acquisition system, or SCADA). This process will also ensure that the date and time stamps associated with the different parameters are concurrent. The wind plant SCADA system should have adequate computational and storage capabilities along with real time high-speed access to the Internet. These capabilities will empower the system to automatically generate and archive the requested operational information and make it available for use by the forecast provider and
ISO. The required frequency of data retrieval will depend on the types of forecasts to be produced. If only day-ahead forecasts are required, it is satisfactory for the data to be transmitted from the plant once per day. In general, short term forecasts are recommended but such a need must be determined by ISO operations. If short-term forecasts are required, then the data must be transmitted at a frequency equal to or less than the forecast update frequency.
A key issue in the performance of wind power production forecasts is the consistent availability of high quality production and meteorological data from wind plants. The lack of such data has emerged as one of the biggest obstacles to achieving optimal forecast performance. Thus, it is prudent to consider ways in which a high level of data availability and quality can be achieved when designing a forecast system. One important factor is the complexity of the mechanism that communicates data from the wind plants to the forecast provider. Complex protocols or communication schemes provide more opportunities for data transmission failure. Initiation and maintenance of these schemes requires considerable education of all concerned personnel.
Another important factor is the incentive that wind plants have to maintain their wind-forecasting-related sensor and communication systems. A significant issue in other wind power production forecast applications has been the priority that wind plants place on responding to problems with their meteorological sensor or data communication systems. In some cases, the data flow has been interrupted for a week or more because a computer system needed to be rebooted and no one executed the appropriate command during that period. Thus, data outages that could have easily been limited to hours were extended to more
than a week. This issue suggests that a centralized wind power production forecast system should be designed in such a way as to maximize the incentive of wind plants to maintain their sensor and communications equipment and to respond to problems with these systems as quickly as possible.
ConclusionsWind power forecasting has
been implemented in many countries and grid systems with substantial amounts of wind power. While the methods and system architectures vary widely, in general, state-of-the-art forecasting systems significantly lower the costs and risks associated with intermittent wind generation. Grid operators considering implementing a forecasting system need to consider a number of issues, including: time horizon (next-hour, next-day, and medium-range); whether ramp forecasts are required; whether a centralized or decentralized system should be implemented; how the forecasts are to be integrated into the control room operations; and the data requirements to be imposed on participants.
References[1] Richard Piwko et. al.
2007. Intermittency Analysis Project. California Energy Commission, PIER Renewable Energy Technologies Program. CEC‐500‐2007‐081.
[2] McKay, D., 2008: Wind power forecasting pilot project Part B: The quantitative analysis final report. ORTECH report to the Alberta Electric System Operator (AESO).
[3] California Wind Energy Forecasting System Development and Testing Phase 2: 12-Month Testing, EPRI, Palo Alto, CA, and the California Energy Commission, Sacramento, CA: 2003, 1007339.
Forecasting
www.EQMagLive.com20
Generally speaking, such a bearing is custom designed for a specific
wind turbine to survive at least 20 years. Such a reliability level requires extraordinary measures to be taken during the design process to insure that engineering consideration is given not only to the fatigue life requirement, but also to efficiency, structural integrity, handling, mounting, adjustment, lubrication and sealing. This paper will explore these criteria and steps taken to design a bearing suitable for a 1.5 MW wind turbine generator.
bearings in the gearbox housings support the loads and torque to these gearboxes. A typical modular configuration is shown below in Figure 1.
Designing Large Diameter, Closely Coupled 2-Row Tapered Roller Bearings For Supporting Wind Turbine Rotor LoadingThe Timken Company, Douglas Lucas, Thierry Pontius
Direct drive wind turbine generators require use of large diameter, closely spaced two-row tapered roller bearing to support the complex schedule of rotor loading. These bearings are ideally suited for such applications because of their ability to carry heavy radial and thrust loading in various combinations; because their design is built around the concept of zero slip which minimizes wear over long periods of operation; and because their internal clearance can be optimized with preload to help insure excellent system stability even in the heaviest of wind conditions.
Another design is the direct drive generator design. This style WTG eliminates the gearbox and often incorporates a large diameter three-row roller bearing design. A
cross-section of the three-row roller bearing is shown in Figure 2. The 3-row roller bearing, referred to in this paper as a 3-row CRB, uses two rows of cylindrical thrust rollers and one radial cylindrical row. This bearing was originally used in slow moving or oscillating slewing bearing applications and has been adapted to some WTG applications.
The primary features and functions of the 3-row CRB include:
The two rows of thrust rollers support the axial loads (Fx)
and overturning moments (My, Mz). The Germanischer Lloyd coordinate system in Figure 3 is used to define the
important load directions.
• Thesebearingshaveaveryhighoverturning moment capacity and maintain a very high axial stiffness.
• The radial rows have amoderate radial load carrying capacity.
• The radial row is typicallymanufactured to have clearance, while the axial rows are designed to be lightly pre-loaded.
• Theoperatingbearingpre-load is sensitive to amount of surface wear.
• The3-rowCRB is typicallyproduced pre-sealed and grease lubricated.
• Retainerstypicallyseparatethe rollers.
• Specialfeaturesandmountingconfigurations are available for various applications.
An alternative to the 3-row CRB is to use a close-coupled two-row tapered roller bearing
FIGURE 1 - Typical Gearbox Wind Turbine Design
FIGURE 2 - Example Of A Typical Three-Row Roller Bearing
FIGURE 3 - Germanischer Lloyd Coordinate System For Rotor Hub
Technology
www.EQMagLive.com 21
or 2-row TRB (see Figure 4).
The primary features and functions include:
• Only two rows of rollersare used to support all combinations of radial, thrust, and moment loading with a proven true-rolling motion design to minimize skidding and the associated wear.
• Thesebearingshaveahighoverturning moment capacity and can maintain a high axial stiffness, while maintaining some compliancy.
• The2-rowTRBwillbepre-loaded to optimize the load zones, and improve the bearing L10 fatigue life and dynamic stiffness. It can be pre-set at the bearing factory before installation into the wind turbine.
• Becausethebearingisclose-coupled, it can be manufactured as separate components, or it may be unitized into a non-separable assembly to simplify handling and installation.
• The2-rowTRBcanbedesignedto be pre-greased and sealed, similar to the 3-row CRB.
• Full roller complementswithout retainers (see Figure 5) are available to increase the maximum dynamic bearing capacity. Coatings may be added to further increase bearing life.
• Thebearingscanbedesignedwith normal sections for the
tapered double outer (TDO) or tapered non-adjustable (TNA) type configurations for lowering the bearing costs.
•Specialfeaturesandmountingconfigurations are available for various applications.
Bearing Load SharingTrue-rolling motion is designed
into the 2-row TRB to minimize sliding or skidding between the rollers and the raceways. This
reduces the potential for raceway surface
wear leading to excessive clearance in the bearing.
The load zone is the angular loaded portion of the raceway measured in degrees. Figure 6 shows the loaded roller in a 180° load zone. Assuming unchanged external
loads, as the bearing load zone decreases, the number of rollers sharing the load decreases, the rollers will have a higher contact stresses, and bearing fatigue life
decreases. Load zone may decrease as a result of increased bearing clearances caused by wear and may result in lost traction between the rollers and races
These traction losses may result in sliding or skidding rollers. The occurrence of some non-fatigue related bearing failures may be eliminated by pre-loading the 2-row TRB and increasing the load zone. It will also eliminate stress concentrations that result from mis-alignment of the rolling
elements as a result of bearing clearance, something a 3- row CRB does not do.
Design of the 2-ROW TRB
A typical close-coupled tapered roller bearing for mainshaft applications is composed of a double outer race [A] (or cup), and two inner races [B] (or cones), two rows of rollers [C], and a retainer [D] (cage) for each roller row as shown in Figure 7. Depending on the design, the bearings might not utilize a cage, in which case full complement of rollers are used instead. Additionally there can be some means of unitization to hold the bearing together as one piece for installation. The intersection of the bearing centerline and the angled dashed lines in Figure 7 define the effective bearing spread for counteracting the overturning moments.
There are many design consideration required for the 2-row TRB for mainshaft applications. These details must be carefully considered and balanced in order to obtain
a bearing that is optimized for performance, price, and manufacturing. The primary features of the bearing that must be considered in the design phase are discussed below.
•MeanPitchDiameter
This is the average of the bore
and outside diameter of the bearing. In many cases the customer limits the available space for the bearing. However a bearing with
a large mean diameter will provide a increased fatigue life and increased resistance to overturning moments.
•IncludedCupAngle,E
This parameter will be balanced based on the available
envelope and will be optimized for performance. All portions of the load cycle, including extreme loads, are analyzed to get the best performance. The cup angle will define how well the bearing will perform against the overturning moments by defining the effective bearing spread.
It will also affect the axial load capacity, fatigue life, operating efficiency, maintenance of load zone, setting, handling and mounting, and fatigue life. Radial capacity reduces
with an increasing angle. A reasonable range for a 2-row TRB in a mainshaft application is 60° - 90°.
A smaller cup angle will be more
compliant to make initial bearing setting less critical, however the effective bearing spread would also be reduced. Figure 8 shows
FIGURE 4 - Typical Direct Drive Generator Wind Turbine Design With A 2-Row TRB
FIGURE 5 - Full Complement 2-Row TRB
FIGURE 6 - Example Load Zone Definition Diagram
FIGURE 7 - Typical TDO Bearing Components And Features
Technology
www.EQMagLive.com22
how the axial preload varies with differing cup angles and bearing setting values. The larger cup angle (135°) is significantly stiffer than the smaller cup angles (90° and 60°). As the included cup angle approaches a thrust bearing (180°), the stiffness will be extremely high and the bearing preload will be very sensitive to wear.
•IncludedRollerAngle,F
The included roller angle should be minimized to reduce the induced thrust load on the cone rib, reduce the rib-roller contact stresses, and reduce the rib-roller sliding friction that generates heat and powerloss. With these considerations the design will be less prone to scoring and scuffing in the rib-roller contact areas. Again a balance must be achieved between the roller angle, bearing pitch diameter, and cup angle to achieve a small roller angle. A larger mean pitch diameter and smaller cup angle will both allow for smaller roller angles and still keep the apex converging on the bearing centerline.
•MeanRollerDiameter
The mean roller diameter, the average of the large and small end diameters, effects the bearing fatigue life. A smaller diameter roller will increase the number of rollers in a bearing, increase the roller surface speed, and will
result in an increased strength. However it will also reduce the bearing capacity because of increased stresses from reduced Hertzian contact areas. With higher speeds, the rollers will be subject to an increased number of fatigue cycles which will reduce the bearing fatigue life.
•FullComplementofRollers
Using a full complement of rollers, ref. Figure 5, is considered in applications where unitization of the bearing is used or where the size of the bearing is so large that typical bearing retainers or cages may not be feasible. The increased number of rollers increases the bearing capacity. The number of rollers affects the natural frequency of the bearing and typically a prime number of rollers is used. The full complement design is limited by speed, but the limitation can be overcome by the addition of coatings to the roller to increase the scuffing resistance.
• Race Wall Sections forSupport Structures
Wall sections typically are maintained for manufacturing reasons to reduce distortion. However with 2-row TRB’s used as support structures also need to be analyzed with FEA to reduce the effect of bolt clamp loads on race profiles or deformation from high external loads. These races of
the support structure bearings are not pressed into housing or onto shafts, but are attached by bolt or other means to the surrounding parts.
Bearing Fatigue Duty Cycle
The bearing fatigue duty cycle received from the customers can have a significant influence on the size and geometry of the mainshaft bearing designs. A concern is that adding conservatism by oversimplification of the duty cycle will result in a negative cost structure. Some manufacturers use hundreds of conditions in the duty cycle,
some use tens of conditions, and others yet will use a single condition duty cycle.
Clearly some variation in bearing size and life calculation can be attributed to design variations in blade diameter and wind turbine location.
Figure 9 shows the bearing life depletion rate of the first 100 conditions of
differing duty cycles. It is shown that duty cycle “C” depletes 58% of the bearing life in 100 conditions and cycle “E” depletes all of the bearing life in just 25 conditions.
Duty cycles are typically generated by using design programs
to model the wind turbine system, typically with an output at 20-Hz. The high frequency of data provides a vast number of snap shots of the system, even for short time intervals. All this data must be sorted and binned in useful categories, using the arithmetic average bin value, for fatigue analysis. Variation in this short time is graphically shown in Figure 10. The complete data is then sorted into bins and the time durations in each bin is summed to determine the percent time each condition contributes to the duty cycle.
Bin size should be determined methodically for the speed and loads by understanding the
effect on the bearing system. The recommended order of importance of the data for proper bearing is:
RPM
The bearing speed will affect the development of the film thickness (lambda ratio, the ratio of the film thickness to the surface finish) and ultimately affect the predicted bearing life.
Pitch Moment, My
The pitch moments contribute significantly bearing life reduction. Wind speed vertical distributions create these high moments and adjust the loading on the bearing rows in the XZ-plane that are a result of the rotor mass.FIGURE 8 - Bearing Axial Stiffness For Various Included Cup Angles
FIGURE 9 - Cumulative Life Depletion From Various Turbine Manufacturers Duty Cycles
Technology
www.EQMagLive.com 23
YawMoment,Mz
The yaw moments are perpendicular to the pitch moments and may be either clockwise or counterclockwise with respect to the tower axis. Consideration of the yaw moments can be simplified into absolute values without having a large effect on the bearing fatigue life calculation.
Radial Load, Fz
The radial load is relatively constant as a result of the weights of the rotor hub, blades, and generator.
Axial Load, Fx
In many cases the axial load
is relatively constant for most
condition in the duty cycle. A
small number of coarse bins can
be used.
Radial Load, Fy
The yaw loads are small
compared to the pitch loads and
are not as critical to the bearing
fatigue life depletion.
Advanced Life MethodsThere are many assumptions
and simplifications that are used
in a TRB bearing catalog life
calculation. This includes:
•Bearingloadzoneis180°
•Lubricationfactor does not
include surface finishes.
•Bearingalignment is assumed to be less than 0.0005-rad.
Advanced life methods can be used to more accurately determine the bearing fatigue lives to obtain the most bearing for the given resources. It is suggested that wind turbine manufacturers contact their approved bearing suppliers for advanced bearing life analysis. There are several life adjustment factors included in advanced bearing
analysisinSYSx,aproprietaryelement based computer simulation software of the author’s company.
•LoadZoneFactor,a3k
As the bearing loading changes, the load zone will change. In multiple condition duty cycles, the load zone can change dramatically and will affect bearing performance.
This factor takes into account the change in roller loading on bearing life. Figure 11 shows that a reduction in bearing preload on the unseated bearing will lead to a reduction in load zone for a range of conditions. One might conclude to increase the dimensional preload beyond 0.30-mm to ensure both rows are well seated under the heaviest loads. The preload would need to be increased significantly to dramatically
increase the load zone above 110°. Figure 12 suggests that an
increase in preload over
the optimum -0.30-mm would lead to a reduced bearing system life. This shows that it is very important to have a proper duty cycle. An incorrect setting specification resulting
from an improper duty cycle or simplified set of conditions may lead to reduced bearing system life and excessive heat generation.
•LowLoadFactor
Predicted bearing life will be more accurately calculated for low loads when a stress life response
factor (low load factor) is used. This factor will more accurately predict the life of a lightly loaded bearing as a result of a change in the Weibull slope resulting from a low stress state.
•LubricationFactor,a3l
Bearing fatigue life can be adjusted to either improve the life in the case of higher lambda ratios or reduce the life in case of low lambda ratios. It is important then to
look at these lubrication conditions to adjust the bearing design.
•AlignmentFactor,a3m
The shaft alignment cannot be guaranteed in a wind turbine application because of the high loads and overturning moments.
Mis-alignments will increase edge stresses in roller bearings, resulting in a GSC spall (geometric stress concentration). Race profiles can be recommended to remedy this situation.
FIGURE 10 - 5-Second Snapshot Of Data From Design Program
FIGURE 11 - Varied Loads And Setting Effect On Load Zone
FIGURE 12 - Setting Vs. Weighted Life For Outboard And Inboard Bearings And System.
Technology
www.EQMagLive.com24
An FEA approach has been addedtoSYSxtoprovidefurtheroptimization and accuracy to the bearing life simulation by predicting race out-of-round deformation conditions that change the bearing load zone and potentially decrease bearing fatigue life. Because the loads will affect the bearing race displacement, it is critical to evaluate applications, where the race or housing sections are thin. The 2-D FEA mesh generator builds a compliance matrix for the race or housing; this is used to determine the out-of-round or ovalization of the bearing races. Figure 13 shows a classical 360° load zone distribution for uniform, circular races. Using the 2-D Housing Modeler for the same application, the roller-race load zone changes as shown in Figure14.
The irregular shaped circular line is the deformed raceway, while the radial lines represent the roller loads. The load distribution, race deformation, and bearing life
are strongly affected by the compliance matrix.
Reliability Requirements
There have been many bearing life requirements from various customers. Some have used 150,000 hours, while others have used 175,000 or even 200,000 hours for an L10 life (90% reliability). As seen in Table 3, the required calculated L10 fatigue life for a 20 year design life increases with increasing reliability requirements in order to obtain the required reliability of 150,000 hours, assuming a Weibull slope of 1.5. Also shown in a 30-year life design. The Reliability Factor, a1, is multiplied by the L10 to attain the Ln life of 150,000 or 225,000 hours for a 20 or 30 year life, respectively. It is important to understand that the reliability requirements are defined for failure by fatigue spall. There
are other types of bearing failures that may occur in the application that are not protected against by traditional fatigue durability analysis. These include, but are not limited to:
•Scoring
Scoring may occur on a roller bearing if the end of the roller contacts an improperly lubricated.
•Skidding
Skidding will typically occur if there are insufficient traction forces between the roller and the raceways as a result of low bearing pre-load, a low load zone, or an offapex design.
• Brinelling and FalseBrinelling
Brinelling results from permanent deformation or yielding in the part. False brinelling is commonly seen when the rollers are not rotating and oscillate back and forth along the direction of the rotational axis of the roller.
•StructuralIssues
Structural issues may be related to sections of the inner or outer raceways that may be used as structural member to transmit the load instead of using a housing
FIGURE 13 - Example Load Zone Utilizing Uniform Race Deformation
or shaft to transfer the load.
•Heatandseizure
Improperly defined bearing
setting and improperly mounted
bearings can result in excessive
heat generation and bearing
seizure.
Retainers and Unitization
There are a limited number of
options for roller retaining devices.
Pin style cages, polymer cages, and
roller separators have not been
accepted in the wind turbine
industry due to reliability
concerns. A machined “L” style
steel cage may be too costly to
manufacture for large
diameter bearings.
Some viable options
for the 2-row TRB
are:
•Precisioncut“L”
style cage
•Nocage-fullroller
complement
The precision
cut cages are similar
to the traditional
stamped steel cages
used on smaller
bearings, however
they are manufactured
FIGURE 14 -Example Load Zone Using Non-Uniform Race Deformation
by other means, which may include:
• Fullmachining
• Formingtechnology
• CNC con t ro l ledprecision cutting
The size of the bearing retainer makes it difficult to close the cages around the rollers like traditional stamped steel cages. In some cases a means of axial retention is added to hold the rollers in place after assembly. The inner
race assembly can then be handled separately from the outer race without a need of unitization. If no cage is used, then the full complement of rollers typically requires bearing unitization to retain the rollers.
There are several design considerations when using a full complement of rollers:
•Maximumallowablespeedislimited to prevent metal transfer from roller to roller.
•Diamond-likecoatings(DLC)on rollers will allow for increases in speed and will enhance bearing performance by altering the surface finish and improving the lambda ratios. The bearing life will be improved, particularly in low lambda conditions, by reducing adhesive metal transfer.
• Unitization will simplifybearing setting, installation and removal, and may eliminate incidental damage to rollers during turbine assembly.
LubricationThe primary consideration as
with all bearing applications, is that there is a sufficient oil viscosity to maintain proper strength. Because of the low speed of the mainshaft bearings, grease is a very viable alternative and is typically used in mainshaft pillowblock designs. Oil
Technology
www.EQMagLive.com 25
will work just as well for the 2-row
TRB mainshaft bearings.
Although grease may result in
a thinner film thickness, it is the
preferred option for direct drive
WTG applications. It will have a
lower chance of leakage, will not
migrate at easily, and will exclude
containments more effectively that
oil.
Common considerations for the
grease selection process include:
• Higherviscosity(ISOVG460or
320) is better for maintaining
good strength.
• Synthetic base oil with high
viscosity index (VI) will provide
better lubrication over a larger
temperature range.
• Excellentwater,rust,oxidation,
and corrosion resistance is
important for extended grease
lives.
• Lowtemperatureoperationand
pumpability may be required in
some applications.
SealsSealing is more critical in
direct drive generator wind
turbines. The generator may be
damaged if oil or grease enters it.
Typically non-contacting labyrinth
seals are used to seal bearings and
gearboxes in wind turbines. The
problem with labyrinth seals is that
they control the rate of leakage
but do not eliminate it. Therefore
it is most effective to have a series
of seal types working together
to eliminate leakage of grease
or oil from the bearing systems.
Conventional polymer sprung lips
seals will work but may not last 20
years; provisions should be made
to periodically replace them. By
using a unitized, 2-row TRB in the
mainshaft position, a fewer number
of seals may be required and the
seals can be easily incorporated
into the bearing assembly at the
manufacturing plant.
ConclusionAs presented in this paper,
there are many considerations that
must be taken into account when
designing a mainshaft bearing to
last 20 years in a wind turbine
application. Understanding of
the WTG system is important for
ensuring that the proper bearing
selection was made. This paper
has presented many of the criteria
that need to be examined during
the selection and design of the
mainshaft bearing for a direct
drive WTG. Advanced modeling
techniques will help to ensure
that the bearing is efficiently and
proper selected for the application
without being overly conservative
and adding prohibitive cost.
The closely spaced two-row
tapered roller bearing was shown
to give advantages over the typical
designs currently available due to
the ability to carry heavy thrust and
radial loads and maintain a tight
connection between the rollers and
the races through pre-load.
Technology
24-25 May 2011 Le MeridienNew Delhi, India
Enhance your presence in one of the most promising markets for renewables Meet the people you need to further your business in a challenging climate Capitalise on market opportunities through shared knowledge and experiencesBring your project to fruition with the financial support you needDrive forward future policy strategies for the renewables sector
Register by 15 April 2011 & SAVE �150
The premier event for renewable energy finance in India
�
�
�
�
�
Sponsor
Supporting Organisations
Reff India (Int.) 14/2/11 16:31 Page 1
AGENDA AT A GLANCE
3
DAY 1: TUESDAY 24 MAY 2011
SESSION 1: Moving the market forward
SESSION 2: Gauging opportunities for lenders
SESSION 3: Encouraging equity and investment
SESSION 4: A response from energy majors
DAY 2: WEDNESDAY 25 MAY 2011
SESSION 5: Interpreting market indicators
SESSION 6: Sunny solar opportunities
SESSION 7: Technologies of interest
SESSION 8: Carbon finance
About the OrganisersA division of Euromoney Institutional Investor PLC, Euromoney Energy Events delivers high-profile eventsfor energy and finance professionals worldwide. Our flagship Renewable Energy Finance Forums startedin 1999, in London, and have grown alongside the burgeoning renewable energy industry into a seriesof internationally renowned events, catering to over 2,500 professionals each year. These include REFF-London, REFF-Wall Street, REFF-West, REFF-China, REFF-Central & Eastern Europe, REFF-Canada, REFFLatin America & Caribbean and REFF-India. We are expanding the REFF portfolio of events to new andexciting markets in 2011. For more information visit www.euromoneyenergy.com.
Investment ForumAttention Entrepreneurs! Enter your renewable energy proposal toa team of distinguished investors looking for new ventures to investtheir capital in.
This session is being organised under Euromoney Energy Events by Aloe Private Equity. It will allowentrepreneurs, technology start-ups and small developers to share their projects with members of the financialservices community, venture capitalists, private equity investors, and renewable energy experts. Eligible projectswill be 25MW or less and will be seeking seed capital of $500,000 or less. Only a limited number of proposalswill be selected to receive a complimentary pass to REFF-India where they will showcase their projects.
Submit your proposal electronically at www.reff-india.com before the 17th of April 2011. Good luck!
Venue: Le Meridien, New DelhiLe Meridien New Delhi is situated two kilometers
from Rashtrapati Bhawan - the home of thePresident of India, the Presidential Palace,
Parliament House, and ConnaughtPlace. The city centre hotel is set
amidst the most alluring shopping andentertainment districts in New Delhi. The
hotel is 20km/13 miles from IndiraGandhi International Airport (DEL).
Accommodation is available atthe Le Meridien hotel at a
special rate. Please visitwww.reff-india.com to book
your accommodationthrough the hotel.
Organised by
Hear from:Rajat MisraProject Advisory &Strategic Finance,SBI Capital Markets
Government of IndiaMinistry of New andRenewable Energy
Reff India (Int.) 14/2/11 16:32 Page 3
24-25 May 2011 Le MeridienNew Delhi, India
Enhance your presence in one of the most promising markets for renewables Meet the people you need to further your business in a challenging climate Capitalise on market opportunities through shared knowledge and experiencesBring your project to fruition with the financial support you needDrive forward future policy strategies for the renewables sector
Register by 15 April 2011 & SAVE �150
The premier event for renewable energy finance in India
�
�
�
�
�
Sponsor
Supporting Organisations
Reff India (Int.) 14/2/11 16:31 Page 1
“It was a focused event, well attended by
the relevant stakeholders in the Indian RE segment.”
Of all the renewable sources of energy, wind energy has an
exponential growth in India which has been mainly driven by progressive State level legislation, including policy measures such as the renewable portfolio standards and the feed-in-tariffs.
Approach and Paradigm Shift
Recently, there has been a paradigm shift in the power sector policies which not only emphasizes the overall efficiency of power sector operations but also emphasizes the promotion of renewable energy sources with enactment of various regulations such as the Electricity Act 2003 and the National Electricity Policy 2005.
The Indian Government’s stated target and avowed objective is for the renewable energy to contribute to 10% of the total power generation capacity and have a 4 to 5% renewables share in the electricity mix by 2012. This means that renewable energy should grow at a faster rate than the traditional power generation accounting for around 20% of the total added capacity planned in the 2008 – 2012 timeframe.
There is an urgent need to promote renewables in the present power sector in a sustainable and eco-friendly manner. Developing infrastructure, meeting energy needs, eradicating poverty and social development have to be achieved without compromising on the environment while maintaining ecological balance along side. Various provisions for promotion of renewable sources of energy in a restructured power sector are imperative in the present context.
Acceleration Of Renewable Energy With Emphasis On Wind Energy Through Pro-Active National Policies In IndiaK.V.S.Subrahmanyam, General Manager (Power), MSPL Limited
Wind Power is one of the most promising sources of renewable energy today owing to its commercially viability. Wind energy can play a key role in helping India attain the 15% renewable energy mark by 2020 as targeted by the National Action Plan for Climate Change.
Wind Capacity AdditionThough the capacity addition
has reached a target of more than 12000 MW, the growth of the wind power sector is hampered by the issues such as land acquisition, an uncertain regulatory framework, difficulty in logistics, challenges in grid interfacing.
The 48,500 MW potential of wind power is a conservative estimate and with the growth in unit size of turbines, greater land availability and expanded wind resource exploration, this potential should go-up significantly.
The recent developments in the policy structure auger well for growth of wind industry in the country. The policy and the regulatory push in the form of GBI (Generation Based Incentive) & REC (Renewable Energy Certificate) along with the inclusion of wind generation in the National Grid Code, reinforces the
seriousness of the policy makers and regulators in promoting investments in this sector. These developments have already started impacting the Industry structure, which is witnessing more serious players entering the segments.
It is, therefore, important to harmonize Central and State level policies and regulations for the sector to scale-up the capacity at a faster pace.
After setting a steady growth trend in the past few years, the wind power in India reiterated rather disappointing results for 2009 which was quite unexpected. With established manufacturing base and support infrastructure, the industry is well set to take a lead.
We are passing through a period of “wind power rush” driven by the Governments liberal package of incentives, capacity addition through private participation.
Period of Stable GrowthFrom the beginning of the new
millennium, the growth curve of the wind power sector expedited signs of persistent rising. Electricity Act 2003 provided the stimulus for its development. Though, the act became operative not before 2005, its passage itself after prolonged
deliberations at Government levels was widely acclaimed and has piqued the enthusiasm of the investing public.
More than half a decade after the passage of Electricity Act 2003, the access to the utilities grid (public supply grid) has not been as easy as expected and calls for long waiting time at many proposed sites. For a fluctuating nature of power supply through wind, different States have different approaches on power banking.
Key factors responsible for the growth of Wind Power
a. Low gestation periods for setting-up wind energy projects with quick return.
b. Conducive Government Policies.
c. Large number of financing options available for capital equipment.
d. In crea s ing awarenes s among industry that being environmentally responsible is economically sound.
e. The significant resources coupled-with the continued Government support makes the need a very attractive location for renewables development
Policy
www.EQMagLive.com 27
Main focus areasa. Grid interaction wind energy
generation systems.
b. Wind energy for urban, industrial and commercial applications.
c. Wind energy for rural applications.
Market EnergyRecognizing the enormous
potential of renewable energy technologies like wind, the GOI has issued guidelines to all State Governments in India articulating the policies that States’ should follow to attract private sector investment and promote commercial projects in the renewable energy sector.
The GOI is encouraging foreign investors to establish renewable energy based power generation projects on the BOO, ie., Build, Own and Operate model.
The GOI also provides exemptions / reductions in the excise tax duty on the manufacturer of most renewable energy systems and devices. For example, the electricity generator and pumps running on the wind energy.
The GOI provides soft loans on favourable terms to manufacturers and users for commercial and near commercial technologies through the Indian Renewable Energy Development Agency “ (IREDA) ”.
The renewable energy industry is identified as a priority sector by the Reserve Bank of India to obtain loans from banks. The GOI provides a facility for 3rd party sales on renewable energy power.
Government IncentivesState Electricity Regulatory
Commissions have been mandated to promote renewable energy through renewable purchase obligations which require discounts to source upto 10 to 20% of their power from renewable energy sources.
The key wind energy incentives include a provision for 80% related accelerated depreciation in the 1st year, a 10 year tax holiday, income tax waiver on power sold to utilities on favourable tariffs.
Projects that do not claim accelerated depreciation are entitled to generation based incentive that provides 50 paise per Kwh of power sold for independent power producers with a cap upto 4000 MW.
ExclusiveMost of the pro-active States
like Karnataka have accorded an Exclusive Status for Renewable Energy Projects such as Wind Power:
(a) Must Run Status.
(b) Exemption from Merit Order Dispatch.
Policy Network for Renewable Energy Development:
The National Electricity Policy 2005 stipulates that progressively the share of electricity from Non-conventional sources would need to be increased.
Central Government Policy
The spread of various renewable energy technologies have been aided by a variety of policy and support measures by Government. The Prime Minister of India at the All India Full Planning Commission Meet at New Delhi on 1st September 2009 said “A rational energy policy, with an appropriate policies for renewable and non-conventional energy sources is also important for climate change. We need to dovetail our strategy for energy with our National Action Plan For Climate Change ”.
Benef i t s under Clean Development Mechanism
The Kyoto-protocol has created a favourable climate for international support and mobilization for renewable
energy development. The clean development mechanism provides avenues for earning Carbon Credit and mitigation of green house gases under UNFCCC.
As per CERC Notification dated 16th September 2009
(a) 100% of gross proceeds on account of CDM benefits are to be retained by project developer in the first year after the date of commercial operation of the generating station.
(b) In the second year, the share of beneficiaries shall be 10% which shall be progressively increased by 10% every year till it reaches 50% where after, the proceeds shall be shared in equal proportion by the generating companies and the beneficiaries.
It is to be mentioned here that this particular Notification of CERC has an adverse impact on the interests of IPPs rather on the revenues of IPPs.
Policy measures in vogue
A host of fiscal incentives and facilities are available to both the manufacturers and users of renewable energy systems, which include:
1. No excise duty on manufacture of most of the finished products.
2. No import tariffs for capital equipment and most of the materials and components.
3. Soft loans for manufacturers and users for commercial and near commercial technologies.
4. Facility for Banking and Wheeling of power.
5. Facility for 3rd party sale of renewable energy power.
6. Allotment of land on long term basis at token lease rent.
7. Special thrust for renewable energy in North-Eastern region of the Country. 10% of the
planned funds earmarked for North-East towards enhanced special subsidies.
State Government Policies
C o n s e q u e n t t o t h e announcement of policies by Government of India, the State Governments’ have also announced promotional policy packages in the form of Wheeling, Banking and Buy-back Guarantee and considerable tariff escalations for wind and other renewable energy projects. In fact, in may States’, the State Government’s promoted renewable energy development agencies / nodal agencies who are playing a catalyzing role in the development of renewable energy. Some of the States’ like Rajasthan and Karnataka have also set-up single window clearance for renewable energy power projects to facilitate quick and hassle-free approvals and clearances for such projects.
Integrated Policy of India
The Government of India has formulated an integrated energy policy covering all sources of energy including renewable energy sources in December 2008. The policy documents have highlighted the need to maximally develop domestic energy supply options and diversify to alternate energy sources. The main features of the policy include:
Incentives for promoting the renewable should be linked to outcomes (energy generated) and not just to outlays (capacity installed).
Power Regulators should create alternate incentive structures such as mandated feed-in-laws or differential tariffs or specify renewable portfolio percentage in total supply.
We have instances wherein in some of the proactive States like Gujarat, Maharashtra, Rajasthan and Karnataka, the success of IPP
Policy
www.EQMagLive.com28
Author’s introduction
Shri KVS Subrahmanyam has had a consistently brilliant academic career all through with distinctions in BSc & BE.A gold medalist for having secured the 1st rank in Engineering. A power engineer worked through-out in power projects by contributing more than 50 technical papers to
projects has been driven by the strong regulatory incentives and a good overall institutional ‘ fit ’ between the regulatory system and the political and the governance institutions in the States.
Laudable efforts of the State Governments:
In keeping with the policies of Government of India, namely, that of MNRE, the efforts of State Governments on core issues as mentioned below are indeed laudable:
• Land identification forrenewable energy projects,
• Forestlandissues,
• Landdevelopment,
• Renewable energy specialeconomic zones,
• Singlewindowclearances,
• Evacuationarrangement,
• R e n e w a b l e e n e r g yobligation,
• Feed-in-tariff,
• Wheeling and Bankingfacilities,
According to Development Counselors International (DCI), a US marketing company, “ India is the 2nd best country after China for business investments. This is because, India’s labour including its supply, skill levels and cost is the main reason for this positive perception ”.
To get the best out of the wind farms
The annual energy out-put of any wind farm depends on:
1. Grid availability,
2. Machine availability and
3. Array efficiency.
But, unfortunately, in few cases, the perceptions of the developers (suppliers) are totally in variance with that of the promoters of the projects, namely, IPPs, particularly in case of the grid availability and machine availability.
The point to be emphasized here is wrong interpretations on the grid availability, mixing the internal grid with the external grid and also on the machine availability aspect. These issues are in fact leading to perpetual disputes between developers and the promoters of the project forcing the IPPs to take-up the matters in the Courts of law.
Further, Policy initiatives like the Generation Based Incentive (GBI Scheme) and the Renewable Energy Certificates (REC Mechanism) are expected to incentivize future wind capacity addition.
While, States like Karnataka and Tamil Nadu exceeded their RPO targets, most other States did not meet their RPO targets during 2008-10. Therefore, there is a need for a strong enforcement mechanism for the RPO scheme to succeed which in turn will drive the REC market.
REC FrameworkThe emerging REC framework
devised by the Regulatory Authorities provides an alternative to the current Preferential Tariff regime and is based on a market oriented approach to promote Renewable Energy.
The REC regulations stipulate eligibility criteria for participating in REC Trading. The criteria includes:
(1) RE Generators who do not have PPAs or have naturally ended the tenure of the PPA with a Distribution Licensee on a Preferential Tariff.
(2) RE Generators who have a PPA at or less than the pooled power cost of the State Distribution Utility where the project is located.
(3) RE Generators who use Power for captive consumption or sale to a Third party and have not availed any benefits such as Concessional Wheeling and Banking and also those who
sell power in the Open Market or Power Exchange.
The key steps for the RE Generator involve:
(a) Accreditation through the State Nodal Agency.
(b) Registration through the National Load Dispatch Centre and
(c) Trading and Redemption t h r o u g h t h e Pow e r Exchanges.
The entities have to apply within six months before the Commissioning of the Plant while for the renewals of the REC, the application has to be submitted Three months in advance.
Power Exchanges enable Price discovery for RECs due to independent bidding.
Since REC is a new concept that is being adopted, many States are yet to spell-out their minds to crystallize the same.
The financing community is of the view that the Accelerated Depreciation Scheme offers good returns to the developers / promoters. Thus, even though, the GBI scheme which was introduced in December 2009, offers a cost
incentive of 0.50 paise per Kwh over and above the feed-in-tariffs for 10 years, it will take some time for the scheme to meet with success as its scope has just recently been widened. Earlier, the benefit under this scheme was available only for a smaller capacity of upto 49 MW, but it has now been extended to 4,000 MW. It is also seen that the GBI scheme is becoming popular with Independent Power Producers like NTPC, Tata Power and CLP.
ConclusionRegulatory incentives play a
very important role in ensuring the success of the IPPs. It is, therefore, absolutely necessary to ensure proper institutional ‘ fit ’ of the overall regulatory apparatus with the existing institutional endowment of the State which is extremely important. Specifically, a proper regulatory and governance structure that ensures the regulators can perform their task independently with adequate involvement of all the relevant stake-holders has all the priority and significance. They also need to ensure that the regulatory incentives are designed in such a way to make the IPP projects commercially viable.
Policy
various National and International Conferences.
He was the 1st Executive Engineer to start the prestigious project works of the Kaiga Nuclear Power Project of GOI in Karnataka (1983-88). As Chief- Engineer, Projects and Additional Secretary, Energy Department, Govt. of Karnataka (1999-2002), he was largely responsible, as a policy maker, for the implementation of the highly prestigious IPP Projects such as the 220 MW Barge Mounted Combined Cycle Power Project in Mangalore, the Jindal Coal-cum-Corex Gas Power Plant of 2x130 MW at Thoranagallu in Karnataka, the 81 MW Liquid Fuel power Project of Tata Power company at Belgaum.
The informationyou need to getfrom A to B
A B
No matter where you are in the project life cycle, 3TIER can fill critical resource
information gaps and help move your wind or solar project forward. For over 10
years we have provided the resource intelligence the world's most successful
renewable energy developers and operators rely upon to make critical
decisions. Leaders in scientific innovation, 3TIER helps you identify the best
locations for development, quantify long-term production potential and
resource variability risk, and accurately forecast operational production.
About ten years back, the wind energy industry was focusing towards
technology, upgradation to high capacity, etc. At that point of time, both Wind Turbine Manufacturers and Wind Farm Developers never thought that land availability and the grid connectivity is going to become such a serious issue. Today, the problem has become a magnificent issue and that needs to be addressed.
Utility companies (State Electricity Boards) started enforcing many conditions on grid connectivity, like creating own sub-station by Wind Farm Developers
/ Wind Turbine Manufacturers, exclusive feeder for connecting wind turbines, etc. Moreover, they are also focusing their discussions towards generation, based incentives rather than captive consumption. The infrastructure development charges (IDC) has also gone up tremendously due to the increased cost of capital equipments, spares and consumables, apart from increased operating and maintenance cost.
To add to the above, the availability of land is becoming a major threat since potential wind sites had all been exhausted and the remaining available sites are
generally low and medium windy
ones. Hence, there is a demand
for wind turbines suitable to
operate only on low and medium
windy sites i.e. Class III A&B wind
sites. The cost of the land has also
considerably gone up due to the
awareness of the land owners / land
brokers. Due to less land availability
especially in very remote areas, the
transportation of heavy equipments
like nacelles, blades, towers, etc.
is also becoming more and more
difficult.
Considering all the above,
the wind turbine manufacturers
and wind farm developers have to
start thinking on sites with low and medium wind, along with improved technology based turbines like increased hub height, increased rotor diameter, gearless model wind turbines with permanent magnet generators, gear model wind turbines with doubly fed generators in the range of MW capacities, etc. all with variable speed and variable pitch technology.
The above said changes in scenario will only operate the industry to continue to have the benefits of wind energy as a whole in our country. Like in Europe, the time is now not far away to think on off shore wind turbines.
The wind research experts need to adopt advanced analysis techniques to
optimize wind farm efficiency & to identify new windy sites. The advance analysis model based on computational fluid dynamics (CFD) helps us to overcome the shortcomings of linear flow models. The linear model limitations like failure in complex terrains, wake effect measurement in larger wind farms, turbulence, ruggedness effects & forest canopy, etc, can be better evaluated by commercial CFD model.
The short-term period wind record measurements based on traditional method are based on
The Indian wind energy sector has estimated potential of installing 48,000 MW in India. While the potential is huge India has achieved around 13000 MW. The estimated figures can be doubled by the advanced technology & better wind resource assessment techniques that help to achieve more even at low wind speed sites.
While the wind industry is growing with fast pace, a few roadblocks are posing challenges. There is a dramatic change in availability of land for wind energy field. Grid connectivity is again a big bottleneck.
a randomly selected snapshot of the resource without any long-term historical data . To overcome these kind of variations, there are some advance meso -scale numerical weather prediction (NWP) datasets available in the wind industry market which gives long term wind historical records of a desired area. This can be utilized to maximize the energy predictions, & to identify new windy sites across the country.
These advance methodology can also be helpful for Indian offshore wind farm assessment in future. India has a 2000km offshore wind potential stretch with a 10 to 20km width for multiple windmill
rows at a maximum depth level of 30 to 50meters. This offshore wind farm may add additional minimum 40000 MW to the Indian wind power installed capacity.
There is also a time to revise the criteria of potential sites set by Ministry of New and Renewable Energy (MNRE) based on the minimum mean wind power density (WPD) value of 200W/m² level. The new generation wind turbines called as Class-III can also perform well below the minimum criteria of 200 W/m².
The correct wind power density needs to be evaluated as per site-specific weather conditions & long-
term wind records co-relation. This will further add new areas to the wind potential sites.
The economics of a wind farm project are crucially dependent on the wind resource at a site. A robust estimate of the energy production of a prospective wind farm based on a wind and energy assessment is essential in supporting investment and financing decisions which would increase the feasibility of the viable wind power projects.
A relatively small investment in these assessment programs will pay big dividends by reducing the risk and helping to maximize the return and improve the Internal Rate of Return (IRR).
The Challenges Faced By Wind Energy Industry & The Way ForwardBy T. Asok kumar, Sr. Vice President (Design & Development), Pioneer Wincon Private Ltd.
Opinion
Product
Media Partner
I N T E R N A T I O N A L
www.EQMagLive.com32
WWD1: An overview WWD-1, it is a megawatt class
pitch regulated upwind wind turbine
with active yaw and three-blade
rotor. WWD1 is essentially known
for its reliability, grid compatibility,
optimal energy production,
maintenance friendliness and
sturdiness in extreme conditions.
WinWinD pioneered the
multibrid medium speed permanent
magnet synchronous generator
technology. Our wind turbines’ core
advantage is the multibrid concept,
which combines the efficiency of a
direct drive and the compactness
of a traditional high speed gear
system. Hence we are at a vantage
point when it comes to wind turbine
design.
WWD1 has an integrated
power unit which contains two row
tapered roller bearing, planetary
gear and low speed generator
with permanent magnets. This
design reduces the use of moving
parts in the turbine by about
30%. The multibrid design also
ensures optimal mechanical load
management which ascertains high
reliability and availability as well
as low maintenance costs. WWD1’s
full power frequency converters ensure maximal grid compliance.
WWD1: Advanced Turbine For Yield Optimization
Key AdvantagesWinWinD machines have
operated effectively across the globe and continue to deliver this success story in India. WWD 1 uses permanent magnet synchronous generator and a single stage planetary gear box. As explained before, it combines the advantages of a direct drive and the traditional high speed gear system. A major advantage of WWD 1 is that it has 30% lesser moving parts than traditional geared system.
Secondly, the machine is highly reliable. It requires lesser maintenance and gives longer uptimes because high speed gear components are eliminated by using an integrated power unit; also, the main bearing transfers the rotor loads directly to the main casing of the supporting structure, keeping the whole drive train free from deformation which results in low maintenance cost.
Thirdly, utilizing a variable speed pitch controlled rotor and energy optimized blades with large rotor diameters maximizes energy capture even in low wind speed sites.
Also, WWD-1 is grid friendly. Utilizing a permanent magnet synchronous generator, full
power frequency converters and sophisticated pitch control system, WinWinD turbines fulfill the most demanding grid code requirements.
The 1MW wind turbine for difficult terrains
WWD-1 is a 1 MW turbine suitable for a range of terrain conditions from regular potential windy sites, to areas with challenging logistical conditions and / or environmentally size-limited areas like islands, mountains etc.
It has been designed to efficiently operate even at low wind speeds. The low to medium speed permanent magnet synchronous generator technology that form the core of our wind turbines have been chosen to ensure excellent generation at all potential sites available today in India.
WWD1 comes with a 60m rotor diameter in India which provides higher energy yields at lower wind speed sites such as IEC CLASS 3, which is very common in India.
Customized to suit Indian Conditions
WinWinD turbines have been operating in wide range of climates. WWD1 has been in operation successfully in very icy conditions of the arctic regions. It has also proven
its performance in mountainous regions of Portugal and other European and Mediterranean climes. When it was planned to launch WWD1 in India, the design was thoroughly tested and it’s
robustness was studied in Indian
conditions by conducting back to
back test of each component before
it left the manufacturing facility
and made sure every effort was
made to customize it for warmer
climates.
The operating temperature of
WWD-1 machines was found to be
suitable for the tropical climate
in India; further customization
was done to make it compliant
with Indian weather conditions
by introducing additional gear
oil cooling and by providing an
opening in the Nacelle cover for
better cooling inside the Nacelle
and Hub.
Today, WWD1 is running
successfully in India – a country
which experiences very warm near
equatorial climatic conditions.
Manufacturing process in India
W W D -1 m a c h i n e i s
manufactured in our state- of-
the- art manufacturing facility
located in Vengal village about 50
Established in Finland at the dawn of the century, WinWinD today is synonymous with state-of-the-art technology in terms of its wind turbine designs, manufacturing facilities and its turnkey solutions. This technology leadership is reinstated by the futuristic design and best in class engineering which has resulted in wind turbines that have stood the test of time, extreme weather conditions and challenges posed by difficult terrains.
WinWinD has a global product suite of 1MW and 3MW machines. Both the products have proven their performance and have met the stringent quality and grid compatibility norms set by various European countries. WinWinD currently offers its 1MW model WWD1 in India, that has already proven its superior performance on varied terrain conditions across Europe and India.
WinWinD’s 1MW model is today widely renowned as the best in class when it comes to its technological feature.
Product
www.EQMagLive.com 33
km from Chennai. This facility is
spread across 65000 sq m and was
inaugurated in September 2009.
The facility has 2 major units viz. the Rotor blade unit (RBU) and the Nacelle & Hub Unit (NHU)
RBU has been established, based on International Standards and norms of safety and quality, for manufacturing WWD-1 rotor blades. This is the only static load facility in India approved by GL. Our blades are made of epoxy resin reinforced glass fiber and are equipped with lightening conductors.
Technologically well proven process equipments like resin mixing machine, adhesive mixing machine, sawing and drilling machine, closing system etc are being used in blade production process to ensure the consistency in quality and process parameters. Very high precision measuring equipments like laser trackers, DSC, viscometers etc are used to ensure adherence to quality standards and monitor the blade production process.
The Nacelle and Hub are assembled and tested in NHU. Individual components such as cast components, steel frames
etc are sub-contracted to suitable suppliers. After completion of assembly the Nacelle undergoes a back to back testing where the site condition is stimulated and the machine is run at rated power to check adherence to quality standards that we follow rigorously.
We are proud to say that we are the only company who does full functional test at rated power before deploying machines on site.
Design advancementsWhen it comes to machines
in the Indian market the trend
should be towards more compact electrical generators of stunning power, wind turbines with half the head weights, super-efficient power grid friendly transmission - it will be a tantalizing vision for the renewable sector. Making it a reality could transform the economics of wind energy.
The design advancements planned for WWD1 would include testing higher hub heights to gain power production, focusing on further perfection and customization in the design of the existing WWD-1 product and making it more energy and cost efficient.
Product
EQ provides unique Insights & Transparency in Power Generation, Clean Energy, Low Carbon Technologies, Carbon Markets. Latest Industry Information, News, Research & Analysis, Technology & Products Information, Business & Financial News, Policy & Regulation is delivered to an interesting diverse readership base in Energy Corporations, Government, Policy Makers & Regulators, Consultancy & Advisory Firms, Associations, Banking & Financial World
* PLATFORM : EQ offers a diverse & integrated platform with its Bi-Monthly Technical Magazine (Distributed in Print & Digital Formats), Special Supplements addressing Specific industry, Weekly E Newsletters, Diverse Digital Publishing with its appearance on Web, iPad, Kindle, iPhone, Blackberry, Android Platforms (COMING SOON) along with strong emphasis on Social Networking @ Facebook, Twitter to enhance your reach, visibility, branding and addressing the issues you feel are most important.
* REACH : EQ Maintains a strong focus on the Indian Market from where it is published with 10,000 Copies distributed to Key Decision Makers. Approximately 2000 copies are printed for Select International presence. Its unique and strong digital presence (Distributed to 90,000 Contacts) takes it beyond borders and get popularity in International Market.
* PRESENCE : EQ is present in almost all Fair & Conference in India and the Most important International Events.
Increasing Cell Efficiency With Rearside Technology
Special Mirror for CSP
Bearing Selection Techniques Wind Turbines
Implementation of REC Mechanism in India
Cellulosic Ethanol – The Future Of Biofuel
Rejuvenating India’s Thermal Power Plants With Integrated Retrofit SolutionsIssue#01 | January-February 11
I N T E R N A T I O N A L
Increasing Cell Efficiency WitTechnology
Special Mirror for CSP
Bearing Selection TechniqTurbines
Implementation of REC MecIndia
Cellulosic Ethanol – The Biofuel
R j ti I di ’ Th l P
UL Unveils India's Largest Photovoltaic Test FacilityUnderwriters Laboratories (UL) has unveiled India’s largest state-of-the-art photovoltaic (PV) lab. This lab is capable of testing to UL, IEC and other international standards thereby helping manufacturers access global markets. It will serve manufacturers and power plant developers by providing a full portfolio of testing services for solar PV, concentrated PV products and balance of systems as per the requirements of National Solar Mission
For more information, please contact:Hitesh Jain T:: 91.9717488144 / E:: [email protected] India Pvt Ltd T:: 91.80.41384500 / E:: [email protected]
Testing & Certification Services for Manufacturers of:1. Crystalline Silicon PV Modules and Panels
2. Thin-Film PV Modules & Panels
3. Concentrated PV
4. Building - Integrated PV Modules and Panels
5. Building - Integrated PV Mounting Systems
6. Junction Boxes
7. Inverters & Charge Controller
8. Batteries
Services for Powerplant Developers, EPC & System Integrators:1. Design Qualification for Stand Alone PV Systems
2. PV System Installer Training Program
3. Condition Monitoring Services for PV Power Plants
Inaugural Issue
EQIN
TERN
ATION
AL
|J/F
b11
|Vl
1|I
#01
nergynplugged
EU I N T E R N A T I O N A L
www.EQMagLive.com34
For over 80 years Carlisle Brake & Friction has produced a wide range of brake and friction products for the world’s most recognised OEMs various markets. Over the
intervening decades, the company has expanded into new markets with innovative braking solutions. As the demand for wind energy increased around the globe in the last few years, Carlisle focused its attention on meeting the needs of the industry’s biggest turbine manufacturers and operators. With global supply chains strained in 2007 and 2008, wind turb in e manufacturers turned to Carlisle for assistance with brakes for both rotor and yaw applications.
Carlisle offers a diverse range of
Carlisle offers wind solutions for MW and kW size wind turbines
wind product solutions to both the MegaWatt and KiloWatt classes of machines, from standard products, to concepts based on experience in other markets, to complete clean
sheet design. These solutions include caliper brakes for active hydraulic yaw applications, caliper brakes for high and low speed shaft rotor applications, and hydraulic power units. A crucial differentiator is Carlisle’s
friction capabilities; Carlisle is the only brake supplier in the industry with both braking and friction competency. This friction
competency was recently bolstered with the acquisition of the Hawk Corporation. The brands of Hawk, including Wellman Products
Group, VelveTouch, and Hawk Performance, are established in the market as premier friction products. Already with an organic and sintered lining option available to customers, the acquisition allows Carlisle Brake & Friction to bring even further product differentiation and value to its customers. Moreover, large scale technical f a c i l i t y r e n ov a t i o n s means Carlisle boasts world class testing laboratories.
Carlisle Brake & Friction is a leading solutions provider of high performance and severe duty brake, clutch and transmission applications to OEM and aftermarket customers in the mining, construction, military, agricultural, performance street, motorsports, industrial and aerospace markets. The strength of CBF’s brands, including Wellman
P r o d u c t s , C a r l i s l e I n d u s t r i a l B r a k e & Friction, Hawk Performance, Japan Power B r a k e , VelveTouch, and Fie ld Pro, gives our c u s t o m e r s access to a
diverse range of the most highly engineered braking, friction, clutch and transmission products available to the market today.
With ten manufacturing facilities globally located in the U.S., U.K., Italy, China, Japan, and Canada, and with over 1,800 employees, Carlisle serves over 100 leading original equipment manufacturers in 55 countries, making Carlisle the right choice for your new brake or friction design, no matter where you are in the world or what you want to be.
Product
www.EQMagLive.com 35
FunctionalityThe WinDrive works like the variable automatic transmission in a vehicle. It converts a variable speed into a constant output speed. The design of the WinDrive is based on a hydrodynamic torque converter combined with a planetary gear.
IntegrationIntegrating the WinDrive into the wind turbine drive train couldn’t be simpler. The device slots into place after the wind rotor and the main gearbox. The WinDrive output is coupled with a synchronous generator that is in turn connected directly to the power grid.
Advantages High power feed-in quality
The synchronous generator can generate electricity that matches the quality of conventional power plants, thereby guaranteeing control of reactive power and grid stabilization.
High reliability
The omission of the frequency converter and step-up transformers minimizes the wind turbine’s complexity. The frequency of malfunctions and downtimes are reduced, considerably increasing availability.
High efficiency
The speed of the wind rotor varies with differing wind speeds. As the WinDrive is designed for variable-speed operation, the optimum aerodynamic position for the wind rotor is always maintained. The synchronous generator works at medium voltage level, which reduces losses due to transformers and cables.
Less maintenance
Voith WinDrive – A state of the art technology
Synchronous generators without slip rings reduce the complexity of wind turbines, and therefore the servicing required. The WinDrive has response times in the millisecond range, thereby
producing a considerable load reduction in the drive train during dynamic load conditions in the
The Voith WinDrive is a highly dynamic, variable speed device for use with wind turbines over 2 MW. The WinDrive converts the wind rotor’s variable speed into a constant output speed suitable for the generator. This enables the device to generate electricity just as effectively as a conventional power plant, reliably and without the need for a frequency converter – without placing a strain on the network.
drive. The service life of assemblies that conduct power is increased.
WinDrive technology can be applied in almost any situation. On and offshore locations, connections to
weak energy grids or installation in rough conditions pose no problems for the WinDrive.
Product
The WinDrive is currently operating reliably in wind power plants in Germany, Argentina and America. The WinDrive’s potential has also been recognized by Chinese wind turbine manufacturers and there
are plans to incorporate it into an offshore wind farm.
www.EQMagLive.com36
UD Energy System Pvt. Ltd., Pune : Whisper 200- 700 W
Supernova Technologies Pvt. Ltd., Mumbai : SNT 5 550 W
Auroville wind System, Auroville : Genie 5000 5kW
Viviann Electric Pvt. Ltd., Coimbatore : H 6.4 - 5kW
Unitron Energy Systems Pvt. Ltd. Pune : UE 33 - 3.2kW, UE 42 - 4.2kW, UE42 Plus-5.1 kW
UD Energy Systems Pvt Ltd., Pune : Whisper 500 - 3.2kW
Spitzen Energy Solutions (India) Pvt. Ltd., Pune : Passaat 1.4 kW
W 1
W 1
W 3
W 4
W 4
W 5
W 5
W 5
W 5
W 5
W 6
W 7
W 7
W 5
W 2
W 2W 2
Chiranjjeevi Wind Energy Limited Coimbatore : 250kW
Gamesa Wind Turbines Pvt. Ltd., Chennai : 850kW-2000kW
GE India Industrial Private Limited, Bangalore : 1500kW-1600kW
Global Wind Power Limited, Mumbai : 750kW - 2500kW
Pioneer Wincon Private Ltd., Chennai : 250kW
RRB Energy Limited, Chennai : 600kW
Suzlon Energy Ltd., Pune : 600kW - 1250kW
Inox wind Limited, Noida : 2000kW
Pioneer Wincon Private Ltd., Chennai : 750kW
Regen Powertech Pvt Ltd., Chennai : 1500kW
Shriram EPC Limited Chennai : 250kW
Suzlon Energy Ltd., Pune : 2100kW- 2250kW
Vestas Wind Technology India Pvt. Ltd., Chennai : 1800kW
W 5
W 6
W 4
W 3
W 2
W 2
W 2
W 2
W 2
W 1
Coimbatore
Manufacturers of Wind Turbines Manufacturers of Small Wind Turbines
Bangalore
Mumbai
Noida
Pune
ChennaiAuroville
*Source : CWET
Wind Turbine Manufacturers in INDIA
and Friction
and Hydraulic Power Units
brakes
Phone : +91 44 42994351 Email : [email protected] see our full range go to www.carlilse.com/wind
and a world of possibilities
wind turbine brakesTo learn more about Carlisle braking systems contact your local sales office or visit www.carlislebrake.com
United Kingdom +44 1495 767 300 China +86 21 6100 5222 United States +1 812 336 3811 India +91 44 4299 4351The Netherlands +31 316 59 65 00 Japan +81 46 247 7564
With eleven manufacturing facilities globally located in the US, UK, Italy, China, Japan, and India, and with over 1,800 employees, Carlisle Brake & Friction is the leading provider of high performance braking solutions to the off-highway,
high performance racing, aerospace, and alternative energy markets, serving over 100 leading original equipment manufacturers in 55 countries.
We design and build dry disc caliper brakes, drum brakes and mechanical brakes for both service and park applications. Additionally, we manufacture both wet and dry friction materials used for brake linings, clutches, fuel cells, and transmissions.
We also design and deliver hydraulic actuation systems, including hydraulic valves, master cylinders, adjustors, and boosted master cylinders.
Our proven experience and commitment to the global marketplace makes Carlisle Brake & Friction the right choice for your new brake or friction design, no matter where you are in the world or what you want to be.


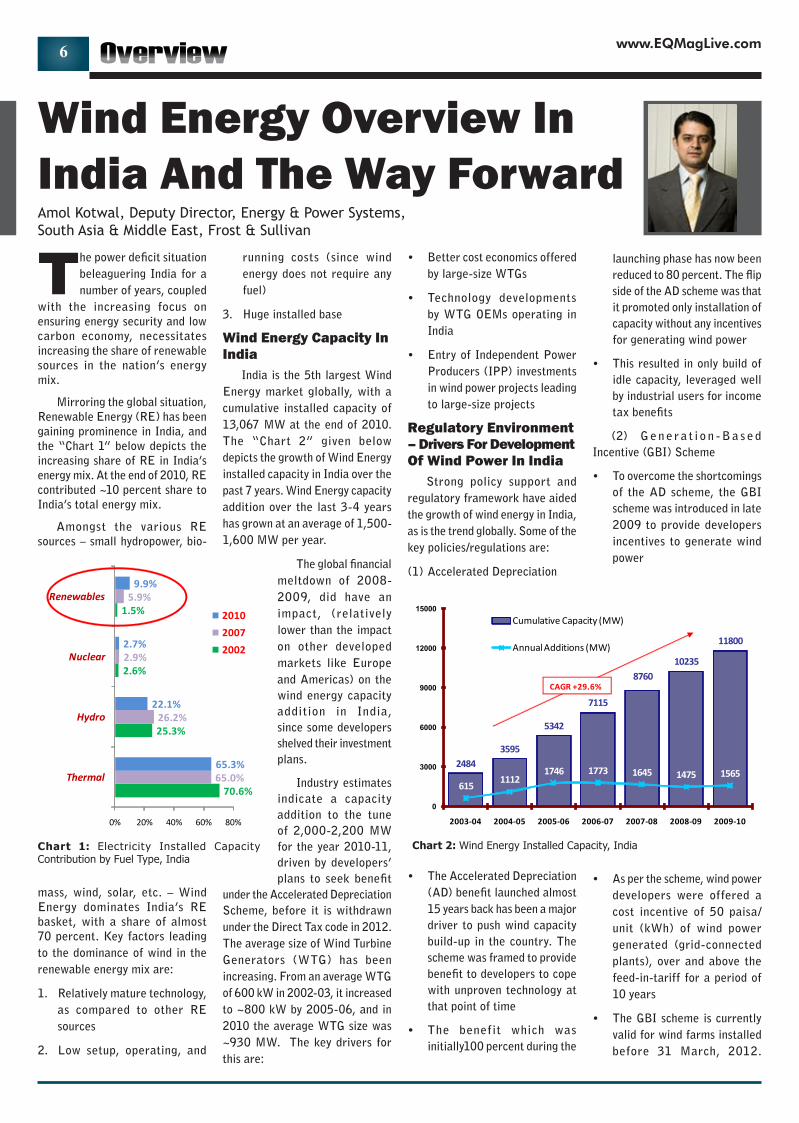

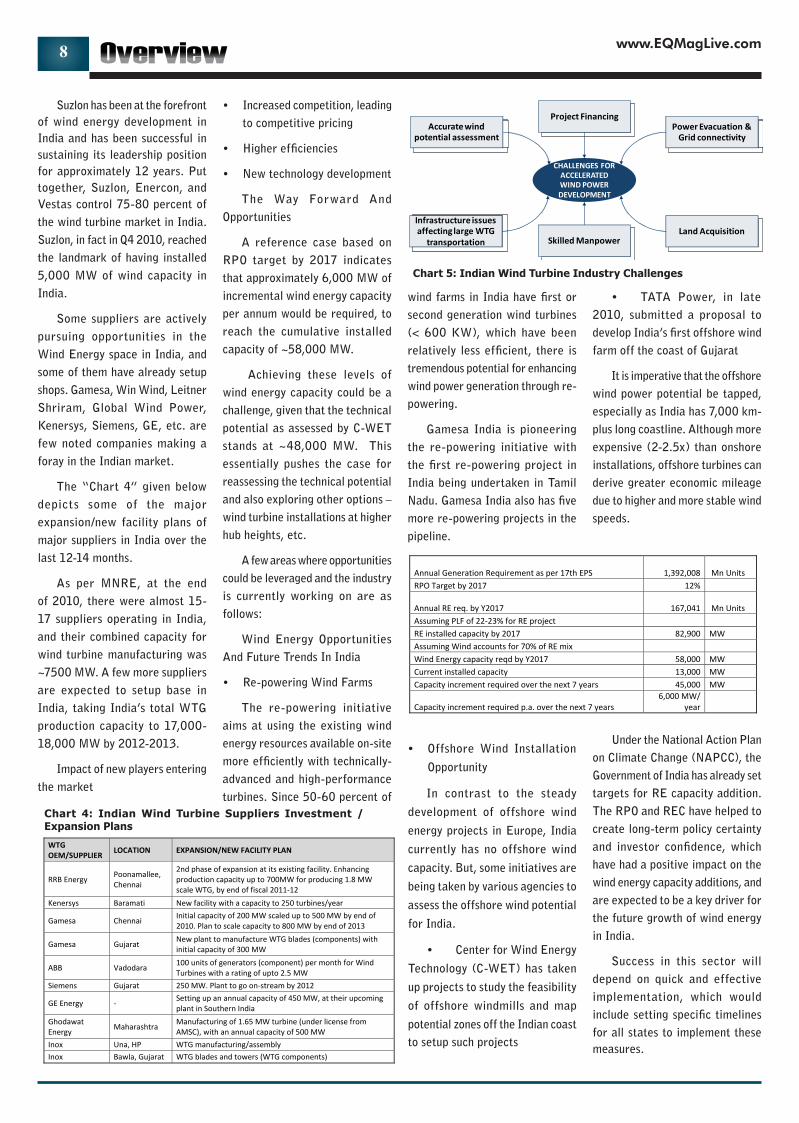

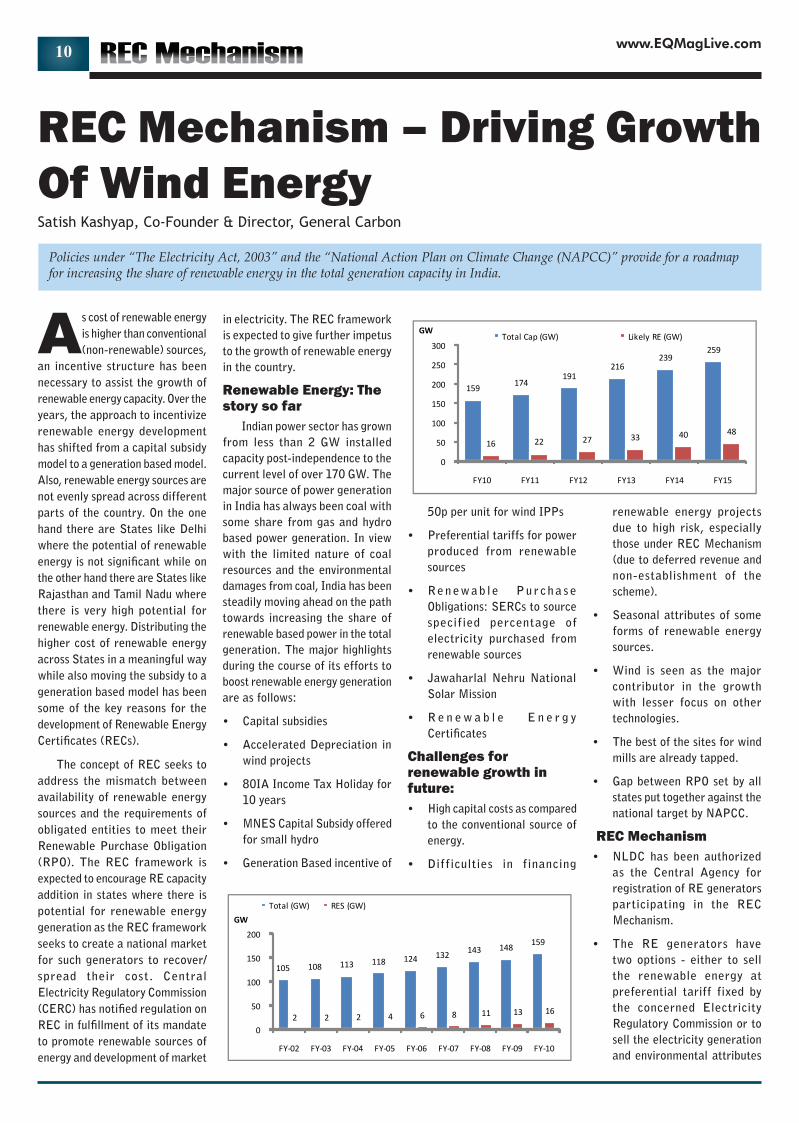


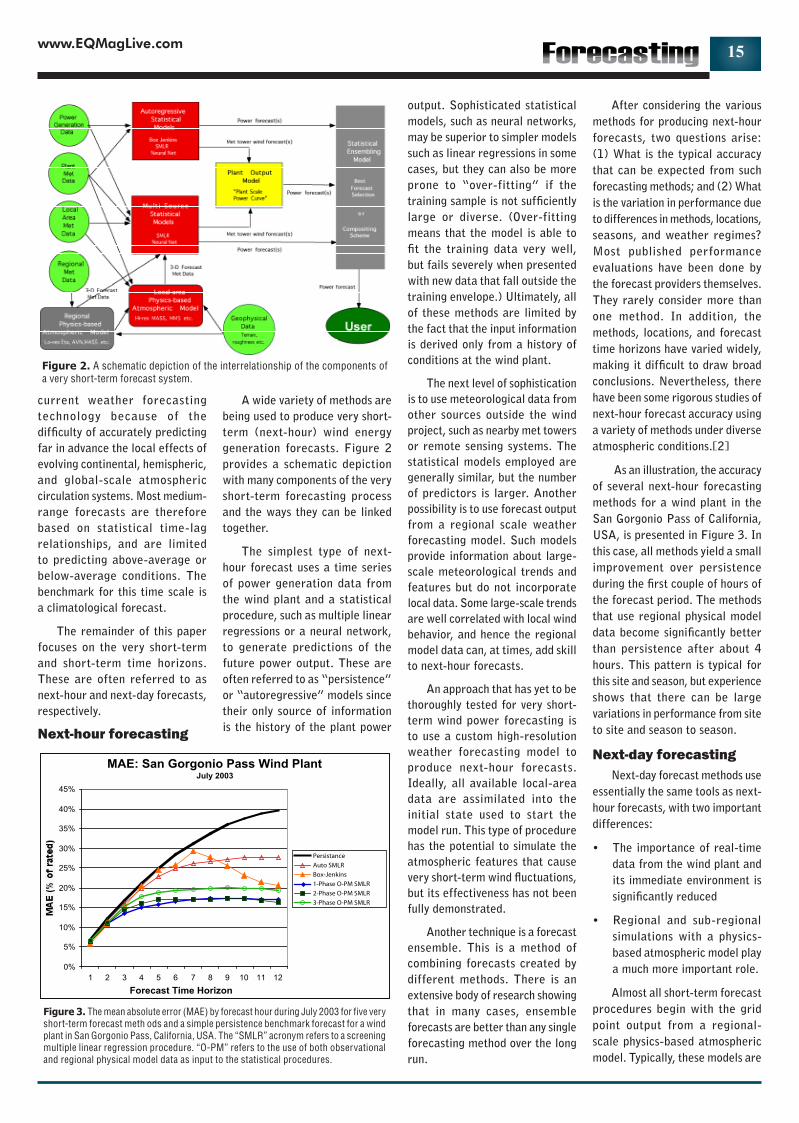
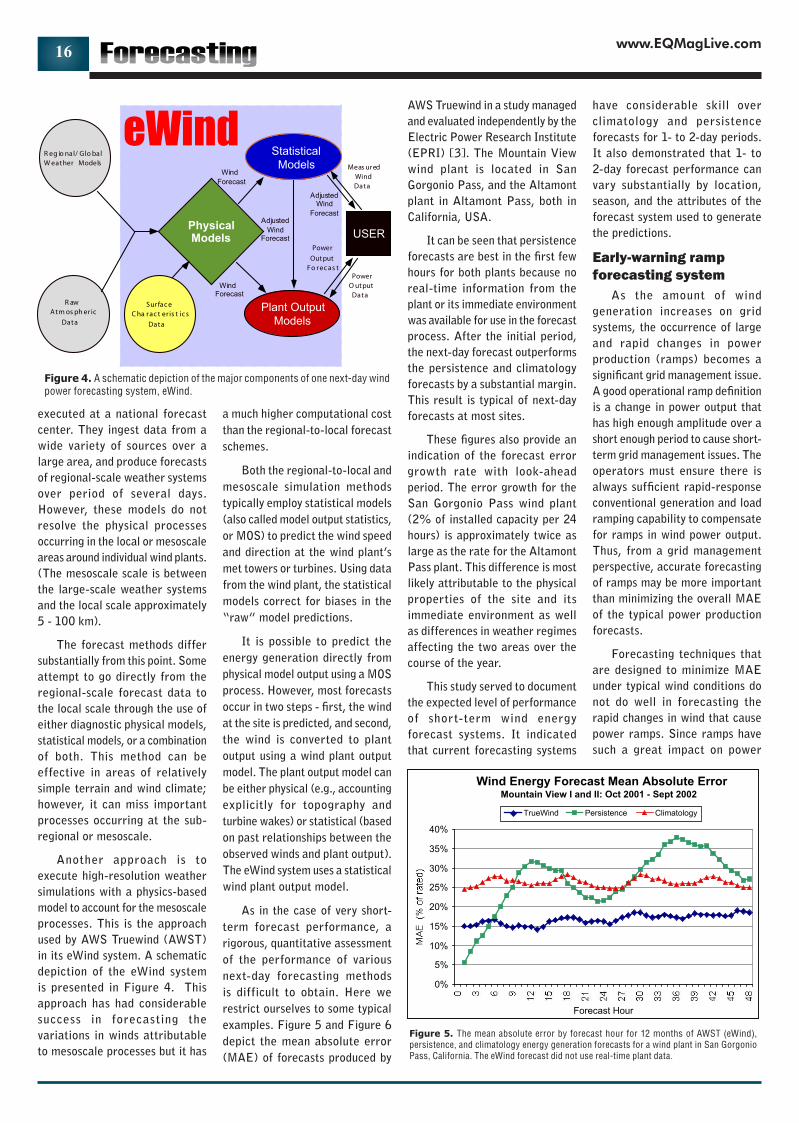


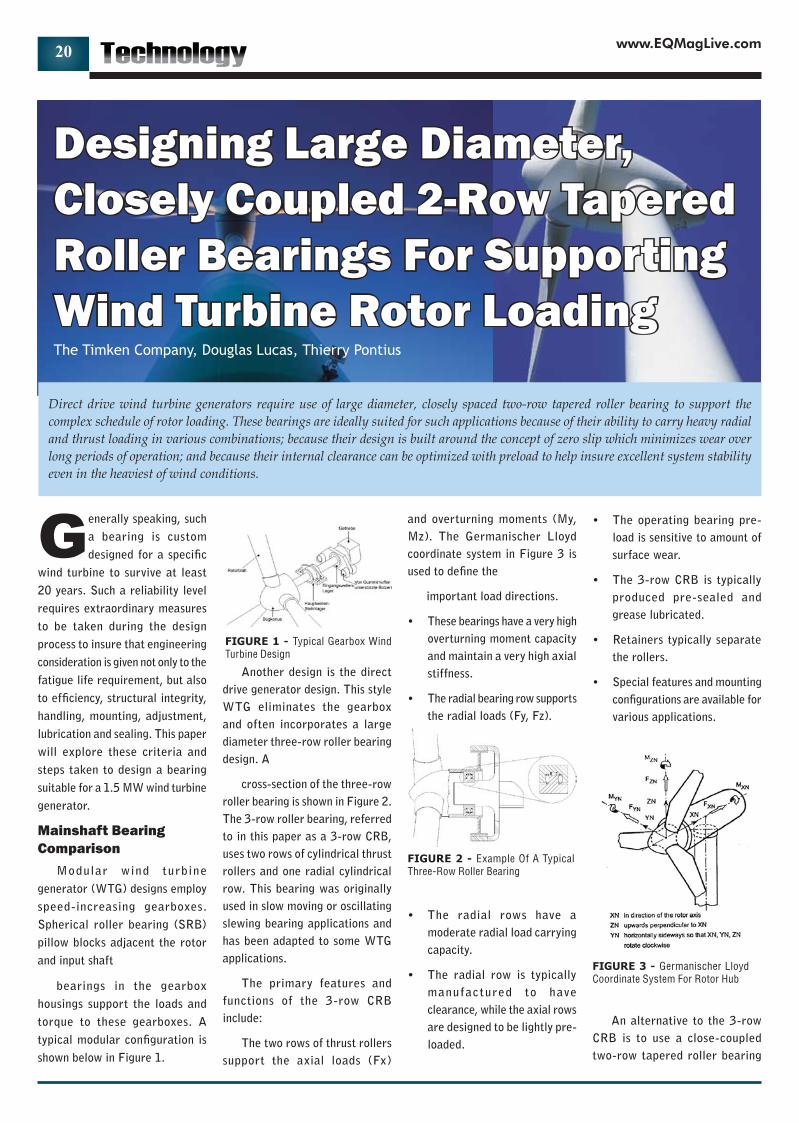
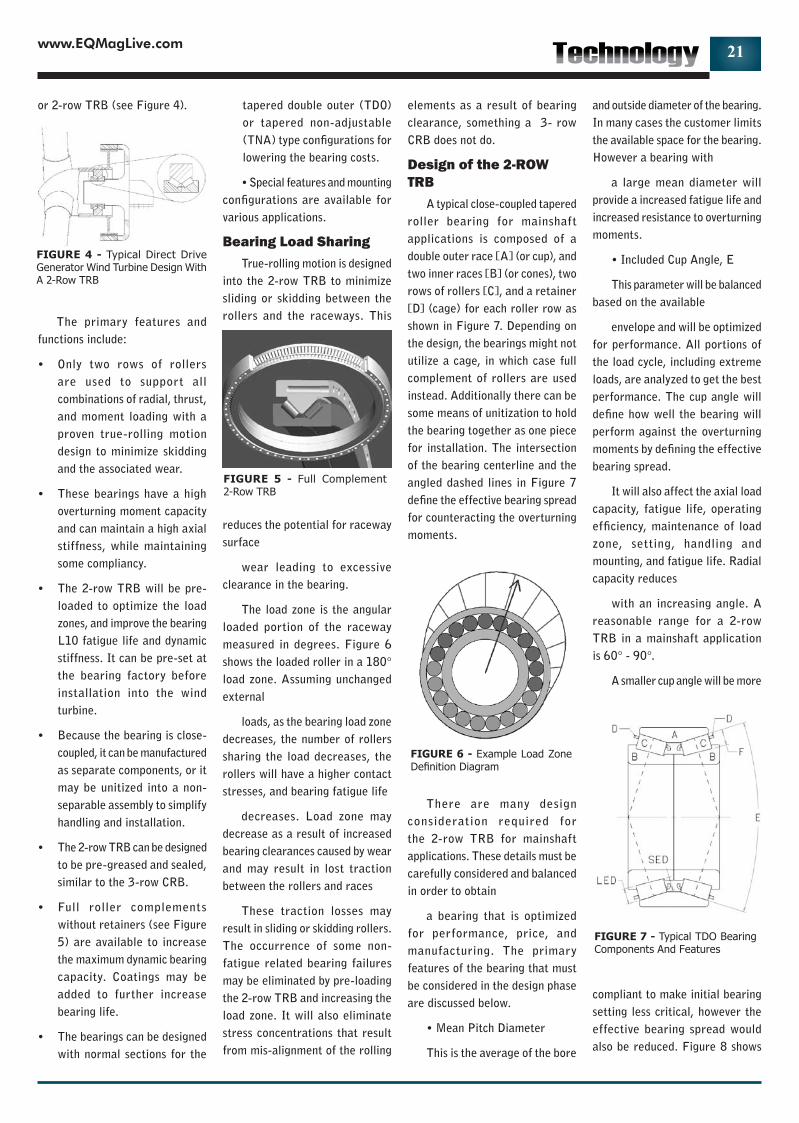
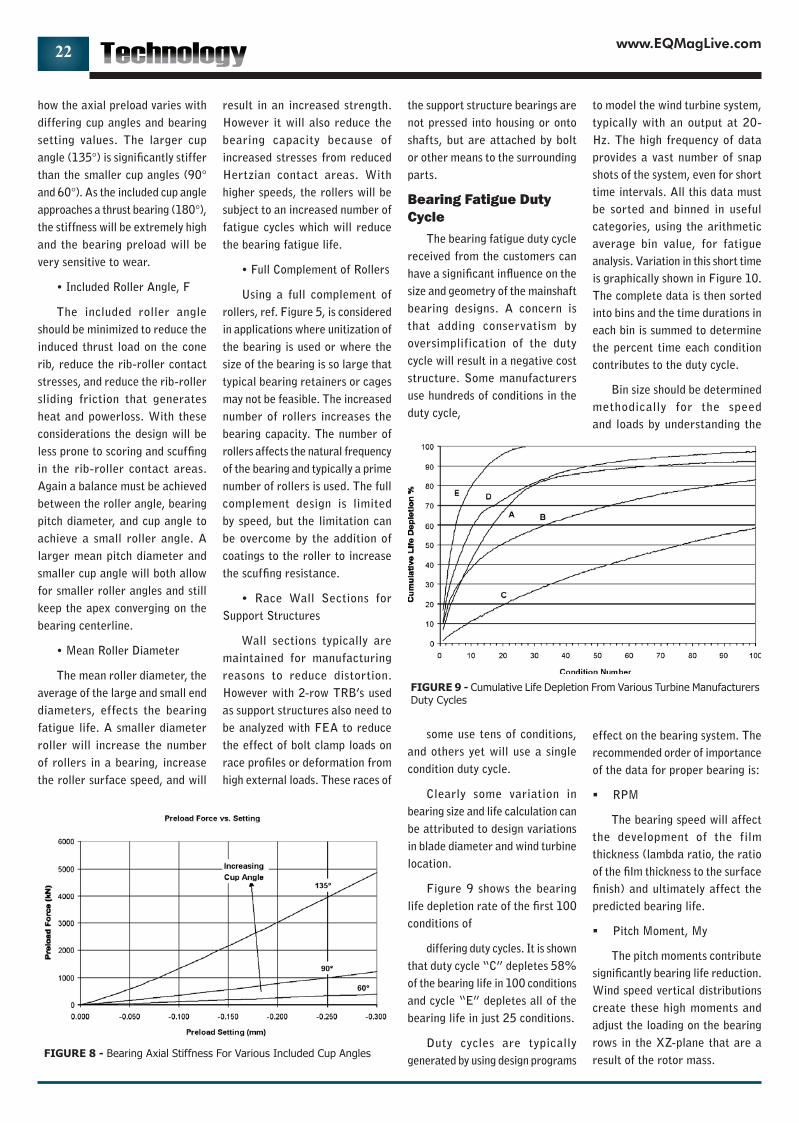

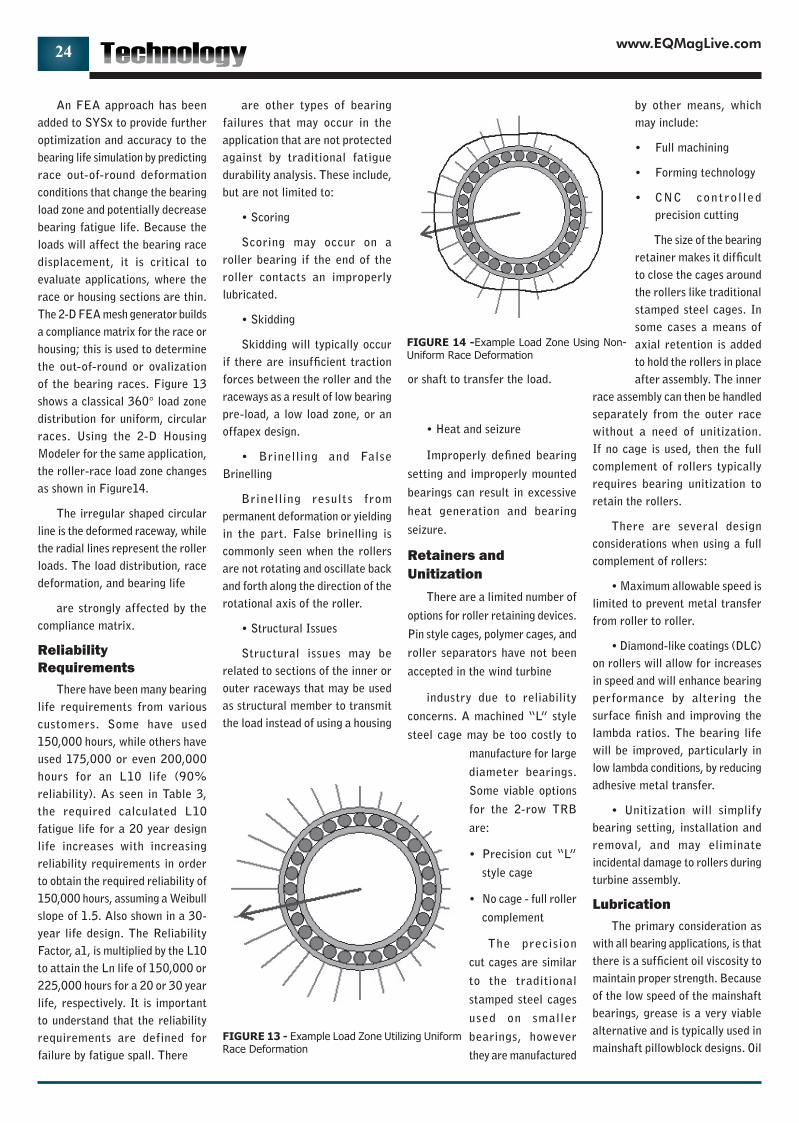


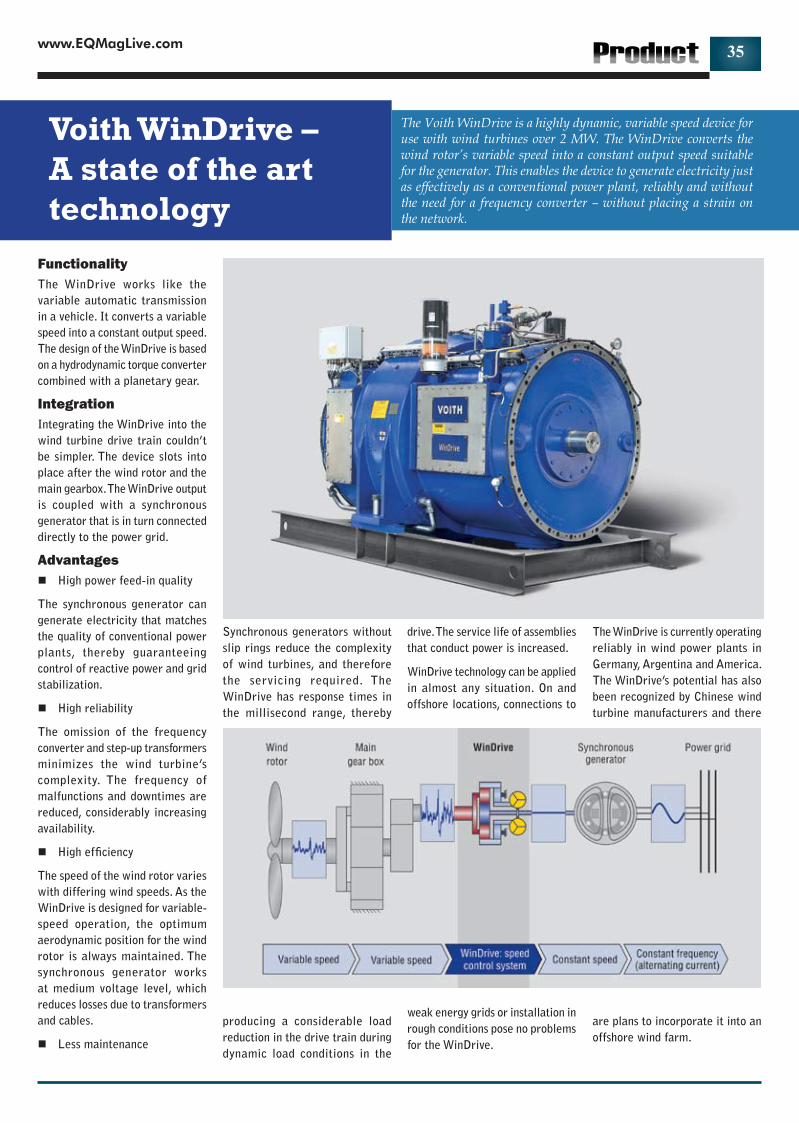
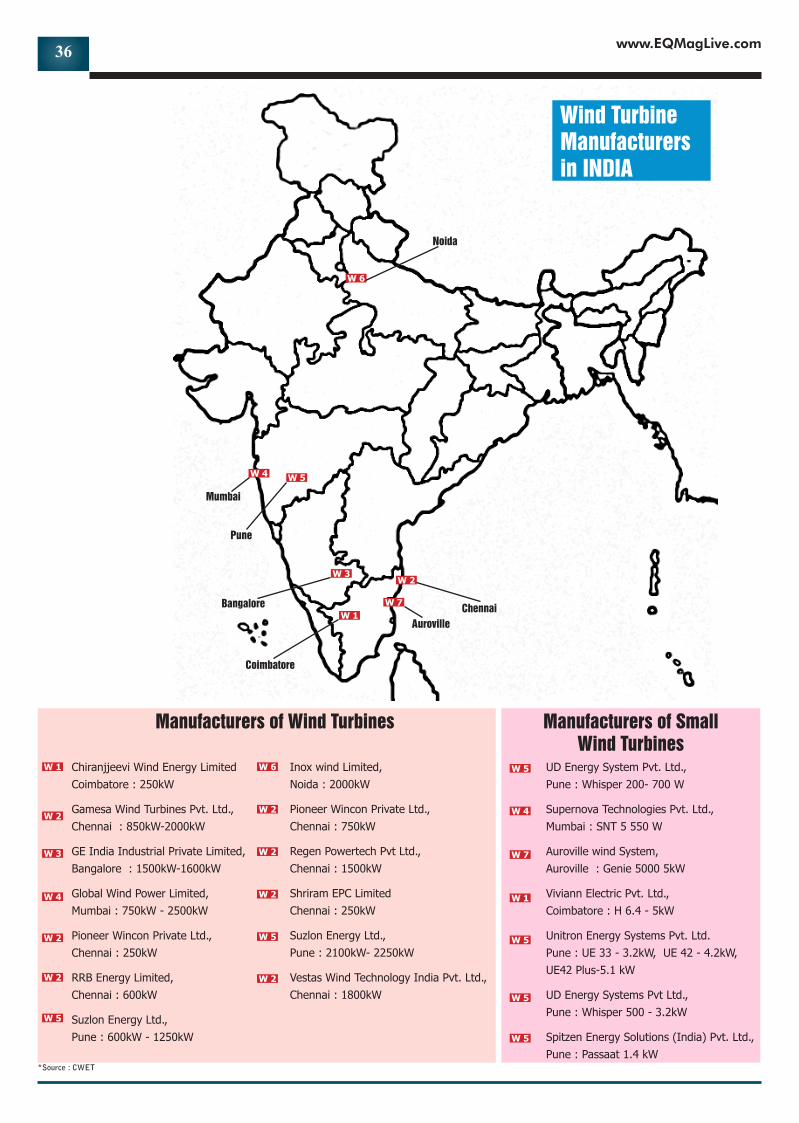


![Chapter 6 - Chromedia · Chapter 6 Equilibrium Chemistry 213 K cd ab = [] [] CD AB eq eq eq eq 6.5 Here we include the subscript “eq” to indicate a concentration at equilib‑](https://static.documents.pub/doc/80x56/5f39c80721ac1114a433e66d/chapter-6-chromedia-chapter-6-equilibrium-chemistry-213-k-cd-ab-cd-ab.jpg)


