+ All Categories
Home > Documents > EQCM and XPS analysis of 1,2,4-triazole and 3-amino-1,2,4-triazole as copper corrosion inhibitors in...

EQCM and XPS analysis of 1,2,4-triazole and 3-amino-1,2,4-triazole as copper corrosion inhibitors in...

Date post: 15-Dec-2016
Category:
Upload: matjaz
View: 214 times
Download: 0 times
Share this document with a friend
33
Accepted Manuscript EQCM and XPS analysis of 1,2,4-triazole and 3-amino-1,2,4-triazole as Copper Corrosion Inhibitors in Chloride Solution Matjaž Finšgar PII: S0010-938X(13)00393-4 DOI: http://dx.doi.org/10.1016/j.corsci.2013.08.026 Reference: CS 5522 To appear in: Corrosion Science Received Date: 12 April 2013 Accepted Date: 29 August 2013 Please cite this article as: M. Finšgar, EQCM and XPS analysis of 1,2,4-triazole and 3-amino-1,2,4-triazole as Copper Corrosion Inhibitors in Chloride Solution, Corrosion Science (2013), doi: http://dx.doi.org/10.1016/j.corsci. 2013.08.026 This is a PDF file of an unedited manuscript that has been accepted for publication. As a service to our customers we are providing this early version of the manuscript. The manuscript will undergo copyediting, typesetting, and review of the resulting proof before it is published in its final form. Please note that during the production process errors may be discovered which could affect the content, and all legal disclaimers that apply to the journal pertain.
Transcript

Accepted Manuscript

EQCM and XPS analysis of 1,2,4-triazole and 3-amino-1,2,4-triazole as Copper

Corrosion Inhibitors in Chloride Solution

Matjaž Finšgar

PII: S0010-938X(13)00393-4

DOI: http://dx.doi.org/10.1016/j.corsci.2013.08.026

Reference: CS 5522

To appear in: Corrosion Science

Received Date: 12 April 2013

Accepted Date: 29 August 2013

Please cite this article as: M. Finšgar, EQCM and XPS analysis of 1,2,4-triazole and 3-amino-1,2,4-triazole as

Copper Corrosion Inhibitors in Chloride Solution, Corrosion Science (2013), doi: http://dx.doi.org/10.1016/j.corsci.

2013.08.026

This is a PDF file of an unedited manuscript that has been accepted for publication. As a service to our customers

we are providing this early version of the manuscript. The manuscript will undergo copyediting, typesetting, and

review of the resulting proof before it is published in its final form. Please note that during the production process

errors may be discovered which could affect the content, and all legal disclaimers that apply to the journal pertain.

1

EQCM and XPS analysis of 1,2,4-triazole and 3-amino-1,2,4-triazole as Copper Corrosion

Inhibitors in Chloride Solution

Matjaž Finšgar∗

University of Maribor, Faculty of Chemistry and Chemical Engineering (UM FKKT), Smetanova ulica

17, 2000 Maribor, Slovenia

Abstract

In this study, the influence of the amino functional group in the 1,2,4-triazole at position C3 (the

3-amino-1,2,4-triazole compound), on the surface layer formation and surface chemistry of these two

Cu corrosion inhibitors is explored. Special attention is devoted to the orientation of these two

molecules and the way they bond to the Cu surface. With the aim of obtaining electrochemical quartz

crystal microbalance and X-ray photoelectron spectroscopy measurements, the article discusses why

differences in the corrosion inhibition effectiveness of these two molecules exist. Moreover, the

thicknesses of the inhibitor surface layers formed on the Cu are determined.

Keywords: A. copper, B. XPS, C. interfaces, C. neutral inhibition

∗ Corresponding author Address: University of Maribor, Faculty of Chemistry and Chemical Engineering (UM FKKT), Smetanova ulica 17, 2000 Maribor, Slovenia e-mail: [email protected]; phone: +386 2 2294 447

2

1 Introduction

Copper and its alloys are used in many environments and applications due to their desirable

properties. However, the corrosion resistance of copper-based materials strongly depends on their

environment. Corrosion cannot be completely prevented, but an effort is made to minimize it, which is

the ultimate goal of corrosion studies. One convenient approach to minimizing corrosion damage is to

use corrosion inhibitors, which are substances used in very low amounts that efficiently slow the rate

of corrosion.

The studies mentioned below show that 1,2,4-triazole compounds are particularly worth

investigating as they act as efficient corrosion inhibitors for various materials in diverse environments.

In this work, the surface layer formation and surface chemistry of 1,2,4-triazole (TRZ) and its

derivative, 3-amino-1,2,4-triazole (3-AT), adsorbed on Cu from 3 wt.% aqueous solution, were

investigated (the molecular structures are given in Fig. 1). Sometimes the acronyms TA and ATA are

used in the literature for 1,2,4-triazole and 3-amino-1,2,4-triazole, respectively, but not herein. Thus

far, TRZ action as a Cu corrosion inhibitor has been relatively unexamined in chloride media, most

likely because it is not very effective [1]. Moreover, corrosion tests performed for 0.1, 1.0, and 10.0

mM TRZ or 3-AT in 3 wt.% NaCl solutions showed that 3-AT was a more effective Cu corrosion

inhibitor than TRZ (these results are not shown herein, because that was not the aim of this work).

However, study of the influence of different functional groups (amino in the present case) for the

given compound (1,2,4-triazole in the present case) is especially important for an understanding of the

inhibitor action, which consequently provides an opportunity to design new potential inhibitor

compounds (for example, sometimes this is needed to reduce toxicity). Herein, the reason why 3-AT

(and not TRZ) is an effective Cu corrosion inhibitor will be discussed. In particular, in this work

electrochemical quartz crystal microbalance (EQCM) was employed to study the kinetics of the

inhibitor surface layer growth. Moreover, angle-resolved X-ray photoelectron spectroscopy (ARXPS)

was used to gain further insight into the molecular bonding and orientation on the Cu surface. To the

best of the author’s knowledge, such a comparison of TRZ and 3-AT in chloride media is presented

here for the first time.

Only a few studies concerning TRZ as a corrosion inhibitor exist [1-3]. On the other hand,

3-AT has more frequently been employed. 3-AT has been used previously to effectively protect Cu in

chloride solutions [4-8], Cu in HCl solution [1], Cu in HCl solution containing potassium hydrogen

phthalate [9], Cu in borate-buffered solution, or the same solution containing chloride or sulphate ions

[10-12], and Cu-40Zn alloy in a chloride solution containing sulphide ions [13]. Rahmouni et al. [14]

also reported that 3-AT was a promising candidate for protecting antique bronze artefacts covered with

a natural patina layer. Moreover, the layer formed by electropolymerization of 3-AT was shown to be

3

particularly effective for preventing corrosion [4, 15, 16]. Various studies have also been performed

that examined 1,2,4-triazole derivatives as Cu corrosion inhibitors in chloride solutions [17-19], in

chloride solution containing sulphide ions [20], in HCl solutions [1, 21-23], in different water

solutions [24, 25], in ethylene glycol solution containing sulphate, chloride, and hydrogencarbonate

ions [26], and in HNO3 solution [27].

The reason for performing an analysis in 3 wt.% NaCl for Cu in the present investigation is

that this medium has previously been shown to be very corrosive for Cu [7, 8, 28-32]. In this study

TRZ and 3-AT are frequently compared with previous investigations of benzotriazole (BTAH),

1-hydroxybenzotriazole (BTAOH), and 2-mercaptobenzimidazole (MBIH) compounds, which were

also tested in 3 wt.% NaCl solution. BTAH and MBIH have been shown to be very effective Cu

corrosion inhibitors, but not BTAOH [29, 32-35]. The acronyms BTAH or BTA, BTAOH or BTAO,

and MBIH or MBI are used hereinafter to emphasize the N-H, O-H, or S-H hydrogen removal from

BTAH, BTAOH, or MBIH molecules, respectively. This is especially needed for the designation of

complexes with Cu(I) (e.g. Cu(I)-BTA or Cu(I)-BTAH, etc.) [32, 35].

The aim of this study is to explore the reason for the differences in the corrosion inhibition

effectiveness between TRZ and 3-AT compounds by means of EQCM and angle-resolved XPS

(ARXPS) techniques. Moreover, using the Tougaard method, a detailed analysis of the background in

the XPS spectra is performed in order to determine the TRZ and 3-AT surface layer thicknesses on the

Cu substrate. The purpose of this study is to ascertain why the amino functional group in the C3

position of the TRZ has (or does not have) an influence on the corrosion inhibition effectiveness of the

TRZ compound.

4

2 Experimental

2.1 Preparation of specimens and solutions

TRZ and 3-AT with a purity of 99.5 wt.% and 95.0 wt.%, respectively, were purchased from

Acros Organics, USA. They were dissolved in 3 wt.% aqueous NaCl (Carlo Erba, Italy, pro analysis),

which was prepared with Milli-Q water (resistivity 18.2 MΩ cm). Solutions contained 10.0 mM TRZ

or 3-AT for the EQCM end XPS analysis. The reason for selecting a 10 mM concentration was that

this was the most effective concentration found in the corrosion tests (the results of the corrosion tests

are not shown herein). All solutions had a volume of 1 L.

Cu samples (with 99.999 wt.% Cu) were cut out from 2-mm thick Cu plate, temper Half Hard,

(Goodfellow, Cambridge, UK) in the shape of discs 15 mm in diameter. Using a circulating device, the

specimens were ground under a stream of Milli-Q water, starting with 1000-grit SiC paper and

continued with 2400- and 4000-grit papers. Between each paper change, the sample was rinsed with

Milli-Q water to remove the particles resulting from grinding. Samples were ground in one direction

until all imperfections were removed and the surface was covered with a uniform pattern of scratches.

The grinding direction was changed four times by turning the sample through 90° to minimize

abrasion. Before each analysis, surfaces were checked under a microscope and if any scratches were

still present, the preparation procedure was repeated. After grinding, the samples were cleaned

ultrasonically in a bath of 50% ethanol/50% Milli-Q water (by volume) and afterwards thoroughly

rinsed with Milli-Q water and dried with Ar gas. A similar procedure has been employed before [8, 28,

29, 33, 35-37].

2.2 EQCM measurements

EQCM measurements were performed with AT-cut, Au-coated quartz crystals with 10 MHz

nominal frequency (supplied by Gamry). The Cu electroplating bath contained 1 M H2SO4 and 0.5 M

CuSO4 [30]. Electrodeposition of the Cu layer onto a gold electrode (cathode) was performed using a

Gamry 600TM potentiostat/galvanostat (in connection with eQCM 10MTM) at a current density of 1 mA

cm-2 until the thickness of the formed Cu layer was 1 μm. The anode was made of pure Cu. After the

deposition step, the Cu-plated electrode was rinsed with Milli-Q water. Next, the solution was

exchanged with 3 wt.% NaCl containing 10 mM TRZ or 3-AT and the change of mass vs. time at the

open circuit potential (Eoc) was measured. For every QCM experiment a new quartz crystal was

employed.

5

2.3 XPS analysis

Cu samples were immersed in 3 wt.% NaCl containing 10 mM 3-AT or TRZ. After 1 h of

immersion, samples were taken from the solution, rinsed thoroughly with Milli-Q water, dried with Ar

gas, and immediately transferred into the XPS instrument, where the analysis was performed.

XPS measurements were performed on a PHI 5700 spectrometer with X-ray radiation from two

types of Al Kα source (1486.6 eV), standard and monochromatic. The energy of the emitted

photoelectrons was analysed with a hemispherical electron analyser operating at pass energies of 29.3

eV and 58.7 eV for high-resolution spectra and 187.8 eV for survey spectra. The base pressure in the

spectrometer was 2⋅10-10 mbar. Analyses were performed at emitted photoelectron take-off angles of

5°, 20°, 45°, and 90°, with respect to the sample surface. For samples inhomogeneous in depth, spectra

measured at different angles will differ due to the different analysed depths. The analysed depth by the

XPS method is a function of the take-off angle, 3λ sin(θ), where λ is the inelastic mean free path for

electrons and θ is the take-off angle. The analysed depth is defined as the depth from which 90% of

the XPS signal originates. In the present case, the analysed depth was in the range of 1.5 – 5 nm. The

radius of the analysed area during XPS analysis was 0.4 mm. The energy scale of XPS spectra and

possible charging effect were corrected using the C 1s peak of adventitious carbon at a binding energy

(EB) of 284.8 eV. After acquisition of the spectra, the data were processed with MultiPak software

(version 8.1) for Shirley [38] or linear background subtraction (in the case of the Cu 2p line [39]). The

accuracy of the EB scale is estimated to be 0.2 eV. Different features in the XPS spectra, such as pure

core-level transitions: Cu 2p, C 1s, O 1s, and N 1s, as well as the XPS-induced Auger peak Cu

L3L4,5M4,5, were analysed. Sputtering of the sample surface was performed with 1 keV Ar+ beam

rastering over an area of 4 by 4 mm [29, 33, 35].

The thicknesses of the adsorbed TRZ and 3-AT surface layers formed on the Cu after 1 h of

immersion were evaluated by examining selected sections of the XPS spectra using the Tougaard

method [40, 41]. This procedure is explained in detail in references [33, 35]. The spectra for the

Tougaard analysis were obtained at a take-off angle of 45°.

6

3 Results and Discussion

3.1 Change of mass vs. time measurements

A Cu-plated electrode was immersed in 3 wt.% NaCl solution containing 10 mM TRZ or 3-AT

and the change of mass vs. time at Eoc was measured during 1 day of exposure (86400 s, Fig. 2a). The

mass change on the QCM crystal for the present experimental conditions is mainly a consequence of

the formation of Cu-oxides or Cu-chlorides and adsorption of the organic molecules (TRZ or 3-AT) on

the Cu-plated surface. This method was employed to explore the differences in the time-dependent

surface layer formation process of the TRZ and 3-AT molecules.

Figure 2a shows that for both solutions the mass increases with time after immersion of the

Cu-plated electrode, indicating the formation of the inhibitor surface layers and possibly the formation

of cooper oxides and/or chlorides. The mass change after 1 day of immersion for solution containing

TRZ is more than six times higher compared with the solution containing 3-AT (162.3 µg cm–2

compared with 25.3 µg cm–2). Due to this, it is assumed that TRZ forms a thicker surface layer

compared with 3-AT (the thicknesses of both surface layers after 1 h of immersion will be determined

below). However, direct correlation of the mass increase on the Cu-plated electrode with the surface

layer thickness cannot be made, because along with inhibitor adsorption, the formation of copper

oxides and chlorides occurs. Simultaneously, also Cu corrosion occurs, which decreases the mass on

the QCM crystal. In the case of TRZ, the mass grows within the first 3000 s, then a small decrease is

observed (the local minimum is denoted with a dashed arrow in Fig. 2a), followed by a constant mass

increase until the end of the experiment. The slope of the curve changes several times, suggesting the

formation of different surface structures and orientations of TRZ molecules or multilayer adsorption

on the Cu surface [42]. In fact, Brusic et al. [42] observed different growth kinetics of BTAH on Cu,

which was correlated with the formation of at least two different structures. It was explained that the

BTAH molecules were adsorbed on the surface, forming the first chemisorbed layer on which

Cu(I)BTA complex was adsorbed (it is known that Cu(I) ions readily react with BTAH molecules,

which release a H+ ion and form the Cu(I)BTA complex [33]). In the case of TRZ, in the initial stage

of exposure (the first 180 s, Fig. 2b), the film growth can be best represented by linear growth, Δm vs.

t, following by logarithmic growth, Δm vs. log(t) (the transition from linear to logarithmic growth is

denoted by a dashed arrow in Fig. 2b). The logarithmic growth rate changes several times (seen from

the change of slopes in the inset of Fig. 2b). For comparison, a transition from parabolic to logarithmic

growth after 180 s was observed when the Cu-plated electrode was immersed in 3 wt.% NaCl solution

containing 10 mM BTAH [30].

7

Different behaviour was found for 3-AT. Initially, after 20 s of Cu-plated electrode exposure,

mass increases to ~1.4 µg cm–2 and in the next 10 s drops to ~0.6 µg cm–2 (denoted by a solid arrow in

Fig. 2b). Probably, within the first 30 s of exposure there is competition between adsorption of the

protective 3-AT and corrosion of the Cu-plated metal (mainly the formation of soluble copper

chlorides which diffuse into solution [30], and consequently the mass decreases). After 30 s the mass

starts to increase and the mass change vs. time can be best represented by logarithmic growth (as

found for TRZ, the growth rate for 3-AT also changes two times in the first 1000 s of immersion, seen

from the change in slopes in the inset of Fig. 2b). Subsequently, constant mass increase vs. time is

observed until the end of the experiment.

Chen et al. [43] have shown that the differences in the growth kinetics correlated with the

inhibition effectiveness of the formed films in the inhibitor-containing solutions. They claimed that

slower growing films are more complete, tight, and polymerized and have more protectiveness. Thus,

when the growth of the inhibitor film followed a logarithmic growth law it was more protective than

that which followed a parabolic growth law. Moreover, linear mass increment vs. time was correlated

with continuous ion movement through the poorly protective surface film. The differences in

inhibition effectiveness with the differences in growth kinetics have also been correlated before for

more protective BTAH, which initially followed a parabolic and later changed to a logarithmic growth

law, whereas less protective BTAOH film grew linearly [30]. Therefore, in the present investigation,

the differences in growth kinetics in the initial stage of adsorption, faster and linear growth for TRZ,

and slower and logarithmic growth for 3-AT, indicate that the 3-AT surface layer is denser and more

compact, and consequently can be more effective. In fact, this agrees with the results of the corrosion

tests that 3-AT is more effective than TRZ (the results of the corrosion tests are not shown herein),

thus confirming that the growth kinetics of the inhibitor surface layers can play an important role in

inhibition effectiveness. Below, an examination of the differences in surface bonding and molecule

orientation using ARXPS measurements will be carried out.

3.2 XPS measurements

3.2.1 Spectral analysis and chemical structure

It is known that Cu forms oxides that readily adsorb polar contaminants [35, 44]. In the present

experimental setup it is thus possible that after drying and during the transfer of the samples to the

spectrometer, when the Cu surface is briefly subjected to an air atmosphere, adsorption of adventitious

atmospheric species occurred. These molecules are usually carbonaceous species and can also oxidise

on the metal surface [33, 35, 45, 46].

8

The XPS measurements were performed on each sample at take-off angles (θ) of 5°, 20°, 45°,

and 90°. The Cu samples were immersed for 1 h in 3 wt.% NaCl solution containing 10 mM TRZ or

3-AT, thoroughly rinsed with Milli-Q water, dried with Ar gas, and immediately transferred to the

spectrometer. On the other hand, if longer immersion is employed, the surface layer becomes too thick

(more than 5 nm, due to the formation of the inhibitor layer and possibly also copper oxides/chlorides)

and the ARXPS analysis becomes less useful because the excitation source does not reach the

substrate. That is the main purpose of employing 1 h of immersion.

Figure 3 shows the survey spectra of the treated Cu surfaces (upper spectra). A survey

spectrum of sputter-cleaned high purity Cu is also given for comparison (lower spectrum). Sputtering

was performed for 3-AT-treated Cu by Ar-ion bombardment until the surface was free of carbon and

oxygen. Peaks representing species containing Cu, C, O, and N on the surface are present for both

samples treated. Additionally, a Cl 2p peak at EB of 198.3 eV, an X-ray-induced Auger Na KL2,3L2,3

peak at EB of 496.8 eV, and a Na 1s peak at EB of 1071.8 eV (positions determined with MultiPak

software) are present for the 3-AT-treated sample, indicating that some of the NaCl and possibly CuCl

or CuCl2 (the latter two are corrosion products [7]) remained on the surface even though extensive

rinsing with Milli-Q water was performed. In fact, the position of the Cl 2p peak for the CuCl, CuCl2,

and NaCl was reported to be at EB of 199.1–199.5 eV, 198.2–200.0 eV, and 198.2–199.1 eV,

respectively [47]. Thus, as the signal for Na was also detected, NaCl is most likely present on the

surface. Moreover, the Cu 2p peak position also corresponds to CuCl2 (and not CuCl) on the surface,

even though this salt is highly soluble in aqueous solution. It is possible that it remained trapped in the

3-AT surface layer [45, 46]. The presence of a Cl 2p peak was previously reported also for

BTAOH-treated Cu under similar experimental conditions (the difference was only that 1 mM

BTAOH was employed, whereas a 10 mM concentration of inhibitors was employed in the present

case) [33]. Moreover, Hashemi and Hogarth [48] also reported the presence of a chlorine peak on the

surface for BTAH-treated Cu in chloride solution. The authors suggested that chlorine is involved in

the surface complex. The involvement of the chlorine in the surface complex of 3-AT also cannot be

excluded. On the other hand, the Cl 2p, X-ray-induced Auger Na KL2,3L2,3, and Na 1s peaks are

missing on the survey spectrum for the TRZ-treated surface. Therefore, NaCl, CuCl, and CuCl2 did not

remain on the surface after rinsing the samples and chloride is not involved in the surface layer of

TRZ. This was also observed before for BTAH-treated Cu [33] and MBIH-treated Cu [35] under

similar experimental conditions (a lower 1 mM concentration of MBIH in 3 wt.% NaCl, and the same

10 mM concentration of BTAH in 3 wt.% NaCl were employed).

The Cu 2p, XPS-induced Auger Cu LMM, Cu 3s, and Cu 3p peaks in Fig. 3 originate from Cu

species in either Cu substrate, Cu2O, a Cu-inhibitor complex, or from a combination of all three [29,

33, 35]. The source of O 1s mainly comes from the oxidised Cu. Oxidised atmospheric species

(adventitious carbon species – sometimes called contamination), which could adsorb on the Cu surface

9

during sample drying and transfer to the spectrometer [33, 35, 45, 46], are the second possible source

of oxygen. Organic molecules could also oxidise on the surface after their adsorption on the Cu

surface, thus contributing to the O 1s signal. The source of the O 1s signal can also come from the

water molecules that remained on the surface after sample drying. A discussion of which species

containing oxygen are the most probable on the surface will be given below. The presence of the C 1s

and N 1s peaks in Fig. 3 for the TRZ- and 3-AT-treated Cu is a strong indication that these molecules

were adsorbed on the surface. The C 1s signal could also arise from the adsorbed carbonaceous species

(contamination). The lowest curve in Fig. 3 shows that the C 1s, N 1s, O 1s, Cl 2p, X-ray-induced

Auger Na KL2,3L2,3, and Na 1s peaks vanish after prolonged sputtering time, indicating complete

removal of the inhibitor layer, oxygen-containing species, NaCl, and CuCl2.

Chemicals were employed with 99.5 wt.% (TRZ) and 95.0 wt.% (3-AT) purity, thus the

presence of impurities has to be considered. However, no peaks representing other compounds were

present in the survey spectra in Fig. 3. It is thus reasonable to assume that the strong and characteristic

N 1s and C 1s peaks originated from the TRZ and 3-AT adsorbed on the Cu surface and that

impurities possibly present in the chemical did not adsorb and subsequently did not affect the

adsorption of these compounds.

3.2.2 Peak evaluation

By decreasing the θ (take-off angle) of the measurement, surface sensitivity increases and

most of the signal comes from the topmost species. Figures 4 and 5 show high-resolution spectra

measured for the TRZ- and 3-AT-treated Cu at θ = 5°, 20°, 45°, and 90°, respectively. As discussed

above, the adsorption of TRZ and 3-AT on the Cu surface can be established from the N 1s and C 1s

peaks (Fig. 3). High-resolution spectra were measured after Cu immersion for 1 h in 3 wt.% NaCl

solution containing 10 mM TRZ or 3-AT, rinsing with Milli-Q water and drying with Ar gas.

3.2.2.1 Cu 2p spectra

The Cu 2p spectrum is composed of two peaks, i.e. Cu 2p1/2 and Cu 2p3/2. The NIST standard

reference database [47] reports that the Cu 2p1/2 and Cu 2p3/2 peaks for the pure Cu are located at EB of

952.45–952.56 eV and 932.20–933.1 eV, respectively. The presence of the typical shake-up satellites

in the Cu 2p spectrum indicate that the Cu(II) species are present on the surface [49, 50]. The most

probable Cu(II)-containing species for the present experimental condition (Cu in aqueous chloride

solution containing inhibitor) are CuO, Cu(OH)2, and CuCl2. However, the formation of

Cu(II)-complexes composed of Cu(II) ions and TRZ or 3-AT molecules also cannot be excluded. For

example, Xue et al. [51] proposed that a Cu2+MBI2ˉ polymeric complex is formed on the Cu surface

10

when Cu is treated in MBIH-containing solution. The NIST standard reference database [47] reports

that the positions of the Cu 2p3/2 peaks for the Cu2O, CuO, and Cu(OH)2 are at EB of 932.0–932.8 eV,

932.7–934.6 eV, and 934.4–935.1 eV, respectively [47, 50]. Furthermore, the positions of the Cu 2p3/2

peaks for the CuCl and CuCl2 are at EB of 932.2–932.6 eV and 934.0–935.6 eV, respectively [47].

However, it was explained above that CuCl is less likely to be present in the case of 3-AT and no

chloride-containing species are present for TRZ-treated Cu.

In the case of TRZ-treated Cu (Fig. 4a), the shake-up satellites are expressed only (but not

intensely, the position at the dashed lines in Fig. 4a) at θ = 20° and 45°, and to a lesser extent at 90°.

Thus the presence of the Cu(II) species on the TRZ-treated Cu cannot be excluded, but the amount is

probably low compared with the Cu(I) species and Cu, which mainly contribute to the intensity of the

Cu 2p spectrum. These shake-up satellites are not intensely expressed at θ = 5°, because Cu(II) species

are most likely not located at the topmost position (or their amount is very low), where most of the

signal comes from. Moreover, the signal of the shake-up satellites is also not intense at θ = 90°

probably due to the low amount on the Cu(II) species compared with the pure Cu (Cu(0)) and Cu(I)

species on the surface from which the Cu 2p signal prevails (no such intensely expressed shake-up

satellites are present in the case of Cu(I) or Cu(0) species). In the case of 3-AT-treated Cu, the Cu 2p

spectra show clearly expressed shake-up satellites for all measured angles, suggesting that Cu(II)

species are present on the surface (the position at the dashed lines in Fig. 5a). On the other hand, no

Cu(II) species were found previously on the surfaces for the BTAH-, BTAOH-, and MBIH-treated Cu

under similar experimental conditions (a lower 1 mM concentration of MBIH in 3 wt.% NaCl, and the

same 10 mM concentration of BTAH and BTAOH in 3 wt.% NaCl were employed) [29, 33, 35].

The main Cu 2p3/2 peak in the case of TRZ- and 3-AT-treated Cu is located at EB of 932.4–

932.8 eV measured for all θ. This position corresponds to the presence of Cu2O, CuCl, and pure Cu on

the surface. However, the presence of CuCl on the surface is less likely in the case of 3-AT (see the

previous section) and no chlorine species remained on the surface in the case of TRZ. Moreover, in the

case of 3-AT, the intensity of the shoulder on the high EB side of the Cu 2p3/2 peak at 934.6 eV (the

position at the solid line in Fig. 5a) increases with increasing analysed depth. At θ = 45° and 90° this

shoulder is clearly expressed and indicates the presence of the Cu(OH)2 and/or CuCl2 on the surface

due to the EB positions given above (the presence of CuO will be excluded below in the O 1s peak

analysis for both molecules). In the case of 3-AT, this feature increases with analysed depth and

therefore the Cu(II) species are most likely located closer to the interface with the Cu substrate. For

the TRZ-treated Cu, the feature (the shoulder) representing Cu(II) species is observed at θ = 20° and

45° (but not intensely, the position at the solid line in Fig. 4a), which also suggests the presence of

Cu(OH)2 (not CuCl2 and CuO) on the surface. The same explanation as given above for the presence

and absence of shake-up satellites at different θ in the case of TRZ probably applies also for the

11

feature representing Cu(II) species in the Cu 2p3/2 peak, because shake-up satellites are representative

of the Cu(II) species.

3.2.2.2 X-ray-induced Auger Cu L3M4,5M4,5 spectra

The Cu 2p spectrum cannot be used to differentiate between metallic Cu and Cu(I) species,

whereas the shape of the XPS-induced Auger Cu L3M4,5M4,5 spectrum could be used for that purpose

[29, 33, 35]. The X-ray-induced Auger Cu L3M4,5M4,5 spectra for both samples treated are given in

Figs. 4b and 5b. In refs. [29, 33] an XPS-induced Auger Cu L3M4,5M4,5 spectrum representing the

Cu2O surface measured at θ = 5° was explained in detail and is given here for comparison (also the

spectrum for the sputter-cleaned Cu surface is given – the lowest spectrum). Four distinct peaks

labelled 1–4 are present for the spectrum of pure Cu (sputter-cleaned), with the main peak, peak 2,

located at 568.1 eV. The value of 568.3 eV was reported before due to the correction scale for C 1s

adventitious carbon at 285.0 eV [33] (in this study 284.8 eV was employed). A characteristic of pure

Cu is the intense peak 2 (seen on the lowest spectrum in Figs. 4b and 5b). It was reported before that a

combination of an intense peak 3 (at 570.4 eV) and a less intensely expressed peak 2 in the

XPS-induced Auger Cu L3M4,5M4,5 spectrum is an indication that Cu2O and/or Cu(I) species are on the

surface (seen also for the spectrum representing Cu2O in Figs. 4b and 5b) [29].

X-ray-induced Auger Cu L3M4,5M4,5 spectra, for both TRZ- and 3-AT-treated Cu, measured at

θ = 5° and 20° in Figs. 4b and 5b show intense features at the positions of peaks 3 and 4 and less

intensely expressed features at the positions of peaks 1 and 2. At θ = 45° and 90°, the intensity of the

feature at the position of peak 4 decreases on the high EB side of the XPS-induced Auger Cu

L3M4,5M4,5 spectra and the shape of the spectra becomes similar to the spectrum representing Cu2O.

This may indicate that the excitation source is deep enough to reach the Cu2O under-layer below the

inhibitor layer and that the contribution of the topmost species to the shape of the XPS-induced Auger

Cu L3M4,5M4,5 spectrum for that θ is small (due to the low amount). Thus, the topmost species are

different than Cu2O and could represent a Cu-inhibitor connection. This feature on the high EB side of

the XPS-induced Auger Cu L3M4,5M4,5 spectrum was used before to differentiate between the

Cu(I)-MBIH [35] or Cu(I)-BTAH [29, 33] complexes (or inhibitor-Cu connections) and Cu2O on the

surface. Moreover, in case CuO was present on the surface (but the presence of CuO is less likely on

both surfaces, as explained below for the O 1s spectra), it would contribute to the increased intensity

of peak 2 at about 568.5 eV [52]. The presence of Cu(OH)2 on the surface would contribute to the

increased intensity of peak 3 located at 570.4 eV [52]. Therefore, the features representing the

characteristic connections of Cu-TRZ or Cu-3-AT in Figs. 4b and 5b are located at higher EB

compared with the signal which would possibly originate from CuO or Cu(OH)2. This characteristic

12

connection thus corresponds to Cu-inhibitor bonding or complexes. However, it is less certain if Cu(I)

or Cu(II) ions are involved in that connection.

The existence of the complex formed between Cu(I) ions and TRZ, i.e. Cu(I)-TRZ complex, has

already been assumed before [1, 2, 23]. Antonijević et al. [23] claim that triazole compounds in

chloride solutions chemisorb on the Cu surface and form complexes with Cu(I) ions which prevent the

formation of CuCl2¯ and thus decrease the rate of corrosion. On the other hand, the formation of

1,2,4-triazole-based Cu(II) complex was reported before [53-55], but with different 1,2,4-triazole

derivative compounds than used in this work. Furthermore, Fox and Bradley [2] claim that a surface

layer of Cu(I) complex is formed at low TRZ concentrations, but it is not effective in preventing

corrosion until a critical concentration of Cu(II) complex is reached which increases inhibition

effectiveness. They also suggested that TRZ is attached to the precipitated Cu(II) hydroxychloride,

which provides the corrosion protective layer. Thus, a low amount of Cu(II) species (found for

TRZ-treated Cu, see the explanation for the Cu 2p spectra above) and consequently no Cu(II)

hydroxychloride presence (no chlorine species were detected in the case of TRZ-treated Cu) could

explain the lower corrosion inhibition effectiveness of TRZ compared with 3-AT found in the

corrosion tests (these results are not shown herein).

3.2.2.3 N 1s spectra

No significant difference in the shape of the high-resolution N 1s spectra when going from 5° to

90° is observed for both TRZ- and 3-AT-treated Cu (Figs. 4c and 5c). On the other hand, in the case of

3-AT, a shift of the N 1s peak by approximately 0.8 eV to the higher EB is observed for the

measurement at θ = 5° compared with the measurements at θ = 20°, 45°, and 90°, indicating two

different nitrogen environments (Fig. 5c). This implies that the environment of N atoms in the 3-AT

molecules closer to the outer surface is different compared with the environment of N atoms in the 3-

AT molecules, which are closer to the substrate. It is likely that multilayer adsorption occurs with the

inner (very first) 3-AT layer bonded to the Cu surface via N atoms and subsequent 3-AT layers (one or

more) are physisorbed on that very first layer. Moreover, it is probable that 3-AT adsorbs on the Cu

surface via both a N atom from the triazole ring (N1 or N2 or both) and a N atom in the amino group

in a bridge configuration [8]. Then the N environment of the bonded 3-AT molecules is different

compared with that in the non-bonded molecules (physisorbed). Similar has previously been proposed

also for MBIH (connection via N and S atoms) [35, 56]. On the other hand, no shift in the N 1s

spectrum is seen for the TRZ-treated surface measured for all angles (Fig. 4c) and thus no such

explanation exists for this molecule for the 3-AT-treated Cu.

13

3.2.2.4 C 1s spectra

Figures 4d and 5d show high-resolution C 1s spectra. For both TRZ- and 3-AT-treated Cu,

when going from 5° to 90° (increasing the signal for the region of the substrate and inhibitor

connection), the feature on the high EB side of the C 1 s peak becomes more intense (the position at the

dashed line 2 at EB around 286.5 eV). This is especially pronounced for the 3-AT-treated Cu (Fig. 5d)

and could imply that the molecules bond to the surface via C atoms. However, this option is less likely

to be true, because the connection of the azole molecules with the metal surface does not usually occur

through C atoms [29, 33, 35, 57]. One option is that the molecules are physisorbed via van der Waals

interactions, with molecular geometries nearly parallel (lying) to the Cu surface [8]. However, as will

be shown in the next section, this option is also excluded due to the probable upright tilted orientation

of the molecules. Moreover, if the molecules were lying on the surface, a change in the carbon

environment (and consequently, peak shapes) by increasing the analysed depth would not have been

noticed, but it was. The most probable option is that the molecules containing carbon (contamination)

were adsorbed on the inhibitor layer during drying and the transfer of the samples to the spectrometer

and were positioned at the topmost position. This would explain different C environments for the

molecules at the topmost position (the position of the C 1s peak is at EB of 284.8 eV for the

non-oxidised carbon-containing contamination comprising C–C groups) and molecules closer to the

inhibitor-substrate connection region (TRZ and 3-AT molecules, where C atoms are bonded to N

atoms and consequently the C 1s peak is located at a higher EB than the C 1s peak for the C–C

connection). Moreover, a feature at EB of 286.5 eV would correspond to the groups containing a

carbon-oxygen bond, i.e. a C–O group as ether or hydroxyl, which is usually found on the metal

surfaces due to the adsorbed oxidised carbonaceous species from the atmosphere [33, 46]. These

groups could contribute to the more intense feature on the high EB side of the C 1s peak in Figs. 4d

and 5d. However, as the intensity of this feature increases when going from 5° to 90°, this signal most

likely comes from the adsorbed TRZ and 3-AT molecules and not from the oxidised carbonaceous

species (contamination), because contamination is located at the topmost position. If oxidised

carbonaceous species were present on the surface at the topmost position, this signal would need to

decrease with increasing θ (increasing the analysed depth). Moreover, it is also possible that TRZ and

3-AT molecules oxidised and that C–O groups were formed, which would explain the shoulder on the

high EB side of the C 1s peak in Figs. 4d and 5d. However, oxidation of these molecules is less likely

to occur because of their stable nature. The same has also previously been reported for the MBIH

molecule [35, 58].

3.2.2.5 O 1s spectra

14

In the case of TRZ (Fig. 4e), the O 1s peak at around 530.6 eV (dashed line 1) corresponds to

Cu2O [47, 59, 60]. The NIST standard reference database [47] quotes only one reference that reports

the position of the O 1s peak for CuO more positive than 530.0 eV [61]. All the other references

therein report that the position of the O 1s peak for CuO is at EB ≤ 530.0. It is thus likely that Cu2O is

present on the surface and not CuO. The narrow peak at dashed line 1 is clearly expressed at θ = 90°,

where the excitation source is deep enough to reach the copper oxide below the inhibitor layer. When

going from 90° to 5° the O 1s peak becomes broader and it is transferred to the higher EB. Compared

with the measurement at 90°, the position of the main O 1s peak at θ = 5° is at EB of 531.6 eV (dashed

line 2), which is 1.0 eV more positive compared with the main peak at θ = 90°. Therefore, the

environment of the species containing oxygen at the topmost position of the surface is different than

that of Cu2O. As explained above for the C 1s spectra, the presence of oxidised carbonaceous species

at the topmost position is less likely. It is probable that water molecules remained on the surface at the

topmost position, which are hydrogen bonded to N atoms in the TRZ surface layer [45, 46, 58-60, 62].

Water molecules remaining on the surface have been reported before for MBIH-treated Cu [35].

However, the O 1s signal for water appears at 532.8-538.0 eV [47] and therefore this option is less

likely to be true in the case of TRZ-treated Cu. On the other hand, it has been reported that the O 1s

signal at EB of 531.5 eV corresponds to Cu(OH)2 [63]. Therefore, the presence of Cu(OH)2 on the

surface can contribute to the increased feature at the position of dashed line 2 for the TRZ-treated Cu.

However, as explained above for the Cu 2p spectra, the amount of Cu(II)-containing species is very

low at the topmost position.

In the case of 3-AT-treated Cu, no significant change in the O 1s spectra shape and position is

observed for all measured angles and the same explanation as given above for TRZ cannot be made.

However, the O 1s peak in Fig. 5e is located at EB of 531.3 eV, which is close to the position

representing Cu(OH)2 and its presence on Cu for the 3-AT-treated surface also cannot be excluded. It

is probable that the signals representing Cu2O and Cu(OH)2 overlap and they are both present on the

surface of 3-AT-treated Cu.

3.2.2.6 Cl 2p, X-ray-induced Auger Na KL2,3L2,3, and Na 1s spectra

In the case of 3-AT-treated Cu, detailed angle-resolved XPS analyses of the chlorine- and

sodium-containing species were not performed due to the very low intensity signals for Cl 2p,

X-ray-induced Auger Na KL2,3L2,3, and Na 1s spectra (also other peaks representing these two species

had low intensity) with a great deal of noise, suggesting that they are present in a small amount on the

surface. Moreover, the explanation of the Cl 2p peak position and suggestion of NaCl and possibly

also CuCl2 and/or chloride-containing 3-AT surface complex on the surface were already given above.

15

3.2.3 Evaluation of peak intensities in the XPS spectra

Considering the above discussion, it is concluded that the most probable species on both

treated surfaces are, beside metallic Cu, TRZ, and 3-AT molecules, adsorbed carbonaceous species

(contamination), Cu2O, and Cu(OH)2, and in the case of 3-AT, a low amount of NaCl and possibly

CuCl2 and/or chloride-containing complex.

With continuous ARXPS measurements from low to high take-off angles, information is

obtained about the orientation of TRZ and 3-AT molecules and the way they bond to the Cu surface

[29, 33, 35]. To estimate the orientation of molecules, the raw peak intensities were used instead of the

calculated atomic concentrations (the reason for this is explained in refs. [33, 35]). Intensities were

obtained at take-off angles of 5°, 20°, 45°, and 90° for the Cu 2p, C 1s, O 1s, and N 1s peaks from

high-resolution XPS spectra measured for the TRZ- and 3-AT-treated Cu. Shirley background

subtraction [38] was applied for all the peaks except for Cu 2p, to which linear background subtraction

was applied [39]. The ratios of the intensities IC 1s/ICu 2p, IO 1s/ICu 2p, IN 1s/ICu 2p, IC 1s/IN 1s, IO 1s/IN 1s, and IO

1s/IC 1s were calculated and are given in Table 1.

The analysed depth increases with increasing θ. The signal for Cu 2p mainly comes from the

Cu metal or Cu2O, when a thicker subsurface region is analysed. Therefore, due to the TRZ and 3-AT

overlayers on the Cu substrate, the intensity ratios of IC 1s/ICu 2p, IO 1s/ICu 2p, and IN 1s/ICu 2p decrease with

increasing θ (Table 1). The deviation from this decreasing trend is only seen for the IN 1s/ICu 2p intensity

ratio when going from 5° to 20° in the case of 3-AT. It is not reasonable to assume that a higher

amount of Cu species relative to N-containing species is at the topmost region (θ = 5°) compared with

the deeper inner region (θ = 20°). The reason is probably due to the low amount of both N and Cu

species at the topmost position and the fact that the signal to noise ratio is larger compared with the

measurements at higher θ, making this calculation less certain at 5°. Also, the difference is rather

small (0.38 compared with 0.40). However, by increasing θ from 20° to 45°, and 90° in the case of

3-AT, the analysed depth increases, reaching more Cu 2p signal, and consequently this ratio decreases.

In the case of both TRZ and 3-AT, the IC 1s/IN 1s intensity ratio decreases with increasing θ,

indicating that the carbon atoms of these molecules are closer to the outer surface and that nitrogen

atoms are closer to the Cu substrate. It is thus likely that the molecules do not lie flat on the surface,

but rather have an upright position through the interaction of the N-Cu with the substrate. However,

the molecules are rather tilted between the perpendicular and the planar (lying) forms and are not

perpendicular to the surface. Moreover, it was suggested above that carbonaceous contamination

(containing C–C bonds) is located at the topmost position. This could also explain the decrease in the

IC 1s/IN 1s intensity ratio with increasing θ. However, as this ratio continuously decreases with

increasing θ, it is more likely that both TRZ and 3-AT molecules are in an upright tilted position even

though the contamination was adsorbed on the top of the inhibitor layers.

16

The IO 1s/IN 1s intensity ratio for the TRZ-treated Cu is higher at 5° compared with that at 20°

and 45° and lower compared with that at 90°. This implies that the relative atomic concentration of

O-containing species compared with N-containing species is higher at the topmost position (θ = 5°)

than in the middle surface layer region (θ = 20° and 45°). It was explained above for the O 1s

spectrum in the case of TRZ that the topmost species is most likely Cu(OH)2. Combining these two

results together would mean that the Cu(OH)2 is located on top of the TRZ surface layer. However, a

more probable explanation is patchy adsorption of TRZ, with islands uncovered by this compound,

where Cu(OH)2 is on top of the Cu2O and not on top of the TRZ-surface layer, thus contributing to the

increased O 1s signal at θ = 5°. At 90°, the IO 1s/IN 1s intensity ratio is the highest because the excitation

source is deep enough to reach the Cu2O under-layer below the TRZ surface layer or Cu(OH)2.

In the case of 3-AT, the IO 1s/IN 1s intensity ratio decreases with increasing θ from 5° to 45°.

This indicates that more O 1s signal is obtained from Cu2O or Cu(OH)2 by increasing the analysed

depth. However, at 90° this ratio is lower than at 20° and 45°. It is not reasonable to assume that more

N-containing compared with O-containing species are present in the inner region (the closest to the

substrate) than in the middle surface region (for θ = 20° and 45°), because of the oxidised Cu metal

(Cu2O and Cu(OH)2). However, by changing the θ from 45° to 90°, a slightly different area is analysed

(due to the fixed X-ray radiation source) and a slightly different composition, if present, on different

places of the surface is analysed. Moreover, the θ change is the highest when going from 45° to 90°.

Therefore, as suggested above, it is probable that also patchy 3-AT adsorption occurred with some

areas remaining uncovered or different structures of the surface layers being present at the different

sites on the surface. In fact, uncovered (by the inhibitor) islands composed of Cu oxides and/or

hydroxides in the 3 wt.% NaCl solution containing 3-AT have been reported previously [8]. Moreover,

patchy BTAH adsorption on the Cu surface has been observed before at low BTAH concentrations,

which led to the formation of some CuO on top of the Cu surface [64].

The IO 1s/IC 1s intensity ratio increases with increasing θ for the TRZ-treated Cu, because by

increasing the analysed depth more O 1s signal is obtained from the Cu2O. In the case of the IO 1s/IC 1s

intensity ratio, the situation is different than was the case for the IO 1s/IN 1s intensity ratio. As the

IO 1s/IC 1s intensity ratio decreases when going from 5° to 90°, this confirms that the TRZ molecules are

oriented on the surface in such a way that the carbon atoms of the TRZ molecules are closer to the

outer surface and that the nitrogen atoms are directed toward the interior. That way the relative

concentration of N atoms at the topmost position is lower than in the middle surface layer region,

which affects the IO 1s/IN 1s intensity ratio more compared with the IO 1s/IC 1s intensity ratio (the

influence of the signal to noise ratio is more susceptible).

In the case of 3-AT-treated Cu, the IO 1s/IC 1s intensity ratio increases from 5° to 45°. However,

at 90° this ratio is lower than at 20° and 45°, as also found for the IO 1s/IN 1s intensity ratio. The same

explanation as given above for the IO 1s/IN 1s intensity ratio regarding patchy adsorption is also probable

17

in this case. However, in this case the difference is smaller (0.49 and 0.52 for the IO 1s/IC 1s intensity

ratios compared with 0.40 and 0.47 for the IO 1s/IN 1s intensity ratios, Table 1)

As discussed above, for the 3-AT-treated Cu the position of chlorine- and sodium-containing

species (NaCl and possibly CuCl2 and/or chloride-containing complex) was not investigated because

of the low intensity signal for these species.

3.2.4 Thicknesses of the TRZ and 3-AT surface layers

For the determination of a thin layer thickness by XPS, the IMFP value for the Cu L3L4,5M4,5

transition at a kinetic energy of 920 eV is required. However, this parameter is difficult to obtain with

the required accuracy and for TRZ- and 3-AT-treated Cu it is not exactly known. The IMFP used

before for the calculation of the BTAH and BTAOH thicknesses on Cu was 2.96 nm, assuming the

formation of an organic layer based on a reference database [65]. Moreover, two limiting IMFP values

for the MBIH-treated Cu have been employed previously, i.e. 2 and 4 nm [35]. This was done based

on previous studies of mercapto compounds, where IMFP values of 2, 3, 3.3, and 3–4 nm were

reported [58, 66-68]. Herein, due to the similar situation investigated, the same IMFP limiting values

were employed for Tougaard analysis (2 and 4 nm). The minimum and maximum IMFP values were

used to estimate the uncertainty (error). In both cases, simple structures, consisting of an organic layer

on the substrate, were taken as the input data for this method.

In applying this method, the theoretical background curve is calculated and adjusted until

satisfactory agreement with the measured one is obtained. The thicknesses of the TRZ and 3-AT

overlayers were the input parameters during this procedure [33]. The final results are given in Fig. 6.

In the case of TRZ for IMFP of 2 and 4 nm thicknesses of 1.1 nm and 2.1 nm were obtained,

respectively (Figs. 6a and b). On the other hand, in the case of 3-AT for IMFP of 2 and 4 nm,

thicknesses of 0.6 nm and 1.2 nm were obtained, respectively (Figs. 6c and d). Therefore, by taking

these two limiting parameters into account, it was concluded that the TRZ and 3-AT layer thicknesses

on the Cu surface are 1.6 ± 0.5 nm and 0.9 ± 0.3 nm, respectively. Moreover, it has previously been

reported by employing the same method that the thicknesses of the MBIH, BTAH, and BTAOH

overlayers on Cu were 1.9 ± 0.5 nm, 1.5 ± 0.3 nm, and 0.5 ± 0.2 nm, respectively. These surface layers

were formed under similar conditions as in this study (a lower 1 mM concentration of MBIH in 3

wt.% NaCl, and the same 10 mM concentration of BTAH and BTAOH in 3 wt.% NaCl were

employed [33, 35]). For comparison, Lewis and Fox [69] also reported that the thickness of the

BTAH surface layer on Cu is in the range of 1–3 nm. Moreover, Roberts reported that the Cu(I)BTA

layer thickness formed on the Cu2O was 1.5 ± 0.7 nm [70].

Thicker TRZ compared with 3-AT surface layer was already assumed before from EQCM

measurements, where mass increase in the former case was higher after 1 h of immersion (also after 1

18

day, see Fig. 2).

19

4 Conclusions

The surface layer formation of copper corrosion inhibitors during 1 day of Cu-plated electrode

immersion in 3 wt.% NaCl solution containing 10 mM 1,2,4-triazole (TRZ) and 3-amino-1,2,4-triazole

(3-AT) was investigated by EQCM. Next, XPS surface analysis was performed of pure Cu after

immersion for 1 h in the same solutions. The main findings are the following:

1. EQCM measurements showed that differences in the growth kinetics in the initial stage of

adsorption exist, i.e. that growth for TRZ is faster and linear and slower and logarithmic for

3-AT. As 3-AT is a more effective corrosion inhibitor than TRZ, it can be concluded that the

growth kinetics of the inhibitor surface layers plays an important role in inhibition

effectiveness.

2. XPS measurements showed that a higher amount of Cu(II) species was present on the surface

of 3-AT-treated Cu compared with TRZ-treated Cu. Chlorine-containing species were found

on the surface of the 3-AT-treated Cu, but not of TRZ-treated Cu. A characteristic feature in

the XPS-induced Auger Cu L3M4,5M4,5 spectra were found for both compounds, representing

the formation of Cu-inhibitor bonding or complexes.

3. The environment of the N atoms in the 3-AT molecules, examined by the XPS method,

suggests two different kinds of bonding – the inner, very first 3-AT layer is bonded to the Cu

surface via N atoms, and subsequent 3-AT layers are physisorbed on that very first layer. On

the other hand, no difference in the N environment of the TRZ molecules in the inner and

outer layers was observed. Therefore, the amino group at position C3 is needed in the TRZ

molecule to provide a different kind of adsorption compared with TRZ adsorption, which

consequently improves corrosion inhibition effectiveness.

4. Angle-resolved XPS measurements suggest that TRZ and 3-AT molecules are directed to the

Cu surface via N atoms.

5. The thicknesses of the TRZ and 3-AT layers on the Cu surface formed after 1 h of immersion

are 1.6 ± 0.5 nm and 0.9 ± 0.3 nm, respectively, as determined by the Tougaard method.

Acknowledgements

The author would like to thank Dr. Janez Kovač, Dr. Miha Čekada, and Dr. Peter Panjan for their

valuable discussions.

20

5 References

[1] S. El Issami, L. Bazzi, M. Mihit, B. Hammouti, S. Kertit, E.A. Addi, R. Salghi, Triazolic compounds as corrosion inhibitors for copper in hydrochloric acid, Pigm. Resin. Technol., 36 (2007) 161-168. [2] P.G. Fox, P.A. Bradley, 1 : 2 : 4-triazole as a corrosion inhibitor for copper, Corrosion Science, 20 (1980) 643-649. [3] M.L. Zheludkevich, K.A. Yasakau, S.K. Poznyak, M.G.S. Ferreira, Triazole and thiazole derivatives as corrosion inhibitors for AA2024 aluminium alloy, Corrosion Science, 47 (2005) 3368-3383. [4] B. Trachli, M. Keddam, H. Takenouti, A. Srhiri, Protective effect of electropolymerized 3-amino 1,2,4-triazole towards corrosion of copper in 0.5 M NaCl, Corrosion Science, 44 (2002) 997-1008. [5] E.-S.M. Sherif, R.M. Erasmus, J.D. Comins, Effects of 3-amino-1,2,4-triazole on the inhibition of copper corrosion in acidic chloride solutions, Journal of Colloid and Interface Science, 311 (2007) 144-151. [6] E.-S.M. Sherif, R.M. Erasmus, J.D. Comins, Corrosion of copper in aerated synthetic sea water solutions and its inhibition by 3-amino-1,2,4-triazole, Journal of Colloid and Interface Science, 309 (2007) 470-477. [7] M. Finšgar, I. Milošev, B. Pihlar, Inhibition of copper corrosion studied by electrochemical and EQCN techniques, Acta Chim. Slov., 54 (2007) 591-597. [8] A. Kokalj, S. Peljhan, M. Finšgar, I. Milošev, What Determines the Inhibition Effectiveness of ATA, BTAH, and BTAOH Corrosion Inhibitors on Copper?, Journal of the American Chemical Society, 132 (2010) 16657-16668. [9] A. Lalitha, S. Ramesh, S. Rajeswari, Surface protection of copper in acid medium by azoles and surfactants, Electrochimica Acta, 51 (2005) 47-55. [10] W. Qafsaoui, C. Blanc, N. Pébère, H. Takenouti, A. Srhiri, G. Mankowski, Quantitative characterization of protective films grown on copper in the presence of different triazole derivative inhibitors, Electrochimica Acta, 47 (2002) 4339-4346. [11] W. Qafsaoui, C. Blanc, J. Roques, N. Pebere, A. Srhiri, C. Mijoule, G. Mankowski, Pitting corrosion of copper in sulphate solutions: inhibitive effect of different triazole derivative inhibitors, Journal of Applied Electrochemistry, 31 (2001) 223-231. [12] W. Qafsaoui, C. Blanc, N. Pebere, H. Takenouti, A. Srhiri, G. Mankowski, Quantitative characterization of protective films grown on copper in the presence of different triazole derivative inhibitors, Electrochimica Acta, 47 (2002) 4339-4346. [13] Z. Mountassir, A. Srhiri, Electrochemical behaviour of Cu–40Zn in 3% NaCl solution polluted by sulphides: Effect of aminotriazole, Corrosion Science, 49 (2007) 1350-1361. [14] K. Rahmouni, H. Takenouti, N. Hajjaji, A. Srhiri, L. Robbiola, Protection of ancient and historic bronzes by triazole derivatives, Electrochimica Acta, 54 (2009) 5206-5215. [15] M. Elbakri, R. Touir, M. Ebn Touhami, A. Srhiri, M. Benmessaoud, Electrosynthesis of adherent poly(3-amino-1,2,4-triazole) films on brass prepared in nonaqueous solvents, Corrosion Science, 50 (2008) 1538-1545. [16] B.D. Mert, M.E. Mert, G. Kardaş, B. Yazıcı, Experimental and theoretical studies on electrochemical synthesis of poly(3-amino-1,2,4-triazole), Applied Surface Science, 258 (2012) 9668-9674. [17] Z. Khiati, A.A. Othman, M. Sanchez-Moreno, M.C. Bernard, S. Joiret, E.M.M. Sutter, V. Vivier, Corrosion inhibition of copper in neutral chloride media by a novel derivative of 1,2,4-triazole, Corrosion Science, 53 (2011) 3092-3099. [18] E.-S.M. Sherif, A.M. El Shamy, M.M. Ramla, A.O.H. El Nazhawy, 5-(Phenyl)-4H-1,2,4-triazole-3-thiol as a corrosion inhibitor for copper in 3.5% NaCl solutions, Materials Chemistry and Physics, 102 (2007) 231-239.

21

[19] Y.-C. Pan, Y. Wen, R. Zhang, Y.-Y. Wang, Z.-R. Zhang, H.-F. Yang, Electrochemical and SERS spectroscopic investigations of 4-methyl-4H-1,2,4-triazole-3-thiol monolayers self-assembled on copper surface, Applied Surface Science, 258 (2012) 3956-3961. [20] K. Rahmouni, N. Hajjaji, M. Keddam, A. Srhiri, H. Takenouti, The inhibiting effect of 3-methyl 1,2,4-triazole 5-thione on corrosion of copper in 3% NaCl in presence of sulphide, Electrochimica Acta, 52 (2007) 7519-7528. [21] Sudheer, M.A. Quraishi, Electrochemical and theoretical investigation of triazole derivatives on corrosion inhibition behavior of copper in hydrochloric acid medium, Corrosion Science, 70 (2013) 161-169. [22] E.-S.M. Sherif, R.M. Erasmus, J.D. Comins, Corrosion of copper in aerated acidic pickling solutions and its inhibition by 3-amino-1,2,4-triazole-5-thiol, Journal of Colloid and Interface Science, 306 (2007) 96-104. [23] M.M. Antonijević, S.M. Milić, M.B. Petrović, Films formed on copper surface in chloride media in the presence of azoles, Corrosion Science, 51 (2009) 1228-1237. [24] S. Ramesh, S. Rajeswari, Evaluation of inhibitors and biocide on the corrosion control of copper in neutral aqueous environment, Corrosion Science, 47 (2005) 151-169. [25] S. Ramesh, S. Rajeswari, S. Maruthamuthu, Corrosion inhibition of copper by new triazole phosphonate derivatives, Applied Surface Science, 229 (2004) 214-225. [26] F.M. Al-Kharafi, F.H. Al-Hajjar, A. Katrib, 3-phenyl-1,2,4-triazol-5-one as a corrosion inhibitor for copper, Corrosion Science, 26 (1986) 257-264. [27] M.M. El-Naggar, Bis-aminoazoles corrosion inhibitors for copper in 4.0 M HNO3 solutions, Corrosion Science, 42 (2000) 773-784. [28] M. Finšgar, I. Milošev, Corrosion study of copper in the presence of benzotriazole and its hydroxy derivative, Materials and Corrosion-Werkstoffe Und Korrosion, 62 (2011) 956-966. [29] M. Finšgar, S. Peljhan, A. Kokalj, J. Kovač, I. Milošev, Determination of the Cu2O Thickness on BTAH-Inhibited Copper by Reconstruction of Auger Electron Spectra, Journal of the Electrochemical Society, 157 (2010) C295-C301. [30] M. Finšgar, A. Lesar, A. Kokalj, I. Milošev, A comparative electrochemical and quantum chemical calculation study of BTAH and BTAOH as copper corrosion inhibitors in near neutral chloride solution, Electrochimica Acta, 53 (2008) 8287-8297. [31] M. Finšgar, I. Milošev, Inhibition of copper corrosion by 1,2,3-benzotriazole: A review, Corrosion Science, 52 (2010) 2737-2749. [32] M. Finšgar, 2-Mercaptobenzimidazole as a Copper Corrosion Inhibitor: Part I. Long-term Immersion, 3D-Profilometry, and Electrochemistry, Corrosion Science, 72 (2013) 82-89. [33] M. Finšgar, J. Kovač, I. Milošev, Surface Analysis of 1-Hydroxybenzotriazole and Benzotriazole Adsorbed on Cu by X-Ray Photoelectron Spectroscopy, Journal of the Electrochemical Society, 157 (2010) C52-C60. [34] Y.I. Kuznetsov, L.P. Kazansky, Physicochemical aspects of metal protection by azoles as corrosion inhibitors, Russian Chemical Reviews, 77 (2008) 219. [35] M. Finšgar, 2-Mercaptobenzimidazole as a Copper Corrosion Inhibitor: Part II. Surface Analysis Using X-ray Photoelectron Spectroscopy, Corrosion Science, 72 (2013) 90-98. [36] M. Finšgar, I. Milošev, Corrosion behaviour of stainless steels in aqueous solutions of methanesulfonic acid, Corrosion Science, 52 (2010) 2430-2438. [37] M. Finšgar, Galvanic series of different stainless steels and copper- and aluminium-based materials in acid solutions, Corrosion Science, 68 (2013) 51-56. [38] D.A. Shirley, High-Resolution X-Ray Photoemission Spectrum of the Valence Bands of Gold, Physical Review B, 5 (1972) 4709–4714. [39] V.K. Kaushik, Identification of oxidation states of copper in mixed oxides and chlorides using ESCA, Spectrochimica Acta Part B: Atomic Spectroscopy, 44 (1989) 581-587. [40] S. Tougaard, Quantification of Nano-structures by Electron Spectroscopy in Surface Analysis by Auger and X-Ray Photoelectron spectroscopy, in: D. Briggs, J.T. Grant (Eds.) Surface Spectra, IM Publications, Manchester, UK, 2003, pp. 295-343. [41] S. Tougaard, Surface nanostructure determination by x-ray photoemission spectroscopy peak shape analysis, in, AVS, Mineapolis, Minnesota (USA), 1996, pp. 1415-1423.

22

[42] V. Brusic, M.A. Frisch, B.N. Eldridge, F.P. Novak, F.B. Kaufman, B.M. Rush, G.S. Frankel, Copper Corrosion With and Without Inhibitors, Journal of The Electrochemical Society, 138 (1991) 2253-2259. [43] J.-H. Chen, Z.-C. Lin, S. Chen, L.-H. Nie, S.-Z. Yao, An XPS and BAW sensor study of the structure and real-time growth behaviour of a complex surface film on copper in sodium chloride solutions (pH = 9), containing a low concentration of benzotriazole, Electrochimica Acta, 43 (1998) 265-274. [44] P.E. Laibinis, G.M. Whitesides, D.L. Allara, Y.T. Tao, A.N. Parikh, R.G. Nuzzo, Comparison of the structures and wetting properties of self-assembled monolayers of n-alkanethiols on the coinage metal surfaces, copper, silver, and gold, Journal of the American Chemical Society, 113 (1991) 7152-7167. [45] M. Finšgar, S. Fassbender, S. Hirth, I. Milošev, Electrochemical and XPS study of polyethyleneimines of different molecular sizes as corrosion inhibitors for AISI 430 stainless steel in near-neutral chloride media, Materials Chemistry and Physics, 116 (2009) 198-206. [46] M. Finšgar, S. Fassbender, F. Nicolini, I. Milošev, Polyethyleneimine as a corrosion inhibitor for ASTM 420 stainless steel in near-neutral saline media, Corrosion Science, 51 (2009) 525-533. [47] A.V. Naumkin, A. Kraut-Vass, S.W. Gaarenstroom, C.J. Powell, NIST Standard Reference Database 20, Version 4.1 (web version), (http://srdata.nist.gov/xps/), in, 2003. [48] T. Hashemi, C.A. Hogarth, The mechanism of corrosion inhibition of copper in NaCl solution by benzotriazole studied by electron spectroscopy, Electrochimica Acta, 33 (1988) 1123-1127. [49] C.C. Chusuei, M.A. Brookshier, D.W. Goodman, Correlation of Relative X-ray Photoelectron Spectroscopy Shake-up Intensity with CuO Particle Size, Langmuir, 15 (1999) 2806-2808. [50] M.C. Biesinger, L.W.M. Lau, A.R. Gerson, R.S.C. Smart, Resolving surface chemical states in XPS analysis of first row transition metals, oxides and hydroxides: Sc, Ti, V, Cu and Zn, Applied Surface Science, 257 (2010) 887-898. [51] G. Xue, X.-Y. Huang, J. Dong, J. Zhang, The formation of an effective anti-corrosion film on copper surfaces from 2-mercaptobenzimidazole solution, Journal of Electroanalytical Chemistry and Interfacial Electrochemistry, 310 (1991) 139-148. [52] I. Platzman, R. Brener, H. Haick, R. Tannenbaum, Oxidation of Polycrystalline Copper Thin Films at Ambient Conditions, The Journal of Physical Chemistry C, 112 (2008) 1101-1108. [53] D.-D. Li, J.-L. Tian, W. Gu, X. Liu, S.-P. Yan, A novel 1,2,4-triazole-based copper(II) complex: Synthesis, characterization, magnetic property and nuclease activity, Journal of Inorganic Biochemistry, 104 (2010) 171-179. [54] T. Asaji, H. Sakai, D. Nakamura, Magnetic phase transitions in dibromo(4H-1,2,4-triazole)copper(II) and related copper(II) complexes as studied by nitrogen-14 nuclear quadrupole resonance and magnetic susceptibility measurements, Inorganic Chemistry, 22 (1983) 202-206. [55] G.V. Romanenko, Z.A. Savelieva, N.V. Podberezskaya, S.V. Larionov, Structure of the Cu(II) chloride complex with 4-amino-l,2,4-triazole Cu(C2H4N4)Cl2, J Struct Chem, 38 (1997) 171-176. [56] S.M. Ansar, R. Haputhanthri, B. Edmonds, D. Liu, L. Yu, A. Sygula, D. Zhang, Determination of the Binding Affinity, Packing, and Conformation of Thiolate and Thione Ligands on Gold Nanoparticles, The Journal of Physical Chemistry C, 115 (2010) 653-660. [57] A. Kokalj, N. Kovačević, S. Peljhan, M. Finšgar, A. Lesar, I. Milošev, Triazole, Benzotriazole, and Naphthotriazole as Copper Corrosion Inhibitors: I. Molecular Electronic and Adsorption Properties, Chemphyschem, 12 (2011) 3547-3555. [58] D. Chadwick, T. Hashemi, Electron spectroscopy of corrosion inhibitors: Surface films formed by 2-mercaptobenzothiazole and 2-mercaptobenzimidazole on copper, Surface Science, 89 (1979) 649-659. [59] G. Fonder, F. Laffineur, J. Delhalle, Z. Mekhalif, Alkanethiol-oxidized copper interface: The critical influence of concentration, Journal of Colloid and Interface Science, 326 (2008) 333-338. [60] C. Duret-Thual, D. Costa, W.P. Yang, P. Marcus, The role of thiosulfates in the pitting corrosion of Fe-17Cr alloys in neutral chloride solution: Electrochemical and XPS study, Corrosion Science, 39 (1997) 913-933.

23

[61] V.I. Nefedov, M.N. Firsov, I.S. Shaplygin, Electronic structures of MRhO2, MRh2O4, RhMO4 and Rh2MO6 on the basis of X-ray spectroscopy and ESCA data, Journal of Electron Spectroscopy and Related Phenomena, 26 (1982) 65-78. [62] D. Chadwick, T. Hashemi, Benzotriazole adsorption on copper studied by X-ray photoelectron spectroscopy, Journal of Electron Spectroscopy and Related Phenomena, 10 (1977) 79-83. [63] M.A. Fazal, A.S.M.A. Haseeb, H.H. Masjuki, Corrosion mechanism of copper in palm biodiesel, Corrosion Science, 67 (2013) 50-59. [64] D. Chadwick, T. Hashemi, Adsorbed corrosion inhibitors studied by electron spectroscopy: Benzotriazole on copper and copper alloys, Corrosion Science, 18 (1978) 39-51. [65] C.J. Powell, A. Jablonski, NIST Electron Inelastic-Mean-Free-Path Database – version 1.1, National Institute of Standards and Technology, in, 2000. [66] A. Abdureyim, K.K. Okudaira, Y. Harada, S. Masuda, M. Aoki, K. Seki, E. Ito, N. Ueno, Characterization of 4-mercaptohydrocynnamic acid self-assembled film on Au(111) by means of X-ray photoelectron spectroscopy, Journal of Electron Spectroscopy and Related Phenomena, 114-116 (2001) 371-374. [67] C.M. Whelan, M.R. Smyth, C.J. Barnes, HREELS, XPS, and Electrochemical Study of Benzenethiol Adsorption on Au(111), Langmuir, 15 (1998) 116-126. [68] P.E. Laibinis, C.D. Bain, G.M. Whitesides, Attenuation of photoelectrons in monolayers of n-alkanethiols adsorbed on copper, silver, and gold, The Journal of Physical Chemistry, 95 (1991) 7017-7021. [69] G. Lewis, P.G. Fox, The thickness of thin surface films determined by photo-electron spectroscopy, Corrosion Science, 18 (1978) 645-650. [70] R.F. Roberts, X-ray photoelectron spectroscopic characterization of copper oxide surfaces treated with benzotriazole, Journal of Electron Spectroscopy and Related Phenomena, 4 (1974) 273-291.

24

Table 1: Calculated intensity ratios at different take-off angles

θ IC 1s/ICu 2p IO 1s/ICu 2p IN 1s/ICu 2p IC 1s/IN 1s IO 1s/IN 1s IO 1s/IC 1s

TRZ

5° 1.36 0.26 0.31 4.34 0.82 0.19

20° 0.72 0.16 0.31 2.35 0.53 0.22

45° 0.46 0.16 0.23 1.96 0.67 0.34

90° 0.16 0.10 0.10 1.64 1.04 0.63

3-AT

5° 0.57 0.13 0.38 1.49 0.35 0.24

20° 0.50 0.17 0.40 1.26 0.43 0.34

45° 0.30 0.15 0.34 0.89 0.47 0.52

90° 0.25 0.12 0.31 0.81 0.40 0.49

25

Figure captions

Figure 1: The structures of TRZ and 3-AT molecules.

Figure 2: The mass change vs. time during exposure of a Cu-plated electrode in 3 wt.% NaCl solution

containing 10 mM TRZ or 3-AT.

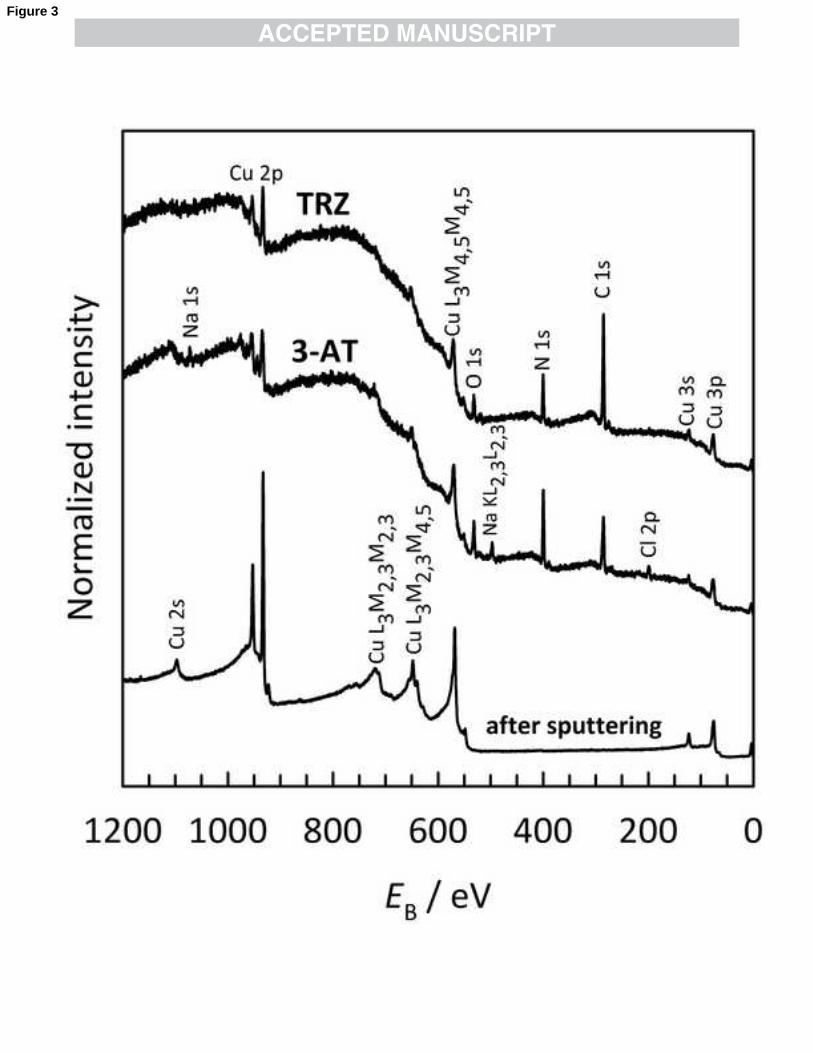
Figure 3: XPS survey spectra measured at θ = 45° of the 3-AT- and TRZ-treated (upper spectra) and

sputter-cleaned Cu (lower spectrum).

Figure 4: Cu 2p, Cu L3M4,5M4,5, N 1s, C 1s, and O 1s spectra analysed at different take-off angles. The

Cu sample was treated for 1 h in 3 wt.% NaCl solution containing 10 mM TRZ. The lowest curve

represents the sputter-cleaned Cu sample.

Figure 5: Cu 2p, Cu L3M4,5M4,5, N 1s, C 1s, and O 1s spectra analysed at different take-off angles. The

Cu sample was treated for 1 h in 3 wt.% NaCl solution containing 10 mM 3-AT. The lowest curve

represents the sputter-cleaned Cu sample.

Figure 6: The XPS measured spectra of the (a,b) TRZ- and (c,d) 3-AT-treated Cu samples and the

background corrected spectra for IMFP of 2 and 4 nm. Thicknesses of 1.6 ± 0.5 nm and 0.9 ± 0.3 nm

of the TRZ and 3-AT layers, respectively, were determined by the Tougaard method [40, 41].

26

Research highlights

• 3-amino-1,2,4-triazole is a more effective inhibitor than 1,2,4-triazole.

• Reasons for the differences in inhibition effectiveness are discussed.

• 1,2,4-triazole surface layer growth is faster compared to 3-amino-1,2,4-triazole.

• The 1,2,4-triazole surface layer on Cu is thicker compared to 3-amino-1,2,4-triazole.


Recommended