Equilibration of the Antarctic Circumpolar Current by Standing Meanders ANDREW F. THOMPSON California Institute of Technology, Pasadena, California ALBERTO C. NAVEIRA GARABATO National Oceanography Centre, University of Southampton, Southampton, United Kingdom (Manuscript received 24 July 2013, in final form 19 March 2014) ABSTRACT The insensitivity of the Antarctic Circumpolar Current (ACC)’s prominent isopycnal slope to changes in wind stress is thought to stem from the action of mesoscale eddies that counterbalance the wind-driven Ekman overturning—a framework verified in zonally symmetric circumpolar flows. Substantial zonal vari- ations in eddy characteristics suggest that local dynamics may modify this balance along the path of the ACC. Analysis of an eddy-resolving ocean GCM shows that the ACC can be broken into broad regions of weak eddy activity, where surface winds steepen isopycnals, and a small number of standing meanders, across which the isopycnals relax. Meanders are coincident with sites of (i) strong eddy-induced modification of the mean flow and its vertical structure as measured by the divergence of the Eliassen–Palm flux and (ii) enhancement of deep eddy kinetic energy by up to two orders of magnitude over surrounding regions. Within meanders, the vorticity budget shows a balance between the advection of relative vorticity and horizontal divergence, providing a mechanism for the generation of strong vertical velocities and rapid changes in stratification. Temporal fluctuations in these diagnostics are correlated with variability in both the Eliassen–Palm flux and bottom speed, implying a link to dissipative processes at the ocean floor. At larger scales, bottom pressure torque is spatially correlated with the barotropic advection of planetary vorticity, which links to variations in meander structure. From these results, it is proposed that the ‘‘flexing’’ of standing meanders provides an alternative mechanism for reducing the sensitivity of the ACC’s baroclinicity to changes in forcing, separate from an ACC-wide change in transient eddy characteristics. 1. Introduction A remarkable feature of Southern Ocean circulation models is that the prominent isopycnal slope s that spans the Antarctic Circumpolar Current (ACC) is rela- tively insensitive to changes in surface forcing. This be- havior is explained through the interplay among surface wind forcing, the flow’s baroclinicity, and the action of mesoscale eddies. Residual-mean models of the ACC focus on zonally averaged properties and emphasize the competition between a wind-driven Eulerian over- turning circulation and an eddy-induced bolus transport, summarized as a counteroverturning cell that relaxes isopycnals [see review by Marshall and Speer (2012) and references therein]. Assuming a near cancellation be- tween wind-driven and eddy overturning cells, s ’ t r 0 fK , (1) where t is the surface wind stress, r 0 is a reference density, f is the Coriolis frequency, and K is some esti- mate of the eddy buoyancy diffusivity. Note that the insensitivity of s does not imply an insensitivity of the residual overturning circulation, which responds to both the amplitude and form of surface buoyancy forcing (Stewart et al. 2014). The insensitivity of the isopycnal slope to surface forcing implies an adjustment of K to changes in t or an enhancement in eddy kinetic energy (EKE) in response to a wind-driven increase in iso- pycnal tilt, a state sometimes referred to as ‘‘eddy sat- uration’’ (Hogg et al. 2008). Idealized, zonally symmetric models provide support for the relative insensitivity of s to changes in t (Abernathey et al. 2011; Stewart and Corresponding author address: Andrew F. Thompson, California Institute of Technology, 1200 E. California Blvd., Pasadena, CA 91125. E-mail: [email protected]JULY 2014 THOMPSON AND NAVEIRA GARABATO 1811 DOI: 10.1175/JPO-D-13-0163.1 Ó 2014 American Meteorological Society
Transcript
Equilibration of the Antarctic Circumpolar Current by Standing Meanders
ANDREW F. THOMPSON
California Institute of Technology, Pasadena, California
ALBERTO C. NAVEIRA GARABATO
National Oceanography Centre, University of Southampton, Southampton, United Kingdom
(Manuscript received 24 July 2013, in final form 19 March 2014)
ABSTRACT
The insensitivity of the Antarctic Circumpolar Current (ACC)’s prominent isopycnal slope to changes in
wind stress is thought to stem from the action of mesoscale eddies that counterbalance the wind-driven
steady state, H05 finds a spatial anticorrelation be-
tween the advection of planetary vorticity by and the
advection of relative vorticity u � $z, which is, however,
sensitive to the choice of smoothing of the mean dy-
namic topography. H05 argues that the balance between
the advection of relative vorticity and the advection of
planetary vorticity implies that stationary Rossby waves
are short and thus have a dominantly barotropic char-
acter. The divergence or stretching term is not calcu-
lated, but is assumed to be small. This balance between
by and u � $z holds predominantly outside of the large
meanders. Using the OFES numerical output, we re-
visit this balance in the meanders (section 3c).
c. Eliassen–Palm flux
The distribution of eddy fluxes in the ACC is also of
interest, because momentum input by surface winds is
transferred downward, via eddy buoyancy fluxes or in-
terfacial form stress (Johnson and Bryden 1989), before
it is removed by bottom form stress across topographic
features (Munk and Palm�en 1951; Olbers et al. 2004).
We note that Ward and Hogg (2011), analyzing a five-
layer primitive equation channel model, challenge this
view by showing that a rapid response of the bottom
form stress, following a change in surface wind forcing,
results in both a downward- (from the surface) and
upward-propagating (from the bottom) baroclinic adjust-
ment of the flow via interfacial form stress. This vertical
momentum transfer requires an understanding of inte-
rior potential vorticity (PV) fluxes encapsulated by the
divergence of the Eliassen–Palm (EP) tensor E (Plumb
1986). The distribution of E along the path of the ACC
is not well documented.
In light of the zonal variability in eddy character-
istics, we retain all six components of the EP tensor
E5 [E1; E2], where
E15 (u0y0)i11
2y022 u021
b02
N2
!j1
�f0N2
u0b0�k and
(3)
E251
2y022 u022
b02
N2
!i2 (u0y0)j1
�f0N2
y0b0�k . (4)
Overbars represent time averages; primed quantities
are deviations from such averages; and i, j, and k are
zonal, meridional, and vertical unit vectors. Accelera-
tion of the zonal- and meridional-mean flows occurs in
regions of divergence of E2 and E1, respectively. The
divergence of these fluxes is equivalent in a QG limit
to the eddy fluxes of potential vorticity:
u0q0 5$ � E1
5 (u0y0)x11
2y022 u021
b02
N2
!y
1
�f0N2
u0b0�z
and
(5)
y0q0 5$ � E2
51
2y022 u022
b02
N2
!x
2 (u0y0)y1�f0N2
y0b0�z
. (6)
In section 3b, we are concerned with changes in the
mean flow along the path of the meander. The eddy
forcing of this alongstream mean flow is described by
the cross-stream flux of QG potential vorticity $ � E,defined by
$ � E[ ($ � E1,$ � E2) � nT? , (7)
where n? 5 (2sinu, cosu) is the unit vector perpendic-
ular to the alongstream flow direction. We show in sec-
tion 3 that $ � E ’ ›Ez/›z, where
1814 JOURNAL OF PHYS ICAL OCEANOGRAPHY VOLUME 44
Ez[ (k � E) � nT? . (8)
3. Results: The intermittent ACC
a. Meanders and stratification
We first examine the evolution of the ACC’s stratifi-
cation between energetic standing meanders and re-
gions of predominantly zonal flow. This approach is
motivated by observations (Smith et al. 2010) of sig-
nificant modifications in the vertical structure of the
ACC across major topographic features, with a tendency
toward the barotropization of the mean flow as it navi-
gates topography.
Altimetry (Fu et al. 2010) and models (Hallberg and
Gnanadesikan 2006) identify ACC meanders as sites
of enhanced EKE. Figure 2 confirms that this rela-
tionship holds in OFES (only Eastern Hemisphere
shown for clarity). Figure 2a shows mean kinetic en-
ergy (MKE) and Fig. 2c shows mean EKE at 100m.
EKE here is a deviation from an 8-yr time mean
such that it contains temporal variability from both the
standing meanders and transient eddies. Regions of
elevated EKE are isolated downstream of significant
topographic features (Fu 2009). Figures 2b and 2d show
the subsurface distribution of these properties at
a depth of 2500m. The subsurface distribution of EKE
is not well constrained by observations. A black con-
tour is drawn in Fig. 2d to indicate regions where both
surface and subsurface values of EKEare elevated. These
sites are all coincident with standing meanders. One
interpretation of this distribution, which we explore
next, is that mesoscale eddies make a localized con-
tribution to the wind–eddy balance in (1).
Figure 3 (top) shows the bathymetry of the Southern
Ocean from OFES; vertical lines delineate subregions
considered in Figs. 3a–d. Figures 3a and 3b consider two
distinct areas: the former (288–388E) is a narrow sector
of the ACC characterized by high EKE and dominated
by a standingmeander centered at 308E; the latter (1008–1458E) is a broader sector of nearly zonal flow with low
EKE. The contours in Figs. 3a and 3b indicate the
changeD in potential densitys0 between downstreamf2
and upstream f1 longitudes:
D[s0(f5f2, j, z)2s0(f5f1, j, z) , (9)
where f is longitude, j is dynamic height, and z is depth.
The s0 surfaces are mapped into depth–dynamic height
coordinates, referenced to 2000m, to account for the
meridional displacement of the ACC core. Arrows in-
dicate the sense of isopycnal displacement at 1500m
for ease of interpretation. Figure 3a shows a shoaling
of isopycnals on the equatorward flank of the ACC con-
sistent with a relaxation in isopycnal tilt across the me-
ander. In contrast, D values of similar magnitude but
with a sense indicative of a steepening of the isopycnals
appear in Fig. 3b.
Figures 3c and 3d show similar behavior in other re-
gions of the ACC. In particular, there is the steepening
of isopycnals between 1208 and 708W across the eastern
Pacific sector of the ACC. The change in density across
Drake Passage is more extreme, with the isolated region
now spanning 208 of latitude (608–408W). Drake Passage
FIG. 2. Summary of OFES output. (a) MKE of the ACC’s Eastern Hemisphere at 100-m depth. The 0.05m2 s22 contour is shown
in white. (b) MKE of the ACC at 2500-m depth. (c) Mean EKE at 100-m depth. The 0.05m2 s22 contour is included. (d) Mean EKE at
2500-m depth. An additional black contour indicates where the EKE at 2500m is at least a tenth of the EKE at 2500m. Regions in gray
indicate bathymetry.
JULY 2014 THOMP SON AND NAVE IRA GARABATO 1815
is a more substantial disruption to the ACC and ac-
commodates multiple standing meanders. This region
requires further attention than there is scope for here
[see review in Meredith et al. (2011)].
The residual-mean framework assumes the ACC’s
isopycnal slope arises from approximately equal con-
tributions from the mean wind-driven and eddy-induced
circulations. In a zonally symmetric domain, this balance
applies locally at every longitude. Figures 2 and 3 show
significant variability in eddy characteristics and strati-
fication along the path of the ACC, whereas surface
wind and buoyancy forcing are zonally symmetric to
leading order (Large and Yeager 2009). Thus, a picture
arises in which the ACC is partitioned into regions of
wind-driven steepening, compensated by localized iso-
pycnal relaxation. While this is clearly a simplified view,
it represents a significant departure from the local bal-
ance implied by zonally symmetric theories of the ACC.
b. Meanders and vertical structure
We next consider the vertical structure of a typical
standing meander; this feature, found at 308E, corre-sponds to the rapid relaxation of density surfaces de-
picted in Fig. 3a.
Figure 4a shows the mean surface buoyancy b5gr21
0 (r0 2 r), r0 5 1025 kgm23, of the meander. Up-
stream, the surface buoyancy contours are closely packed
together, whereas immediately downstream of the me-
ander the surface buoyancy gradient weakens, reflecting
a change in subsurface density distributions (Fig. 3a). The
appropriate choice of coordinate system to track flow
characteristics along the path of the meander is compli-
cated (Viebahn and Eden 2012). The meander does not
coincide with an individual surface buoyancy contour,
nor is it obvious whether surface properties, or prop-
erties at any single level, are the correct framework
in which to ‘‘follow’’ the meander. Instead, we select a
meander envelope, given by the 0.0045 and 0.0065ms22
surface buoyancy contours (Fig. 4a); properties are av-
eraged over the meridional extent of the envelope, for
example, a quantity x averaged along the meander is
given by
~x(f, t)51
df
ðu2
u1
xa du , (10)
where u1 and u2 are the latitudes of the bounding
contours, df is the meridional distance between the
contours, and a is Earth’s radius. These contours are
arbitrary, and the following results are not qualita-
tively dependent on the choice of contours.
Figure 4b shows EKE averaged within the meander
envelope. The peak in eddy kinetic energy corresponds
with the crest of the meander with a striking two order
of magnitude change across the meander. At depths
greater than 1500m, the transition is abrupt. The increase
and subsequent decay in deep EKE occurs over 158 oflongitude or approximately 1000 km. Along-meander
FIG. 3. (top)Depth (m) of the SouthernOcean inOFES. (bottom)Difference in potential densityD (kgm23) [(9)] as a function of depth
and dynamic height, referenced to 2000m, for the regions (a) 288–388E, (b)1008–1458E, (c) 1208–708W, and (d) 608–408W.Dynamic height
increases from south to north across the ACC. Arrows are provided to show the sense of downstream isopycnal adjustment at 1500-m
depth.
1816 JOURNAL OF PHYS ICAL OCEANOGRAPHY VOLUME 44
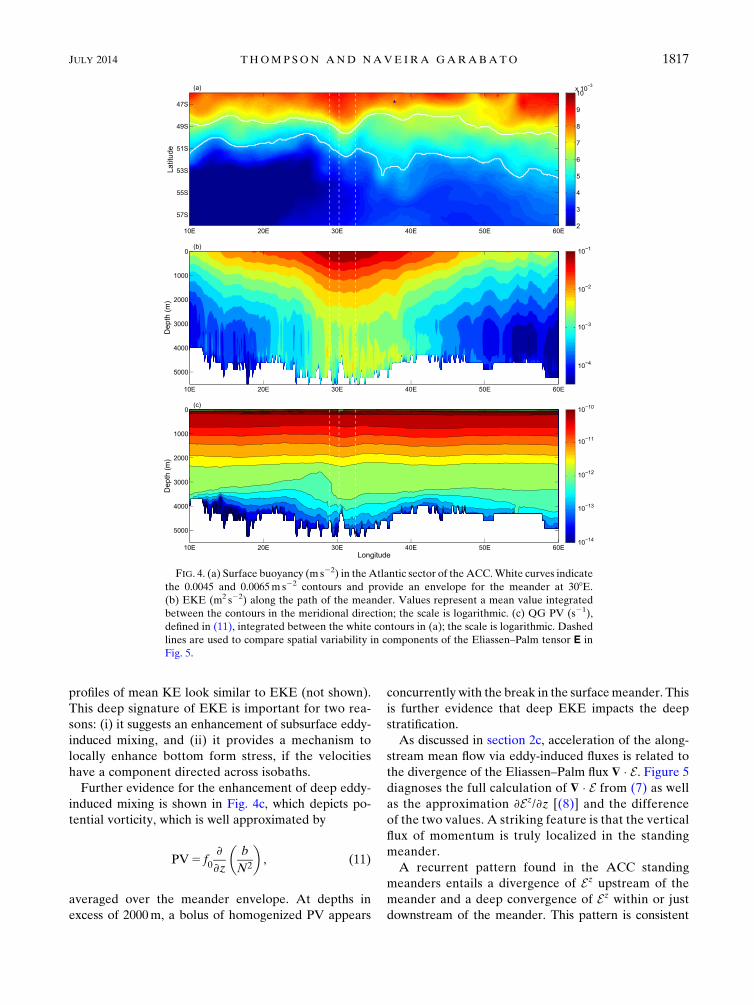
profiles of mean KE look similar to EKE (not shown).
This deep signature of EKE is important for two rea-
sons: (i) it suggests an enhancement of subsurface eddy-
induced mixing, and (ii) it provides a mechanism to
locally enhance bottom form stress, if the velocities
have a component directed across isobaths.
Further evidence for the enhancement of deep eddy-
induced mixing is shown in Fig. 4c, which depicts po-
tential vorticity, which is well approximated by
PV5 f0›
›z
�b
N2
�, (11)
averaged over the meander envelope. At depths in
excess of 2000m, a bolus of homogenized PV appears
concurrently with the break in the surfacemeander. This
is further evidence that deep EKE impacts the deep
stratification.
As discussed in section 2c, acceleration of the along-
stream mean flow via eddy-induced fluxes is related to
the divergence of the Eliassen–Palm flux $ � E. Figure 5
diagnoses the full calculation of $ � E from (7) as well
as the approximation ›Ez/›z [(8)] and the difference
of the two values. A striking feature is that the vertical
flux of momentum is truly localized in the standing
meander.
A recurrent pattern found in the ACC standing
meanders entails a divergence of Ez upstream of the
meander and a deep convergence of Ez within or just
downstream of the meander. This pattern is consistent
FIG. 4. (a) Surface buoyancy (m s22) in theAtlantic sector of theACC.White curves indicate
the 0.0045 and 0.0065m s22 contours and provide an envelope for the meander at 308E.(b) EKE (m2 s22) along the path of the meander. Values represent a mean value integrated
between the contours in the meridional direction; the scale is logarithmic. (c) QG PV (s21),
defined in (11), integrated between the white contours in (a); the scale is logarithmic. Dashed
lines are used to compare spatial variability in components of the Eliassen–Palm tensor E in
Fig. 5.
JULY 2014 THOMP SON AND NAVE IRA GARABATO 1817
with an acceleration of the jet leading into the meanders,
which agrees with the acceleration found by Williams
et al. (2007). The divergent band has a vertical struc-
ture, with greater values near the surface, that implies
an alongstream increase in the baroclinicity of the flow.
The band of convergence, on the other hand, occurs at
the site of highest EKE and is associated with a broad-
ening of the jet and a deceleration of the mean flow. The
negative values of Ez here imply a downward flux of
momentum. The divergence of Ez has a vertical structurewith larger amplitudes in the upper water column, thus
making the flow more barotropic. The sites of maxi-
mum divergence/convergence and the transition be-
tween them are marked by white dashed lines in Figs. 4
and 5 for reference. Note that the convergence is dis-
placed downstream of the meander center, suggesting
an advection of transient eddies between sites of
generation and mean flow modification (Pierrehumbert
1984; Bischoff and Thompson 2014, manuscript sub-
mitted to J. Phys. Oceanogr.).
The distributions of these diagnostics across differ-
ent standing meanders are remarkably similar. Figure 6
shows the surface buoyancy, EKE, Ez (8), and ›Ez/›z ofother prominent standingmeanders found at 1558E and
1458W. Figures 6c and 6d also present calculations of
meander characteristics within a meander envelope,
defined by the white contours in Fig. 6a. In each me-
ander, $ � E ’ ›Ez/›z. Again, below 2000m, EKE is
elevated within narrow bands that coincide with the
location of the meander, and the distribution of the
eddy potential vorticity fluxes implies a deceleration
and barotropization across the meander. Figures 5 and
6 show that in each meander the reduction in bar-
oclinicity within themeander dominates the acceleration
FIG. 5. (a) Eddy forcing of the alongstream flow as diagnosed by the divergence of the
Eliassen–Palm vector $ � E (m s22) defined in (7). (b) Vertical divergence of the vertical
component of the Eliassen–Palm tensor ›Ez/›z (m s22) defined in (8). (c) The difference be-
tween (a) and (b).
1818 JOURNAL OF PHYS ICAL OCEANOGRAPHY VOLUME 44
immediately upstream, leading to an overall barotrop-
ization of the flow in these regions.
c. Meanders and vorticity balance
From (2), the steady vorticity balance in the ocean
interior implies a balance between the advection of
total vorticity (f 1 z) and the stretching or divergence
term 2fwz. In the barotropic vorticity balance, an
incomplete cancellation between components of the
advection of total vorticity results in nonzero bottom
velocities (Hughes and de Cuevas 2001). H05 calcu-
lated all three terms in the steady vorticity balance [(2)]
from altimetry data, but needed to apply a smoothing
filter following each differentiation. This resulted in
the dominant scale of the relative vorticity advection
u � $z (300–500 km) being comparable to meanders in
the dynamic height field, and thus with the advection of
planetary vorticity by. Here, the 0.18-resolution OFES
allows the calculation of each term in the vorticity
balance without the use of smoothing filters.
Figures 7a–c show an 8-yr time average of the three
terms in (2) for the standing meander at 1508E at 250-m
depth. The advection of the planetary vorticity (Fig. 7c)
is the smoothest of the three terms, but is an order of
magnitude smaller than the advection of relative vor-
ticity and divergence. The divergence and advection of
FIG. 6. Meander characteristics (left) at Macquarie Ridge and (right) over the Udintsev Fracture Zone. (a) Surface buoyancy (m s22)
with contours (white) used to define an envelope of the meander. (b) Vertical profile of mean EKE (m2 s22; logarithmic scale) along the
path of themeander.Values are averaged between the contours in (a). (c) The Ez (m2 s22), see (8), averaged along the path of themeander;
the zero contour is given in black. (d) The vertical divergence ›Ez/›z (m s22); this term is approximately equal to the cross-stream eddy
PV flux.
JULY 2014 THOMP SON AND NAVE IRA GARABATO 1819
relative vorticity show smaller-scale variations and are
spatially correlated. These terms also cancel to leading
order with the residual having the same magnitude as
the advection of planetary vorticity, but smaller spatial
structure (not shown).
The balance between the advection of relative vor-
ticity and divergence dominates throughout most of
the water column, as seen in Fig. 8, which shows the
spatial correlation and linear regression coefficients
of the different terms in the vorticity budget at various
depths. The balance between u �$z and2fwz also holds
in other major standing meanders, as shown in Fig. 9
for meanders at 308E and 1508W. The regression be-
tween these two fields in each meander is close to 1,
which is similar to H05, although we also find that cor-
relation and regression coefficients are sensitive to the
introduction of smoothing.
Any individual snapshot of either fwz or u � $z showsconsiderably smaller scales than the time-averaged fields.
These fields also vary coherently as the structure of the
meander changes, a process suggesting an important role
for Rossby waves. From inspection, the two terms are
seen to have a strong correlation over short time scales.
Figure 10a summarizes this relationship by showing
a time series of jfwzj (solid) and ju � $zj (dashed) av-eraged over the region shown in Fig. 7. The temporal
correlation coefficient between these two time series
is 0.905, with no smoothing and increases to 0.956
when a 2-month running-mean smoother is introduced.
This strong temporal coherence is indicative of the
small, spatial scale agreement that occurs between these
terms.
In contrast, the barotropic vorticity balance occurs
over larger scales. Figure 7d shows the 8-yr time-mean
bottom pressure torque within the same standing me-
ander, and Fig. 10b shows the temporal evolution as
described above. A relationship between bottom pres-
sure torque and meander amplitude might be expected
because the leading-order balance of the barotropic
vorticity budget is between the bottom pressure torque
and advection of planetary vorticity (Hughes and de
Cuevas 2001). In Fig. 10b, we plot a rough estimate of
the meander amplitude, obtained from removing a lin-
ear approximation of the mean surface buoyancy across
the meander and plotting the root-mean-square ampli-
tude of the buoyancy anomalies over the 8-yr period.
FIG. 7. The 8-yr time average of terms in the vorticity balance [(2)] (10211 s22) for the standing meander at 1508E and 250-m depth:
(a) divergence (stretching)2fwz, (b) advection of relative vorticity u � $z, and (c) planetary vorticity advection by. (d) Bottom pressure
torque within the meander (1025Nm23). The gray contour indicates the 3500-m isobath; contours of the 4000- (black) and 3000-m (light
gray) isobaths are also included in (d).
1820 JOURNAL OF PHYS ICAL OCEANOGRAPHY VOLUME 44
The variability of the meander in the context of curva-
ture is explored in section 3d.
In summary, variability in the advection of rela-
tive vorticity, related to meander dynamics, is linked
to fluctuations in vertical velocities. This relationship
is probed further by the inclusion of a third curve in
Fig. 10a that shows a regional average of bottom speed
(the lowermost complete cell at each longitude and
latitude) in the meander. Bottom speed, which shows
significant variations over the 8-yr time series, is strongly
correlated with both the divergence (correlation co-
efficient 5 0.913) and the advection of relative vorticity
(correlation coefficient 5 0.892); these vorticity com-
ponents are calculated at 250m.
d. Meanders and time variability
The temporal covariance of terms in the vorticity
balance motivates a consideration of how changes in
the meander structure relate to eddy characteristics
and follows earlier studies of standing meanders by
H05 and Ochoa and Niiler (2007).
Scale separation between mesoscale eddies and the
size of the meanders themselves is a distinguishing fea-
ture of ocean storm tracks (Williams et al. 2007). For
example, in the vorticity budget, snapshots show a
correlation between the advection of relative vorticity
and divergence at scales comparable to the deformation
radius (;20 km), while the time-averaged balance and
the barotropic vorticity balance is related to the mean-
der scale (;400 km).
A comparable scale separation in time is less appar-
ent, however. Figures 11a–c indicate changes to the
structure of the standing meander at 1558E over an 8-yr
time period. Figure 11a shows the 8-yr time average of
the buoyancy contours at 250-m depth for the region
shown in Fig. 7—the flow is equivalent barotropic, and
thus buoyancy contours have similar curvature at other
depths. Figures 11b and 11c are 2-month means of
buoyancy during periods of weak and strong curva-
ture, respectively. As a measure of curvature C(b, t),the length of buoyancy contours within the range
21 3 1023 , b , 5 3 1023 m s22 are calculated. In
cases where multiple contours exist, due to coherent
vortices, we select the maximum contour length. These
lengths are calculated for each snapshot over 8 yr, and
the resulting curvature time series Cb(t), averaged over
the buoyancy range 13 1023 , b, 2.53 1023m s22, is
given by the boldface curve in Fig. 11d. Here the time
series is smoothed using a 2-month running mean; pe-
riods of weak and strong curvature shown in the upper
FIG. 8. (a) Spatial correlation coefficient and (b) linear regression coefficient for terms in the
vorticity budget (2) as a function of depth for the standing meander at 1558E (Fig. 7). Colors
distinguish correlations/regressions between the different terms given in the legend in (b).
JULY 2014 THOMP SON AND NAVE IRA GARABATO 1821
panels are marked by the red dashed lines. The cur-
vature time series Cb(t) is compared to fluctuations in
the vorticity budget terms, revealing a strong temporal
correlation, especially between months 20 and 90. This
agreement depends on the choice of buoyancy contour
and becomes worse outside of theACC’s core. Figure 11e
shows the correlation coefficient between the divergence
2fwz and curvature C(b, t) time series for different values
of b. Buoyancy contours with a correlation coefficient
greater than 0.45 (dotted line) are given as boldface
curves in Figs. 11a–c which explains our averaging choice
for the boldface curve in Fig. 11d.
Finally, there is also a positive correlation between the
time series of Cb and meander-averaged EKE. The
correlation coefficients for Cb and EKE are 0.34 and
0.46, where the latter value has a 2-month running mean
applied. Thus, on scales of a few months or longer,
meander curvature and vorticity is tied to the generation
of mesoscale variability (EKE) and even submesoscale
flows (strain generation and frontogenesis), which is
essential to our proposed negative feedback discussed
below.
4. Discussion
The existing framework for understanding the ACC’s
equilibrated stratification (isopycnal slope) relies on
a near balance between a mean and eddy overturning,
where the latter is related to a zonally averaged esti-
mate of an eddy buoyancy diffusivity. Figures 2 and 3
suggest there is a gap between this idealized picture of
the ACC and the true spatial distribution of eddy
generation and eddy fluxes. The largest EKE values
cluster around regions where the curvature of buoyancy
surfaces is large and may not be adequately described by
traditional eddy parameterizations [e.g., Gent and
McWilliams 1990; Ferrari and Nikurashin 2010].
Lack of high-resolution data has hampered previous
studies of the ACC’s vorticity balance, especially in re-
gions of strongmeandering (H05; Chereskin et al. 2010),
with Firing et al. (2011) as a notable exception. These
studies focus largely on the barotropic vorticity balance
and emphasize a balance between the advection of
relative vorticity and advection of planetary vorticity.
Crucially, these studies only resolve features on the scale
of the meanders themselves (300–500 km), while in the
GCM data, the prominent spatial scales in the vorticity
balance are on the order of a few tens of kilometers. It
is only in the time average (Fig. 7) that the structure of
the standing meander is recovered. Through the reso-
lution of these scales, we find that at any given level
the amplitude of the advection of relative vorticity and
the divergence term are roughly an order of magnitude
larger than the advection of planetary vorticity, a result
FIG. 9. (top) The 8-yr average of the (a) divergence (stretching)2fwz and (b) advection of relative vorticity u �$zat 250m at the standing meander near 308E. (bottom) The 8-yr average of the (c) divergence (stretching)2fwz and
(d) advection of relative vorticityu �$z at 250m at the standingmeander near 1508W.Units for all terms are 10211 s22.
1822 JOURNAL OF PHYS ICAL OCEANOGRAPHY VOLUME 44
that is confirmed in an idealized 5-km resolution
Massachusetts Institute of Technology General Circu-
lation Model (MITgcm) channel model with topography
(Bischoff and Thompson 2014, manuscript submitted to
J. Phys. Oceanogr.). The importance of the divergence
term throughout the water column (Fig. 8) suggests a
role for ageostrophic vertical velocities in modifying the
stratification across a standing meander. Ageostrophic
vertical circulations that occur during frontogenesis
(Spall 1997) are likely to be important, as Williams
et al. (2007) have shown that meanders tend to be re-
gions of frontogenesis.1 Lateral eddy buoyancy fluxes also
play a role in the equilibrated stratification.
These results point to variability in the structure and
eddy characteristics of standing meanders being criti-
cal to the global ACC structure. As discussed in detail
in H05, standing meanders arise from the arrest of
barotropic Rossby waves by the mean flow. Neglecting
vertical and lateral shears, the arrested Rossby wave is
expected to exhibit a single characteristic wavelength.
Waves with longer and shorter wavelengths will propa-
gate upstream and downstream, respectively. This ap-
proach suggests that long-term changes in the shape or
curvature (Fig. 11) of standing meanders are represen-
tative of changes in the mean flow. The consequences of
these fluctuations are twofold.
The first effect of the meander fluctuations is some-
what tenuous, but offers a potentially new way of viewing
the equilibration of the ACC. A clear signal in the di-
agnostics presented here, and consistent withWard and
Hogg (2011), is that changes in surface wind forcing
have a rapid deep, or barotropic, response that modifies
the patterns of bottom form stress or bottom pressure
torque. At the ocean bottom, the pattern of these
changes is related to the scale of the standing meander,
not the smaller scales that govern the interior baro-
clinic response. An adjustment of the barotropic vor-
ticity balance thus requires a change in the meander
structure. This may occur either through an increase in
meander wavelength, consistent with the expectation
from the barotropic Rossby wave dispersion relation
that a longer wave would be arrested by a stronger
zonal-mean flow, or through an increase in meander
FIG. 10. (a) Time series of themagnitudes of different terms in the vorticity balance (2) for the standingmeander at
1558E in Fig. 7 at 250-m depth. The spatial average of the absolute magnitude of each term is calculated. The mean is
removed, and the time series is normalized by the max value. Time series of the meander-averaged amplitudes of
bottom speed and the meridional buoyancy flux at 250m are also shown. The latter term is smoothed with a 2-month
running mean. (b) Time series of the meander-averaged amplitude of bottom pressure torque; the time series is
normalized as in (a). An estimate of the meander amplitude is also given (see text for description). These time series
have been smoothed using a 2-month running mean.
1 Snapshots of the Rossby number from OFES, defined as z/f,
intermittently show magnitudes greater than 0.5 in regions of
strong strain.
JULY 2014 THOMP SON AND NAVE IRA GARABATO 1823
amplitude related to an adjustment of the barotropic
planetary vorticity advection. This rapid bottom re-
sponse is consistent with diagnosed transports in channel
models with bathymetry following a step change in wind
stress: the transport rapidly increases before adjusting to
a new equilibrated value (Ward and Hogg 2011). Re-
gardless of the mechanism, this adjustment of the mean-
der necessitates the movement of the pressure field
across f/h contours, modifying bottom form stress in the
meander. In the model, we find a correlation between
enhanced meander curvature and increased bottom
speed, and we suggest that an enhancement of bottom
speed may be a mechanism for enhanced dissipation
either through bottom friction or more likely through
the generation of lee waves (which are not resolved in
the OFES). Mazloff et al. (2013) have also identified
the importance of fluctuations in the position of
buoyancy outcrops in the Southern Ocean, showing
that a geostrophic component of the overturning circu-
lation arises from these variations. Variability, or flexing,
of key meanders will make an important contribution to
this component.
The second effect is clearer and shows that meander
curvature is linked to eddy characteristics in the stand-
ing meander region, diagnosed through either EKE or
more complex diagnostics like the Okubo–Weiss pa-
rameter or eddy potential vorticity fluxes. The reason
for this is not fully explained here, but is likely related
to the enhanced instability of a nonzonal-mean flow
(Smith 2007; Boland et al. 2012). This increase in eddy
fluxes, however, is directly related to enhanced eddy
buoyancy fluxes and the vertical transfer of momentum.2
Thus, standing meanders are key sites where changes in
surface momentum forcing can be communicated rap-
idly throughout the water column. Fluctuations between
FIG. 11. Buoyancy contours at a depth of 250m (a) averaged over a period of 8 yr, (b) during a period of weak curvature in year 4, and
(c) during a period of strong curvature. (d) Time series of curvature Cb(t) (boldface curve) as measured by the mean length of the boldface
buoyancy contours in (a)–(c). The time series has the mean removed and is normalized by the max amplitude; the time series is then
smoothed using a 30-day running mean. The time series of the terms in Fig. 10, smoothed in the same way, are given in gray for reference.
The red dashed lines indicate times of weak and strong curvature shown in (b) and (c). (e) Correlation coefficient between the divergence
time series in (d) and curvature C(b, t) for different buoyancy contours. The boldface curves in the upper panels correspond to values of
b where the correlation coefficient is greater than 0.45.
2 Nearly stationary meanders are apparent throughout the ACC,
but regions of enhanced EKE are limited to the main standing
meander regions highlighted in this study.
1824 JOURNAL OF PHYS ICAL OCEANOGRAPHY VOLUME 44
states of strong and weak curvature are reminiscent of
the observed flipping between steered and zonal jets
in idealized simulations by Thompson (2010) and may
have some relation to the jet jumping of Chapman and
Hogg (2013). An analysis of the Okubo–Weiss param-
eter (not shown) shows that meandering also enhances
the strain fields, suggesting that meanders are regions
where eddies are not only generated, but also torn apart
by strong lateral shears, potentially leading to elevated
mixing (Naveira Garabato et al. 2011; Thompson and
Sall�ee 2012).
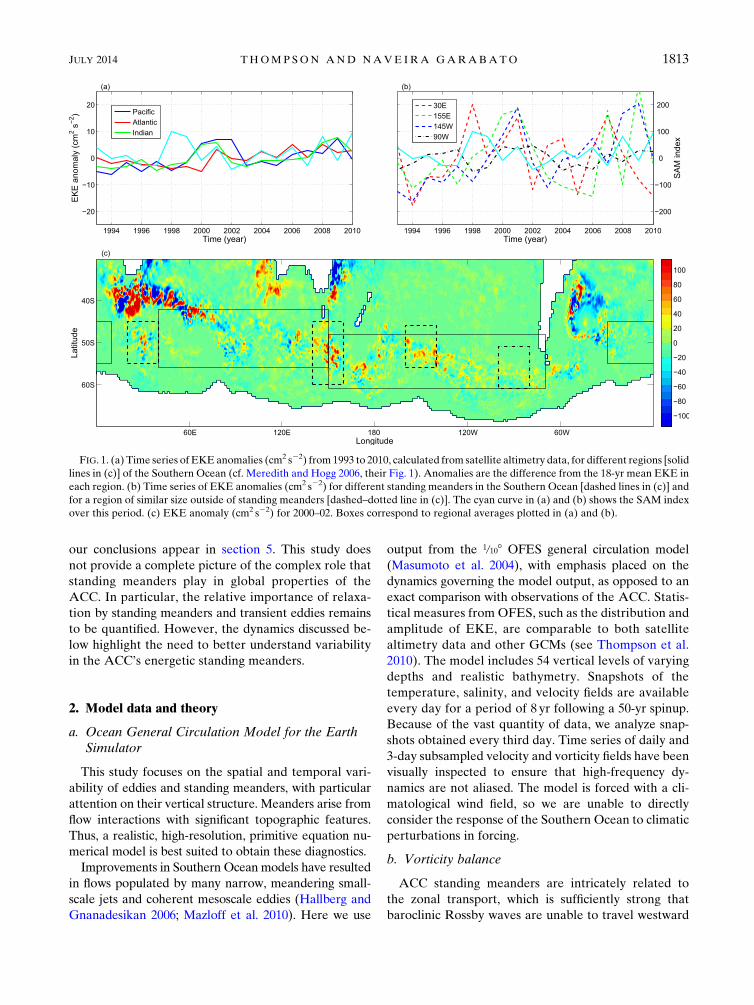
While this study alone is insufficient to complete the
full picture, we put forward a discrete view of the ACC,
motivated by the enhanced variability in a small number
of standing meanders (Fig. 1). In this view, the equili-
brated structure of the ACC is maintained by fluctua-
tions in these standing meanders. The fluctuations are
a combined response of arrested Rossby waves and the
barotropic vorticity balance to changes in themean flow.
Figure 12 provides a diagram of this feedback mecha-
nism. An intensification of surface westerlies steepens
isopycnals and accelerates the ACC, especially upstream
of meanders where EKE is relatively weak (Fig. 12a).
The increased zonal transport of the ACC then results
in a change in the Rossby waves that are arrested by the
mean flow, specifically longer wavelengths; increases in
curvature are also expected as the flow moves toward
a new steady vorticity balance (Fig. 12b). Enhanced
curvature leads to increased EKE and lateral eddy
buoyancy fluxes, the latter being responsible for verti-
cal momentum transport and the adjustment of the
baroclinic structure of the meander (Fig. 12c). Fur-
thermore, the standing meander sites we identify are
coincident with regions of enhanced conversion of geo-
strophic flow into internal lee waves, as identified in
recent maps by Nikurashin and Ferrari (2011) and
Scott et al. (2011) and observations by Waterman et al.
(2013). Most importantly, this work offers a physical
mechanism that resonates with recent findings (Dufour
et al. 2012; Zika et al. 2013a) that local standing me-
anders may provide the strongest control over the
ACC’s overturning. We acknowledge that a ‘‘meander
only’’ equilibration is likely an extreme view of the
ACC, and the relative importance of relaxation oc-
curring in standing meanders and that by transient
mesoscale eddies distributed throughout the ACC re-
quires further examination.
Using ship-based and Argo hydrographic data, B€oning
et al. (2008) show that the ACC’s mean isopycnal slope
has changed little over the past two decades, despite
significant changes in wind stress as measured by the
SAM index. Eddy saturation was suggested as a poten-
tial explanation for this behavior. However, Munday
et al. (2013) have argued that the relevant time scale for
the ACC to adjust in the classical residual overturning
framework is on the order of many tens of decades, due
FIG. 12. Diagram of the negative feedback mechanism mediated by Southern Ocean standing meanders. Red curves and text indicate
the departure from an initial state (gray curves) in response to an increase in surface wind stress. (a) Isopycnals steepen outside of regions
of strongEKE, accelerating theACC. (b) Increased zonal transport results in a reequilibration of the standingmeander due to the arrest of
Rossbywaves with a different wavelength and change in amplitude due to amodified vorticity balance. (c) Increases inmeander curvature
enhance EKE, eddy buoyancy fluxes, and vertical momentum transport, which change the baroclinic structure of the meander and
decelerates the mean flow. Reduction of the mean flow allows the Rossby wave to travel upstream and modify the stratification.
JULY 2014 THOMP SON AND NAVE IRA GARABATO 1825
to the equilibration of the large basins to the north of
the Southern Ocean to a new stratification. The local-
ized response to changes in surface forcing, through the
adjustment of Rossby waves and curvature discussed
here, may provide a mechanism for a faster mode of
equilibration to wind forcing, especially if large iso-
pycnal excursions are limited to narrow regions around
standing meanders. Finally, much of the interest in un-
derstanding the ACC’s response to changes in wind
stress is the potential for this mechanism to explain
variations in the structure and rate of the meridional
overturning circulation, through modification of iso-
pycnal outcropping and surface buoyancy forcing, across
major climatic transitions (Lynch-Stieglitz et al. 2007). It
is worth noting that these standing meanders are de-
termined by topography, and thus their location is likely
to remain fixed over climatic time scales, while their
structure may respond to changes in the strength of the
ACC or in the spatial distribution of surface forcings.
An interesting open question is the degree to which local
variations in the wind stress impact Southern Ocean
stratification and overturning (Zika et al. 2013a).
5. Conclusions
Spatial variations of the ACC’s EKE distribution re-
flects significant alongstream changes in the dynamics
that set the Southern Ocean stratification. Broadly,
anomalies from the zonally averaged stratification of
the ACC can be related to wide regions of isopycnal
steepening where the wind-driven overturning out com-
petes the eddy-induced overturning. These regions are
typically associated with near-zonal flows with established
frontal jets. Eddy activity is enhanced within the standing
meanders, where isopycnal slopes relax dramatically. This
enhancement ofEKE,whichmay arise from the increased
instability of the mean flow’s nonzonal orientation, has
two consequences. The first is to increase the cross-stream
buoyancy flux, whose vertical divergence is related to the
vertical transport of alongstream momentum. Enhance-
ment in EKE is also linked to the enhancement of vertical
stretching that balances the advection of relative vorticity
in the vorticity budget. This balance holds specifically in
the standing meanders and differs from previous analyses
of the ACC vorticity balance.
While this balance holds over an 8-yr time average of
the model output, perhaps more intriguing is the high
coherence between temporal fluctuations generated by
internal variability and seasonal fluctuations in the cli-
matological winds. Each of the terms in the vorticity
balance shows a strong correlation with meander cur-
vature. As the flow has an equivalent barotropic struc-
ture, this change in meander structure impacts the
advection of planetary vorticity. Changes in the mean
flow are also expected to modify the wavelength of
arrested barotropic Rossby waves, while a change in
meander amplitude is consistent with the flow adjust-
ing toward a barotropic vorticity balance. The vorticity
balance suggests that eddy–meander dynamics provide
a negative feedback between changes in the ACC zonal
transport, patterns of bottom form drag, and eddy-
induced vertical momentum fluxes responding to changes
in meander curvature. This provides a mechanism by
which eddy saturation of the ACC may arise. This
mechanism is separate from, but potentially working
in tandem with, relaxation by transient eddies.
Appreciation of the importance of standing meanders
is found in some of the first studies that probed the dy-
namics of the ACC (e.g., Stevens and Ivchenko 1997).
Here, the emphasis is on transient fluctuations in the
meander structure having a strong control over the
equilibration of theACC’s stratification. Our results have
motivated a series of idealized numerical simulations
(Bischoff and Thompson 2014, manuscript submitted to
J. Phys. Oceanogr.) that confirm the importance of the
meander response to changes in surface forcing. While
this approach presents a potentially more complicated
view of the ACC, with an emphasis on local dynamics
rather than zonal- or streamwise-averaged properties,
it also points to key regions that are critical to our un-
derstanding of the Southern Ocean’s evolution over cli-
matic time scales.
Acknowledgments. AFT gratefully acknowledges
support from the National Science Foundation (OCE-
1235488), and ACNG support from a Philip Leverhulme
Prize. Development of the ideas in this study have
benefited from conversations with Ryan Abernathey,
Toby Bischoff, Stuart Bishop, Chris Hughes, Kurt Polzin,
Andrew Stewart, and Jan Zika. We thank Andy Hogg
and an anonymous reviewer for comments that signifi-
cantly improved this manuscript.
REFERENCES
Abernathey, R., J. Marshall, and D. Ferreira, 2011: The de-
pendence of Southern Ocean meridional overturning on
wind stress. J. Phys. Oceanogr., 41, 2261–2278, doi:10.1175/JPO-D-11-023.1.
Bengtsson, L., K. I. Hodges, and E. Roeckner, 2006: Storm tracks
and climate change. J. Climate, 19, 3518–3543, doi:10.1175/
JCLI3815.1.
Boland, E. J. D., A. F. Thompson, E. Shuckburgh, and P. H.
Haynes, 2012: The formation of nonzonal jets over sloped
topography. J. Phys. Oceanogr., 42, 1635–1651, doi:10.1175/JPO-D-11-0152.1.
B€oning, C. W., A. Dispert, M. Visbeck, S. R. Rintoul, and F. U.
Schwarzkopf, 2008: The response of the Antarctic Circumpolar