Page 1
Journal of Environmental Sciences Studies (JESS) Volume 6 , Number 3, Autumn (2021), 4111-4120
4111
Equilibrium and Kinetic Study of Adsorption of Mo (VI) and Pd (II) from
Aqueous Solutions by Functionalized Multi-Walled Carbon Nanotubes Mohammad Reza Almasian2, Hossein Sid Kalal1*, Mohmmad Tagiof 3
Nuclear Fuel Research School, Nuclear Science and Technology Research Institute, AEOI, P.O. Box 11365-3486, Tehran, Iran. *Email Address: [email protected]
Received: (May-14-2021)
Accepted: (June -28-2021)
Abstract
In this work, a new type of solid adsorbent was prepared by functionalization of carbon nanotubes and the structure
and morphologies of the amine-functionalized Multi-walled carbon nanotubes were characterized by Fourier
transform infrared spectroscopy (FTIR), thermogravimetric analysis (TGA) and scanning electron microscope (SEM).
Its adsorption behavior towards Pd(II) and Mo(VI) ions was investigated. For this purpose, a solid phase extraction
process using the prepared adsorbent was carried out in the pH range of 1 to 9. The effect of various parameters such
as initial concentration, time and interfering ions on the adsorption amount was investigated, and the optimal
conditions for the maximum extraction of the two ions were obtained. The adsorption of these ions by the synthesized
MWNTs in real samples was examined and good results were achieved. The negative value of the change in standard
Gibbs free energy (ΔG°<0) for Mo(VI) sorption by the adsorbent specify a spontaneous and realizable sorption
process. The changes in free energy (ΔG °), enthalpy (ΔH °) and entropy (ΔS °) for Pd(II) ions associated with
Mo(VI) ions are reversed. finally, The compatibility of the experimental data with the adsorption isotherms of
Langmuir, Freundlich and Redlich-Peterson were investigated for the adsorption of Mo(VI) and Pd (II) the modified
carbon nanotubes.
Keywords
Adsorption; amine-functionalized MWNT; Kinetic Study.
Introduction Given the importance of Pd(II) and Mo(VI) ions in
nuclear waste, research is valuable and important to
suggest new methods for extracting and separating
these ions.Palladium is a rare silver and white metal
from the platinum group. Palladium (Pd) is chemically
similar to platinum, is extracted from copper and
nickel ores and is used to manufacture industrial
catalysts and jewelry. This metal, with its low density,
has the lowest melting point among the metals of the
platinum group and combines strongly with sulfuric
and nitric acids and slowly dissolves in hydrochloric
acid. Pd does not combine with oxygen at normal
temperatures. It is found along with platinum, copper,
and mercury minerals. Natural palladium isotopes
consist of six isotopes. The most stable radioactive
isotopes of the metal is Pd-107, with a half-life of 6.5
million years. The Pd-103 has a half-life of 17 days
and the Pd-100 has a half-life of 3.63 days. Another 18
radioactive isotopes are classified according to their
atomic weight. With the exception of Pd-101 with a
half-life of 8.47 hours, Pd-109 with a half-life of 13.7
hours, and Pd-112 with a half-life of 21 hours, the
other unstable isotopes of this metal have a half-life of
less than half an hour [1-6].The abundance of
molybdenum in the earth's crust is 0.007%.
Molybdenum (Mo) is a white or off-white metal and
its mineral is molybdenite (MoS2), which is an
essential element for plant nutrition.Molybdenum is
insoluble in hydrochloric acid, sodium hydroxide,
ammonia and sulfuric acid and reacts with hot or
concentrated sulfuric acid or nitric acid and boiling
hydrochloric acid. Studies of the environmental
hazards of molybdenum have shown that it is generally
one of the most dangerous substances that can cause
acute poisoning when consumed. Molybdenum can
cause severe gastrointestinal irritation with diarrhea,
coma, and death from heart failure. When it is
absorbed into the skin, it is very harmful and irritating
to the skin. It also affects the nervous system, lungs,
and respiratory tract, and can cause skin allergies and
severe damage to the skin, eyes, and airways.
Molybdenum is used in the aerospace, automotive and
electronics industries. Beans need molybdenum to
remove bacterial nitrogen. Approximately 25 to 75%
of the molybdenum in food is absorbed by the
gastrointestinal tract and quickly excreted in the urine.
Animal data show that the metabolism of molybdenum
Journal of Environmental Sciences Studies
Journal home page: www.jess.ir
Page 2
Journal of Environmental Sciences Studies (JESS) Volume 6 , Number 3, Autumn (2021), 4111-4120
4112
compounds is closely related to the metabolism of
copper and sulfur compounds [7-11].In recent years,
various methods have been proposed to eliminate
metal ions, such as chemical precipitation, reverse
osmosis, electrolytic recycling, ion exchange or
adsorption by various adsorbents. The adsorption
process is widely used because of its simplicity and
cost-effectiveness. Various sorbents such as seaweed,
crab skin, dry activated sludge and activated carbon
made from almond kernels have been used to remove
metal ions from water. The effect of particle size of the
adsorbent was discussed and a direct relationship
between particle size and adsorption rate was obtained
and researchers became aware of the ability of
nanoparticles as adsorbents for the pollutant materials.
For this purpose, many studies on the application of
carbon nanotubes to remove metal ions have been
carried out over the past ten years [12-20].
2. Materials and Methods
2.1. Chemicals and materials
All materials used in this project such as
Na2MoO4.2H2O, PdCl2, CdSO4, BaCl2, NiCl2, CaH2
,FeSO4.14H2O, HCl ,NH4NO3, Ethylenediamine with
a purity of 99% and thionyl chloride with a purity of
99% are provided by one of the companies Merck,
Fluca or Sigma Aldrich. Purified multi-walled carbon
nanotubes (MWNTs): Carbon content: >97%; CNT
content: >95%; Outer Diameter:<8nm Inner
Diameter:2-5nm; Length:10-30um; is purchased
from Chengdu Organic Chemicals Co.Ltd.,Chinese
Academy of Sciences.
2.2. Synthesis of amine-functionalized MWNTs
In order to prepare the MWNT-COOH, raw MWNTs
(0.54 g) were added to a mixture of sulfuric acid and
nitric acid in a volumetric ratio of 3:1 and stirred in an
ultrasonic bath (40 kHz) for about 30 minutes while it
was refluxed. Then the solution was washed with
distilled water until the pH of the filtrate reached
approximately seven. The obtained material was dried
under vacuum at 60 ° C for 12 hours to give COOH-
functionalized MWNT. Then 0.5 g of MWNT-COOH
in 30 ml of thionyl chloride was exposed and stirred at
65 ° C for 24 hours and then filtered, washed with
anhydrous tetrahydrofuran and dried under vacuum at
25 ° C for 24 hours. The yield of MWNT-COCl was
obtained. Then 0.48 g of acyl chloride-functionalized
MWNT in 20.0 ml of C2H8N2 were exposed to an
ultrasonic bath (40 kHz) at 60 ° C for 5 hours and the
solution was then stirred at 60 ° C for a further 24
hours. The yield obtained was collected by vacuum
filtration followed by washing with anhydrous
methanol. After repeated washing and filtering, the
resulting crop was dried in a vacuum for 24 hours to
give amine-functionalized MWNT (Figure 1).
Figure 1. The schematic synthesis of the amine functionalized
MWNTs.
2.2. Adsorbent Characterization
2.2.1. FTIR analysis
The use of infrared spectrum is one of the most
common methods for investigating the
functionalization of carbon nanotubes. In this study,
the infrared spectrum of pristine nanotubes and
functionalized nanotubes has been obtained by an
FTIR device model Vector22 made in Bruker
Company of Germany. The sampling method was
potassium bromide tablets.
Figure 2. FTIR spectrum of MWCNTs and MWCNTFs.
Figure. 2 shows the pronounced peak developments
and the peak in the range of 1670 cm-1 belongs to
carbonyl group. The peak in 1051 cm-1 can be related
to C-O, whose presence indicates the formation of the
carboxyl functional group.From the comparison of the
two spectra, the creation of new functional groups that
have formed some new absorption peaks in the
spectrum is clear. In the spectrum of the adsorbent,
around a wavelength of 3100 cm-1, a small wide peak
is observed, which can be related to the tensile
adsorption of the N – H bond. An absorption peak of
about 3478 cm-1 is also observed in functionalized
nanotubes, which can be due to the integration of the
absorption band of the O-H group and the tensile
adsorption of NH2. The peak of 1660 cm-1 in the
primary nanotube can be related to the C = C bond in
its structure, which after being actuated by a relatively
wide peak in the range of 1670 cm-1 of the carbonyl
amide group is covered.
2.2.2. Thermal Gravimetric Test (TGA).
Page 3
Journal of Environmental Sciences Studies (JESS) Volume 6 , Number 3, Autumn (2021), 4111-4120
4113
The TGA thermograms of the primary nanotube are
shown in Figure 3A and the thermograms of the
functionalized nanotubes are shown in Figure 3B.
These thermograms were performed under the inert
gas of argon from ambient temperature to 800 °C at a
rate of 10 °C per minute. As can be seen in these
figures, the functionalized nanotube has lost weight in
three stages before the temperature of 500 degrees, but
in the initial nanotube, the main weight loss occurs at
about 550 °C and with a steep slope. This observation
is consistent with the presence of significant functional
groups on the surface of the synthesized nanotubes.
(A)
(B)
Figure 3. Thermal Gravimetric Test (TGA) of MWCNTs (A)
and MWCNTFs (B).
2.2.3. Scanning electron microscopy (SEM)
examinations
The SEM image of the primary nanotube is shown in
Figure 4A and the SEM images of the functionalized
nanotubes are shown in Figures 4B and C. As can be
seen from these photos, it can be said that the
functional groups have almost uniformly covered the
surface of the nanotubes.
(A)
(B)
( C )
Figure 4. SEM images of MWCNTs (A) and MWCNTFs (B
and C).
3. RESULTS
3.1. Effect of pH
The initial pH of the solution may be considered as
one of the most important parameters in the adsorption
of metal ions. The pH estimates the net charge on the
sorbent which invariably determines whether the ions
can bind . To determine optimum pH for maximum
adsorption of molybdenum ions, seven 25 mL
polyethylene tubes containing 0.01g adsorbent and
2mg/ L concentration of molybdenum solution were
prepared. The acid or base was used to adjust the pH
from 1 to 9. After that, all the samples were placed in
an ultrasonic instrument for 30 seconds as long as they
became in similar phase, and then they were placed in
a thermostatic shaker bath for 3.5 hr. After filtering the
adsorbent, the concentration of residual Mo(VI) ions
solutions was measured by the ICP instrument. All the
above stages were repeated for Pd(II) ions solutions. In
this case, the pH values were from 3 to 9. As indicated
in Figure 5, the best pH values for Mo(VI) and Pd(II)
were 3 with adsorption of 74 % and 6 with adsorption
of 84.32 %, respectively. The adsorption percentage of
Mo(VI) and Pd(II) increases gradually from initial pH,
reaches to a maximum value and thereafter decreases.
Page 4
Journal of Environmental Sciences Studies (JESS) Volume 6 , Number 3, Autumn (2021), 4111-4120
4114
Figure 5. The effect of pH on the percentage of amounts
adsorption of Mo(VI) and Pd(II).
3.2. Effect of initial metals ions concentration
Six different concentrations in the range of 0.5 to 3
mg/ L at intervals 0.5 mg/ L in 25 mL Mo(VI) ions
solutions with 0.01g adsorbent were used at the best
pH value. They were placed in a thermostatic shaker
bath for 3.5 hr. After filtering the adsorbent, the
concentration of residual Mo(VI) and Pd(II) ions in the
solutions was measured by the ICP instrument. As
shown in Figure 6, the best initial ion concentration
values for Mo(VI) and Pd(II) are 1 mg/ L with
adsorption of 72.8 % and 2 mg/ L with adsorption of
85 %, respectively.
Figure 6. The effect of various initial concentrations on
adsorption
3.3. Effect of the adsorption time.
The adsorption experiment was performed at different
times (5, 10, 15, 30, 45, 60, 75, 90, and 120 min). 0.01
g adsorbent was added to 25 mL solution containing 1
mg/L of Mo(VI) (and 2 mg/L for Pd(II)) at the best pH
value. After filtering the adsorbent, the concentration
of the ions was determined by the ICP-AES . The
adsorption is as an exponential function of contact
time. The adsorption percentage will be increased with
increasing time, as shown in Figure 7.
Figure 7. The effect of contact time on the adsorption
3.4. Effect of temperature
The adsorption capacity was investigated at various
temperatures (20, 30, and 40 °C) and initial
concentrations of 0.5, 1, 2, 4, 6, 8, 10 mg/ L at the best
pH values, as shown in Table 1 and Figure 8.In all
experiments, volume of solution and amount of
adsorbent were 25 mL and 0.01 g, respectively. After
that, all the samples were placed in an ultrasonic
instrument for 30 seconds, and then they were placed
in a thermostatic shaker bath for 3.5 hr at the various
temperatures. After filtering the adsorbent, the
concentration of residual ions solutions was measured
by the ICP instrument.
Figure 8. the effect of time and initial concentration of Mo(VI)
and Pd(II) ions on the adsorption capacity.
Page 5
Journal of Environmental Sciences Studies (JESS) Volume 6 , Number 3, Autumn (2021), 4111-4120
4115
Table 1. Equilibrium results with Mo(VI) and Pd(II) ions with initial concentrations from 0.5 to 10 mg/L and Temperatures of
293, 303 and 313 k.
Temperatures
Mo(VI) and
Pd (II) ions T=293k T=303k T=313k
C0(mg/ L) Ce Kd q Ce Kd q Ce Kd q
mg/L (L/g) mg/g mg/L (L/g) mg/g mg/L (L/g) mg/g
0.5 0.18 0.711111 0.81 0.22 0.509091 0.71 0.24 0.433333 0.66
0.1 1.6 0.99 0.27 0.340741 0.58 0.23 0.469565 0.68
1 0.29 0.97931 1.77 0.31 0.890322 1.73 0.33 0.812121 1.68
0.45 0.488889 1.37 0.44 0.509091 1.41 0.53 0.354717 1.17
2 0.56 1.028572 3.60 0.73 0.69589 3.18 0.55 1.054546 3.62
0.85 0.541176 2.87 0.8 0.6 3.01 0.89 0.498876 2.78
4 1.04 1.138462 7.40 1.30 0.830769 6.75 0.82 1.55122 7.95
1.57 0.619108 6.09 1.85 0.464865 5.39 2.4 0.266667 4.01
6 1.53 1.168628 11.18 2.13 0.72676 9.69 1.18 1.633898 12.06
2.91 0.424742 7.72 2.91 0.424742 7.73 3.21 0.347664 6.98
8 2.21 1.047964 14.48 2.48 0.890322 13.81 1.51 1.719205 16.22
4.18 0.36555 9.55 4.08 0.384314 9.8 4.42 0.323982 8.95
10 2.54 1.174803 18.65 4.20 0.552381 14.50 2.21 1.409955 19.48
4.88 0.419672 12.81 4.67 0.456531 13.33 5.63 0.31048 10.93
1st row refers to Mo and 2nd row refers to P
3.5. Desorption studies
Desorption of the adsorbed ions was evaluated by 10
ml of 1 M HNO3, HCl, NH4NO3 and HNO3 + HCl
solutions. Among the various reagents used, 1 M-HCl
and 1 M-HNO3 + HCl were the most effective reagents
for Mo (VI) and Pd (II) ions desorption,respectively.
As indicated in Table 2, the best extraction percentages
were 93% (HCL) and 88% (HNO3 + HCl), indicating
good adsorbent regeneration properties and
reversibility of the adsorption process.
Table 2. The extraction percentages by using various Desorption solutions
Percentage extraction (%) After washing with 10 ml
desorption solution
Desorption
agent
Pd(II)
Mo(VI)
Pd(II)
Concentration
(mg/ L)
Mo(VI)
Concentration
(mg/ L)
Concentration
1 M
71.00 42.00 1.42 0.84 HNO3
67.50 93.00 1.35 1.86 HCl
55.00 60.00 1.10 1.20 NH4NO3
88.00 36.50 1.76 0.73 HNO3 + HCl
Page 6
Journal of Environmental Sciences Studies (JESS) Volume 6 , Number 3, Autumn (2021), 4111-4120
4116
3.6. Effect of contact time on adsorption-desorption
Desorption process was carried out after filtering of
the adsorbent and recovering of the adsorbed ions by
the solvent. The volume of the solution and the amount
of adsorbent were 25 mL and 0.01 g, respectively. The
concentration of ions was 2 mg/L at the optimum pH.
To complete the adsorption process, all the samples
were placed in a thermostatic shaker bath at the speed
of 180 RPM for various times of 5, 15, 30, 45, 60, 75,
and 120 min. After filtering the adsorbent, the
concentration of residual ions solutions was measured
by the ICP instrument, as shown in Figure 9.
Figure 9. Mo(VI) and Pd(II) adsorption and desorption as a
function of time at optimum conditions
3.7. Adsorption isotherms
Three different adsorption isotherm models with two
parameters (Langmuir and Freundlich) and three
parameters (Redlich-Peterson) were used to explain
the equilibrium data. These models are commonly
used to pre-examine the adsorption isotherm. The
Langmuir model is often used for monolayer sorption,
which occurs on a homogeneous surface with identical
sorption sites. The equation form can be expressed by
the following equation.
(1)
Where Ka and qm are the Langmuir constant and the
maximum amount of adsorption capacity (mg/g),
respectively. The qm and Ce are equilibrium
concentrations in solid and liquid phases, respectively.
where Ce is the equilibrium concentration of ions
remaining in the solution (mg/L), qe is the amount of
metal ions adsorbed per weight unit of the solid after
equilibrium (mg/g) and qmax is the maximum
adsorption capacity of the adsorbent (mg/g). Langmuir
isotherm model is shown in Figure 10 and the value of
the obtained parameters is shown in Table 3.
Figure 10. Best nonlinear isotherms for the adsorption of
Pd(II) and Mo(VI) ions at different temperatures
Page 7
Journal of Environmental Sciences Studies (JESS) Volume 6 , Number 3, Autumn (2021), 4111-4120
4117
Table 3. Langmuir-nl, Freundlich-nl and Redlich-pet. Isotherm constants for the adsorption of Mo(VI) and Pd(II) ions onto MWNT-
NH2
Isotherm
model T(K) Parameters
Langmuir-nl
qm k R2 RMSE
293 64.77×10 6-1.47×10 0.9915 0.5775 4.1995
31.4761 0.1227 0.9652 0.7639 9.4990
303 33.51 0.2046 0.9492 1.1761 17.9728
149.3368 0.0193 0.9789 0.6424 6.8832
323 57.98×10 5-1.20×10 0.9638 1.4195 10.7055
62.6345×10 7-7.2530×10 0.9538 0.6071 7.8919
Freundlich-nl
K n R2 RMSE
293 6.8295 0.9597 0.9922 0.5547 4.0573
3.5419 1.3028 0.9688 0.7228 7.9813
303 5.5004 1.3402 0.9261 1.4190 26.7115
2.9783 1.0855 0.9804 0.6210 6.7452
323 9.2351 0.9215 0.9673 1.4306 13.1156
1.3556 0.8096 0.9710 0.8581 6.7602
Redlich-pet.
K1 K2 g R2 RMSE
293 43.0396×10 4-2.1951×10 -2.0021 0.9928 0.5604 4.0979
4-6.7396×10 11-7.0827×10 0.2328 0.9688 0.7228 7.9813
303 69.7813×10 7-7652×106. 0.2530 0.9164 1.0955 32.5617
101.3520×10 94.5396×10 0.0788 0.9804 0.6449 6.7452
323 9.8405 0.0280 -3.5106 0.9839 0.6203 8.89340
2.0689 1.3720 -2.1501 0.9789 0.6554 4.9431
1st No. refers to Mo and 2nd No. refers to Pd
The Freundlich isotherm is a curve that corresponds to
the concentration of a solute on the surface of an
adsorbent to the concentration of the solute in the
liquid phase. This model can be applied to multi-layer
adsorption with uneven distribution of the heat and
affinities of adsorption over the heterogeneous surface.
It is stated as follows:
qe = KFCe1/n (2)
KF and n refer to the Freundlich constants, and qe and
Ce are equilibrium concentrations in solid and liquid
phases, respectively.The Redlich–Peterson isotherm is
a hybrid of the Langmuir and Freundlich isotherms
(Redlich and Peterson 1959). The numerator is from
the Langmuir isotherm and has the benefit of
approaching the Henry region at infinite dilution. The
denominator has the hybrid Langmuir–Freundlich
form as follows,Where qe is equilibrium capacity, Ce is
equilibrium concentration and A and B are equilibrium
constants. Isotherm curves were estimated using
different models (Table 3). Figure 10 suggests The
Langmuir, Freundlich and Redlich Peterson isotherms
at various temperatures. In order to verify the model
for the adsorption system, the data must be analyzed
using error analysis. Various error functions were
applied in this study, namely the RMSE equation
(Root-Mean-Square Error) (4) and the chi-square
equation (5). A chi-square (χ2) is a test that measures
how a model compares to actual observed data [21-
23].
(3)
(4)
(5)
3. 8. Thermodynamic properties.
The adsorption of Mo(VI) and Pd (II) on MWNT-NH2
at different temperatures showed (Figure 8) an increase
in the amount of adsorption with an increase in
Page 8
Journal of Environmental Sciences Studies (JESS) Volume 6 , Number 3, Autumn (2021), 4111-4120
4118
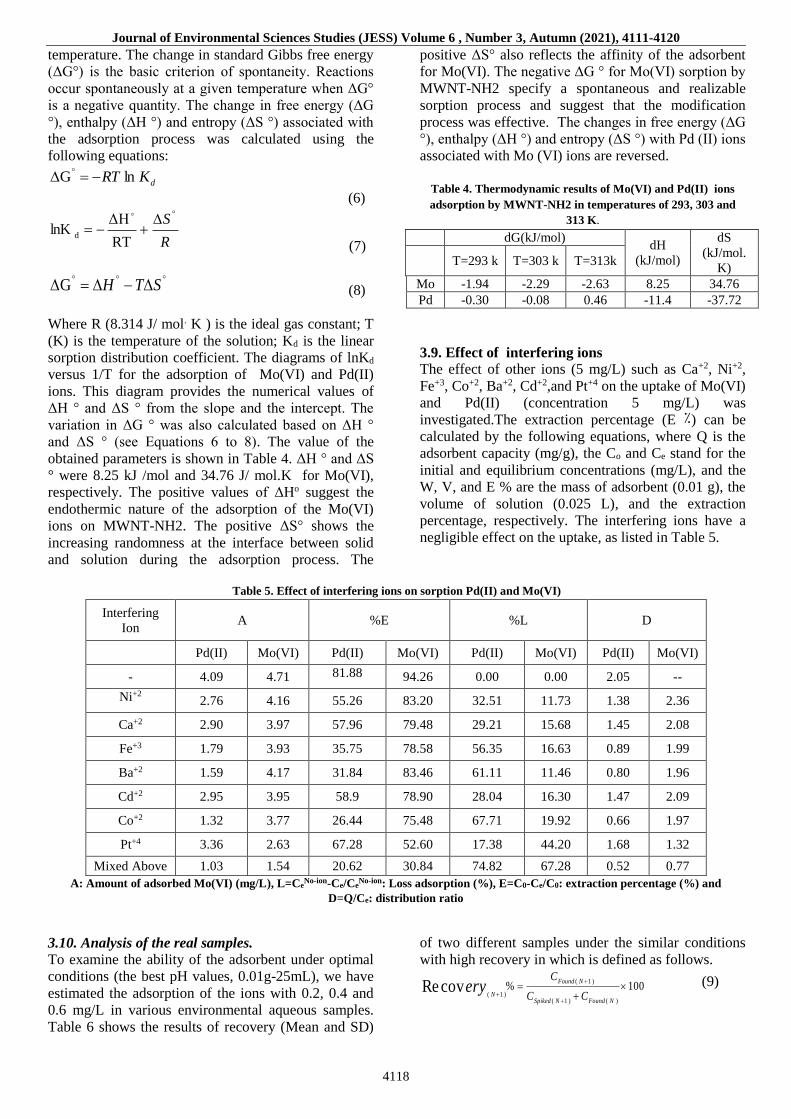
temperature. The change in standard Gibbs free energy
(ΔG°) is the basic criterion of spontaneity. Reactions
occur spontaneously at a given temperature when ΔG°
is a negative quantity. The change in free energy (ΔG
°), enthalpy (ΔH °) and entropy (ΔS °) associated with
the adsorption process was calculated using the
following equations:
dKRT lnG
(6)
R
S
RT
ΔHlnK
d
(7)
STHG (8)
Where R (8.314 J/ mol. K ) is the ideal gas constant; T
(K) is the temperature of the solution; Kd is the linear
sorption distribution coefficient. The diagrams of lnKd
versus 1/T for the adsorption of Mo(VI) and Pd(II)
ions. This diagram provides the numerical values of
ΔH ° and ΔS ° from the slope and the intercept. The
variation in ΔG ° was also calculated based on ΔH °
and ΔS ° (see Equations 6 to 8). The value of the
obtained parameters is shown in Table 4. ΔH ° and ΔS
° were 8.25 kJ /mol and 34.76 J/ mol.K for Mo(VI),
respectively. The positive values of ΔHo suggest the
endothermic nature of the adsorption of the Mo(VI)
ions on MWNT-NH2. The positive ΔS° shows the
increasing randomness at the interface between solid
and solution during the adsorption process. The
positive ΔS° also reflects the affinity of the adsorbent
for Mo(VI). The negative ΔG ° for Mo(VI) sorption by
MWNT-NH2 specify a spontaneous and realizable
sorption process and suggest that the modification
process was effective. The changes in free energy (ΔG
°), enthalpy (ΔH °) and entropy (ΔS °) with Pd (II) ions
associated with Mo (VI) ions are reversed.
Table 4. Thermodynamic results of Mo(VI) and Pd(II) ions
adsorption by MWNT-NH2 in temperatures of 293, 303 and
313 K.
dG(kJ/mol) dH
(kJ/mol)
dS
(kJ/mol.
K) T=293 k T=303 k T=313k
Mo -1.94 -2.29 -2.63 8.25 34.76
Pd -0.30 -0.08 0.46 -11.4 -37.72
3.9. Effect of interfering ions
The effect of other ions (5 mg/L) such as Ca+2, Ni+2,
Fe+3, Co+2, Ba+2, Cd+2,and Pt+4 on the uptake of Mo(VI)
and Pd(II) (concentration 5 mg/L) was
investigated.The extraction percentage (E ٪) can be
calculated by the following equations, where Q is the
adsorbent capacity (mg/g), the Co and Ce stand for the
initial and equilibrium concentrations (mg/L), and the
W, V, and E % are the mass of adsorbent (0.01 g), the
volume of solution (0.025 L), and the extraction
percentage, respectively. The interfering ions have a
negligible effect on the uptake, as listed in Table 5.
Table 5. Effect of interfering ions on sorption Pd(II) and Mo(VI)
D %L %E A Interfering
Ion
Mo(VI) Pd(II) Mo(VI) Pd(II) Mo(VI) Pd(II) Mo(VI) Pd(II)
-- 2.05 0.00 0.00 94.26 81.88
4.71 4.09 -
2.36 1.38 11.73 32.51 83.20 55.26 4.16 2.76 Ni+2
2.08 1.45 15.68 29.21 79.48 57.96 3.97 2.90 Ca+2
1.99 0.89 16.63 56.35 78.58 35.75 3.93 1.79 Fe+3
1.96 0.80 11.46 61.11 83.46 31.84 4.17 1.59 Ba+2
2.09 1.47 16.30 28.04 78.90 58.9 3.95 2.95 Cd+2
1.97 0.66 19.92 67.71 75.48 26.44 3.77 1.32 Co+2
1.32 1.68 44.20 17.38 52.60 67.28 2.63 3.36 Pt+4
0.77 0.52 67.28 74.82 30.84 20.62 1.54 1.03 Mixed Above
A: Amount of adsorbed Mo(VI) (mg/L), L=CeNo-ion-Ce/Ce
No-ion: Loss adsorption (%), E=C0-Ce/C0: extraction percentage (%) and
D=Q/Ce: distribution ratio
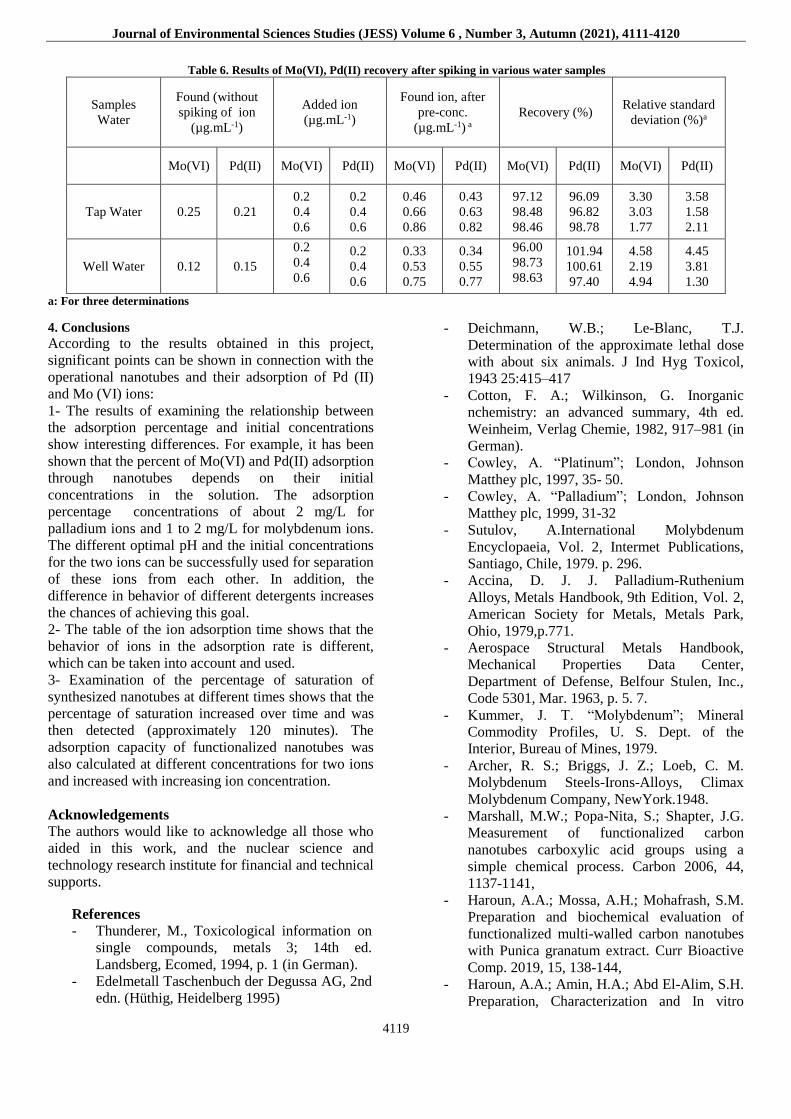
3.10. Analysis of the real samples.
To examine the ability of the adsorbent under optimal
conditions (the best pH values, 0.01g-25mL), we have
estimated the adsorption of the ions with 0.2, 0.4 and
0.6 mg/L in various environmental aqueous samples.
Table 6 shows the results of recovery (Mean and SD)
of two different samples under the similar conditions
with high recovery in which is defined as follows.
( 1 )
( 1 )( 1 ) ( )
% 100Re covFound N
NSpiked N Found N
C
C Cery
(9)
Page 9
Journal of Environmental Sciences Studies (JESS) Volume 6 , Number 3, Autumn (2021), 4111-4120
4119
Table 6. Results of Mo(VI), Pd(II) recovery after spiking in various water samples
Samples
Water
Found (without
spiking of ion
(µg.mL-1)
Added ion
(µg.mL-1)
Found ion, after
pre-conc.
(µg.mL-1) a
Recovery (%) Relative standard
deviation (%)a
Mo(VI) Pd(II) Mo(VI) Pd(II) Mo(VI) Pd(II) Mo(VI) Pd(II) Mo(VI) Pd(II)
Tap Water 0.25 0.21
0.2
0.4
0.6
0.2
0.4
0.6
0.46
0.66
0.86
0.43
0.63
0.82
97.12
98.48
98.46
96.09
96.82
98.78
3.30
3.03
1.77
3.58
1.58
2.11
Well Water 0.12 0.15
0.2
0.4
0.6
0.2
0.4
0.6
0.33
0.53
0.75
0.34
0.55
0.77
96.00
98.73
98.63
101.94
100.61
97.40
4.58
2.19
4.94
4.45
3.81
1.30
a: For three determinations
4. Conclusions According to the results obtained in this project,
significant points can be shown in connection with the
operational nanotubes and their adsorption of Pd (II)
and Mo (VI) ions:
1- The results of examining the relationship between
the adsorption percentage and initial concentrations
show interesting differences. For example, it has been
shown that the percent of Mo(VI) and Pd(II) adsorption
through nanotubes depends on their initial
concentrations in the solution. The adsorption
percentage concentrations of about 2 mg/L for
palladium ions and 1 to 2 mg/L for molybdenum ions.
The different optimal pH and the initial concentrations
for the two ions can be successfully used for separation
of these ions from each other. In addition, the
difference in behavior of different detergents increases
the chances of achieving this goal.
2- The table of the ion adsorption time shows that the
behavior of ions in the adsorption rate is different,
which can be taken into account and used.
3- Examination of the percentage of saturation of
synthesized nanotubes at different times shows that the
percentage of saturation increased over time and was
then detected (approximately 120 minutes). The
adsorption capacity of functionalized nanotubes was
also calculated at different concentrations for two ions
and increased with increasing ion concentration.
Acknowledgements
The authors would like to acknowledge all those who
aided in this work, and the nuclear science and
technology research institute for financial and technical
supports.
References
- Thunderer, M., Toxicological information on
single compounds, metals 3; 14th ed.
Landsberg, Ecomed, 1994, p. 1 (in German).
- Edelmetall Taschenbuch der Degussa AG, 2nd
edn. (Hüthig, Heidelberg 1995)
- Deichmann, W.B.; Le-Blanc, T.J.
Determination of the approximate lethal dose
with about six animals. J Ind Hyg Toxicol,
1943 25:415–417
- Cotton, F. A.; Wilkinson, G. Inorganic
nchemistry: an advanced summary, 4th ed.
Weinheim, Verlag Chemie, 1982, 917–981 (in
German).
- Cowley, A. “Platinum”; London, Johnson
Matthey plc, 1997, 35- 50.
- Cowley, A. “Palladium”; London, Johnson
Matthey plc, 1999, 31-32
- Sutulov, A.International Molybdenum
Encyclopaeia, Vol. 2, Intermet Publications,
Santiago, Chile, 1979. p. 296.
- Accina, D. J. J. Palladium-Ruthenium
Alloys, Metals Handbook, 9th Edition, Vol. 2,
American Society for Metals, Metals Park,
Ohio, 1979,p.771.
- Aerospace Structural Metals Handbook,
Mechanical Properties Data Center,
Department of Defense, Belfour Stulen, Inc.,
Code 5301, Mar. 1963, p. 5. 7.
- Kummer, J. T. “Molybdenum”; Mineral
Commodity Profiles, U. S. Dept. of the
Interior, Bureau of Mines, 1979.
- Archer, R. S.; Briggs, J. Z.; Loeb, C. M.
Molybdenum Steels-Irons-Alloys, Climax
Molybdenum Company, NewYork.1948.
- Marshall, M.W.; Popa-Nita, S.; Shapter, J.G.
Measurement of functionalized carbon
nanotubes carboxylic acid groups using a
simple chemical process. Carbon 2006, 44,
1137-1141,
- Haroun, A.A.; Mossa, A.H.; Mohafrash, S.M.
Preparation and biochemical evaluation of
functionalized multi-walled carbon nanotubes
with Punica granatum extract. Curr Bioactive
Comp. 2019, 15, 138-144,
- Haroun, A.A.; Amin, H.A.; Abd El-Alim, S.H.
Preparation, Characterization and In vitro
Page 10
Journal of Environmental Sciences Studies (JESS) Volume 6 , Number 3, Autumn (2021), 4111-4120
4120
biological activity of soyasapogenol B loaded
onto functionalized multi-walled carbon
nanotubes. Curr Bioactive Comp. 2018, 14,
364-372,
- Amin H.A., Haroun A.A. Comparative studies
of free and immobilized Aspergillus flavus
onto functionalized multi-walled carbon
nanotubes for soyasapogenol B production.
Egypt Pharma J. 2017, 16, 38-143,
- Khaled, E.; Kamel, M.S.; Hassan, H.N.A.;
Haroun, A.A.; Youssef, A.M.; Aboul-Enein,
H.Y. Novel multiwalled carbon nanotubes/β-
cyclodextrin based carbon paste electrode for
flow injection potentiometric determination of
piroxicam. Talanta 2012, 97, 96-102
- Mubarak, N.M.; Wong, J.R.; Tan, K.W.; Sahu,
J.N.; Abdullah, E.C.; Jayakumar, N.S.;
Ganesan, P. Immobilization of cellulase
enzyme on functionalized multiwall carbon
nanotubes. J. Molecular Catalysis B:
Enzymatic 2014, 107, 124-131,
- Shah, S.; Solanki, K.; Gupta, M.N.
Enhancement of lipase activity in non-aqueous
media upon immobilization on multiwalled
carbon nanotubes. Chem Central J. 2007, 1,1-6
- Pavlidis, I.V.; Tsoufis, T.; Enotiadis, A.;
Gournis, D.; Stamatis, H. Functionalized
multi-wall carbon nanotubes for lipase
immobilization. Adv. Eng. Mater. 2010, 12,
179-183,
- Pathania, D.; Sharma, S.; Singh, P. Removal
of methylene blue by adsorption onto activated
carbon developed from Ficus carica bast. Arab
J Chem 2017, 10, S1445-S1451,
- Vishali, S.; Mullaim P. Analysis of two-
parameter and three-parameter isotherms by
nonlinear regression for the treatment of
textile effluent using immobilized Trametes
versicolor: comparison of various error
functions. Desalin Water Treat 2016, 57(56),
27061–27072
- 22 Kumar, K.V. Comparative analysis of
linear and non-linear method of estimating the
sorption isotherm parameters for malachite
green onto activated carbon, J. Hazard.
Mater.2006, 136, 197–202.
- Kumar,. K.V.; Porkodi, K.; Rocha, F.
Isotherms and thermodynamics by linear and
non-linear regression analysis for the sorption
of methylene blue onto activated carbon:
comparison of various error functions, J.
Hazard. Mater.2008, 151,794–804.