University of Calgary PRISM: University of Calgary's Digital Repository Graduate Studies The Vault: Electronic Theses and Dissertations 2014-04-03 Equilibrium Conditions of Carbon Dioxide and Ethane Gas Hydrate in the Presence of Binary Mixtures of Methanol and Sodium Chloride Alqahtani, Fahd Alqahtani, F. (2014). Equilibrium Conditions of Carbon Dioxide and Ethane Gas Hydrate in the Presence of Binary Mixtures of Methanol and Sodium Chloride (Unpublished master's thesis). University of Calgary, Calgary, AB. doi:10.11575/PRISM/25930 http://hdl.handle.net/11023/1400 master thesis University of Calgary graduate students retain copyright ownership and moral rights for their thesis. You may use this material in any way that is permitted by the Copyright Act or through licensing that has been assigned to the document. For uses that are not allowable under copyright legislation or licensing, you are required to seek permission. Downloaded from PRISM: https://prism.ucalgary.ca
Transcript
University of Calgary
PRISM: University of Calgary's Digital Repository
Graduate Studies The Vault: Electronic Theses and Dissertations
2014-04-03
Equilibrium Conditions of Carbon Dioxide and Ethane
Gas Hydrate in the Presence of Binary Mixtures of
Methanol and Sodium Chloride
Alqahtani, Fahd
Alqahtani, F. (2014). Equilibrium Conditions of Carbon Dioxide and Ethane Gas Hydrate in the
Presence of Binary Mixtures of Methanol and Sodium Chloride (Unpublished master's thesis).
University of Calgary, Calgary, AB. doi:10.11575/PRISM/25930
http://hdl.handle.net/11023/1400
master thesis
University of Calgary graduate students retain copyright ownership and moral rights for their
thesis. You may use this material in any way that is permitted by the Copyright Act or through
licensing that has been assigned to the document. For uses that are not allowable under
copyright legislation or licensing, you are required to seek permission.
Downloaded from PRISM: https://prism.ucalgary.ca
UNIVERSITY OF CALGARY
Equilibrium Conditions of Carbon Dioxide and Ethane Gas Hydrate in the Presence of
2.3.2 Leak test .............................................................................................................................................................. 38
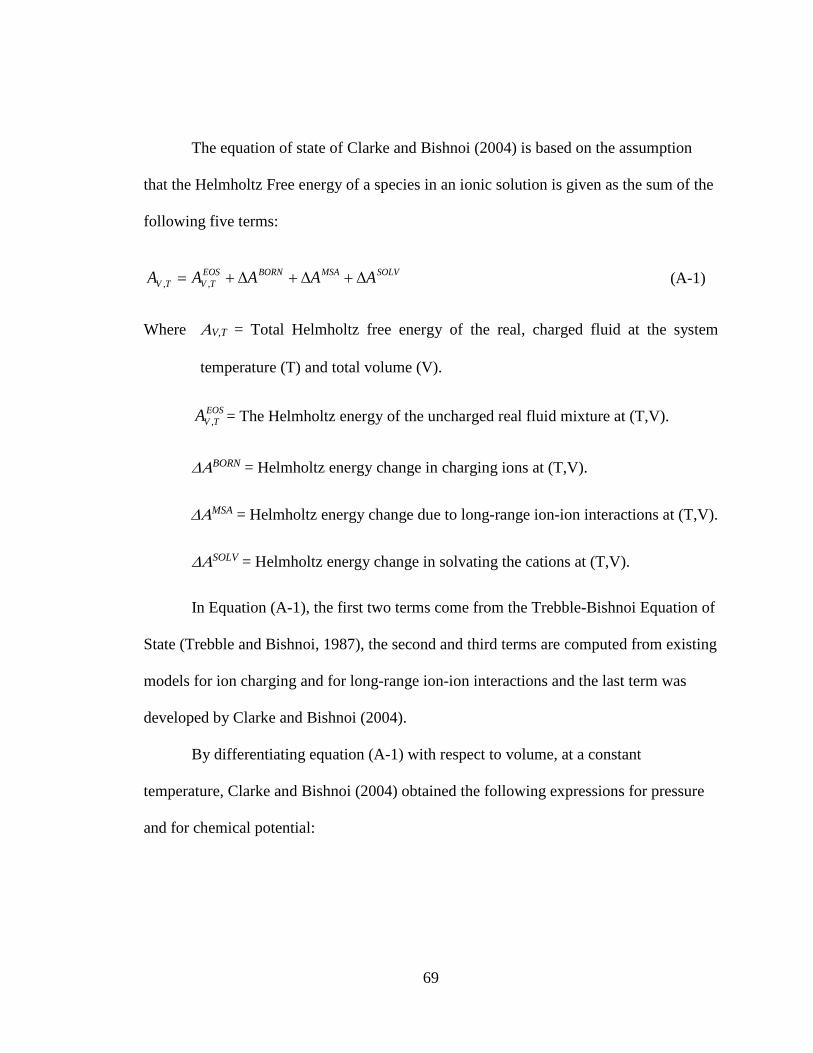
Appendix A: The Equation of State of Clarke and Bishnoi ......................................................... 68
vi
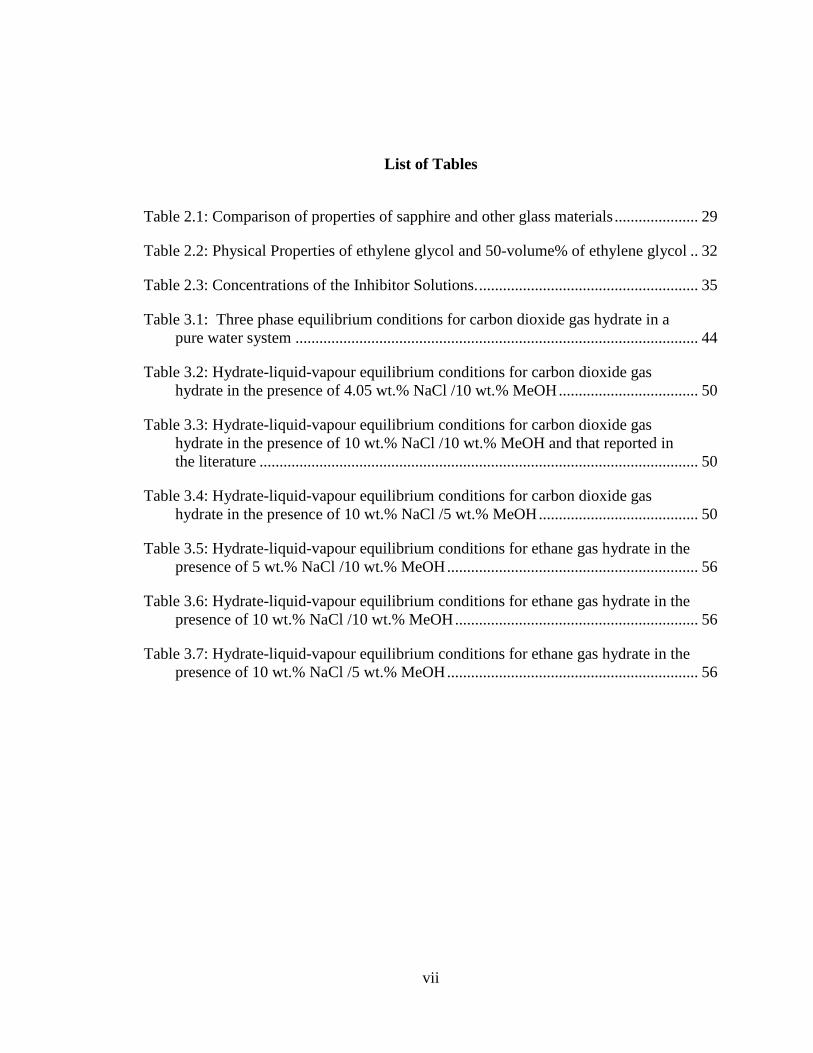
List of Tables
Table 2.1: Comparison of properties of sapphire and other glass materials ..................... 29
Table 2.2: Physical Properties of ethylene glycol and 50-volume% of ethylene glycol .. 32
Table 2.3: Concentrations of the Inhibitor Solutions. ....................................................... 35
Table 3.1: Three phase equilibrium conditions for carbon dioxide gas hydrate in a pure water system ..................................................................................................... 44
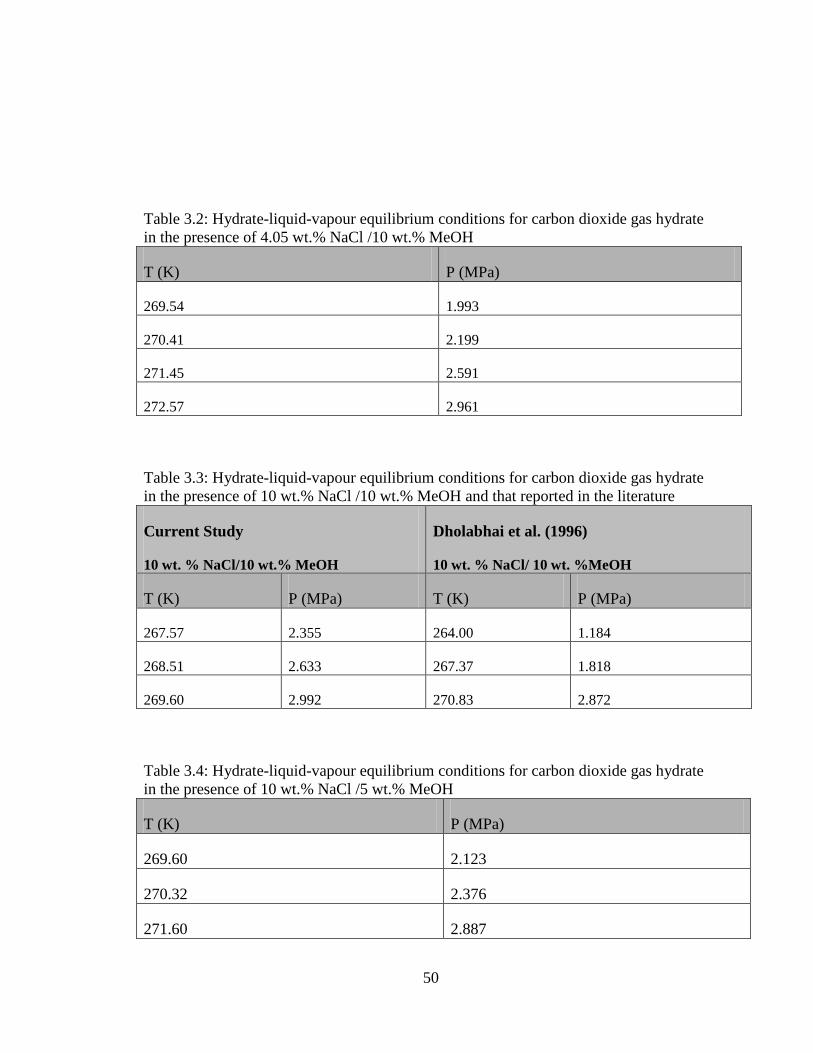
Table 3.2: Hydrate-liquid-vapour equilibrium conditions for carbon dioxide gas hydrate in the presence of 4.05 wt.% NaCl /10 wt.% MeOH ................................... 50
Table 3.3: Hydrate-liquid-vapour equilibrium conditions for carbon dioxide gas hydrate in the presence of 10 wt.% NaCl /10 wt.% MeOH and that reported in the literature .............................................................................................................. 50
Table 3.4: Hydrate-liquid-vapour equilibrium conditions for carbon dioxide gas hydrate in the presence of 10 wt.% NaCl /5 wt.% MeOH ........................................ 50
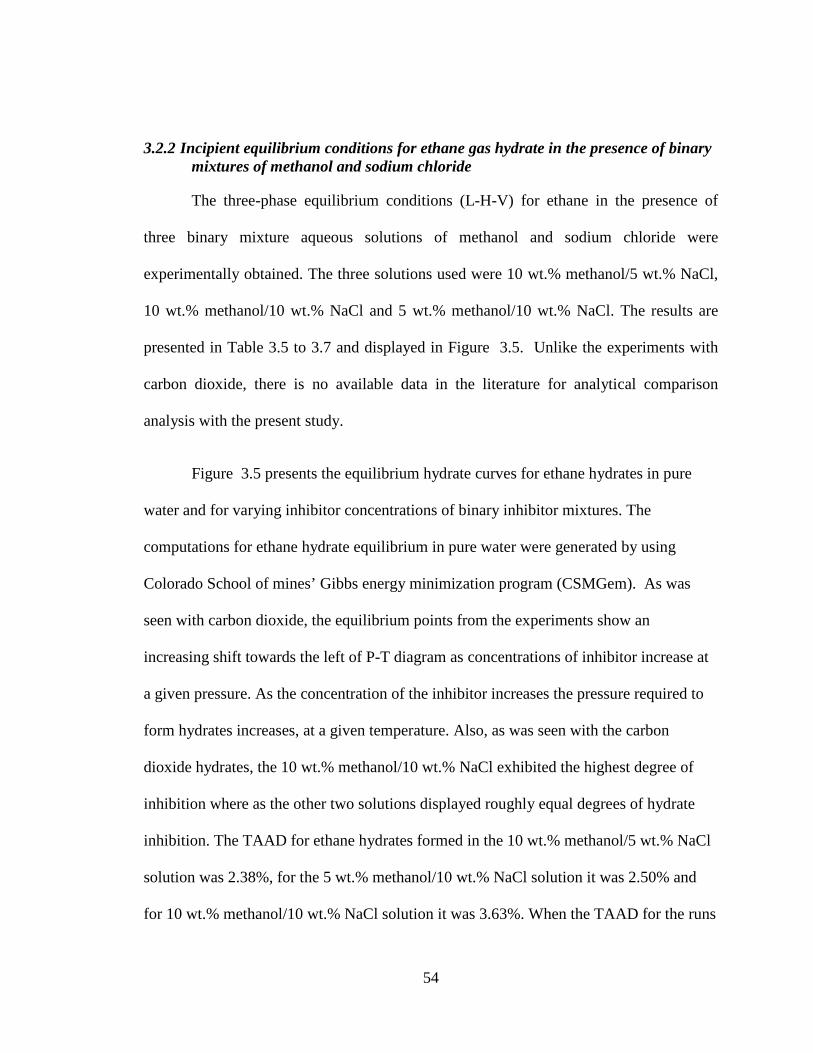
Table 3.5: Hydrate-liquid-vapour equilibrium conditions for ethane gas hydrate in the presence of 5 wt.% NaCl /10 wt.% MeOH ............................................................... 56
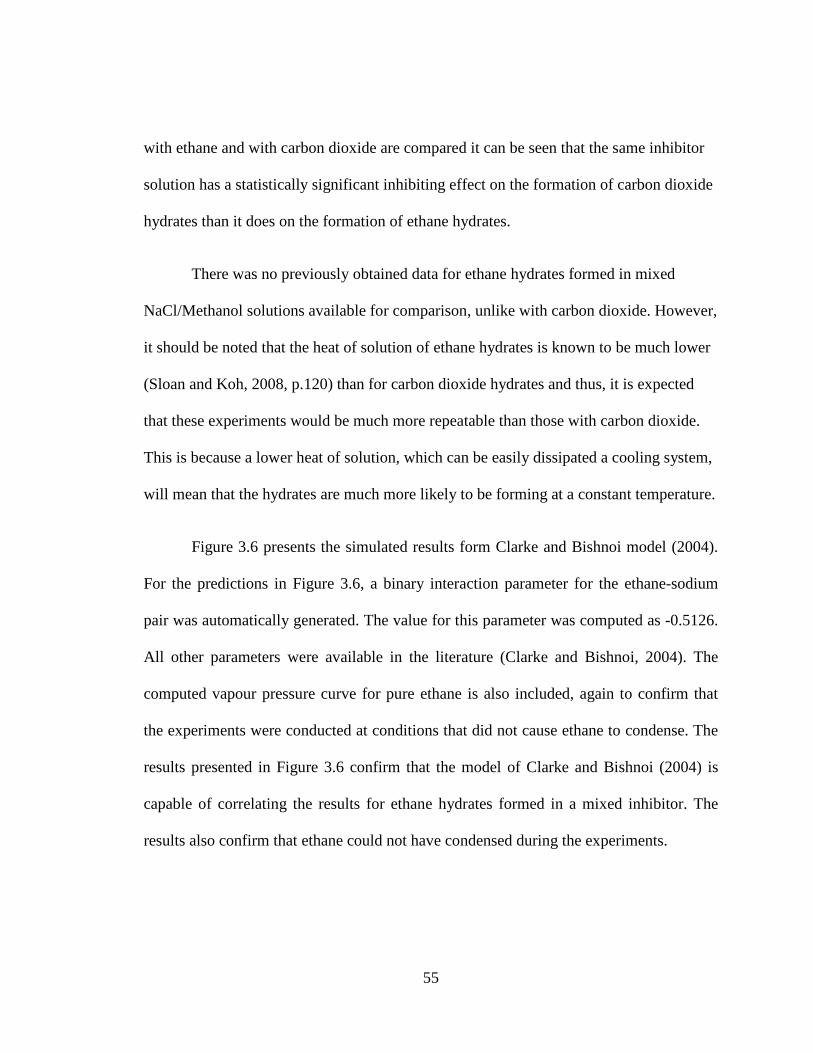
Table 3.6: Hydrate-liquid-vapour equilibrium conditions for ethane gas hydrate in the presence of 10 wt.% NaCl /10 wt.% MeOH ............................................................. 56
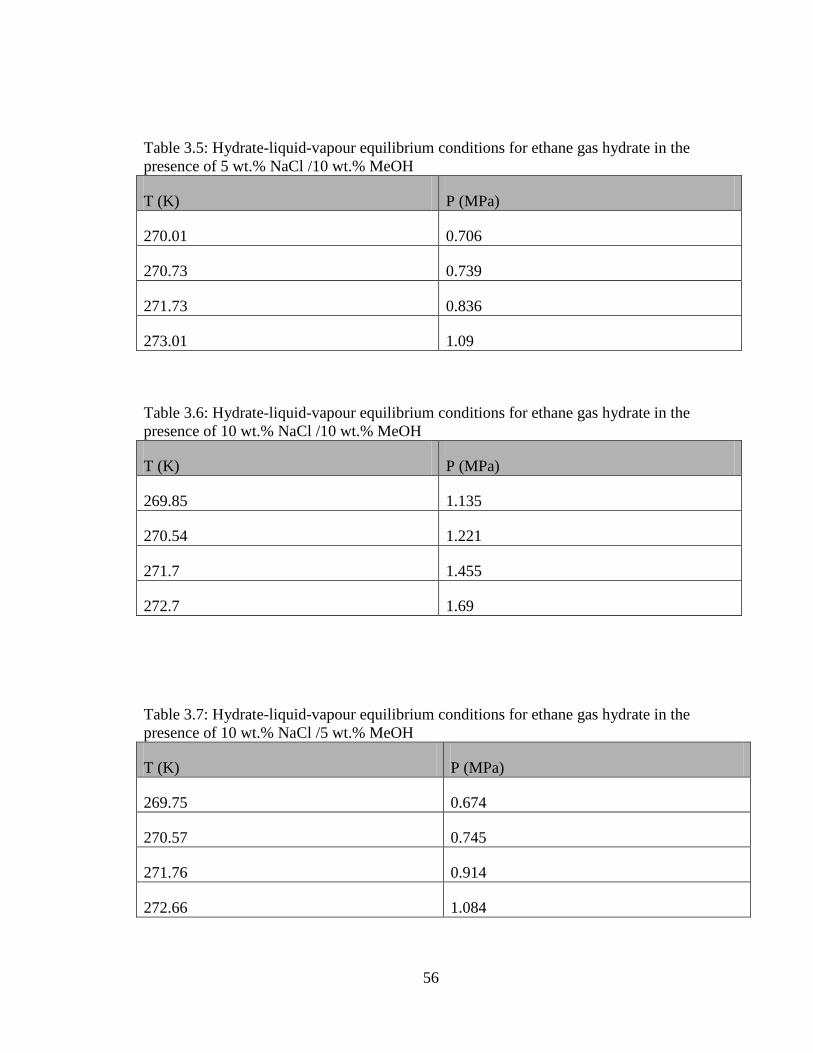
Table 3.7: Hydrate-liquid-vapour equilibrium conditions for ethane gas hydrate in the presence of 10 wt.% NaCl /5 wt.% MeOH ............................................................... 56
vii
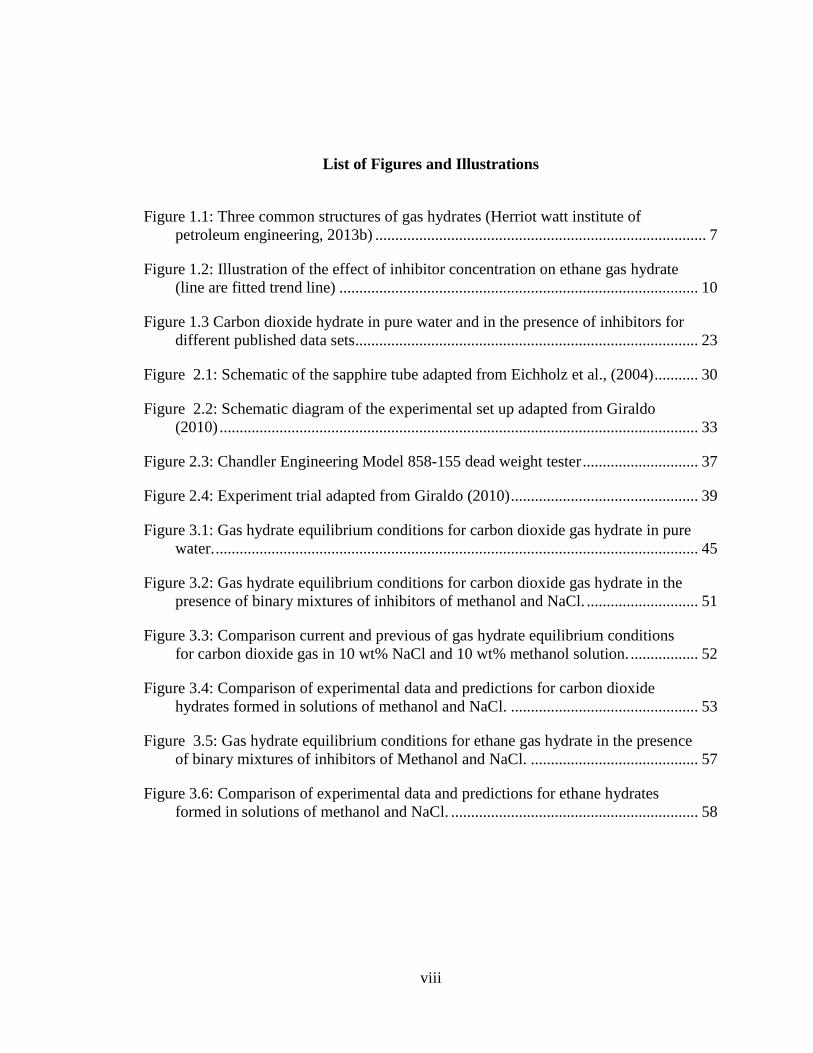
List of Figures and Illustrations
Figure 1.1: Three common structures of gas hydrates (Herriot watt institute of petroleum engineering, 2013b) ................................................................................... 7
Figure 1.2: Illustration of the effect of inhibitor concentration on ethane gas hydrate (line are fitted trend line) .......................................................................................... 10
Figure 1.3 Carbon dioxide hydrate in pure water and in the presence of inhibitors for different published data sets ...................................................................................... 23
Figure 2.1: Schematic of the sapphire tube adapted from Eichholz et al., (2004) ........... 30
Figure 2.2: Schematic diagram of the experimental set up adapted from Giraldo (2010) ........................................................................................................................ 33
Figure 2.3: Chandler Engineering Model 858-155 dead weight tester ............................. 37
Figure 2.4: Experiment trial adapted from Giraldo (2010) ............................................... 39
Figure 3.1: Gas hydrate equilibrium conditions for carbon dioxide gas hydrate in pure water. ......................................................................................................................... 45
Figure 3.2: Gas hydrate equilibrium conditions for carbon dioxide gas hydrate in the presence of binary mixtures of inhibitors of methanol and NaCl. ............................ 51
Figure 3.3: Comparison current and previous of gas hydrate equilibrium conditions for carbon dioxide gas in 10 wt% NaCl and 10 wt% methanol solution. ................. 52
Figure 3.4: Comparison of experimental data and predictions for carbon dioxide hydrates formed in solutions of methanol and NaCl. ............................................... 53
Figure 3.5: Gas hydrate equilibrium conditions for ethane gas hydrate in the presence of binary mixtures of inhibitors of Methanol and NaCl. .......................................... 57
Figure 3.6: Comparison of experimental data and predictions for ethane hydrates formed in solutions of methanol and NaCl. .............................................................. 58
viii
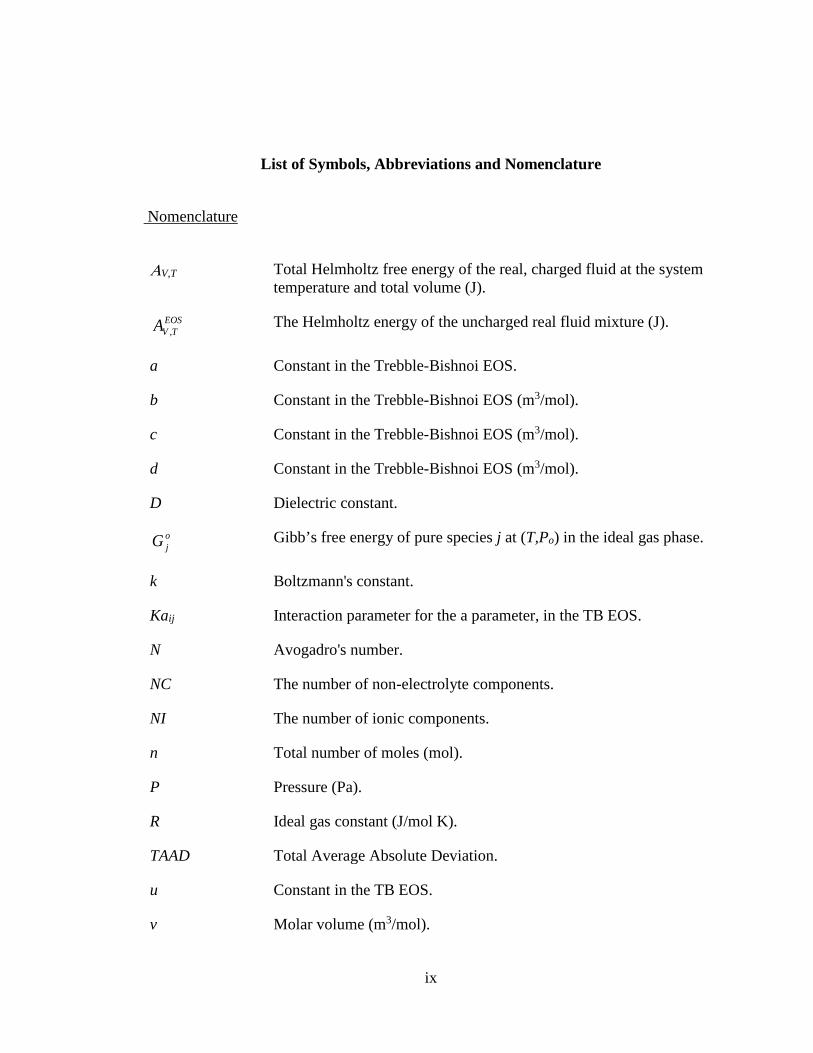
List of Symbols, Abbreviations and Nomenclature
Nomenclature
ΑV,T Total Helmholtz free energy of the real, charged fluid at the system temperature and total volume (J).
EOSTVA ,
The Helmholtz energy of the uncharged real fluid mixture (J).
a Constant in the Trebble-Bishnoi EOS.
b Constant in the Trebble-Bishnoi EOS (m3/mol).
c Constant in the Trebble-Bishnoi EOS (m3/mol).
d Constant in the Trebble-Bishnoi EOS (m3/mol).
D Dielectric constant.
ojG Gibb’s free energy of pure species j at (T,Po) in the ideal gas phase.
k Boltzmann's constant.
Kaij Interaction parameter for the a parameter, in the TB EOS.
N Avogadro's number.
NC The number of non-electrolyte components.
NI The number of ionic components.
n Total number of moles (mol).
P Pressure (Pa).
R Ideal gas constant (J/mol K).
TAAD Total Average Absolute Deviation.
u Constant in the TB EOS.
v Molar volume (m3/mol).
ix
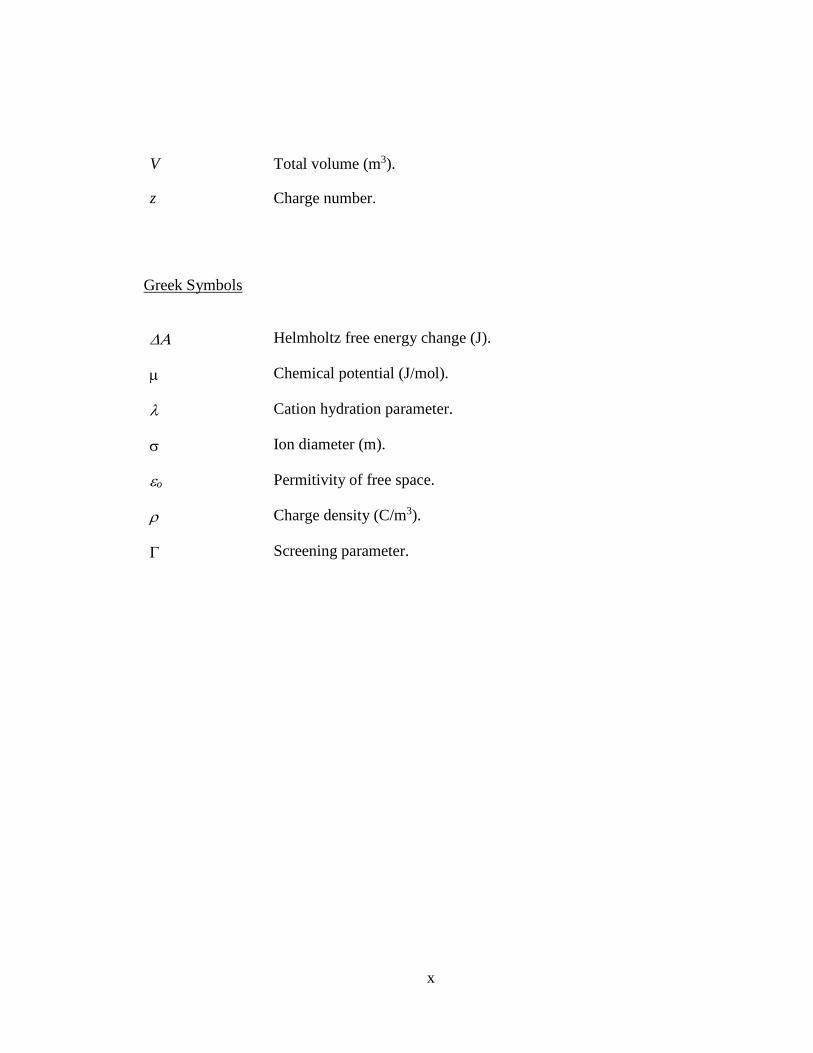
V Total volume (m3).
z Charge number.
Greek Symbols
∆Α Helmholtz free energy change (J).
µ Chemical potential (J/mol).
λ Cation hydration parameter.
σ Ion diameter (m).
εo Permitivity of free space.
ρ Charge density (C/m3).
Γ Screening parameter.
x
Chapter One: Introduction
1.1 Background
In 1811, Sir Humphrey Davy discovered chlorine gas could form a crystalline solid,
known as a clathrate, when contacted with water at the appropriate temperature and
pressure (Sloan and Koh, 2008, p.2). A century later, in 1934, Hammerschmidt
determined that gas hydrates and not traditional ice crystals were the culprit for flow
blockages that were observed in natural gas pipelines (Sloan and Koh, 2008, p.9). These
blockages were observed to completely stop the flow of gas and their presence not only
lead to shut downs but they also presented serious safety issues, which will be addressed
presently. This discovery generated a keen interest within the petroleum industry about
the formation of gas hydrates in pipelines. In the years since 1934, there has been much
experimental and computational research directed towards the determining the conditions
at which gas hydrates form and how to best present their formation in natural gas
pipelines.
Gas hydrates, such as those that were observed by Sir Humphrey Davy and
Hammerschmidt, are ice-like crystalline solids that form when certain gas molecules are
contacted with water at elevated pressures and low temperatures. Upon contact with
water, the gas molecules become trapped inside an inter-connected network of hydrogen-
bonded water molecules (Sloan and Koh, 2008, p.1). Whether or not a gas can form a gas
hydrate is strongly dependent upon the size of the molecule. The following compounds
are the most commonly encountered hydrate forming gases:
1
• Methane
• Ethane
• Propane
• Butane
• Iso-butane
• Hexane
• Carbon dioxide
• Hydrogen sulphide
• Nitrogen
Gas hydrates are particularly problematic in the petroleum industry because the
operating conditions inside petroleum wells, subsea transfer lines, risers and pipelines
commonly fall within the hydrate stability limits. When a hydrate plug forms in any of
the aforementioned spots, it can cause serious financial and economic issues. A hydrate
plug that forms in the pipeline can lead to a disruption in the gas production until the
plugs are removed from the pipeline. In order to remove the blockage of the gas hydrate a
major operational shutdown is required, this causes a significant financial loss to the
production budget (Sloan and Koh, 2008,p.19-20 and p.643-679). Safety hazards caused
by hydrate plugs can include explosions, which can lead to injuries, destruction of
equipment and possibly death (Canadian Association of Petroleum Producers, 2013;Sloan
and Koh, 2008,p.677). If the plugs are not remediated correctly during the
depressurization stage, hydrate plugs can move swiftly and thereby cause a rapid
2
compression of the gas downstream. This phenomenon can raise the downstream pressure
to an extremely dangerous level leading to possible rupture or a serious accident (Sloan
and Koh, 2008 p.643-679).
For oil and gas production operations in which the possibility of gas hydrate
formation exists, methanol is used extensively as a thermodynamic inhibitor to prevent
gas hydrate formation. Unfortunately, methanol being an expensive inhibitor, costs
companies approximately 1% of their gross revenue or amounting to 5% to 8% of their
total plant cost (Sloan, 1991). For example, Sloan and Koh (Sloan and Koh, 2008,p.657)
reported that, on a certain drilling rig in the Gulf of Mexico, the total cost for injecting
methanol over a 16 day period was approximately US $1 Million. In the case of off-shore
drilling, seawater (or brine) may also be produced along with the natural gas. Like
methanol, the salt that is dissolved in the brine will also thermodynamically inhibit gas
hydrate formation. Thus, having information on the inhibiting effect of the mixed
solution of methanol and NaCl can allow operators to fine tune the amount of methanol
that needs to be added to a given stream.
In addition to being a problem for petroleum producers, gas hydrates are also seen by
some as a potential energy resource for the future. Methane hydrates (sI) are commonly
found in deep ocean sediments and in the permafrost area of the Artic region and they are
known to represent an immense hydrocarbon resource (Sloan and Koh, 2008, p.537-629).
While these deposits may one day become important sources of energy for the world,
scientific and engineering research still needs to be undertaken to make their production
3
feasible. Presently they are at best a sub-economic resource, but realization of even a
small part of their potential would provide a very significant new source of natural gas to
meet future energy requirements. Further discussion of gas hydrates as an energy source
does not fall within the scope of this thesis but interested readers can find a detailed
discussion of this area in the works of Kumar et al. (2010, 2013).
Finally, another potential application for gas hydrates is in the field of carbon
sequestration. On May 2, 2012, the United States’ Department of Energy announced
(USDOE, 2012) that they and several partners had successfully completed a month long
“proof-of-concept” test in which a mixture of carbon dioxide and nitrogen was injected
into a naturally occurring gas hydrate deposit in order to promote the production of
methane. In the scheme that was tested by the USDOE, a replacement reaction occurs in
which a methane molecule is freed at the expense of a CO2 molecule becoming trapped in
the hydrate structure (Ohgaki et al., 1996). The methane that is displaced, by the CO2,
from the hydrate formation can then be recovered and utilized. This idea of combining
methane recovery, from naturally occurring hydrates, with CO2 sequestration (Ohgaki et
al., 1996) offers several advantages: presenting a possible CO2 sink, reducing the amount
of water produced during gas production from naturally occurring gas hydrate deposits
and maintaining the geomechanical stability of the hydrate deposit. For further discussion
on using gas hydrates as a potential carbon sequestration medium, interested readers can
consult Giraldo et al. (2013).
4
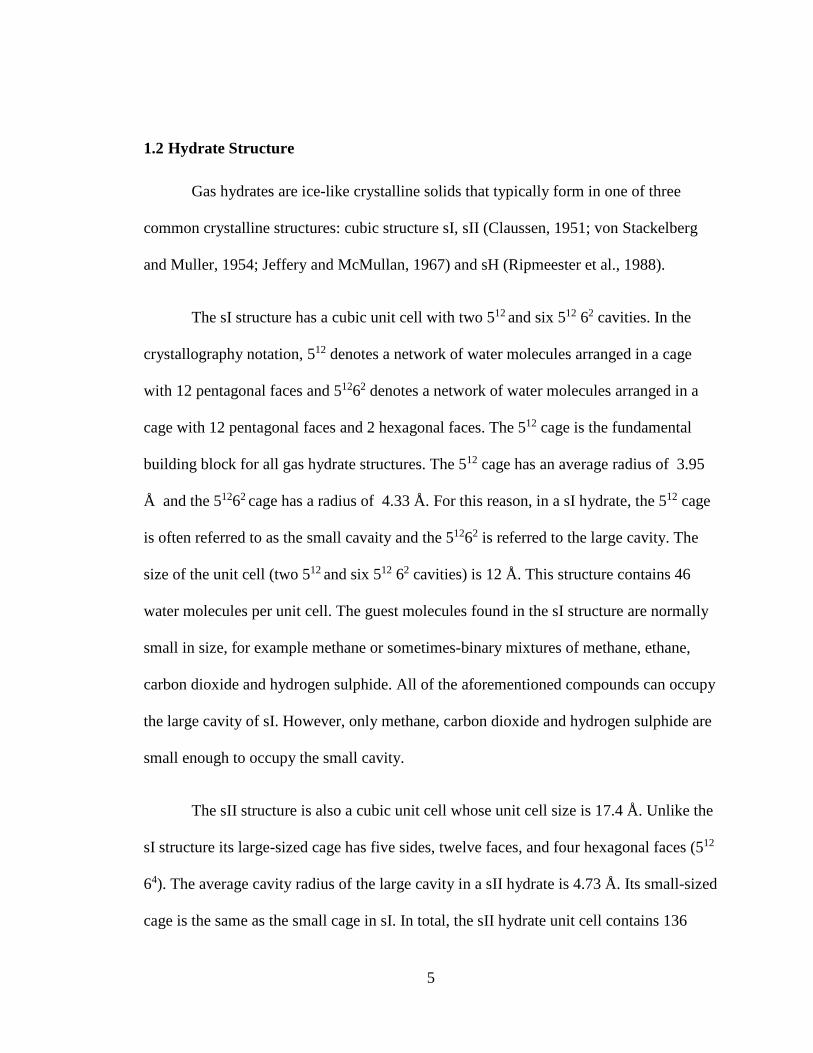
1.2 Hydrate Structure
Gas hydrates are ice-like crystalline solids that typically form in one of three
common crystalline structures: cubic structure sI, sII (Claussen, 1951; von Stackelberg
and Muller, 1954; Jeffery and McMullan, 1967) and sH (Ripmeester et al., 1988).
The sI structure has a cubic unit cell with two 512 and six 512 62 cavities. In the
crystallography notation, 512 denotes a network of water molecules arranged in a cage
with 12 pentagonal faces and 51262 denotes a network of water molecules arranged in a
cage with 12 pentagonal faces and 2 hexagonal faces. The 512 cage is the fundamental
building block for all gas hydrate structures. The 512 cage has an average radius of 3.95
Å and the 51262 cage has a radius of 4.33 Å. For this reason, in a sI hydrate, the 512 cage
is often referred to as the small cavaity and the 51262 is referred to the large cavity. The
size of the unit cell (two 512 and six 512 62 cavities) is 12 Å. This structure contains 46
water molecules per unit cell. The guest molecules found in the sI structure are normally
small in size, for example methane or sometimes-binary mixtures of methane, ethane,
carbon dioxide and hydrogen sulphide. All of the aforementioned compounds can occupy
the large cavity of sI. However, only methane, carbon dioxide and hydrogen sulphide are
small enough to occupy the small cavity.
The sII structure is also a cubic unit cell whose unit cell size is 17.4 Å. Unlike the
sI structure its large-sized cage has five sides, twelve faces, and four hexagonal faces (512
64). The average cavity radius of the large cavity in a sII hydrate is 4.73 Å. Its small-sized
cage is the same as the small cage in sI. In total, the sII hydrate unit cell contains 136
5
water molecules per unit cell. The guest molecules found in structure sII are slightlyly
larger in size than those found in the sI structure and include nitrogen, propane and iso-
butane.
Structure H (sH) is a hexagonal unit cell that has three cavities: 512, 435663 and
51268. It is made up of cavities of three different sizes; (1) a small-sized cavity (512) with
five sides and twelve faces with an average cavity radius of 3.94 Å, (2) a medium-sized
cavity (435663) with four sides, three faces, five sides, six faces and three hexagonal faces
with an average cavity radius of 4.04 Å and (3), a large-sized cavity (51268) with five
sides, twelve faces and eight hexagonal faces with an average cavity radius of 5.79 Å. A
sH hydrate has 34 water molecules per unit cell. Unlike sI and sII, sH requires two guest
molecules in order to form a stable hydrate structure. Compounds that form sH are
relatively large molecules such as iso-pentane and 2,2-dimethylbutane with smaller guest
molecules like methane, hydrogen sulphide and nitrogen. The smaller molecules are often
referred to as helper-gases (Ripmeester et al., 1988). Also, in contrast to sI and sII, the sH
structure is rarely found in nature (Ripmeester et al., 1988). The three common hydrate
structures, sI, sII and sH, are shown in Figure 1.
6
Figure 1.1: Three common structures of gas hydrates (Herriot watt institute of petroleum
engineering, 2013b)
7
1.3 Experimental Studies of Gas Hydrate Thermodynamics
Historically, gas hydrate formation has been one of the most common problems in
natural gas transmission lines. Over the last century gas hydrate research has focused
extensively on obtaining experimental data of equilibrium conditions for hydrates in pure
water systems and in the presence of various inhibitors and thus, much experimental data
has been generated. In this study, the effect of binary mixtures of methanol and sodium
chloride on the hydrate formation conditions of pure carbon dioxide and pure ethane is to
be investigated and thus, to limit the size of this section, the focus will be narrowed to
studies relevant to the present study (i.e. those in which ethane and/or CO2 were used as
the hydrate forming gas).
Within the experimental research that has been conducted into gas hydrate
thermodynamics, over the last century, there has been much interest in the effect of
thermodynamic inhibitors, on the gas hydrate formation conditions. Thermodynamic
inhibitors are compounds that increase the pressure that is required to form gas hydrates,
at a given temperature. The three most well studied types of thermodynamic inhibitors
are alcohols, glycol and electrolytes. Alcohol and glycol substances are soluble in the
aqueous phase, and therefore have strong interactions with water molecules during
hydrogen bonding. In the presence of electrolytes, water becomes less available for
hydrate formation as a result of the coulombic force of attraction between ions and water
molecules in the aqueous phase (Sloan and Koh, P.229-234).
8
In contrast to thermodynamic inhibitors, there is another important class of
inhibitors known as low dosage kinetic inhibitors. Poly (vinyl pyrrolidone) (PVP) and
poly (vinyl caprolactum) (PVCap) are two common examples of kinetic inhibitors. They
differ in function from thermodynamic inhibitors since they decrease the growth rate of
the crystal and/or prevent the agglomeration of the hydrate particles. As such, they are a
time-dependent process (Sloan and Koh, P.659-668). These materials were not
considered in the current study.
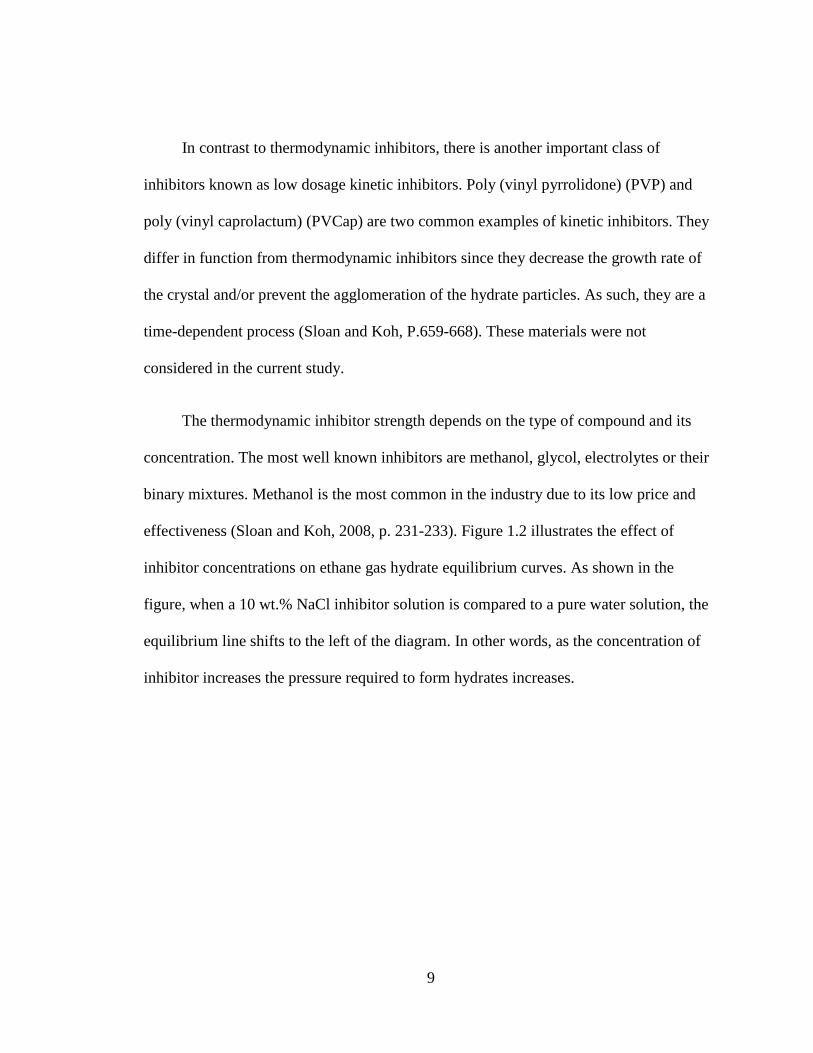
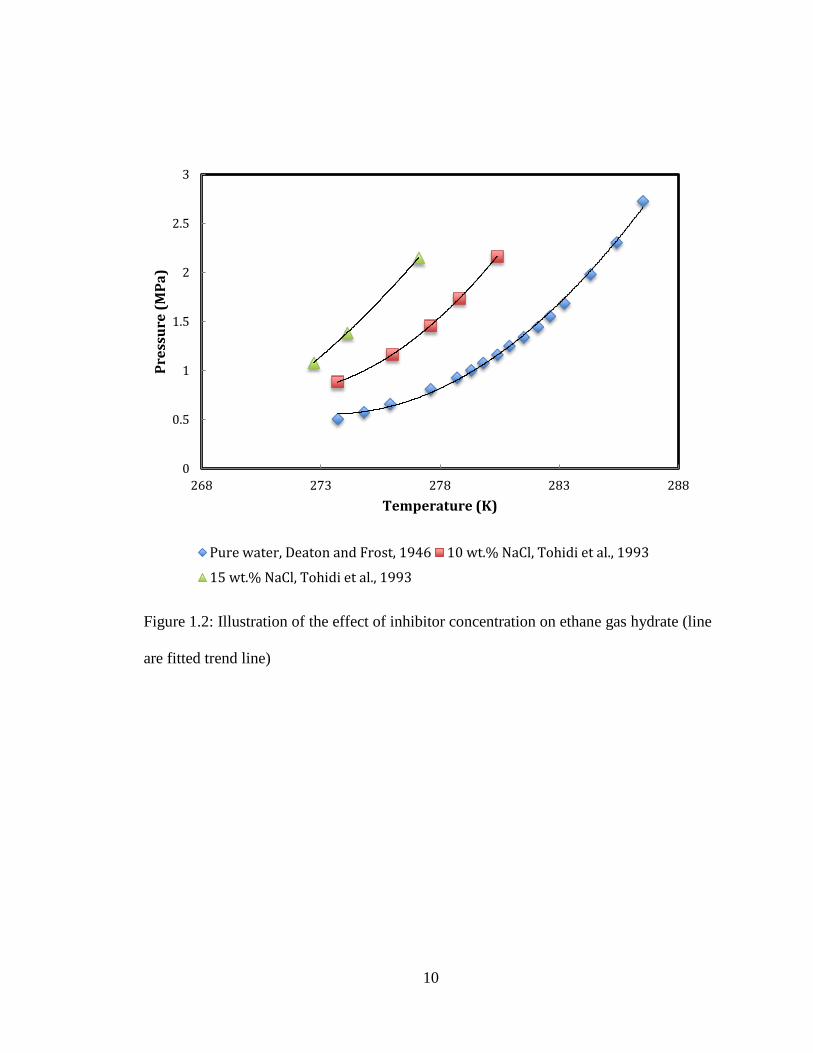
The thermodynamic inhibitor strength depends on the type of compound and its
concentration. The most well known inhibitors are methanol, glycol, electrolytes or their
binary mixtures. Methanol is the most common in the industry due to its low price and
effectiveness (Sloan and Koh, 2008, p. 231-233). Figure 1.2 illustrates the effect of
inhibitor concentrations on ethane gas hydrate equilibrium curves. As shown in the
figure, when a 10 wt.% NaCl inhibitor solution is compared to a pure water solution, the
equilibrium line shifts to the left of the diagram. In other words, as the concentration of
inhibitor increases the pressure required to form hydrates increases.
9
Figure 1.2: Illustration of the effect of inhibitor concentration on ethane gas hydrate (line
are fitted trend line)
0
0.5
1
1.5
2
2.5
3
268 273 278 283 288
Pres
sure
(MPa
)
Temperature (K)
Pure water, Deaton and Frost, 1946 10 wt.% NaCl, Tohidi et al., 1993
15 wt.% NaCl, Tohidi et al., 1993
10
1.3.1 Common experimental techniques
To study the thermodynamics of gas hydrate formation, there are four
experimental approaches that can be employed. The four methods are explained as
follows:
• Temperature search method: In this method, the volume remains constant as the
temperature is gradually reduced, until the onset of the first hydrate particles. After the
initial hydrate particle is formed, the temperature is increased until the hydrate is
completely dissociated. The hydrates are then formed at a temperature that’s not as low as
the initial temperature after which, the hydrates are decomposed at a temperature that’s
not as high as in the first decomposition step. This procedure is repeated until the
difference between the formation and dissociation temperature is within a prescribed
limit. This method is rarely used anymore (Sloan and Koh, 2008, p.331).
• Pressure search method: In this method, the temperature is maintained constant as
pressure is varied, usually by way of varying the volume. During the experiment the
pressure is increased beyond the expected equilibrium point while the temperature
remains constant. Consequently, at these conditions the hydrate will be formed.
Subsequently, the pressure is decreased gradually until the hydrates are completely
dissociated. This procedure is repeated to until the difference between the formation and
dissociation pressure are within a prescribed limit. This is the technique used in the
current study.
• Isochoric method: This technique involves decreasing the system’s temperature at a
constant volume until the hydrate is formed. Once hydrates have been formed, the
11
temperature is gradually increased to dissociate the hydrates. This method is the most
suitable technique for high-pressure hydrate formation systems (Sloan and Koh, 2008,
p.331).
• Differential Scanning Calorimeter (DSC): This technique is used to determine the hydrate
dissociation temperature at constant pressure. It consists of two cells, one cell containing
the sample and the other cell works as a reference, which are both subject to the same
amount of heat. The Differential Scanning Calorimeter requires only a small amount of
aqueous solutions to run the experiment. The temperature is reduced until the hydrate is
formed. Thereafter, the temperature is increased gradually at a low scanning rate to
evaluate the melting point temperature. The melting point temperature is eventually
estimated when all hydrates are completely dissociated (Setaram instrumentation, 2013:
Patrick et al., 2012).
1.3.2 Experimental studies of carbon dioxide and ethane hydrate thermodynamics
Numerous experimental studies have been conducted over the past decades on
hydrate formation for various gases in a pure water system. Since the current study is
concerned with ethane and carbon dioxide, the following sections will only be concerned
with reviewing works that have been focused on these two compounds. A thorough
compendium of experimental data related gas hydrate thermodynamics, for systems
containing gases other than ethane and carbon dioxide, can be found in the book by Sloan
and Koh, 2008.
12
1.3.2.1 Carbon dioxide gas hydrate in a pure water system
In 1946, Deaton and Frost were the first researchers to use an isothermal pressure
search method to determine three-phase equilibrium conditions of pure carbon dioxide
and ethane gas hydrate in a pure water system. In the years that followed, several
researchers would go on to study, similarly, the effects of carbon dioxide gas hydrate
formation: Unruh and Katz (1949); Larson (1955); Chen (1972); and Berecz and Balla-
Achs (1983). Robinson and Mehta (1971) studied the hydrate formation conditions for
pure carbon dioxide, pure propane and their mixtures in a water system. Unlike most of
the previous researchers, Robinson and Mehta (1971) used a temperature search method
to determine three-phase equilibrium for pure gases and four-phase equilibrium for gas
mixtures. It was found that the maximum formation temperature of hydrates for the
carbon dioxide and propane mixture is higher than the formation temperature for either
pure carbon dioxide or pure propane.
Adisasmito et al. (1991) presented the hydrate equilibrium conditions for pure
carbon dioxide, pure methane and their mixtures in a pure water system. The technique
used in the experiment was the same as the one used by Robinson and Mehta (1971)—the
temperature search method. In performing their experiments, Adisasmito et al. (1991) had
the intention of resolving discrepancies in the previous experimental observations of
Berecz and Balla-Achs (1983) and Unruh and Katz (1949). However, their results were
seen to closely agree with those of Unruh and Katz and they concluded that the
discrepancies may have been due to impurities in the experimental gas used by Berecz
and Balla-Achs.
13
In a subsequent study, Adisasmito and Sloan (1992) also determined the three-phase
equilibrium conditions of carbon dioxide hydrate in a pure water system. Further data for
hydrate equilibrium conditions were obtained for binary systems that contained methane,
ethane, propane, isobutene and normal butane with carbon dioxide. The obtained results
for carbon dioxide from Adisasmito’s 1992 experiments matched the data obtained by
Unruh and Katz (1949) and Robinson and Mehta (1971). However, like their data from
1991, the results of Adisasmito and Sloan (1992) did not match those published by
Berecz and Balla-Achs (1983).
More recently, Mohammadi et al. (2005) conducted experiments, using the isochoric
method, to determine three-phase equilibrium conditions for methane, carbon dioxide,
carbon monoxide, binary mixtures of carbon monoxide and carbon dioxide, and binary
mixtures of carbon monoxide and propane in a pure water system. It was found that their
results for carbon dioxide in pure water matched well with the previous results of Deaton
and Frost (1946) and Larson (1955).
1.3.2.2 Ethane gas hydrate in a pure water system
Following Hammerschmidt’s observation that the solid plugs formed in pipelines
were from gas hydrates (Hammerschmidt, 1934), Roberts et al. (1940) and Deaton and
Frost published equilibrium data for hydrates formed from pure ethane in pure water.
Their experiments of Roberts et al. (1940) and of Deaton and Frost (1946) were
conducted at temperatures above the freezing point of water. Thirty years later, Falabella
and Vanpee (1974) conducted a study using pure ethane and methane in pure water in
14
which hydrate formation occurred below the freezing point of water. The hydrate that
was formed from the reaction with pure methane and ethane gas occurred below 1 atm
(absolute pressure). It was observed that Deaton and Frost’s (1946) equilibrium curves
for ethane, when extrapolated to 1 atm, were in agreement with these results.
Holder and Grigoriou (1980) used pure ethane, and three binary mixtures of methane
and ethane at different compositions, to determine the equilibrium hydrate conditions in a
pure water system. While their results for ethane hydrates in pure water were in good
agreement with the previous studies of Roberts et al. (1940) and Deaton and Frost (1946),
it was observed that for some of the binary mixtures there was a range of
temperature/pressure conditions at which the formation pressure for the mixture was less
than that for pure ethane. Holder and Hand (1982) conducted experiments to estimate the
three-phase equilibrium conditions of pure ethane, binary mixtures of ethane and
propane, and ternary mixtures of methane, ethane and propane in a pure water system and
their structures. The binary mixture of ethane and propane and ternary mixtures of
methane, ethane and propane were found to form either sI or sII hydrates, depending
upon conditions. The temperature search method was used in both of the aforementioned
studies.
When all of the experimental results for pure ethane hydrate in pure water are
compared with those of pure carbon dioxide hydrate in pure water, what can be observed
is that there is much better agreement between data sets when ethane hydrates are formed
as compared to when carbon dioxide hydrates are formed.
15
1.3.2.3 Carbon dioxide gas hydrate in the presence of inhibitors
In addition to being formed in pure water, several research groups have studied the
effect of various thermodynamic inhibitors on the formation conditions for gas hydrates
formed from carbon dioxide. Hydrate formation conditions for methane, ethane, propane,
carbon dioxide and hydrogen sulphide in the presence of methanol were studied by Ng
and Robinson (1985). It was observed that, for a given temperature, an increase in the
inhibitor concentration increased the pressure needed for gas hydrate formation. Ng and
Robinson (1985) did not attempt to provide an explanation for the inhibitor effect.
Robinson and Ng (1986) subsequently made further measurements of the equilibrium
conditions of carbon dioxide in the presence of methanol, which agreed with their
previous results. No attempts to offer an explanation for the inhibitor effect were offered
in this article, either.
In 1993, the isothermal pressure search method was applied by Dholabhai et al., to
determine the three-phase equilibrium conditions of carbon dioxide gas hydrate in the
presence of pure water, pure salts solutions (NaCl, KCl, CaCl2), and aqueous solutions of
binary salts, with various concentrations ranging from 3 wt. % to 20 wt. %. The
equilibrium data for carbon dioxide hydrate formation in pure water, agreed with the data
produced in the experiments conducted by Robinson and Mehta (1971), Ng and Robinson
(1985), Deaton and Frost (1946) and Adisasmito et al., (1991). However, the data
obtained by Dholabhai et al. (1993) did not agree with some of the results obtained by
Larson (1955) and Chen (1972). Dholabhai et al. (1993) did not offer any ideas to explain
the disagreement. Subsequently, Dholabhai and Bishnoi (1994) determined the three-
16
phase equilibrium of carbon dioxide and methane binary mixtures in the presence of
electrolyte inhibitors. The ionic salts (NaCl, KCl, CaCl2) were used as inhibitors with
mixtures of varying concentrations. The inhibition effects of NaCl and CaCl2 were
observed to be similar regardless of the relative concentrations of the two salts (10
wt.%NaCl+5 wt.%CaCl2), or (5 wt.%NaCl+10 wt.%CaCl2).
Englezos and Hall (1994) presented data on hydrate equilibrium conditions of carbon
dioxide in a pure water system, polymer (polyethylene oxide and hydrolyzed
polyacrylamide) and electrolytes (NaCl and CaCl). The results obtained for carbon
dioxide in pure water were almost identical to the experimental data obtained by Deaton
and Frost (1946), Larson (1955), Unruh and Katz (1949) and Robinson and Mehta
(1971). It was observed that the electrolytes had a much stronger inhibiting effect, on
hydrate formation, than the polymer. Englezos and Hall (1994) also made an attempt at
correlating their data by employing an activity coefficient model to describe the liquid
phase. Their modeling results were in reasonable agreement with their experimental
results.
Breland and Englezos (1996) used a pressure search method to determine the
equilibrium conditions of carbon dioxide hydrate formation in a pure water system and in
an aqueous glycerol solution. The results produced when carbon dioxide was in the
presence of pure water were a match to those published by Englezos and Hall (1994).
Their experiments in the presence of aqueous glycerol concluded that glycerol was an
effective inhibitor, although it was not as effective as sodium chloride and methanol.
17
Dholabhai et al. (1996) used pure methanol and binary mixtures of methanol and
salts, at various concentrations of 5 wt.% to15 wt.% to determine carbon dioxide’s
hydrate equilibrium conditions. The binary mixtures were methanol, NaCl, K, and CaCl2.
There were several inconsistencies in the results for carbon dioxide hydrates in the
presence of methanol when compared to those published by Ng and Robinson (1985). In
the presence of methanol, the data of Dholabhai et al. (1996) indicate that NaCl had a
greater inhibition power than CaCl2, whereas in the absence of methanol CaCl2 had a
greater inhibition power than NaCl. The authors made no attempt to explain the
difference in their results vereus those of Ng and Robinson (1985).
Dholabhai et al. (1997) repeated their previous experiments as part of a study to
determine the equilibrium conditions for carbon dioxide and methane binary mixtures in
the presence of methanol, electrolytes, ethylene glycol and their binary and ternary
mixtures with methanol and ethylene glycol. It was concluded that electrolytes with
methanol were more effective than ethylene glycol with electrolytes.
Fan and Guo (1999) studied the phase equilibrium conditions of pure carbon dioxide
and carbon dioxide-rich binary mixtures in pure water and aqueous NaCl. The carbon
dioxide-rich binary mixtures were derived from CO2 + CH4, CO2 + C2H6 and CO2 + N2
and a four-component gas mixture CO2 + CH4 + C2H6 + N2. It was observed that there
was good agreement between the results obtained for carbon dioxide in pure water and
those published by Larson (1955), Robinson and Mehta (1971) and Ng and Robinson
(1985). Subsequently, Fan et al. (2000) conducted experiments using the same hydrate
18
forming gases, but replaced the sodium chloride inhibitor with ethylene glycol.
Experiments were also conducted to determine the hydrate conditions for pure carbon
dioxide in the presence of pure water, ethylene glycol and methanol. It was discovered
that the results of carbon dioxide in a pure water matched well with the data of Robinson
and Mehta (1971). Moreover, the data matched well with those produced by carbon
dioxide in the presence of methanol and those published by Dholabhai et al. (1996) but
not those of Ng and Robinson (1985).
Majumdar et al., (2000) determined the incipient hydrate equilibrium conditions for
pure hydrogen sulfide and carbon dioxide in the presence of ethylene glycol, sodium
chloride and their binary mixtures. Experiments were also conducted to determine the
hydrate equilibrium conditions for ethane in the presence of ethylene glycol. The
conditions for this experiment included temperature and pressure ranges of 264K-290K
and 0.23-3.18 MPa respectively. It was found that sodium chloride had a stronger
inhibiting strength than ethylene glycol.
Mooijer et al. (2001) determined four phase hydrate-vapour-water rich liquid-
hydrocarbon liquid (H-V-Lw-Lc) equilibrium conditions for carbon dioxide in a pure
water system, tetrahydrophyran, cyclobytane, cyclohexane and methylcyclohexane
inhibitors. The results for pure carbon dioxide in a pure water system matched the data
published by Deaton and Frost (1946) and Adisasmito et al. (1991). It was found that a
carbon dioxide gas hydrate in the presence of tetrahydrophyran, cyclobytane, and
19
cyclohexane formed at a lower equilibrium pressure. However, in the presence of
methylcyclohexane there was no observable change to the hydrate equilibrium pressure.
Afzal et al. (2007) used the isochoric method to determine the hydrate dissociation
conditions for both carbon dioxide and methane hydrates in the presence of various
amounts of triethylene glycol. It was found that methanol had a stronger inhibiting effect
on carbon dioxide hydrate formation than triethylene glycol and that sodium chloride had
a stronger inhibiting effect on carbon dioxide hydrate formation than triethylene glycol.
Afzal et al. (2008) also determined the equilibrium dissociation data for methane, ethane,
propane and carbon dioxide in the presence of deiethylene glycol with various
concentrations. The results indicated that methanol had stronger inhibiting effects on
carbon dioxide hydrate formation than deiethylene glycol and that sodium chloride also
had a stronger inhibiting effect on carbon dioxide hydrate formation than deiethylene
glycol.
The equilibrium dissociation conditions for methane, ethane, propane and carbon
dioxide were determined in the presence of single salts (NaCl, KCl and CaCl2) by
Mohammadi et al. (2008 a). The isochoric method was used in this study and the results
of propane and carbon dioxide closely matched with most of the data that was compiled
by Sloan and Koh (2008). However, the results of Mohammadi et al. (2008a) did exhibit
less than perfect agreement with the results of and Dholabhai et al. (1993) for CO2
hydrates in both pure water and in aqueous sodium chloride.
20
Maekawa (2010) carried out experiments to determine the hydrate equilibrium
conditions for carbon dioxide in the presence of aqueous methanol, ethanol, ethylene
glycol, diethylene glycol, triethylene glycol and glycerol, using isochoric method. It was
found that the inhibition power was (in ascending order) as follows: triethylene glycol,
diethylene glycol, glycerol, ethylene glycol, ethanol, methanol. The results of Maekawa
(2010), for CO2 hydrates in both pure water and in methanol, were seen to be in
disagreement with the results of Ng and Robinson (1985) and with those of Afzal et al.
(2007).
Tumba et al. (2011) used the isochoric search method to determine the hydrate
equilibrium dissociation condition for carbon dioxide and methane in the presence of
pure water and tributylmethylphosphonium methylsulfate an ionic liquid. Their results
for carbon dioxide hydrate formation in pure water matched closely with the data found
in the literature by Fan at el. (2000). The isochoric pressure search method was used by
Mohammadi and Richon (2012) to measure the equilibrium hydrate conditions for pure
hydrogen sulfide and pure carbon dioxide in the presence of methanol, (MeOH+NaCl),
and (ethylene glycol+NaCl) aqueous solutions. The results obtained for carbon dioxide in
the presence of (MeOH+ NaCl) and (ethylene glycol+NaCl) were compared with the data
published by Mohammadi et al. (2005), Mooijer et al. (2001) and Adisasmito et al.,
(1991) in a pure water system to show the inhibition effect. The values obtained for
carbon dioxide in the presence of methanol showed varying levels of disagreement with
data from Ng and Robinson (1983), Mooijer et al. (2001) and with the data of
Mohammadi et al. (2005).
21
Sami et al. (2013) used the isochoric method to determine the three-phase equilibrium
conditions for pure carbon dioxide and methane hydrate in the presence of (MgCl2+
MeOH) and (MgCl2+ ethylene glycol). The results indicated that the system containing
(MgCl2+ MeOH) has a stronger inhibition property than (MgCl2+ ethylene glycol) at
equal concentrations.
Finally, Najibi et al. (2013) used the isochoric search method to determine hydrate
equilibrium conditions for carbon dioxide in the presence of binary mixtures of methanol
and ethylene glycol, with single electrolyte (methanol+ CaCl2, methanol+ KCl, ethylene
glycol+CaCl2 and ethylene glycol+KCl) aqueous solutions. Najibi et al. (2013) did not
compare their data to any previously obtained experimental data. However, they did
make an attempt to correlate their experimental data using an activity coefficient model
to describe the liquid phase. Their results were reasonable at low salt concentrations.
However, their predictions were poor at higher salt concentrations.
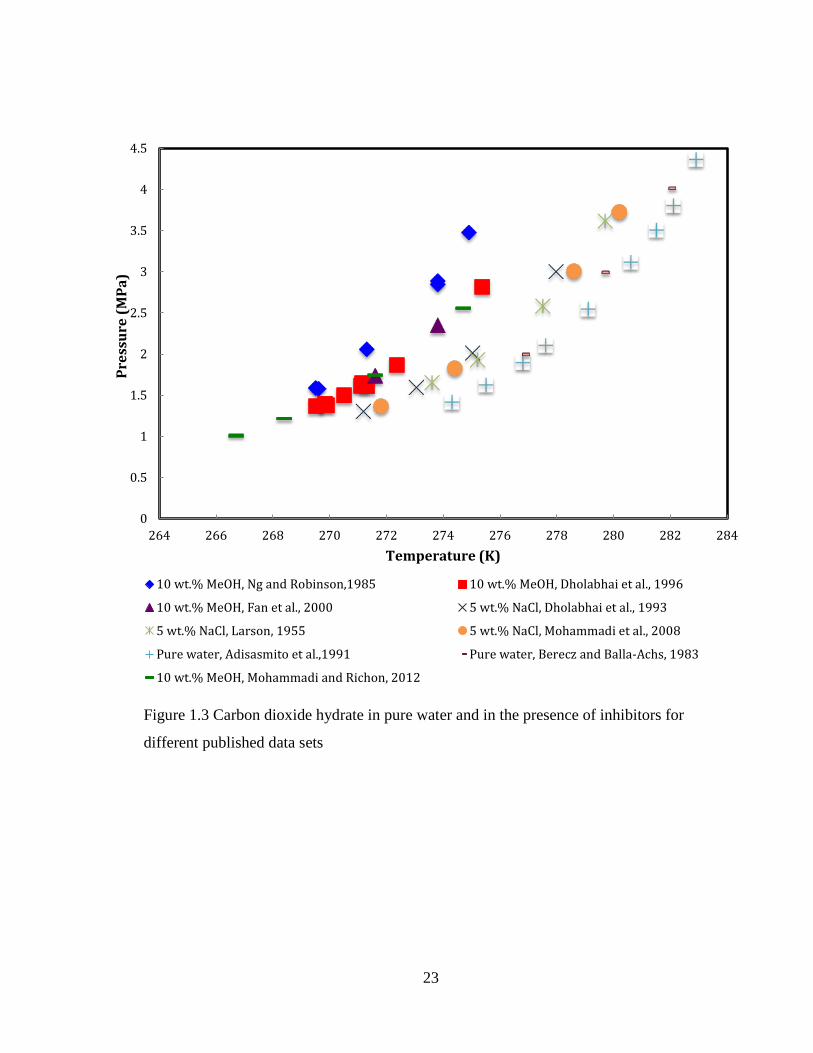
From the studies outlined in the above section, it can be seen from Figure 1.3
a disagreement between data sets when carbon dioxide hydrates are formed in the
presence of either pure or mixed thermodynamic inhibitor solutions, it is common to see
disagreement between data sets.
22
Figure 1.3 Carbon dioxide hydrate in pure water and in the presence of inhibitors for
different published data sets
0
0.5
1
1.5
2
2.5
3
3.5
4
4.5
264 266 268 270 272 274 276 278 280 282 284
Pres
sure
(MPa
)
Temperature (K)
10 wt.% MeOH, Ng and Robinson,1985 10 wt.% MeOH, Dholabhai et al., 1996
10 wt.% MeOH, Fan et al., 2000 5 wt.% NaCl, Dholabhai et al., 1993
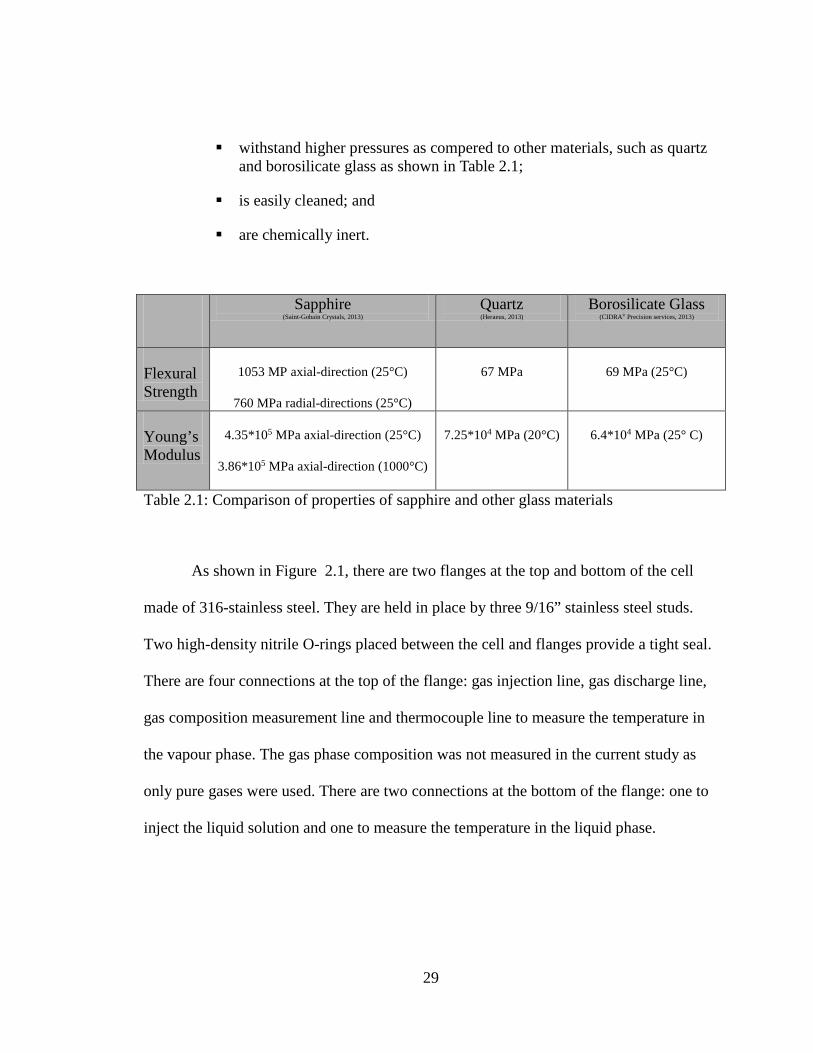
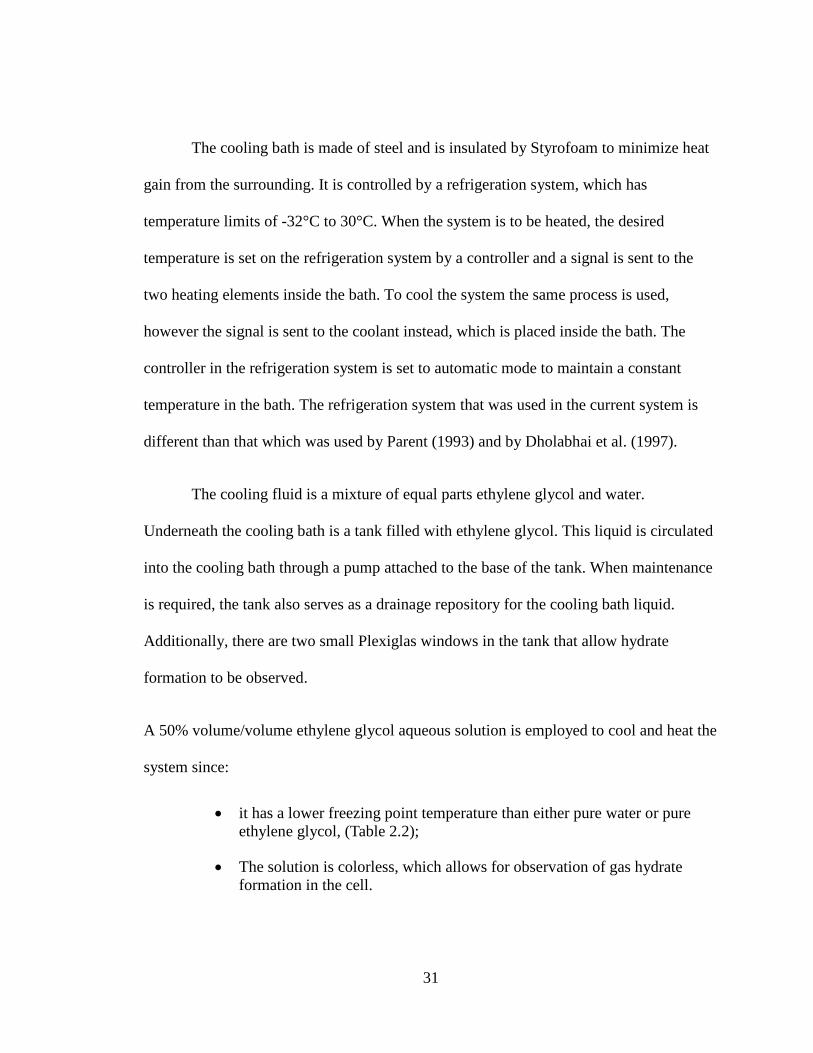
Table 2.1: Comparison of properties of sapphire and other glass materials
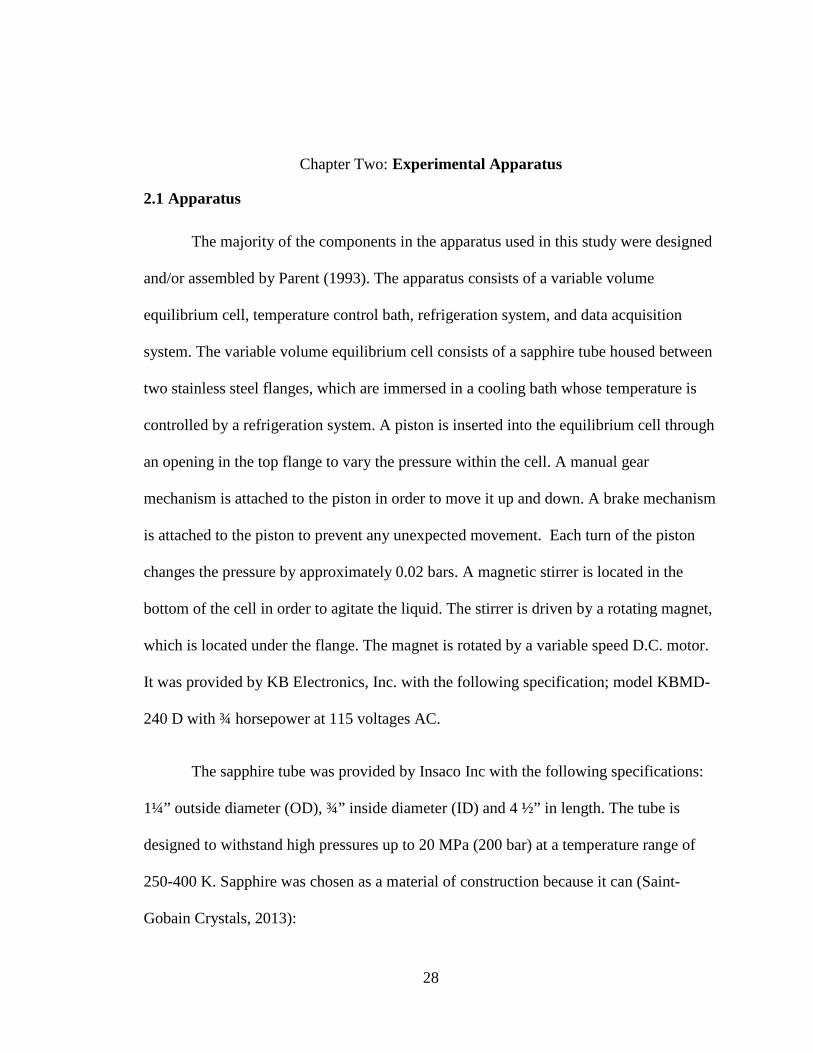
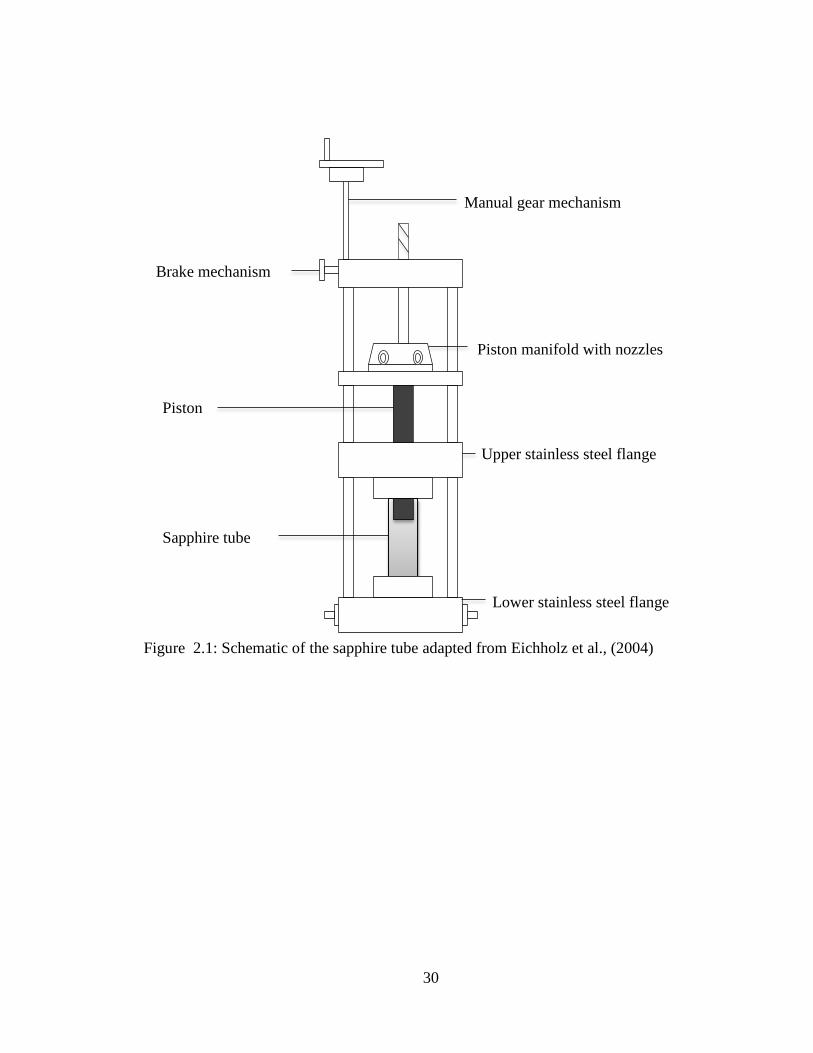
As shown in Figure 2.1, there are two flanges at the top and bottom of the cell
made of 316-stainless steel. They are held in place by three 9/16” stainless steel studs.
Two high-density nitrile O-rings placed between the cell and flanges provide a tight seal.
There are four connections at the top of the flange: gas injection line, gas discharge line,
gas composition measurement line and thermocouple line to measure the temperature in
the vapour phase. The gas phase composition was not measured in the current study as
only pure gases were used. There are two connections at the bottom of the flange: one to
inject the liquid solution and one to measure the temperature in the liquid phase.
29
Figure 2.1: Schematic of the sapphire tube adapted from Eichholz et al., (2004)
Piston manifold with nozzles
Manual gear mechanism
Piston
Brake mechanism
Upper stainless steel flange
Sapphire tube
Lower stainless steel flange
30
The cooling bath is made of steel and is insulated by Styrofoam to minimize heat
gain from the surrounding. It is controlled by a refrigeration system, which has
temperature limits of -32°C to 30°C. When the system is to be heated, the desired
temperature is set on the refrigeration system by a controller and a signal is sent to the
two heating elements inside the bath. To cool the system the same process is used,
however the signal is sent to the coolant instead, which is placed inside the bath. The
controller in the refrigeration system is set to automatic mode to maintain a constant
temperature in the bath. The refrigeration system that was used in the current system is
different than that which was used by Parent (1993) and by Dholabhai et al. (1997).
The cooling fluid is a mixture of equal parts ethylene glycol and water.
Underneath the cooling bath is a tank filled with ethylene glycol. This liquid is circulated
into the cooling bath through a pump attached to the base of the tank. When maintenance
is required, the tank also serves as a drainage repository for the cooling bath liquid.
Additionally, there are two small Plexiglas windows in the tank that allow hydrate
formation to be observed.
A 50% volume/volume ethylene glycol aqueous solution is employed to cool and heat the
system since:
• it has a lower freezing point temperature than either pure water or pure ethylene glycol, (Table 2.2);
• The solution is colorless, which allows for observation of gas hydrate formation in the cell.
31
Pure Ethylene Glycol
(MeGlobal, 2013) Pure Water (The Engineering Tool Box, 2013a)
50/50, volume basis, Ethylene Glycol/Water (The Engineering Tool Box, 2013b)
Freezing Point (°C)
-13°C 0 °C -37 °C
Viscosity at 4.4°C (Pa⋅s)
0.048 Pa.s 1.6 Pa.s 0.0065 Pa.s
Table 2.2: Physical Properties of ethylene glycol and 50-volume% of ethylene glycol
The cell pressure is measured with a 4-20 mA differential pressure transducer
(model 1151 GP alphaline), provided by Rosemount Inc. It had a span of 11 MPa with an
uncertainty of 0.25% of the full-scale reading. The apparatus also has a Type T
thermocouple (copper/constantan), provided by Thermo Electric Company Inc., that is
capable of measuring temperature from -200°C to 370°C at an accuracy of ± 0.5 °C of
temperature. The Type T thermocouple is chosen over the J thermocouple because the
latter has an iron lead that would corrode in salt solutions.
The measurements taken from both the T thermocouple and the differential
pressure transducer are transferred to and stored in a computer via a data acquisition
system made up of a National Instruments PCI-6023E data-acquisition card and a data
acquisition program that was written in Lab View® software provided by National
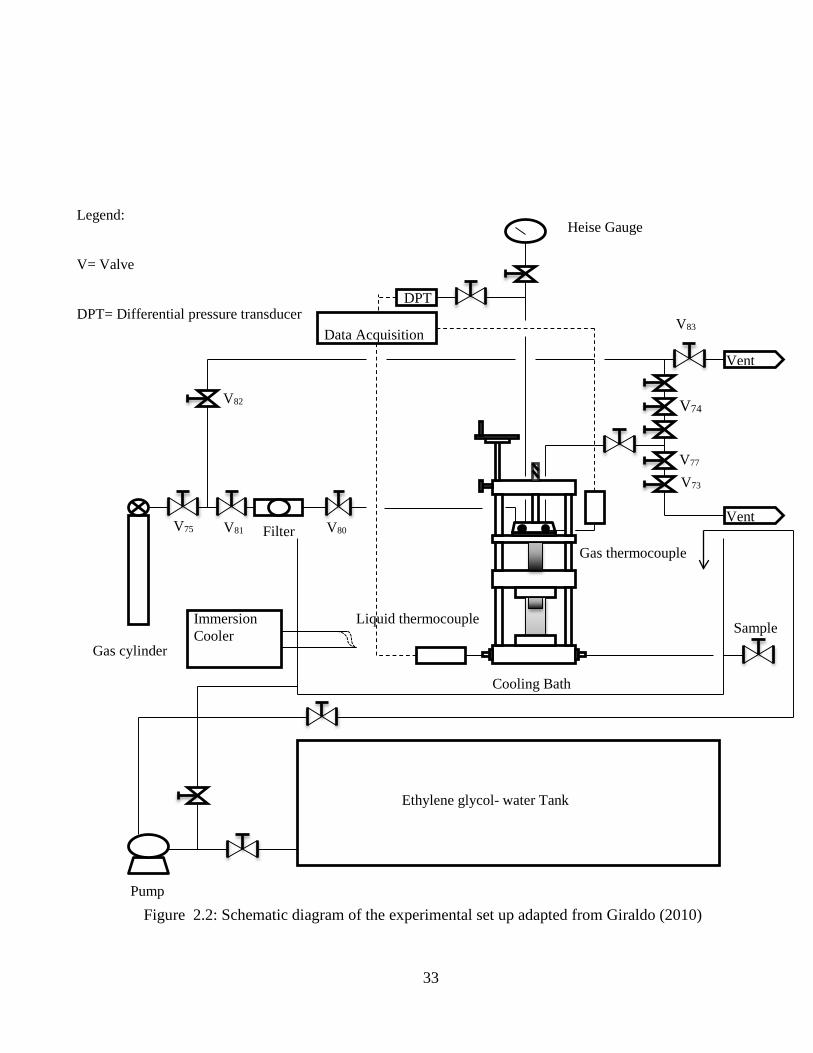
Instruments. Figure 2.2 illustrates a schematic diagram of the experimental set up.
32
Figure 2.2: Schematic diagram of the experimental set up adapted from Giraldo (2010)
V74
V83
V77
V73
Vent
Vent
Sample
Data Acquisition
V82
V75 V81 V80 Filter Gas thermocouple
Liquid thermocouple
Cooling Bath
Immersion Cooler
Gas cylinder
Ethylene glycol- water Tank
Pump
Legend:
V= Valve
DPT= Differential pressure transducer
Heise Gauge
DPT
33
2.2 Material and Solution Preparation
Carbon dioxide CO2 (99.9% manufacture specified purity as per Praxair) and
ethane C2H6 (99.0% manufacture specified purity by provider Praxair) were used in this
experiment. VWR International provided the sodium chloride NaCl (99.9%) and
methanol MeOH (99.8%). De-ionized water with a resistivity of 18.2 MΩ at 25ºC was
produced by using the Millipore Simplicity™ reverse osmosis filter system. It was then
distilled to remove residual contaminants such as NaCl and CaCl2.
In order to prepare the solution, the weight of a 4-ounce clear round glass bottle
was measured with an analytical balance. Next, varying amounts of Nacl and MeOH
were added to the bottle. After both substances were added to the bottle, water was also
introduced to produce a total weight of 100 grams. Six trials were conducted with three
different solution amounts (see Table 2.3).
34
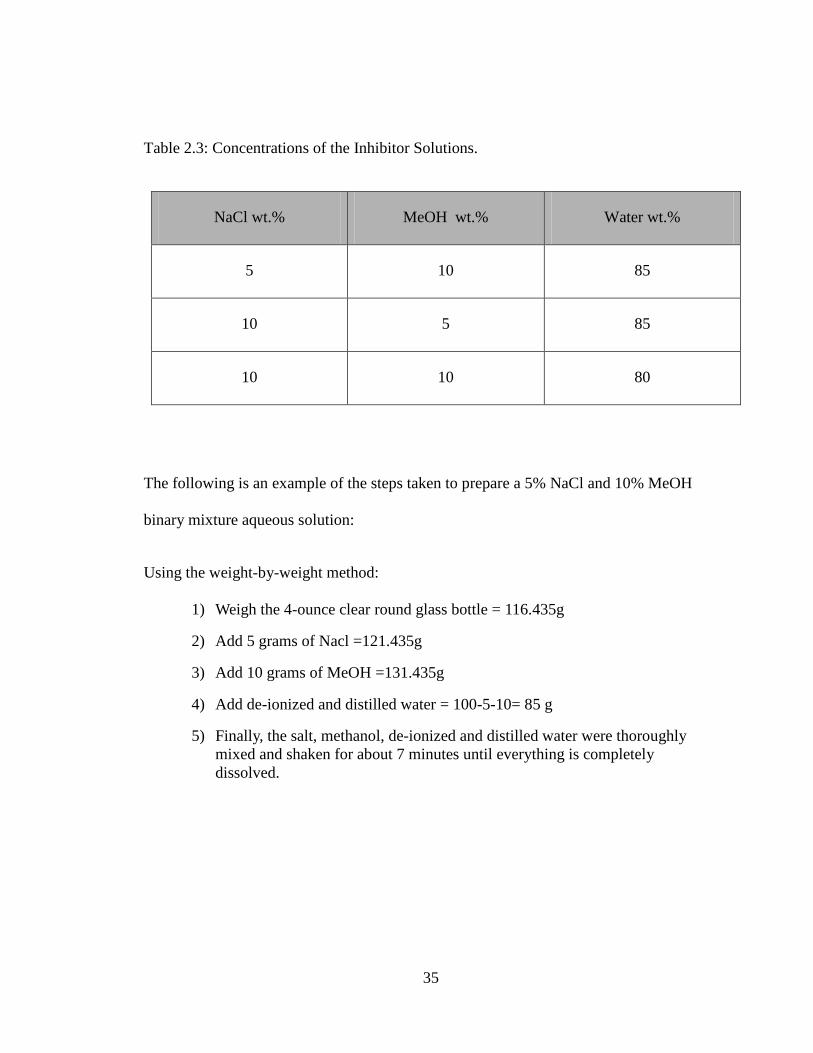
Table 2.3: Concentrations of the Inhibitor Solutions.
The following is an example of the steps taken to prepare a 5% NaCl and 10% MeOH
binary mixture aqueous solution:
Using the weight-by-weight method:
1) Weigh the 4-ounce clear round glass bottle = 116.435g
2) Add 5 grams of Nacl =121.435g
3) Add 10 grams of MeOH =131.435g
4) Add de-ionized and distilled water = 100-5-10= 85 g
5) Finally, the salt, methanol, de-ionized and distilled water were thoroughly mixed and shaken for about 7 minutes until everything is completely dissolved.
NaCl wt.% MeOH wt.% Water wt.%
5 10 85
10 5 85
10 10 80
35
2.3 Experimental procedure
The procedure that was followed was essentially the same as that of Parent (1993),
and it consists of three sections: instrument calibration, leak test and hydrate formation /
decomposition detection.
2.3.1 Instrument calibration
A Chandler Engineering Model 858-155 dead weight tester, supplied by Barber
Engineering, was used to calibrate the differential pressure transducer. It has an accuracy
of 0.1 % of present pressure. The dead weight tester consists of a pressure pump with a
manual gear (generator handle) used to increase or decrease the pressure in the reservoir
cylinder which contained medium oil, a piston table and weight plates. The piston-top
cross-sectional area was loaded many times with weight plates to mimic the required
calibration pressure. Readings were taken and adjusted by fitting a straight line then
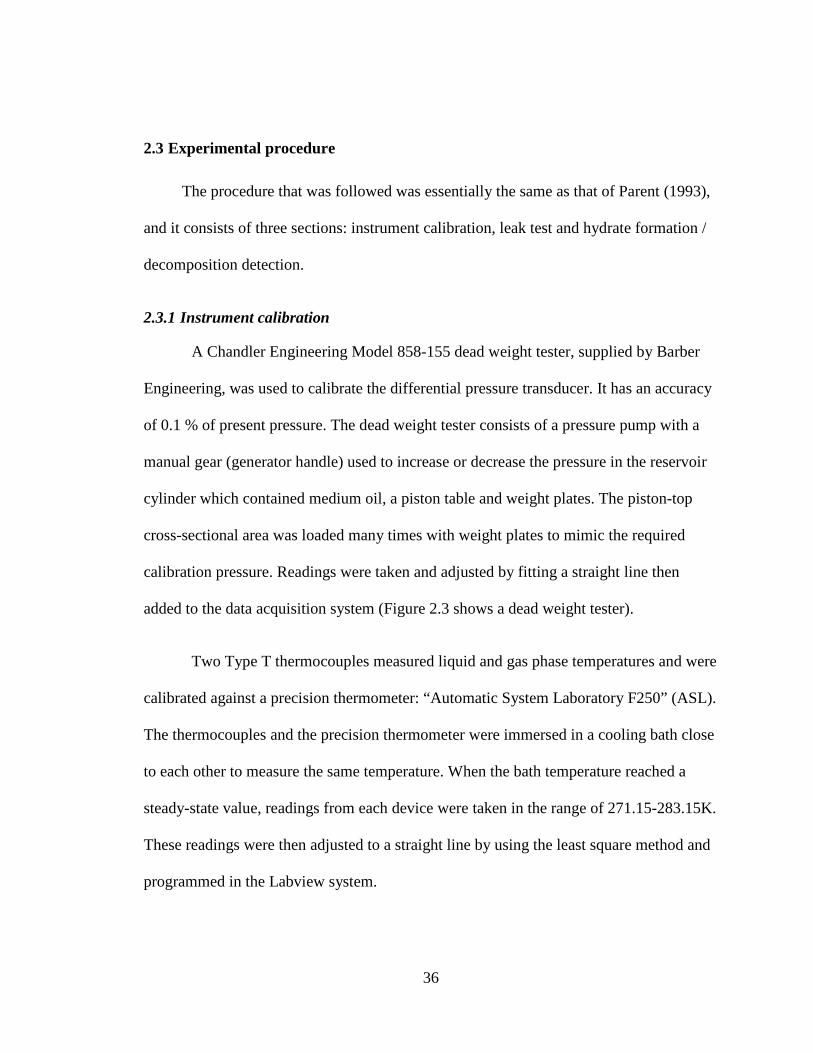
added to the data acquisition system (Figure 2.3 shows a dead weight tester).
Two Type T thermocouples measured liquid and gas phase temperatures and were
calibrated against a precision thermometer: “Automatic System Laboratory F250” (ASL).
The thermocouples and the precision thermometer were immersed in a cooling bath close
to each other to measure the same temperature. When the bath temperature reached a
steady-state value, readings from each device were taken in the range of 271.15-283.15K.
These readings were then adjusted to a straight line by using the least square method and
programmed in the Labview system.
36
Figure 2.3: Chandler Engineering Model 858-155 dead weight tester
37
2.3.2 Leak test
Following the instrument calibration a leak test, using helium was performed. The
cell was subjected to 4500 kPa for a period of 24 hours to determine whether any leak
sites were present. Helium was used because its small molecules help detect even the
smallest leaks in the apparatus. Since the pressure stayed constant, the leak test proved
negative. After that, the experiment could be conducted. Leak tests were performed after
any instances in which the apparatus is opened.
2.3.3 Hydrate formation / decomposition procedure
Each experimental run consisted of several steps. First, a syringe was used to
inject 15 ml of distilled and de-ionized water into the cell to rinse out any impurities.
Then the cell was flushed with the experimental gas. Next, 15 ml of hydrate inhibitor
solution (aqueous sodium chloride NaCl and methanol MeOH) was used to again rinse
the cell. Then, the cell was flushed a second time with the experimental gas. After both
rinsing and flushing have occurred, the cell was charged with 15 ml of hydrate inhibitor
solution.
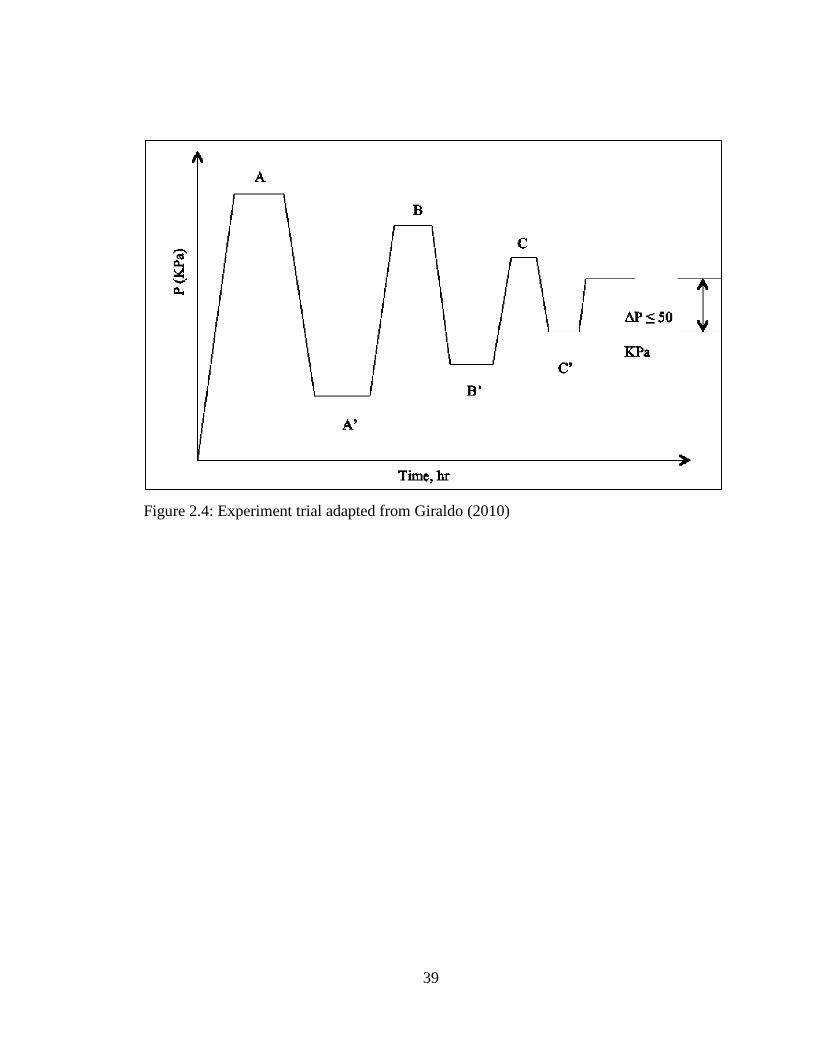
Figure 2.4 illustrates the variation of pressure at constant temperature for typical
trial. Each experimental gas was then injected at a greater pressure than is required for its
hydrate to form in pure water. When the first hydrate was formed, the pressure was noted
and is represented on Figure 2.4 by occurrence point A. The piston was then pulled
upward to gradually reduce the pressure in the system until the entire hydrate
disappeared, represented by point A’ on Figure 2.4. An increase in pressure
38
Figure 2.4: Experiment trial adapted from Giraldo (2010)
39
caused the hydrate to form while a decrease caused it to decompose (points B, B’ and C,
C’). When the difference between the decomposition and formation pressure was at or
below 50 kPa, the hydrate equilibrium point was noted. It took approximately two weeks
to reach equilibrium for each temperature. At the end of the experiment, the hydrate
inhibitor solution was drained and new hydrate inhibitor solution was injected in to the
cell.
40
Chapter Three: EXPERIMENTAL RESULTS AND DISCUSSION
Experiments were performed in an isothermal, variable volume cell to determine
hydrate equilibrium conditions for carbon dioxide and ethane in the presence of mixed
inhibitors (sodium chloride and methanol). Varying amounts of methanol and NaCl were
used to investigate the effect on incipient hydrate conditions. Methanol and NaCl were
chosen for this study because methanol is the most prevalent thermodynamic inhibitor in
oil and gas production and NaCl is the salt that is found in the highest concentrations in
seawater and brines. The concentration ranges of methanol and NaCl were chosen so as
to fall within a range that would be of use to industry (Hammerschmidt, 1934; Clarke and
Bishnoi, 2004) and where there is no possibility of NaCl precipitating (Clark and
Bishnoi, 2004).
This study is the first to measure the incipient points of ethane hydrates in mixed
inhibitor solutions of methanol and NaCl. This data is important because ethane is usually
the second most abundant hydrocarbon component in natural gas, on a mass basis. As
mentioned in Chapter 1, there is a limited amount of previously obtained data measuring
the incipient conditions of carbon dioxide in mixed inhibitors, including methanol and
NaCl. However, given that there is much disagreement between data sets involving
carbon dioxide hydrates in the presence of inhibitors, these experiments were also
included in this study with the hope of shedding some light on possible reasons for the
lack of consistency.
41
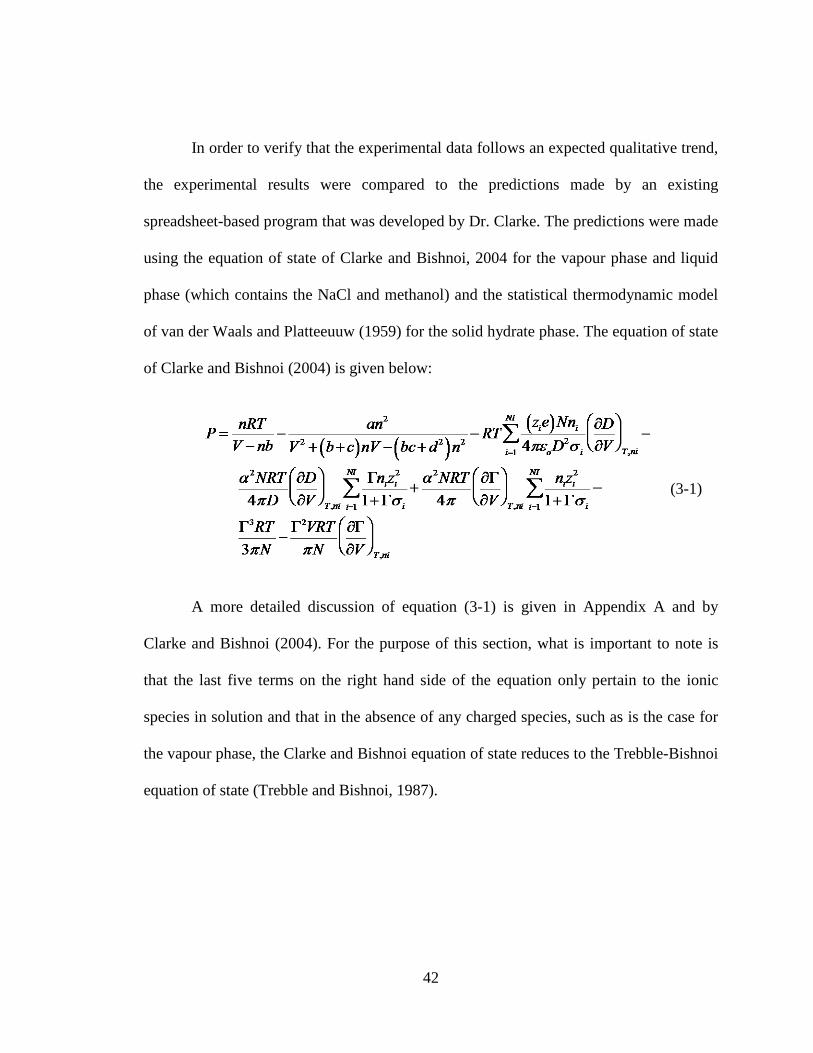
In order to verify that the experimental data follows an expected qualitative trend,
the experimental results were compared to the predictions made by an existing
spreadsheet-based program that was developed by Dr. Clarke. The predictions were made
using the equation of state of Clarke and Bishnoi, 2004 for the vapour phase and liquid
phase (which contains the NaCl and methanol) and the statistical thermodynamic model
of van der Waals and Platteeuuw (1959) for the solid hydrate phase. The equation of state
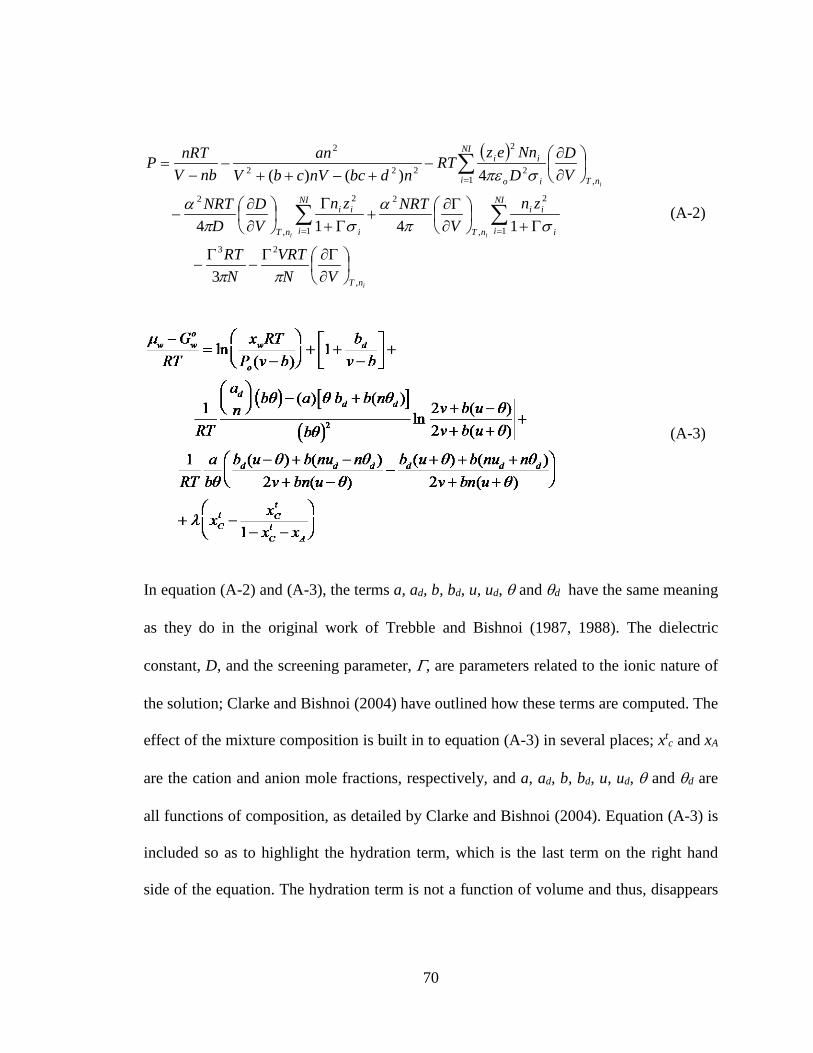
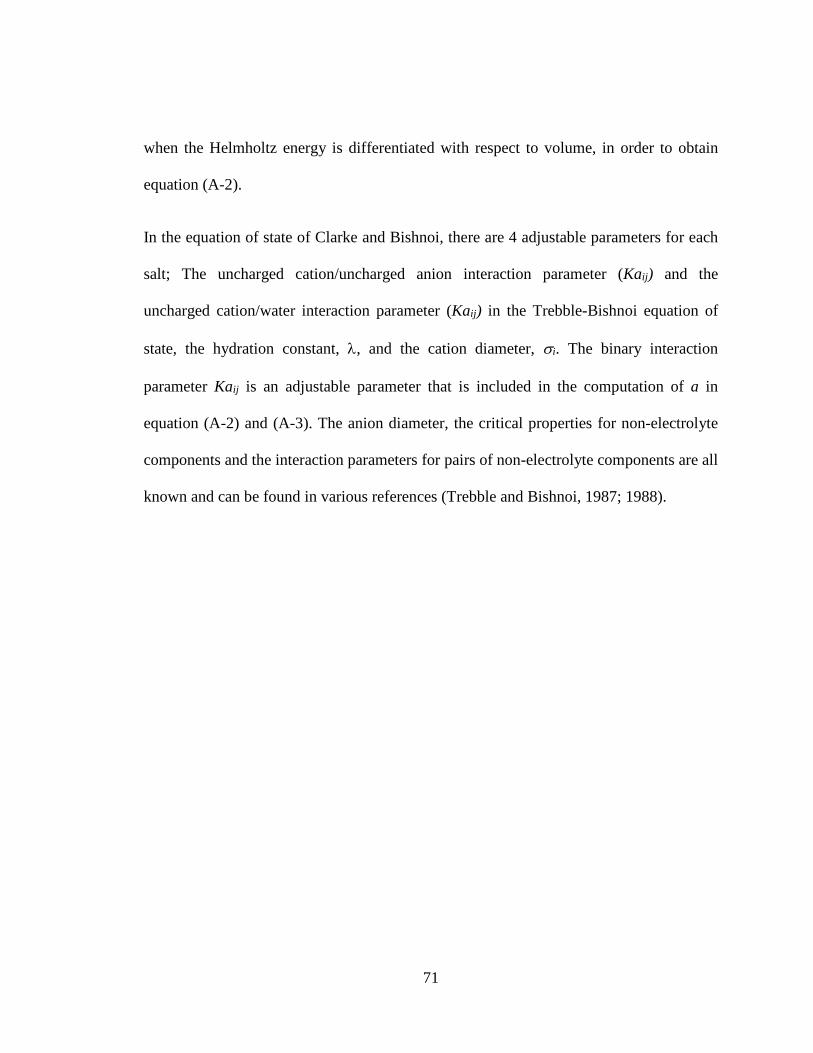
of Clarke and Bishnoi (2004) is given below:
(3-1)
A more detailed discussion of equation (3-1) is given in Appendix A and by
Clarke and Bishnoi (2004). For the purpose of this section, what is important to note is
that the last five terms on the right hand side of the equation only pertain to the ionic
species in solution and that in the absence of any charged species, such as is the case for
the vapour phase, the Clarke and Bishnoi equation of state reduces to the Trebble-Bishnoi
equation of state (Trebble and Bishnoi, 1987).
42
3.1 Validation of experimental methodology
Due to the fact that the cooling system in the current apparatus was rebuilt in
recent years, the validity of the experimental apparatus and procedure were confirmed by
performing three experimental runs of carbon dioxide in a pure water system. The
obtained data compared well to data that was published by Deaton and Frost (1946) and
Larson (1955). Other published data have investigated carbon dioxide hydrates
thermodynamics in pure water (Dholabhai et al., 1993; Englezos and Hall, 1994; Fan and
Guo, 1999; Mooijer et al., 2001; Mohammadi et al., 2005). From Chapter 1, made the
point that all of these data sets agree with those of Deaton and Frost (1946) and Larson
(1955). Thus, in order to keep the graph and table, that will be used for comparison, as
readable as possible only the data of Deaton and Frost (1946) and Larson (1955) will be
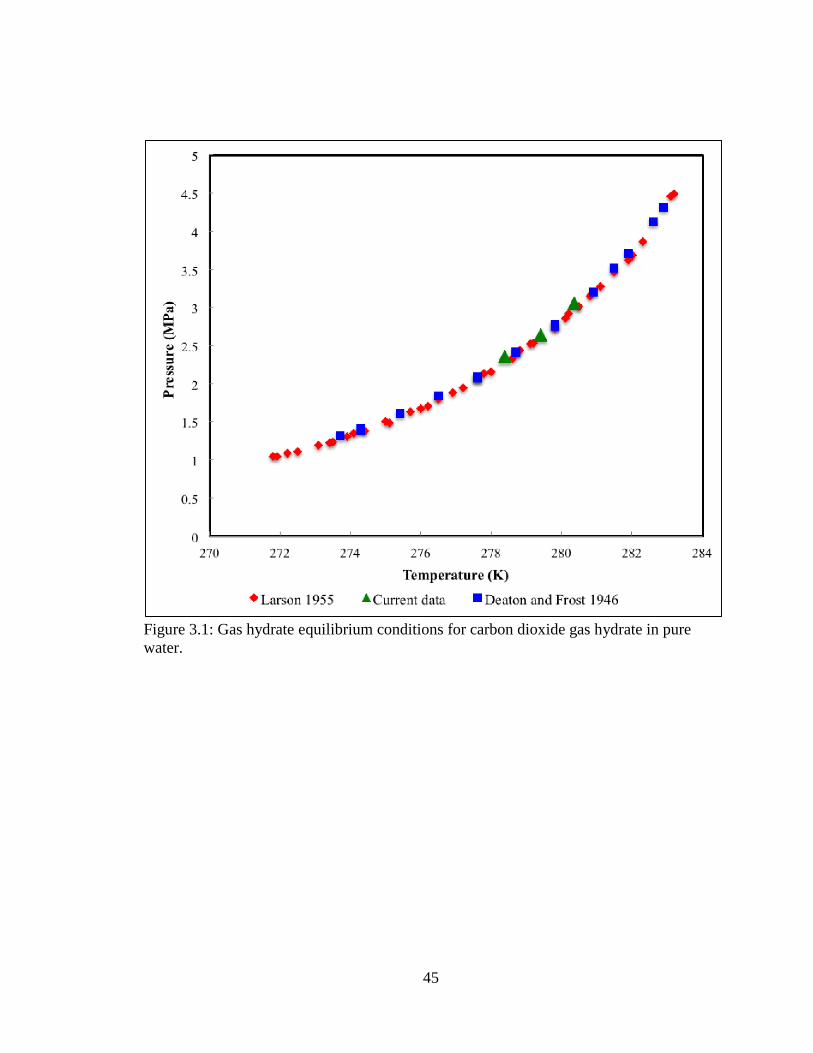
included. Three phase equilibrium conditions (L-H-V) for carbon dioxide gas hydrates in
the presence of a pure water system are tabulated in Table 3.1 and presented in Figure
3.1. The data sets of Deaton and Frost (1946) and Larson (1955) cover a much wider
temperature range than the current study and thus, in order to better facilitate a direct
comparison of the current data only the data between 278 and 281 K is included in Table
3.1. However, all of the data of Deaton and Frost (1946) and of Larson (1955) is included
in Figure 3.1. As shown in Figure 3.1, current data closely follows the trend of the data
presented by Deaton and Frost (1946) and Larson (1955). This suggests that the accuracy
of the apparatus and procedure has not been affected by the redesigned cooling system.
43
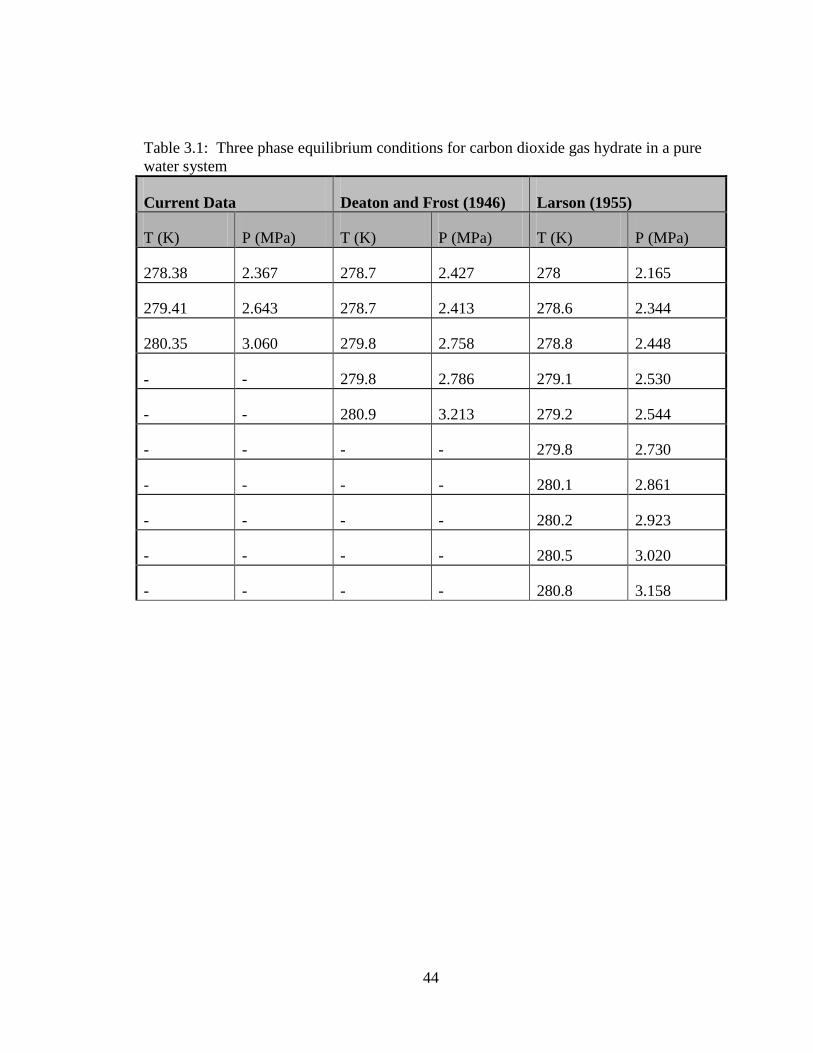
Table 3.1: Three phase equilibrium conditions for carbon dioxide gas hydrate in a pure water system
Current Data Deaton and Frost (1946) Larson (1955)
T (K) P (MPa) T (K) P (MPa) T (K) P (MPa)
278.38 2.367 278.7 2.427 278 2.165
279.41 2.643 278.7 2.413 278.6 2.344
280.35 3.060 279.8 2.758 278.8 2.448
- - 279.8 2.786 279.1 2.530
- - 280.9 3.213 279.2 2.544
- - - - 279.8 2.730
- - - - 280.1 2.861
- - - - 280.2 2.923
- - - - 280.5 3.020
- - - - 280.8 3.158
44
Figure 3.1: Gas hydrate equilibrium conditions for carbon dioxide gas hydrate in pure water.
45
3.2 Experimental results and discussion for carbon dioxide and ethane hydrates in
the presence of mixed inhibitor solutions.
The experimental results, and the discussion of the results are presented in this
section. In the following sections, a statistic is introduced as a means of quantifying the
inhibiting effect of the solutions, namely the Total Absolute Average Deviation (TAAD)
methanol. The results are presented in Table 3.2, Table 3.3 and Table 3.4, respectively,
and displayed in Figure 3.2, 3.3 and 3.4. Each experiment took up to two weeks to run to
completion.
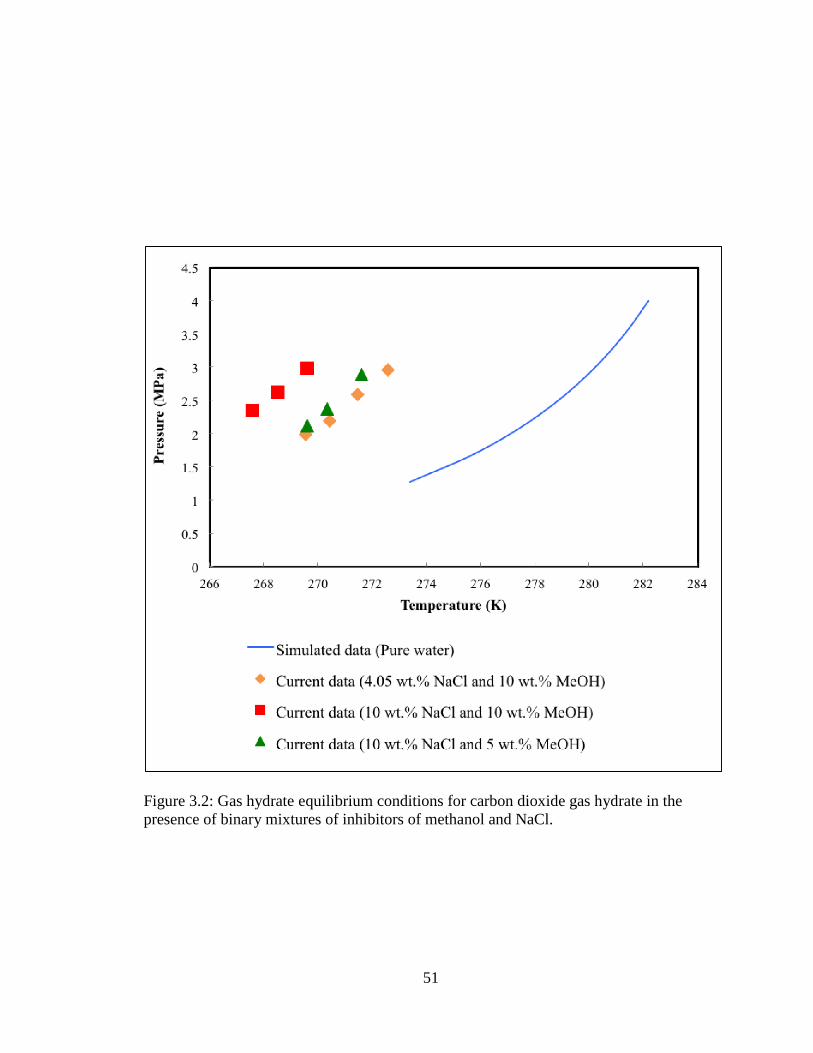
Figure 3.2 presents the incipient hydrate equilibrium conditions for carbon
dioxide in the presence of binary mixtures of varying inhibitor concentrations and in a
pure water system. In order to illustrate the inhibiting strength of each solution,
predictions for carbon dioxide hydrates in pure water were generated using Colorado
School of Mines’ Gibbs Free Energy minimization program (CSMGem), which is
included with the book of Sloan and Koh (2008). Figure 3.2 shows that, as expected, at a
given pressure the presence of an inhibitor solution decreases the temperature at which
gas hydrates first appear.
To quantify the degree of hydrate inhibition, the TAAD (equation 3-2) was
computed for each inhibitor concentration. In equation (3-2), the value for the
temperature at which hydrates would form in pure water, at the given temperature, was
taken as the value computed by CSMGem. From equation (3.2) the TAAD is 2.99% for
* Initially, it was intended to perform the first set of experiments with 5 wt% NaCl. However, upon examining the experimental records, after the first set of experiments had been performed, it was found that only 4.05 wt% NaCl had been used. For all subsequent experiments, the weight percent of each inhibitor was double-checked before starting experiments.
47
the 10 wt.% NaCl/5 wt.% MeOH solution, 3.88% for the10 wt.% NaCl/10 wt.% MeOH
and 2.80% for the 4.05% NaCl/10% MeOH solution.
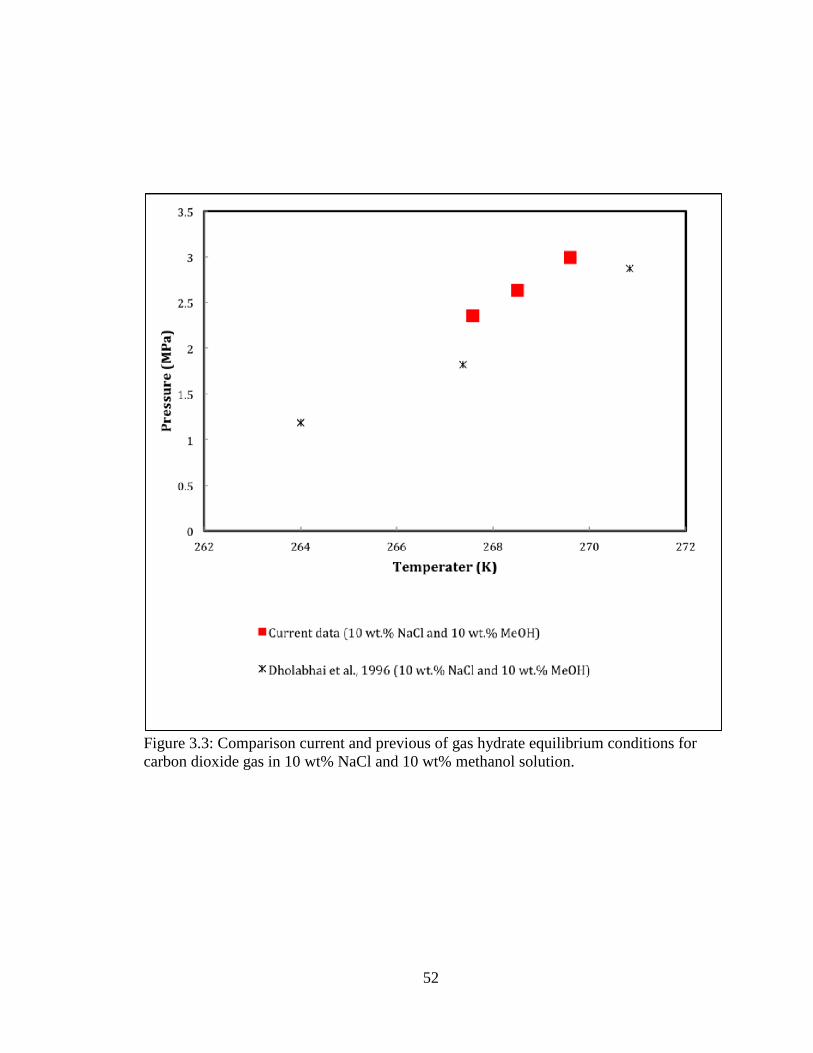
In Figure 3.3, the data from the current study is plotted along with the data for
Dholabhai et al (1996) for 10 wt.% NaCl/10 wt.% MeOH. It can be seen from Figure 3.3
that the agreement between the two data sets is not particularly good. There are two
possible explanations; one related to the experimental apparatus and one related to carbon
dioxide. With regards to the experimental apparatus, it should be stressed that the
technique that was used in both the current study as well as by Dholabhai et al. (1996)
relies on the visual detection of very small amounts of hydrates. Thus, it is possible that
two investigators with different eyesight may detect the formation of hydrates at a
different moment. Also, I believe that the large of heat of solution of carbon dioxide
hydrates plays a significant role in the discrepancy between the data sets for carbon
dioxide hydrates, including between the current study and that of Dholabhai et al. (1996).
If an apparatus’ cooling system is unable to completely dissipate the heat of solution, the
carbon dioxide hydrates will not be formed at a truly constant temperature. It should be
noted that while Dholabhai et al. (1996) used the same equilibrium cell as was used for
the current study, a different cooling system and a different data acquisition system are
being used for the current study. Unfortunately, the cooling system used by Dholabhai et
al. (1996) was not available for a direct comparison and it was not possible to locate the
raw experimental data of Dholabhai et al. (1996). In the current study, the data
acquisition system was used to observe the transient temperature trends and to verify that
the system was maintaining a constant temperature.
48
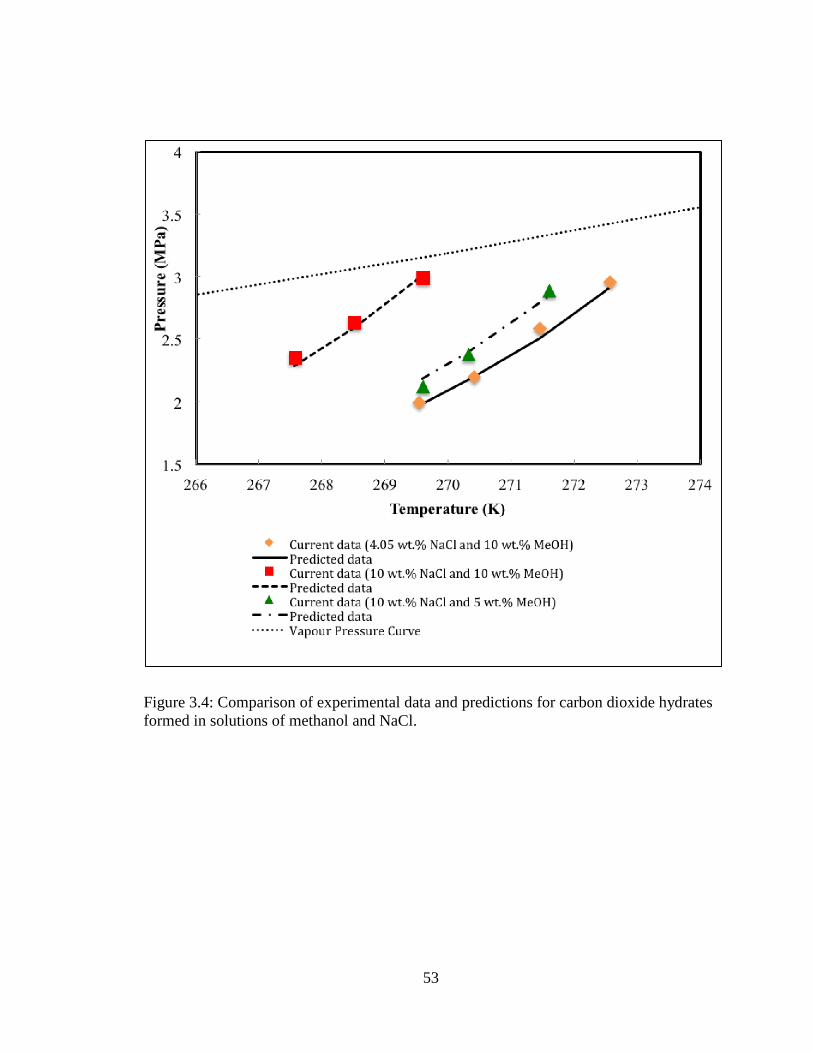
In Figure 3.4, the model of Clarke and Bishnoi (2004) is used to correlate the data
obtained in the current study. In correlating the data, it was necessary to fit one parameter
(the binary interaction parameter for the carbon dioxide – sodium pair). All other
parameters were available in the literature (Clarke and Bishnoi, 2004). The computed
value of the binary interaction parameter was 0.5621. A discussion of the parameter
estimation is not included in this thesis as it was done automatically by the program that
was written by Dr. Clarke. Figure 3.4 shows that the data obtained in the current study
can be correlated with a good degree of accuracy using the model of Clarke and Bishnoi
(2004). Also in Figure 3.4, a computed curve of the vapour pressure of pure carbon
dioxide (generated by Dr. Clarke’s program) is also included so as to confirm that carbon
dioxide is present as a vapour rather than as a second liquid phase. The apparatus that
was used is not designed for experiments in which there is a second liquid phase present.
49
Table 3.2: Hydrate-liquid-vapour equilibrium conditions for carbon dioxide gas hydrate in the presence of 4.05 wt.% NaCl /10 wt.% MeOH
T (K) P (MPa)
269.54 1.993
270.41 2.199
271.45 2.591
272.57 2.961
Table 3.3: Hydrate-liquid-vapour equilibrium conditions for carbon dioxide gas hydrate in the presence of 10 wt.% NaCl /10 wt.% MeOH and that reported in the literature
Current Study
10 wt. % NaCl/10 wt.% MeOH
Dholabhai et al. (1996)
10 wt. % NaCl/ 10 wt. %MeOH
T (K) P (MPa) T (K) P (MPa)
267.57 2.355 264.00 1.184
268.51 2.633 267.37 1.818
269.60 2.992 270.83 2.872
Table 3.4: Hydrate-liquid-vapour equilibrium conditions for carbon dioxide gas hydrate in the presence of 10 wt.% NaCl /5 wt.% MeOH
T (K) P (MPa)
269.60 2.123
270.32 2.376
271.60 2.887
50
Figure 3.2: Gas hydrate equilibrium conditions for carbon dioxide gas hydrate in the presence of binary mixtures of inhibitors of methanol and NaCl.
51
Figure 3.3: Comparison current and previous of gas hydrate equilibrium conditions for carbon dioxide gas in 10 wt% NaCl and 10 wt% methanol solution.
52
Figure 3.4: Comparison of experimental data and predictions for carbon dioxide hydrates formed in solutions of methanol and NaCl.
53
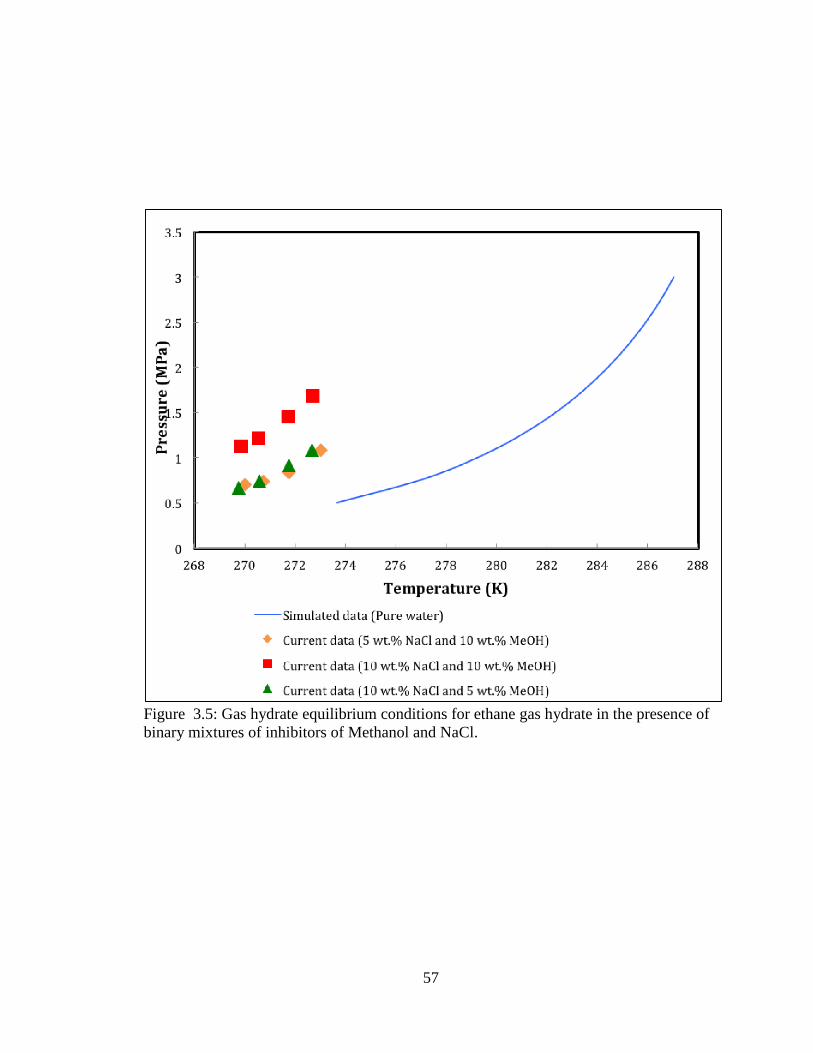
3.2.2 Incipient equilibrium conditions for ethane gas hydrate in the presence of binary mixtures of methanol and sodium chloride
The three-phase equilibrium conditions (L-H-V) for ethane in the presence of
three binary mixture aqueous solutions of methanol and sodium chloride were
experimentally obtained. The three solutions used were 10 wt.% methanol/5 wt.% NaCl,
10 wt.% methanol/10 wt.% NaCl and 5 wt.% methanol/10 wt.% NaCl. The results are
presented in Table 3.5 to 3.7 and displayed in Figure 3.5. Unlike the experiments with
carbon dioxide, there is no available data in the literature for analytical comparison
analysis with the present study.
Figure 3.5 presents the equilibrium hydrate curves for ethane hydrates in pure
water and for varying inhibitor concentrations of binary inhibitor mixtures. The
computations for ethane hydrate equilibrium in pure water were generated by using
Colorado School of mines’ Gibbs energy minimization program (CSMGem). As was
seen with carbon dioxide, the equilibrium points from the experiments show an
increasing shift towards the left of P-T diagram as concentrations of inhibitor increase at
a given pressure. As the concentration of the inhibitor increases the pressure required to
form hydrates increases, at a given temperature. Also, as was seen with the carbon
dioxide hydrates, the 10 wt.% methanol/10 wt.% NaCl exhibited the highest degree of
inhibition where as the other two solutions displayed roughly equal degrees of hydrate
inhibition. The TAAD for ethane hydrates formed in the 10 wt.% methanol/5 wt.% NaCl
solution was 2.38%, for the 5 wt.% methanol/10 wt.% NaCl solution it was 2.50% and
for 10 wt.% methanol/10 wt.% NaCl solution it was 3.63%. When the TAAD for the runs
54
with ethane and with carbon dioxide are compared it can be seen that the same inhibitor
solution has a statistically significant inhibiting effect on the formation of carbon dioxide
hydrates than it does on the formation of ethane hydrates.
There was no previously obtained data for ethane hydrates formed in mixed
NaCl/Methanol solutions available for comparison, unlike with carbon dioxide. However,
it should be noted that the heat of solution of ethane hydrates is known to be much lower
(Sloan and Koh, 2008, p.120) than for carbon dioxide hydrates and thus, it is expected
that these experiments would be much more repeatable than those with carbon dioxide.
This is because a lower heat of solution, which can be easily dissipated a cooling system,
will mean that the hydrates are much more likely to be forming at a constant temperature.
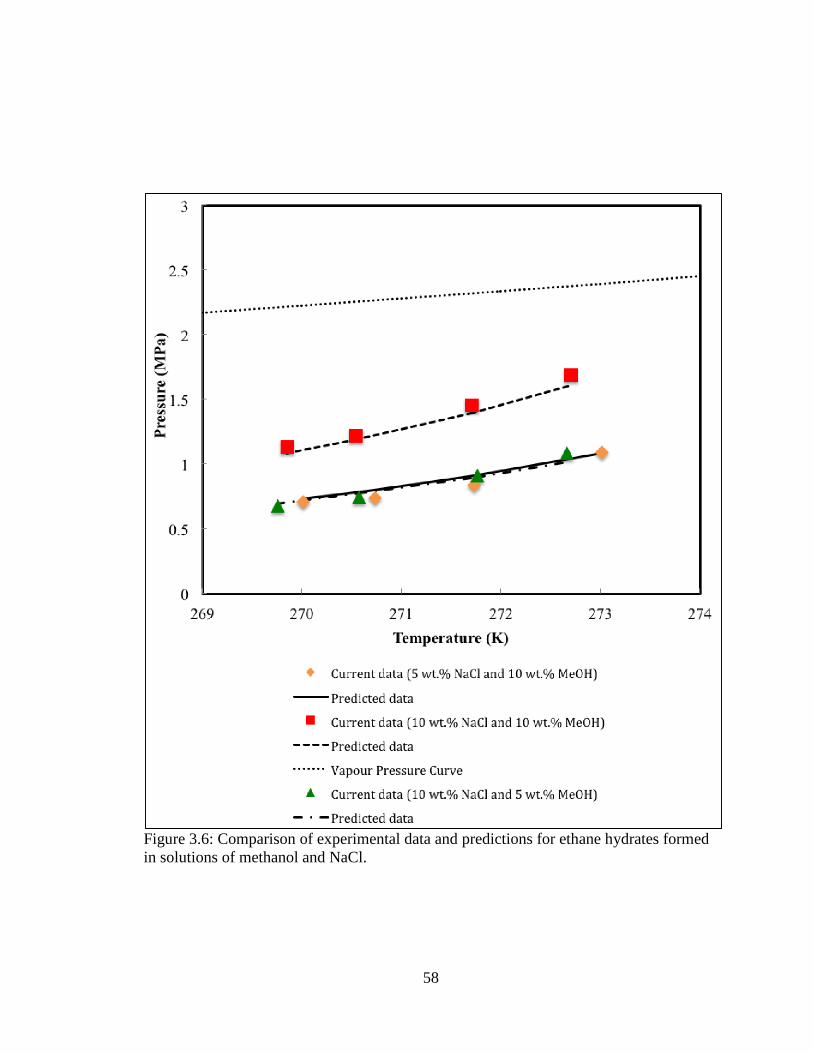
Figure 3.6 presents the simulated results form Clarke and Bishnoi model (2004).
For the predictions in Figure 3.6, a binary interaction parameter for the ethane-sodium
pair was automatically generated. The value for this parameter was computed as -0.5126.
All other parameters were available in the literature (Clarke and Bishnoi, 2004). The
computed vapour pressure curve for pure ethane is also included, again to confirm that
the experiments were conducted at conditions that did not cause ethane to condense. The
results presented in Figure 3.6 confirm that the model of Clarke and Bishnoi (2004) is
capable of correlating the results for ethane hydrates formed in a mixed inhibitor. The
results also confirm that ethane could not have condensed during the experiments.
55
Table 3.5: Hydrate-liquid-vapour equilibrium conditions for ethane gas hydrate in the presence of 5 wt.% NaCl /10 wt.% MeOH
T (K) P (MPa)
270.01 0.706
270.73 0.739
271.73 0.836
273.01 1.09
Table 3.6: Hydrate-liquid-vapour equilibrium conditions for ethane gas hydrate in the presence of 10 wt.% NaCl /10 wt.% MeOH
T (K) P (MPa)
269.85 1.135
270.54 1.221
271.7 1.455
272.7 1.69
Table 3.7: Hydrate-liquid-vapour equilibrium conditions for ethane gas hydrate in the presence of 10 wt.% NaCl /5 wt.% MeOH
T (K) P (MPa)
269.75 0.674
270.57 0.745
271.76 0.914
272.66 1.084
56
Figure 3.5: Gas hydrate equilibrium conditions for ethane gas hydrate in the presence of binary mixtures of inhibitors of Methanol and NaCl.
57
Figure 3.6: Comparison of experimental data and predictions for ethane hydrates formed in solutions of methanol and NaCl.
58
Chapter Four: CONCLUSIONS AND RECOMMENDATIONS
4.1 Conclusions
Experiments were performed using a pressure search method to measure the
hydrate equilibrium conditions for pure carbon dioxide and ethane gas in the presence of
sodium chloride and methanol binary mixtures at different concentrations. The
experimental procedure was validated by performing experiments of pure carbon dioxide
gas in a pure water system and compared with reported data from the literature.
The experimental pressure ranged from 1.993 MPa to 3.092 MPa for carbon
dioxide with a temperature range from 269.54 K to 272.48 K. For the ethane hydrate
experiments, the pressure ranged from 0.674 MPa to 1.090 MPa with a temperature range
from 269.75 K to 273.01 K. The concentrations for sodium chloride and methanol binary
mixtures varied between 5% and 10% by weight base.
As expected, inhibition effect occurred at all concentrations of the binary mixtures
of sodium chloride and methanol for pure carbon dioxide and ethane gas hydrates. When
the concentration of the binary mixtures increased the inhibition effect also increased
with both carbon dioxide and ethane hydrates. Furthermore, the maximum and minimum
concentration of the binary mixture inhibitors (10 wt. % NaCl/10 wt.% MeOH and4.05
wt. % NaCl/10 wt.% MeOH) produced total average absolute deviation values of 3.88%
and 2.80%, respectively for carbon dioxide hydrate. The ethane hydrate system using the
59
maximum and minimum concentration of the binary mixture inhibitors (10 wt. %
NaCl/10 wt.% MeOH and 5 wt. % NaCl/10 wt.% MeOH) produced total average
absolute deviation values of 3.63% and 2.38%, respectively. It can be concluded that
inhibition of carbon dioxide hydrate is more profound than ethane hydrate when using the
same concentration of inhibitor. Finally, it was confirmed that the model of Clarke and
Bishnoi (2004) is capable of correlating the experimental data for pure ethane and pure
carbon dioxide hydrates formed in a mixed inhibitor solution of NaCl and Methanol.
4.2 Recommendations
For future studies, the following recommendations are made in order to confirm
the results of the current study and to improve the apparatus:
1. Repeat the experiments, especially those with carbon dioxide, using the constant-volume apparatus that was designed by Porz et al. (2010). This was not possible for the current study as the aforementioned apparatus was in use.
2. Couple the current apparatus to the Raman Spectrometer in END 106 so that it becomes possible to measure the composition of the hydrate and to confirm the structure of the hydrate phase.
3. Conduct experiments over a wider range of temperature and inhibitor concentrations and with other inhibitors, such as different salts or alcohols.
4. Perform experiments to measure the hydrate formation conditions in mixed inhibitor systems when the hydrates are formed from gas mixtures.
60
References
1. Adisasmito, S., Robert, J.F., Sloan, E.D., “Hydrates of Carbon Dioxide and Methane Mixtures”, J. Chem. Eng. Data, 36, 68-71, (1991).
2. Adisasmito, S., Sloan, E.D., “Hydrates of Hydrocarbon Gases Containing Carbon Dioxide”, J. Chem. Eng. Data, 37, 343-349, (1992).
3. Afzal, W., Mohammadi, A.H., Richon, D., “Experimental Measurements and Predictions of Dissociation Conditions for Carbon Dioxide and Methane Hydrates in the Presence of Triethylene Glycol Aqueous Solutions”, J. Chem. Eng. Data, 52, 2053-2055, (2007).
4. Afzal, W., Mohammadi, A.H., Richon, D., “Experimental Measurements and Predictions of Dissociation Conditions for Methane, Ethane, Propane, and Carbon Dioxide Simple Hydrates in the Presence of Diethylene Glycol Aqueous Solutions”. J. Chem. Eng. Data, 53, 663–666, (2008).
5. Breland, E., Englezos, P., “Equilibrium Hydrate Formation Data for Carbon Dioxide in Aqueous Glycerol Solutions”, J. Chem. Eng. Data, 41, 11-13, (1996).
6. Berecz, E., Balla-Achs, M, “Research Report No. 37 (185-XL-1-1974, OGIL) NME, Technical University of Heavy Industry, Miskolc, Hungary, as summarized in: Gas Hydrates; Studies in Inorganic Chemistry”, Vol. 4; Elsevier: New York, 343, (1983).
7. Bishnoi, P.R., Dholabhai, P.D., “Equilibrium Conditions for Hydrate Formation for A Ternary Mixture of Methane, Propane and Carbon Dioxide, and A Natural Gas Mixture in the Presence of Electrolytes and Methanol”, Fluid Phase Equilibria, 158–160, 821–827, (1999).
8. Canadian Association of Petroleum Producers, (http://www.capp.ca/getdoc.aspx?DocId=67103&DT=NTV), (2013), accessed May 12, 2013.
10. Chatfield, C, Time- Series Forecasting, Chapman & Hall/CRC, 2001
11. Chen, H.S, “The Properties of Carbon Dioxide hydrate. The Growth Rate of Ice Crystals: The Properties of Carbon Dioxide Hydrate”, A Review of Properties of
51 Gas Hydrates; Research and Development Progress Report No. 830; Office of Saline Water, US. Department of the Interior: Washington, DC, 1972; p 1.
12. Clarke, M.A., Bishnoi, P.R. “Development of a New Equation of State for Mixed Salt and Mixed Solvent Systems, and Application to Vapour Liquid Equilibrium and Solid (Hydrate) Vapour Liquid Equilibrium Calculations”, Fluid Phase Equilibria, 220, 21-35, (2004).
13. Claussen, W.F., “A second Water Structure for Inert Gas Hydrates”, Journal of Chemical Physics, 19, 1452-1432, (1951).
14. Deaton, W. M., Frost, E.M., “Jr., Gas Hydrates and Their Relation to the Operation of Natural-Gas Pipe Lines”, U.S. Bureau of Mines Monogr, 8, 101 (1946).
15. Dholabhai, P.D., Bishnoi, P.R., “Hydrate Equilibrium Conditions in Aqueous Electrolyte Solutions: Mixtures of Methane and Carbon Dioxide”, J. Chem. Eng. Data, 39,191-194, (1994).
16. Dholabhai, P.D., Kalogerakis, N., Bishnoi, P.R., “Equilibrium Conditions for Carbon Dioxide Hydrate Formation in Aqueous Electrolyte Solutions”, J. Chem. Eng. Data, 38, 650-654, (1993).
17. Dholabhai, P.D., Parent, S., Bishnoi, P.R., “Carbon Dioxide Hydrate Equilibrium Conditions in Aqueous Solutions Containing Electrolytes and Methanol Using a New Apparatus”, Ind. Eng. Chem. Res., 35, 819-823, (1996).
18. Dholabhai, P.D., Parent, S., Bishnoi, P.R., “Equilibrium Conditions for Hydrate Formation from Binary Mixtures of Methane and Carbon Dioxide in the Presence of Electrolytes, Methanol and Ethylene Glycol”, Fluid Phase Equilibria, 141, 235-246, (1997).
19. Eichholz, C., Majumdar, A., Clarke, M, Oellrich, L., Bishnoi, P.R., Experimental Investigation and Calculation of Methane Hydrate Formation Conditions in the Presence of Ethylene Glycol and Sodium Chloride, J. Chem. Eng. Data, 49,847-851, (2004).
20. Englezos, P., Bishnoi, P.R., “Experimental Study on the Equilibrium Ethane Hydrate Formation Conditions in Aqueous Electrolyte Solutions”, Ind. Eng. Chem. Res., 30, 1655-1659, (1991).
21. Englezos, P., Hall, S., “Phase Equilibrium Data on Carbon Dioxide Hydrate in the Presence of Electrolytes, Water Soluble Polymers and Montmorillonite”, The Canadian Journal of Chemical Engineering, 72, 887-893, (1994).
62
22. Falabella, B.J., Vanpee, M., “Experimental Determination of Gas Hydrate Equilibrium below the Ice Point”, Ind. Eng. Chem., Fundam., 13 (3), 228-231,(1974).
23. Fan, S.-S., Chen, G.-J., Ma, Q.-L., Guo, T.-M., “Experimental and Modeling Studies on the Hydrate Formation of CO2 and CO2-Rich Gas Mixtures”, Chemical Engineering Journal, 78, 173–178, (2000).
24. Fan, S.-S., Guo, T.-M., “Hydrate Formation of CO2-Rich Binary and Quaternary Gas Mixtures in Aqueous Sodium Chloride Solutions”, J. Chem. Eng. Data, 44, 829-832, (1999).
25. Giraldo, C., Gas Hydrate Formation in Reverse Micelles, M.Sc. Thesis, University of Calgary, Calgary, Alberta, 2010.
26. Giraldo, C.A., Maini, B., Bishnoi, P.R., Clarke, M.A. “A New Approach to Modelling the Rate of Growth of Gas Hydrates Formed from Mixtures of Gases”, Energy & Fuels. 27, 1204 – 1211, (2013).
27. Hammerschmidt, E.G., “Formation of Gas Hydrates in Natural Gas Transmission Lines”, Ind. Eng. Chem., 26, 851-855, (1934).
28. Heraeus, (http://heraeus-quarzglas.com/en/quarzglas/mechanicalproperties/Mechanical_properties.aspx), (2013), accessed June 12, 2013.
29. Herriot watt Institute of Petroleum Engineering, (http://www.pet.hw.ac.uk/research/hydrate/hydrates_why.cfm?hy=what), (2013a), accessed August 1, 2013.
30. Herriot watt Institute of Petroleum Engineering, (http://www.pet.hw.ac.uk/research/hydrate/hydrates_what.cfm?hy=what), (2013b), accessed August 1, 2013.
31. Holder, G.D., Grigoriou, G.C., “Hydrate Dissociation Pressures of (methane + ethane + water) Existence of a Locus of Minimum Pressures”, J. Chem. Thermodynamics, 1093- 1104, (1980).
32. Holder, G.D., Hand, J.H., “Multiple-Phase Equilibria in Hydrates from Methane, Ethane, Propane and Water Phase Mixtures”, AIChE J., 28(3), 440-447, (1982).
33. Jeffery, G.A., McMullan, R.K., “The Clathrate Hydrates, Progress in Inorganic Chemistry”, 8, 45-51, (1967).
34. Kumar, A., Zatsepina, O., Clarke, M.A., Maini, B., Bishnoi, P.R. “Experimental Determination of Permeability in the Presence of Hydrates and its Effect on the
Dissociation Characteristics of Gas Hydrates in Porous Media”, Journal of Petroleum Engineering Science, 70, 114-122, (2010).
35. Kumar, A., Maini, B., Clarke, M.A., Bishnoi, P.R. “Estimation of the Surface Area for Hydrate Dissociation in Porous Media from Experimental Data on Hydrate Depressurization”, Energy & Fuels. 27, 5757 – 5769, (2013).
36. Larson, S. D., “Phase Studies of the Two-Component Carbon Dioxide-Water System Involving the Carbon Dioxide Hydrate”, Ph.D. Thais, University of Illinois at Urbana Champaign, IL, (1955).
37. Maekawa, T., “Equilibrium Conditions for Carbon Dioxide Hydrates in the Presence of Aqueous Solutions of Alcohols, Glycols, and Glycerol”, J. Chem. Eng. Data, 55, 1280–1284, (2010).
38. Majumdar, A., Mahmoodaghdam, E., Bishnoi, P.R., “Equilibrium Hydrate Formation Conditions for Hydrogen Sulfide, Carbon Dioxide, and Ethane in Aqueous Solutions of Glycol and Sodium Chloride”. J. Chem. Eng. Data, 45, 20-22, (2000).
39. Mahamoodaghdam, E., Bishnoi, P.R., “Equilibrium Data for Methane, Ethane, and Propane Incipient Hydrate Formation in Aqueous Solutions of Ethylene Glycol and Diethylene Glycol”, J. Chem. Eng. Data, 47,278-281, (2002).
40. MeGlobal, http://www.meglobal.biz/media/product_guides/MEGlobal_MEG.pdf, (2013), accessed September 4, 2013.
41. Mei, D.-H., Liao, J., Yang, J.-T., Guo, T.-M., “Hydrate Formation of a Synthetic Natural Gas Mixture in Aqueous Solutions Containing Electrolyte, Methanol, and (Electrolyte +Methanol)”, J. Chem. Eng. Data, 43, 178-182, (1998).
42. Mohammadi, A.H., Afzal, W., Richon, D., “Gas hydrates of methane, ethane, propane, and carbon dioxide in the presence of single NaCl, KCl, and CaCl2 aqueous solutions: Experimental measurements and predictions of dissociation conditions”, J. Chem. Thermodynamics, 40, 1693–1697, (2008a).
43. Mohammadi, A.H., Afzal, W., Richon, D., “Experimental Data and Prediction of Dissociation Conditions for Ethane and Propane Simple Hydrates in the Presence of Distilled Water Methane, Ethane, Propane and Carbon Dioxide Simple Hydrates in the Presence of Ethanol Aqueous Solutions”, J. Chem. Eng. Data, 53, 73-76, (2008b).
44. Mohammadi, A.H., Afzal, W., Richon, D., “Experimental Data and Prediction of Dissociation Conditions for Ethane and Propane Simple Hydrates in the Presence
of Methanol, Ethylene Glycol and Triethylene Glycol Aqueous”, J. Chem. Eng. Data, 53, 683–686, (2008c).
45. Mohammadi, A.M., Anderson, R., Tohidi, B., “Carbon Monoxide Clathrate Hydrates: Equilibrium Data and Thermodynamic Modeling”, AIChE J., 51(10), 2825-2833, (2005).
46. Mohammadi, A.H., Richon, D., “Gas Hydrate Phase Equilibrium in the Presence of Ethylene Glycol or Methanol Aqueous Solution”, Ind. Eng. Chem. Res., 49, 8865 - 8869, (2010).
47. Mohammadi, A.H., Richon, D., “Phase Equilibria of Hydrogen Sulfide and Carbon Dioxide Simple Hydrates in the Presence of Methanol, (methanol + NaCl) and (ethylene glycol + NaCl) Aqueous Solutions”, J. Chem. Thermodynamics, 44, 26–30, (2012).
48. Mooijer, M.M., Witteman, R., Peters, C.J., “Phase behaviour of gas hydrates of carbon dioxide in the presence of tetrahydropyran, cyclobutanone, cyclohexane and methylcyclohexane”, Fluid Phase Equilibria, 182, 97–110, (2001).
49. Najibi, H., Kamalia, Z., Mohammadi, A.H., “Phase Equilibria of Carbon Dioxide Clathrate Hydrates in the Presence of methanol/ethylene glycol + single salt Aqueous Solutions: Experimental Measurement and Prediction”, Fluid Phase Equilibria, 342, 71– 74, (2013).
50. Ng, H., Robinson, D.B., “ in Gas Processors Association Research Report 66, April, 1983
51. Ng, H., Robinson, D.B., “Hydrate Formation in Systems Containing Methane, Ethane, Propane, Carbon Dioxide or Hydrogen Sulphide in the Presence of Methanol”, Fluid Phase Equilibria, 21,145-155, (1985).
52. Oghaki, K., Takano, K., Sangawa, H., Matsubara T., Nakano S. “Methane exploitation by carbon dioxide from gas hydrates-phase equilibria for CO2-CH4 mixed hydrate system”, J. Chem. Eng. Jap., 29, 478-483, (1996).
53. Parent, J.S., Investigations into the Nucleation Behavior of the Clathrate Hydrates of Natural Gas Component, M.Sc. Thesis, University of Calgary, Calgary, Alberta, 1993.
54. Patrick G. Lafond, Kyle A. Olcott, E. Dendy Sloan, Carolyn A. Koh, Amadeu K. Sum, “Measurements of methane hydrate equilibrium in systems inhibited with NaCl and methanol”, J. Chem. Thermodynamics, 48, 1–6, (2012).
65
55. Porz, L.O., Clarke, M.A., Oellrich, L.R., “Experimental Investigation of Methane Hydrates Equilibrium Condition in the Presence of KNO3, MgSO4 and CuSO4”, Journal of Chemical and Engineering Data, 55 (1), 262-266, (2010).
56. Ripmeester, J.A., Ratcliffe, C.I., Tse, J.S., “The Nuclear Magnetic Resonance of 129Xe Trapped in Clathrates and Some Other Solids”, J. Chem. Soc. Farad. Trans, 84, 3731-3737, (1988).
57. Roberts, O. L., Brownscombe, E. R., Howe, L. S., “Constitution Diagrams and Composition of Methane and Ethane Hydrates.” Oil Gas J., 39 (30), 37, (1940).
58. Robinson, D.B., Mehta, B.R., “Hydrates in the Propane-Carbon Dioxide-Water System”, J. Can. Pet. Technol., 10, 33, (1971).
59. Robinson, D.B., Ng, H., “Hydrate Formation and Inhibition in Gas or Gas Condensate Streams”, The Journal of Canadian Petroleum Technology, 25(4), 26-30, (1986).
60. Ross, M.J., Toczylkin, L.S., “Hydrate Dissociation Pressures for Methane or Ethane in the Presence of Aqueous Solutions of Triethylene Glycol”. J. Chem. Eng. Data, 37, 488-491, (1992).
61. Saint-Gobain Crystals,
http://www.photonic.saint-gobain.com/uploadedFiles/SGphotonic/Documents/sapphire-material-products-properties.pdf, (2013), accessed July 21, 2013.
55. Sami, N.A., Das, K., Sangwai, J.S., Balasubramanian, N., “Phase Equilibria of Methane and Carbon Dioxide Clathrate Hydrates in the Presence of (methanol + MgCl2) and (ethylene glycol + MgCl2) Aqueous Solutions”, J. Chem. Thermodynamics, 65, 198–203, (2013).
56. Setaram instrumentation, (http://www.setaram.com/download.php?download=applications_brochures&app=16), (2013), accessed June 21, 2013.
57. Sloan, E.D., Koh, C.A., Clathrate Hydrates of Natural Gases, third ed., CRC Press, Taylor and Francis Group, 2008.
58. Sloan, E.D., “Natural Gas Hydrates”, JPT, 1414-1417, (1991).
59. The Engineering Tool Box, http://www.engineeringtoolbox.com/ethylene-glycol-d_146.html , (2013a), accessed June 21, 2013.
60. The Engineering Tool Box, http://www.engineeringtoolbox.com/water-thermal-properties-d_162.html, (2013b), accessed June 21, 2013.
61. Tohidi, B., Burgass, R., Danesh, A., Todd, A., SPE26701, Proc. SPE Offshore European Conference, Aberden, Septemper 7- 10, p. 225 (1993).
62. Tumba, K., Reddy, P. Naidoo, P., Ramjugernath, D., “Phase Equilibria of Methane and Carbon Dioxide Clathrate Hydrates in the Presence of Aqueous Solutions of Tributylmethylphosphonium Methylsulfate Ionic Liquid”, J. Chem. Eng. Data, 56, 3620–3629, (2011).
63. Trebble, M.A., Bishnoi, P.R. “Development of a New Four-Parameter Cubic Equation of State” Fluid Phase Equilibria, 35, 1, (1987).
64. Trebble, M.A., Bishnoi, P.R. “Extension of the Trebble-Bishnoi Equation of State to Fluid Mixtures” Fluid Phase Equilibria, 40, 1, (1988).
65. Udachin, K., Ratcliff, C., Ripmeester, J., “A Dense and Efficient Clathrate Hydrate Structure with Unusual Cages”, Angewandte Chemie - International Edition, 40 (7), 1303-1305, (2001).
67. USDOE, U.S. and Japan Complete Successful Field Trial of Methane Hydrate Production Technologies, http://www.netl.doe.gov/publications/press/2012/120502_us_and_japan.html (2012), accessed August 4, 2013.
68. Van der Waals, J.H., Platteeuw, J.C. “Clathrate Solutions” Advances in Chemical Physics, 2, 1, (1959).
69. Von Stackelberg, M., Muller, H.R., “Feste Gas Hydrate II, Zeitungen Elektrochem”, 58, 25-36, (1954).