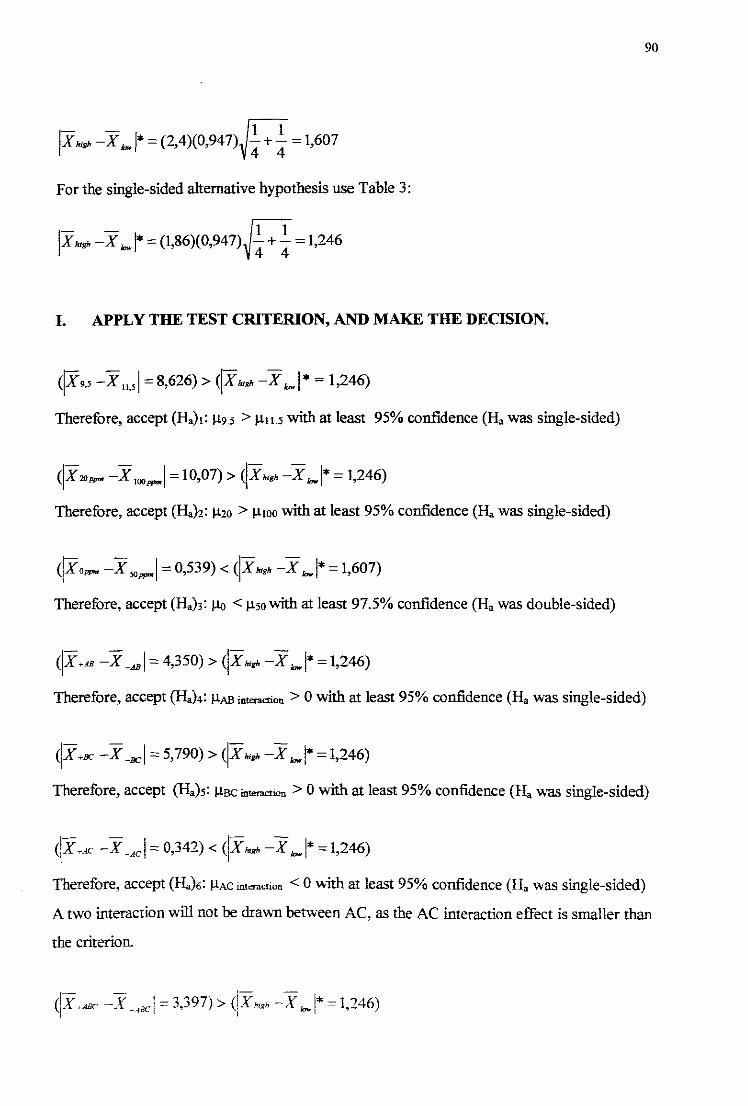
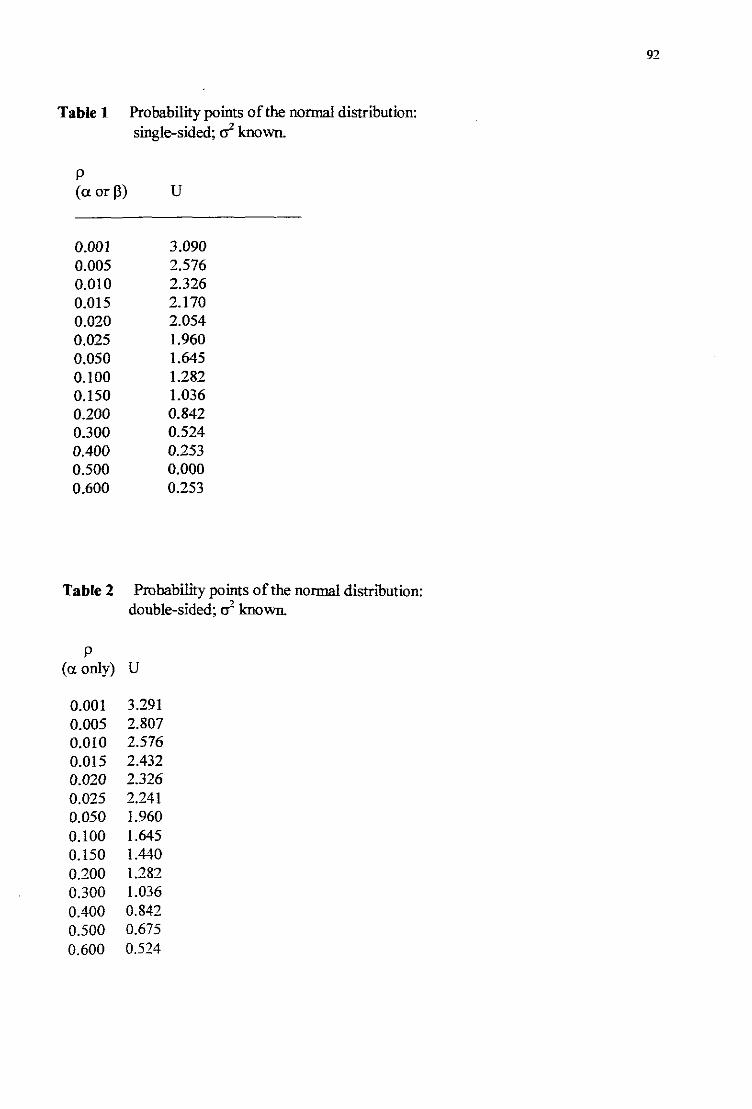
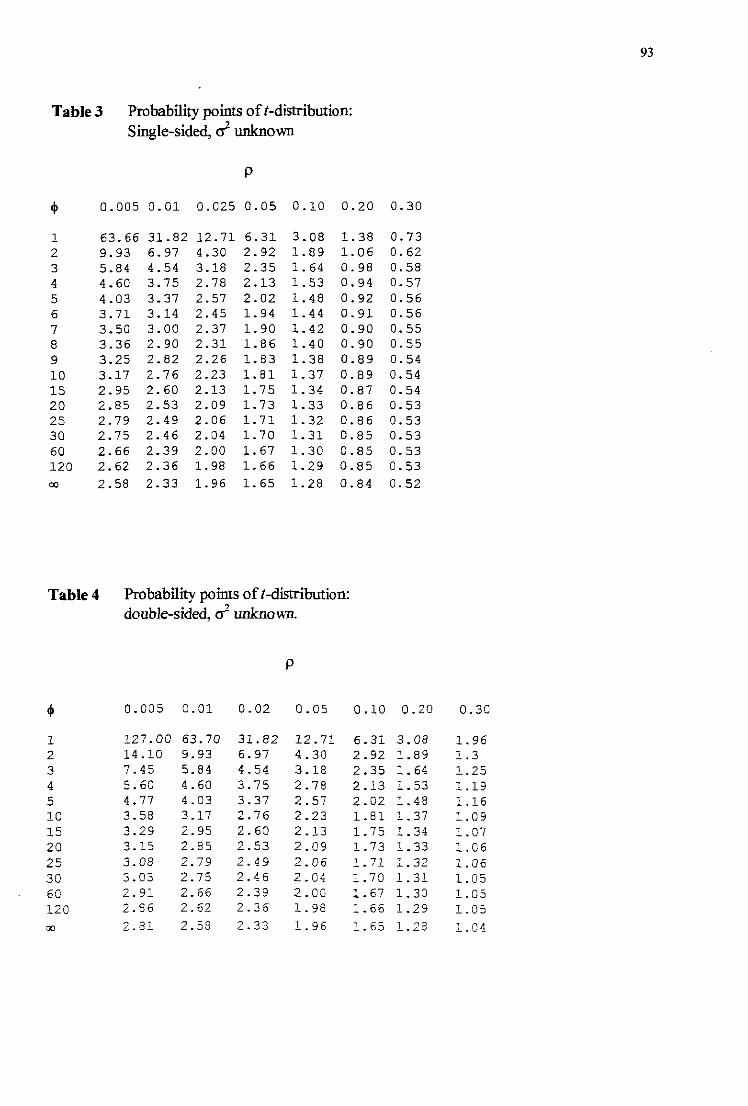
EQUILIBRIUM SHIFT OF GOLD ADSORPTION IN A BATCH REACTOR by HANNELENEJO-ANNEBURNETT A dissertation submitted in fulfilment of the requirements for the Masters Degree in Chemical Engineering Technology at the Cape Technikon Supervisor: Pro£. Francis W Petersen Cape Technikon April 2001
Transcript
EQUILIBRIUM SHIFT OF GOLD
ADSORPTION IN A BATCH
REACTOR
by
HANNELENEJO-ANNEBURNETT
A dissertation submitted in fulfilment ofthe requirements for the Masters
Degree in Chemical Engineering Technology at the Cape Technikon
Supervisor: Pro£. Francis W Petersen
Cape TechnikonApril 2001
DECLARATION
I hereby declare that the work contained in this thesis is my own original
work, except where acknowledged in the text.
H.J. Burnett
April 2001
ii
ABSTRACT
Over the years the carbon-in-pulp technology has been refined to become the highly
efficient process that is used in our present-day system of recovering dissolved gold
from cyanide leached pulps. The efficiency of a CIP circuit mainly depends on the
effectiveness of the adsorption section as it not only determines the amount of soluble
gold lost in the residues, but also indirectly affects the function of the other processes
in the plant. Research in this area has declined over the past few years as a result of a
decrease in the gold price. It is now more than ever important to investigate the
operating conditions of the adsorption process to ensure that a highly effective system
is maintained.
The adsorption of gold cyanide onto activated carbon is to a large extent dependent on
maintaining operating conditions well above those of equilibrium. The Freundlich and
the Langmuir isotherms have been used by many researchers to describe the
equilibrium conditions of the adsorption process. The general practice in the carbon
in-pulp technology is to use an isotherm for the prediction of a circuit's performance.
As confidence has increased in the reliability of these predictions, it has become
important to acquire knowledge of the equilibrium condition that is driving the
process. Previous research findings have indicated that the equilibrium isotherm of
gold cyanide adsorption onto activated carbon is influenced by changes in the
adsorption conditions down the adsorption train. This equilibrium or isotherm shift
may lead to errors in the prediction of gold adsorption rates, which results in the filct
that the simulations of the performance of the CIP circuits are not reliable. In this
study the aim was to investigate the combined influence of various operating
conditions on the adsorption equilibrilLTll.
Experiments were carried out where the change in pH, oxygen and cyanide
concentration, ionic strength in solution and competing ions were investigated
simultaneously. In order to investigate the influence ofchanges in these experimental
conditions, equilibrium isotherms were determined by using standard synthetic
soiutions prepared in I litre batch reactors ""ith different concentrations of potassium
iii
gold cyanide. Through factorial design the three most sensitive factors were
determined. Further experiments were then carried out to test the effect of changes in
free cyanide concentration, pH and competing ions (50 ppm nickel) on the
equilibrium isotherm as well as the adsorption profile. A relationship was postulated
between the cyanide profile in the adsorption circuit and the initial cyanide
concentration, which yielded an expression for a first order decay in free cyanide. A
linear relationship was also established between the free cyanide concentration and
the equilibrium A parameter at a solution pH of 10.5. This resuhed in a modified A
parameter when the two proposed expressions were combined. The modified A
parameter can be substituted in the existing Freundlich isotherm which will modify
the isotherm.
A surface diffusion/film diffusion model was fitted to the experimental data to
estimate the adsorption profile. The modified A parameter was incorporated into the
model and it proved that a better fit (51 % improvement) could be obtained when a
change in pH and free cyanide concentration was accounted for. As a result oflirnited
experimental data the competition factor for gold and nickel could not be determined.
It is suggested that future work should include the effect of competing ions, in order
to include this factor in the modified Freundlich isotherm. It is assumed that if this
additional effect were added to the model, an even greater fit of the model predictions
would be obtained.
iv
ACKNOWLEDGEMENTS
The work contained in this thesis was performed at the Faculty of Engineering at the
Cape Technikon between May 1998 and May 2000.
I wish to thank the following people/institutions for their assistance and contributions
in the completion ofthis thesis:
The Departments of Chemical Engineering and Analytical Chemistry at the
Cape Technikon for the use oftheir laboratory facilities and instrumentation.
The National Research Foundation (NRF) for their financial contributions.
The Agricultural Research Institute, Infruitec, for their assistance in analyses.
My supervisor, Prof. Francis Petersen, for his guidance and support. The
excellent example he sets in his work has encouraged me to reach for higher
goals.
The staffand fellow students at the Cape Technikon, for all their assistance.
My parents for their encouragement, financial support and for always being
proud ofme.
Moray, my fiancee, for his love and faith in me.
CONTENTS
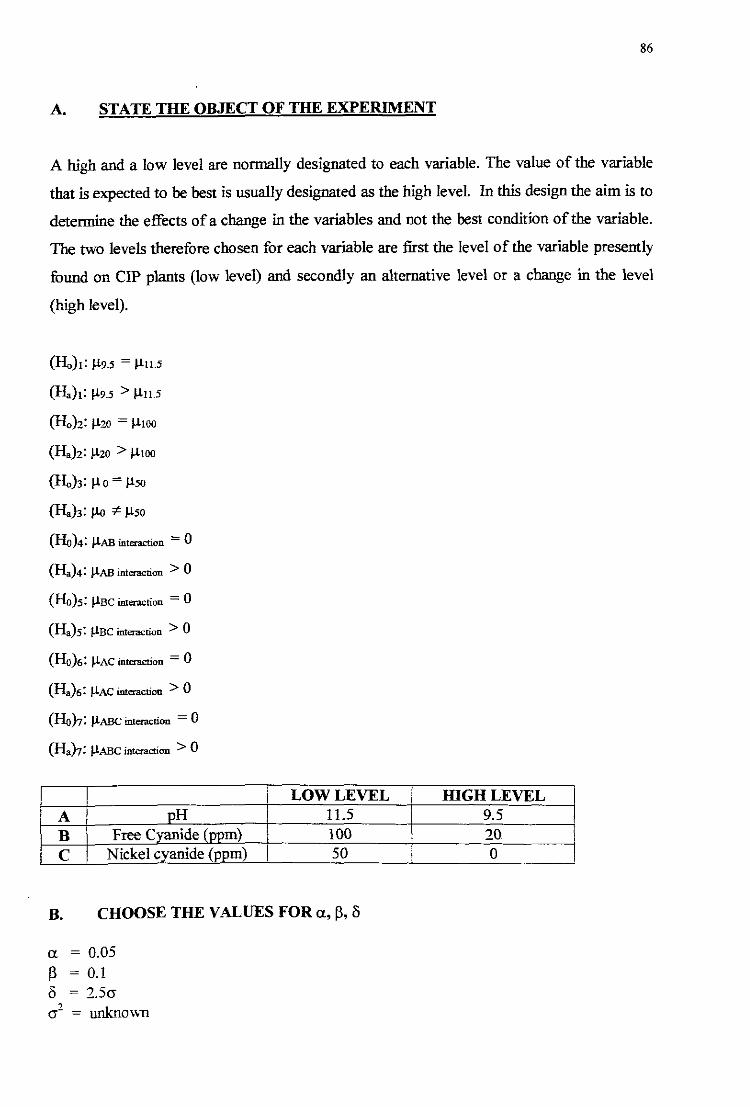
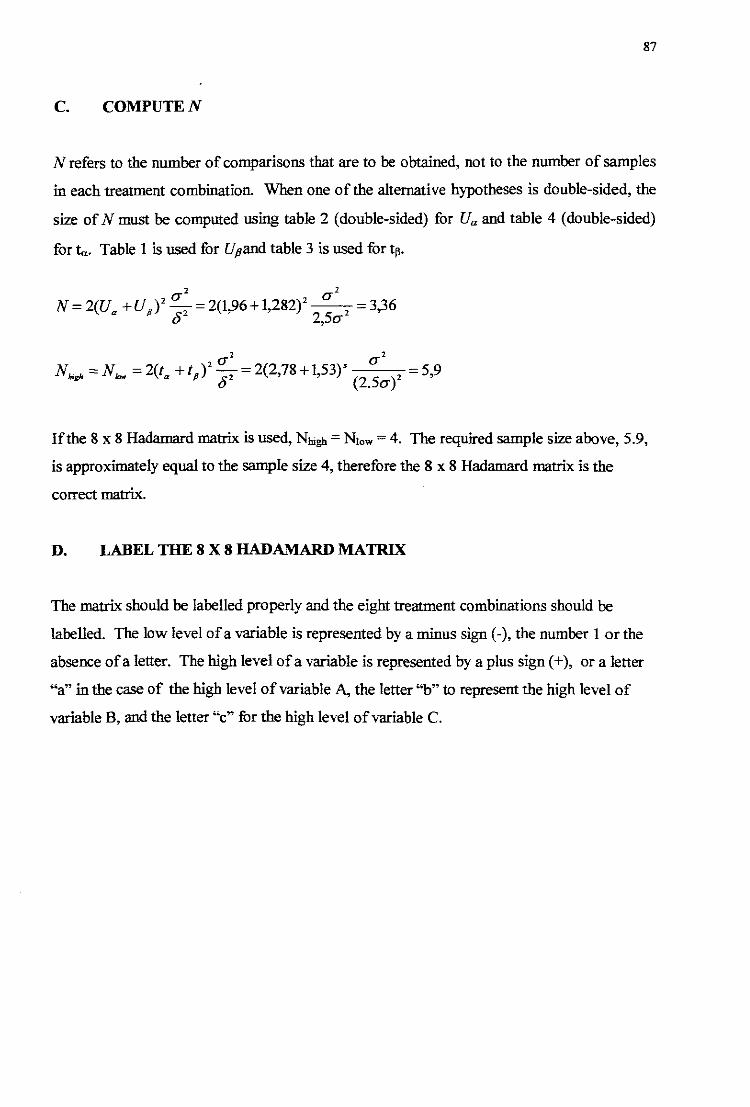
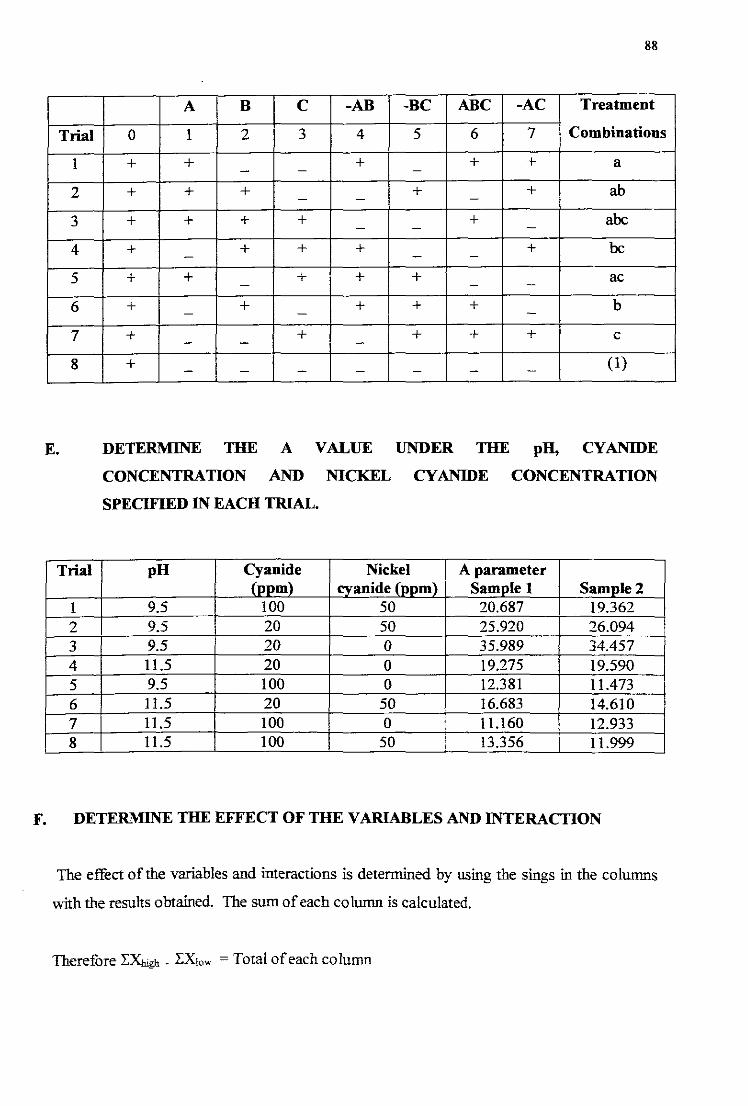
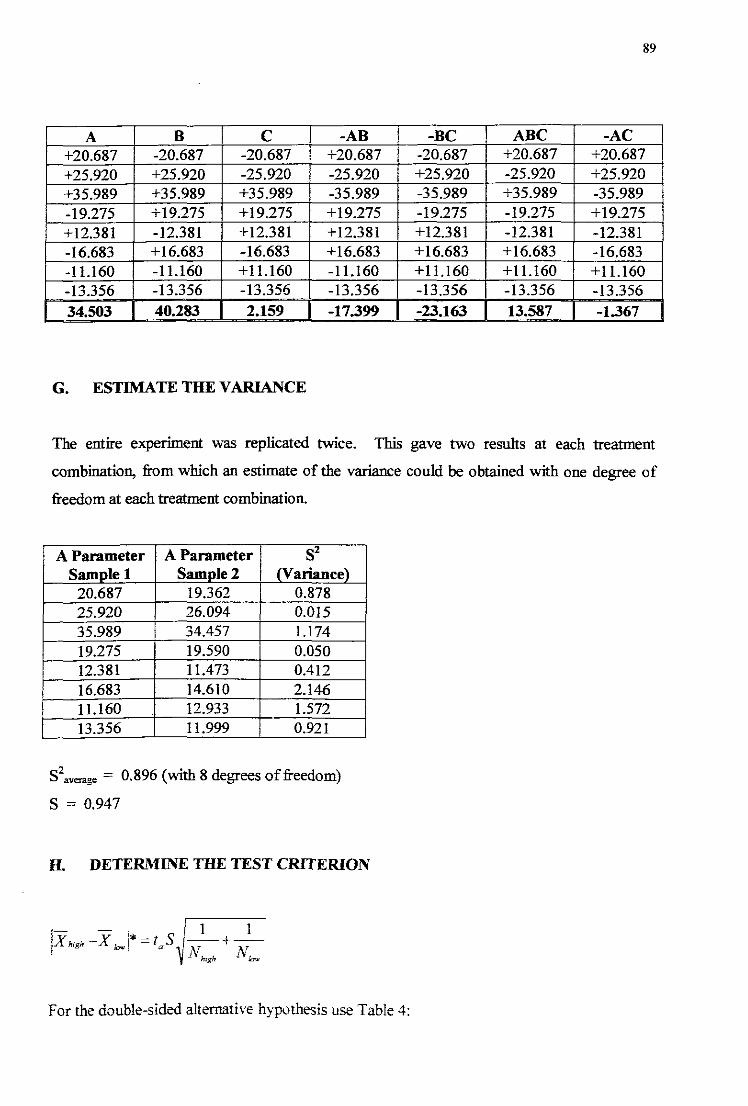
ABSTRACTACKNOWLEDGEMENTSCONTENTSLIST OF FIGURESLIST OF TABLES
iiivvviiix
v
Pages
CHAPTER 1. INTRODUCTION ANDLITERATURE REVIEW 1
1.1 The carbon-in-pulp (CIP) process 2
1.1.1 Loading of gold onto carbon 21.1.2 Elution or stripping ofgold onto carbon 31.1.3 Reactivation ofspent carbon ~
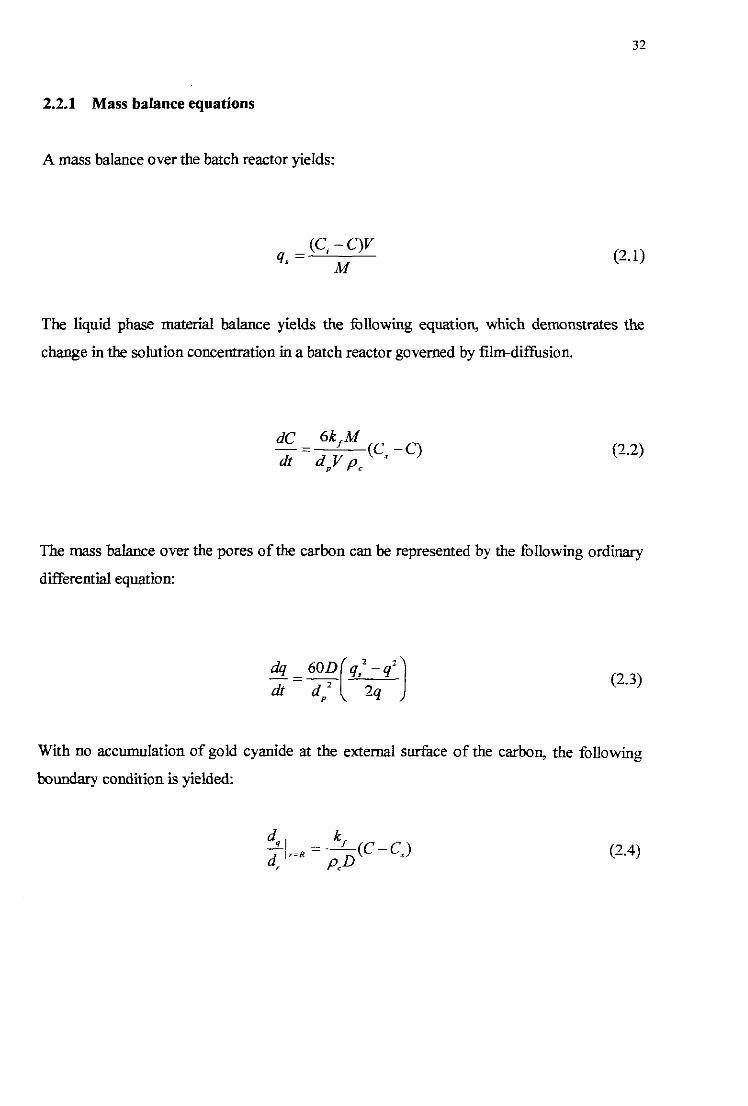
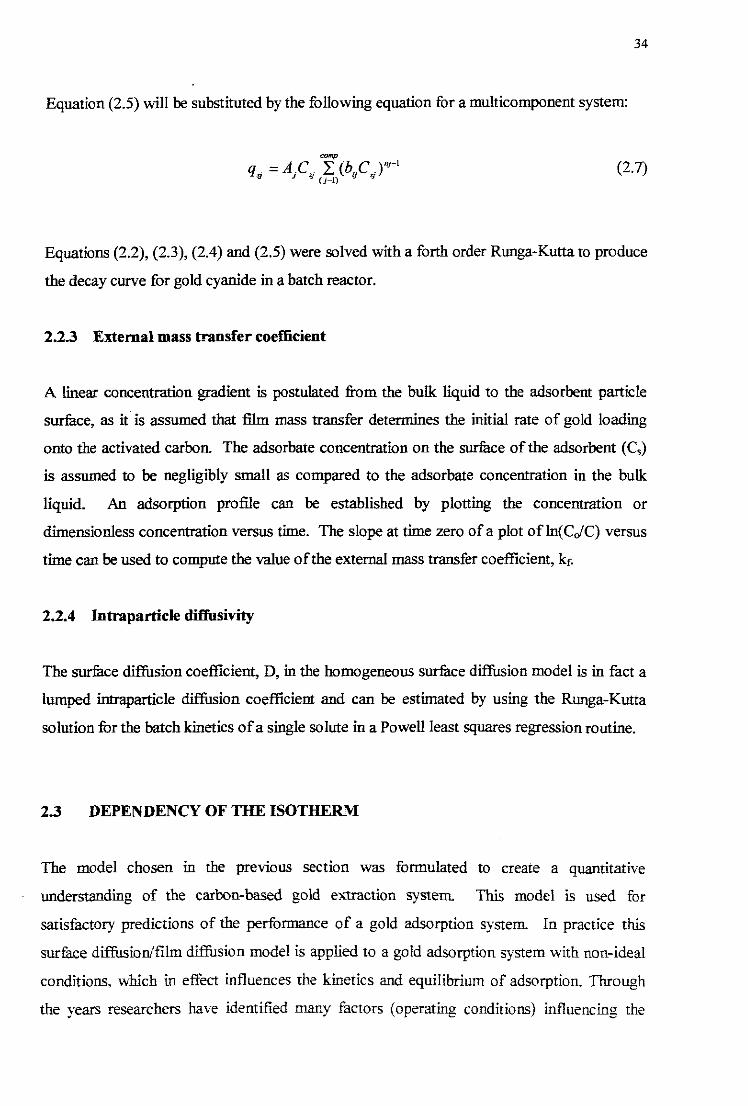
2.2.1 Mass balance equations 322.2.2 Equilibrium isotherm equation 322.2.3 External mass transfer coefficient 342.2.4 Intraparticle diffusivity 34
2.3 Dependency ofthe isotherm 34
CHAPTER 3 EXPERlMENTAL 36
3.1 Factorial Design 36
3.2 Experimental Material 37
3.3 Experimental set-up 38
3.4 Equilibrium tests 39
3.5 Analytical methods and procedures 39
3.5.1 Metal Complex analyses 393.5.2 Free cyanide analyses 40
CHAPTER 4 DETERt"IINING SIGNIFICAc"lTFACTORS CAUSING AN ISOTHERMSHIFT 42
4.1 Factors eliminated 43
vii
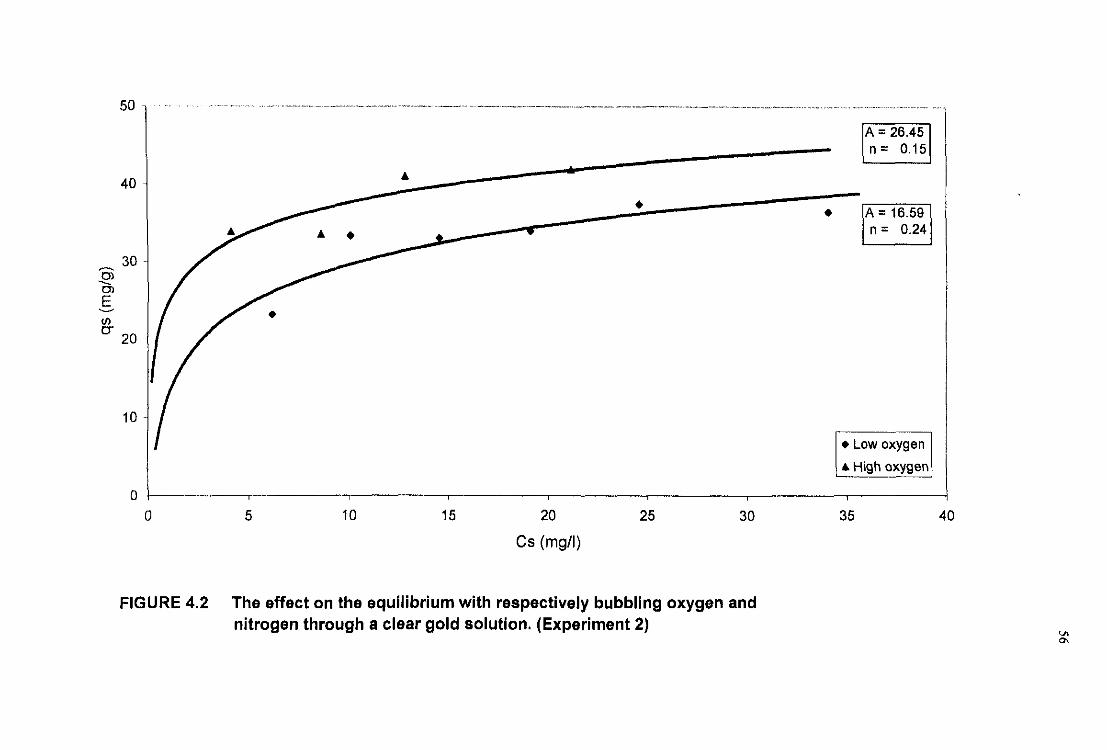
4.1.1 The effect of ionic strength 434.1.2 The effect ofoxygen concentration 434.1.3 The effect oforganic fouling 45
4.2 Selecting key factors 45
4.2.1 The effect ofpH 464.2.2 The effect of free cyanide concentration 47
4.2.2.1 Free cyanide degradation 474.2.2.2 The influence ofcyanide decay on
equilibrium 484.2.3 The interaction between pH and free cyanide
concentration 484.2.4 The effect ofcompeting ions 49
4.3 Summary 50
CHAPTERS APPLICATION OF MODIFIEDISOTHERM 68
5.1 A single component isotherm 68
5.2 A modified isotherm 69
CHAPTER 6
CHAPTER 7
APPENDIX 1
APPENDIX 2
NOMENCL;\TURE
CONCLUSIONS ANDRECOMMENDATIONS
REFERENCES
A FACTORIAL DESIGN FORDETERMINING THE IMPACT OFCHANGES OF OPERATING VARIABLESON THE EQUILIBRIUM ISOTHERM INA BATCH REACTOR
TABULATION OF EXPERIMENTALRESULTS
75
78
85
94
107
LIST OF FIGURES
viii
Pages
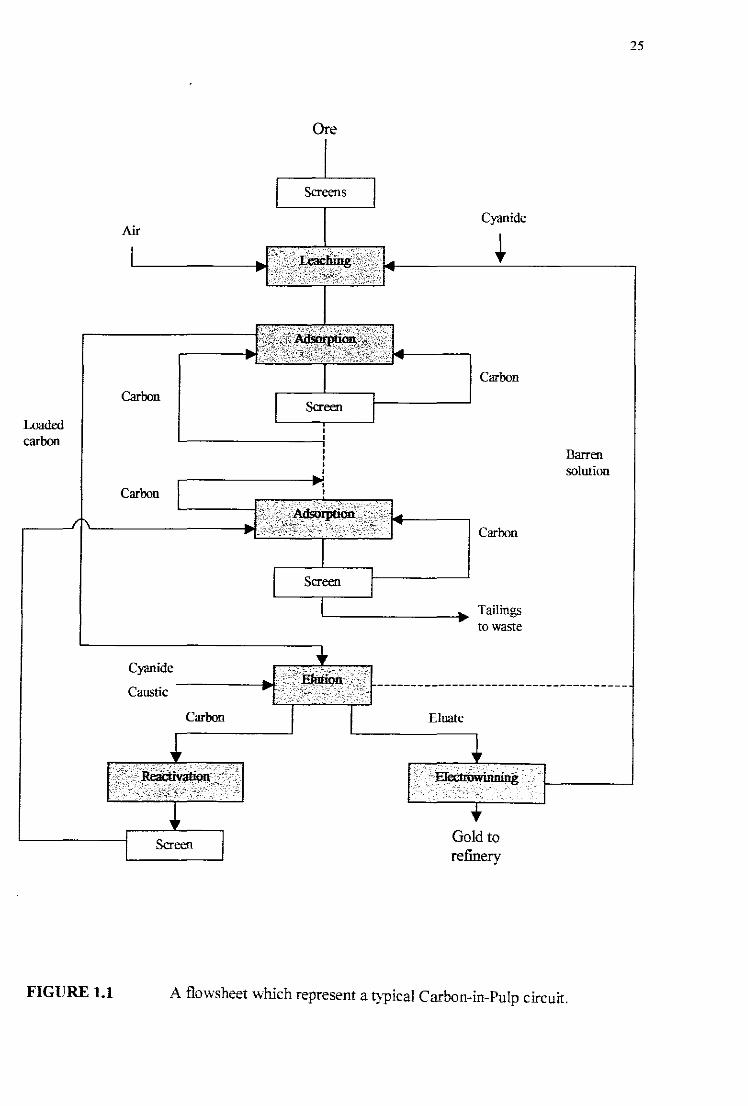
Figure 1.1 A flowsheet which represent a typical Carbon-in-Pulp circuit 25
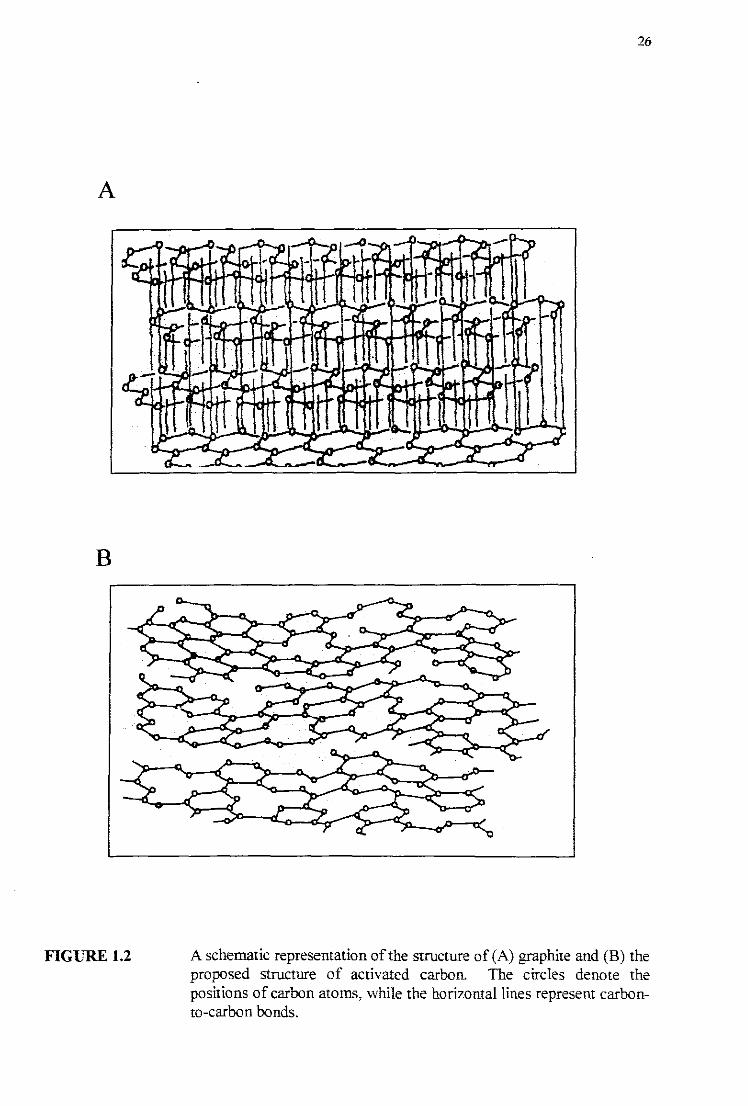
Figure 1.2 A schematic representation of the structure of (A) graphite
and (B) the proposed structure ofactivated carbon 26
Figure 1.3 The structure ofa basal plane in a steam activated carbon 27
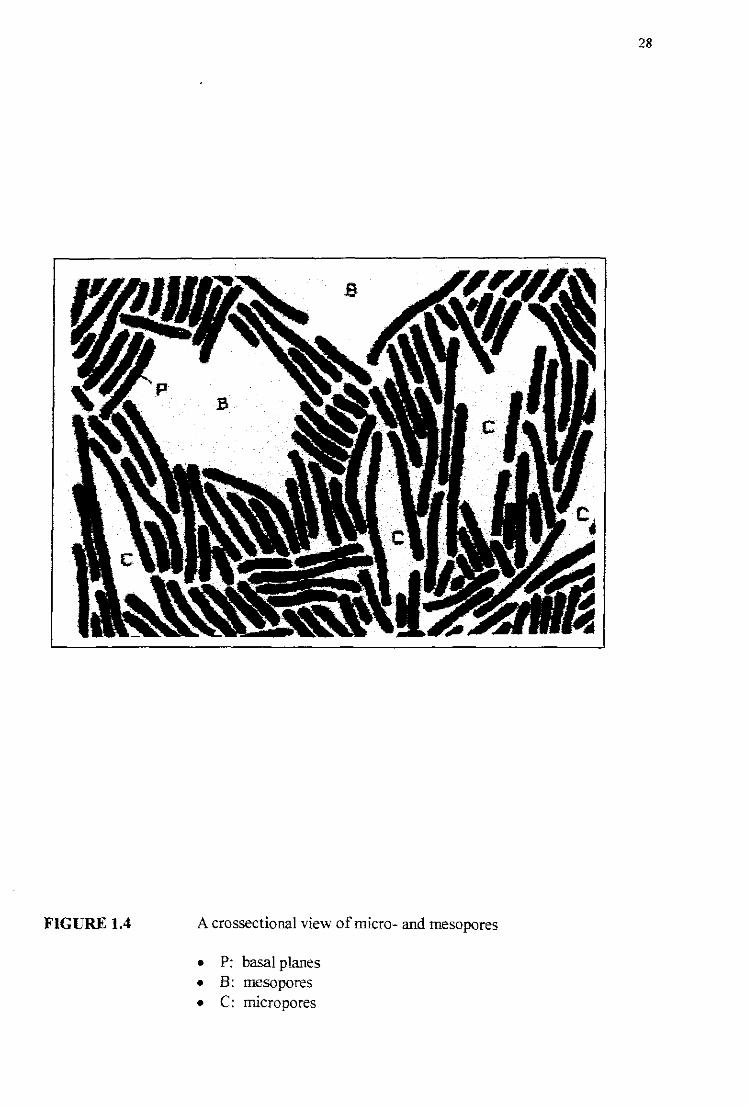
Figure 1.4 A crossectional view ofmicro- and mesopores 28
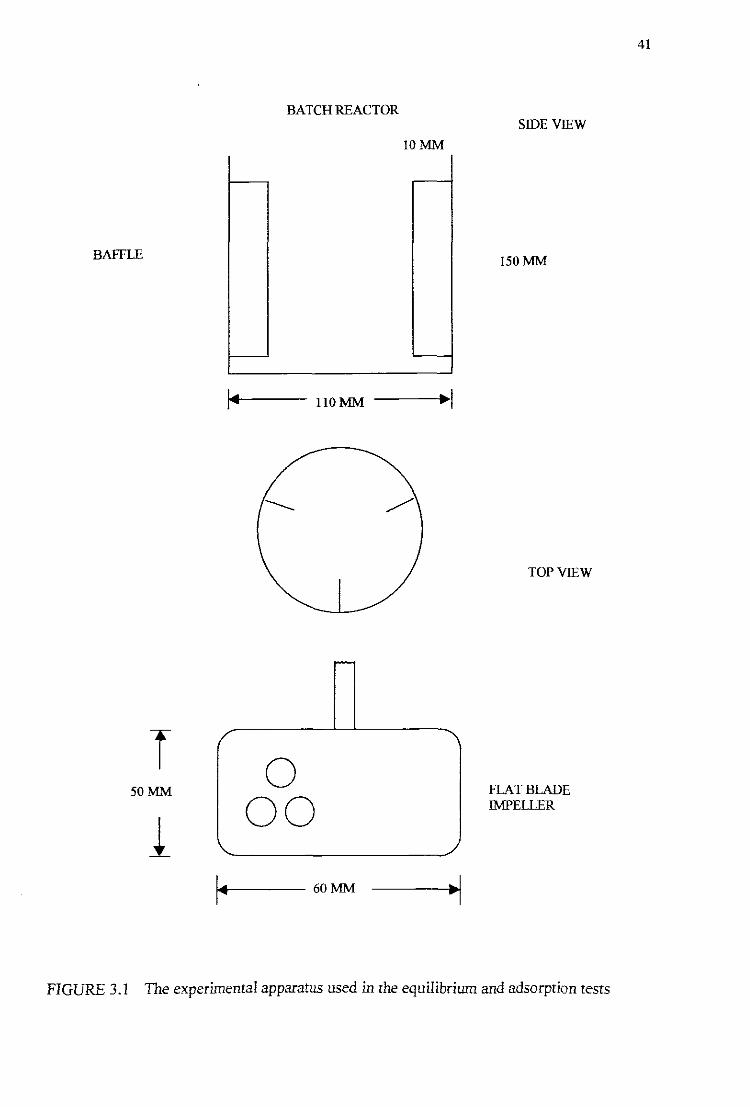
Figure 3.1 The experimental apparatus used in the equilibrium andadsorption tests 41
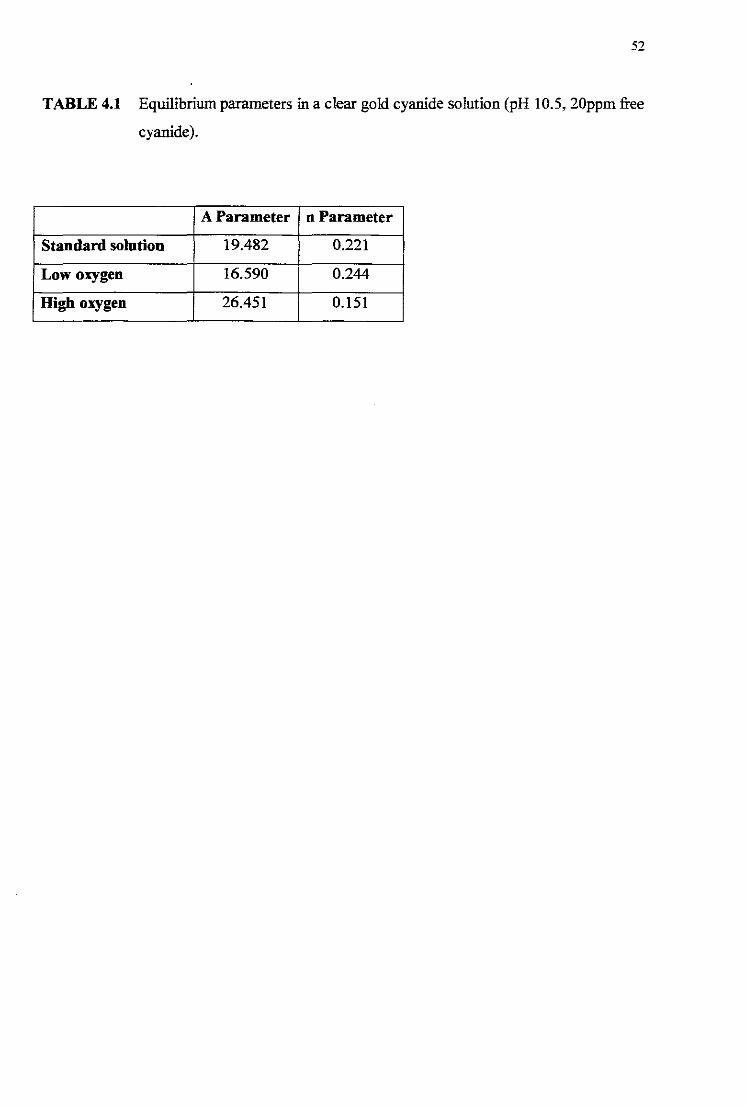
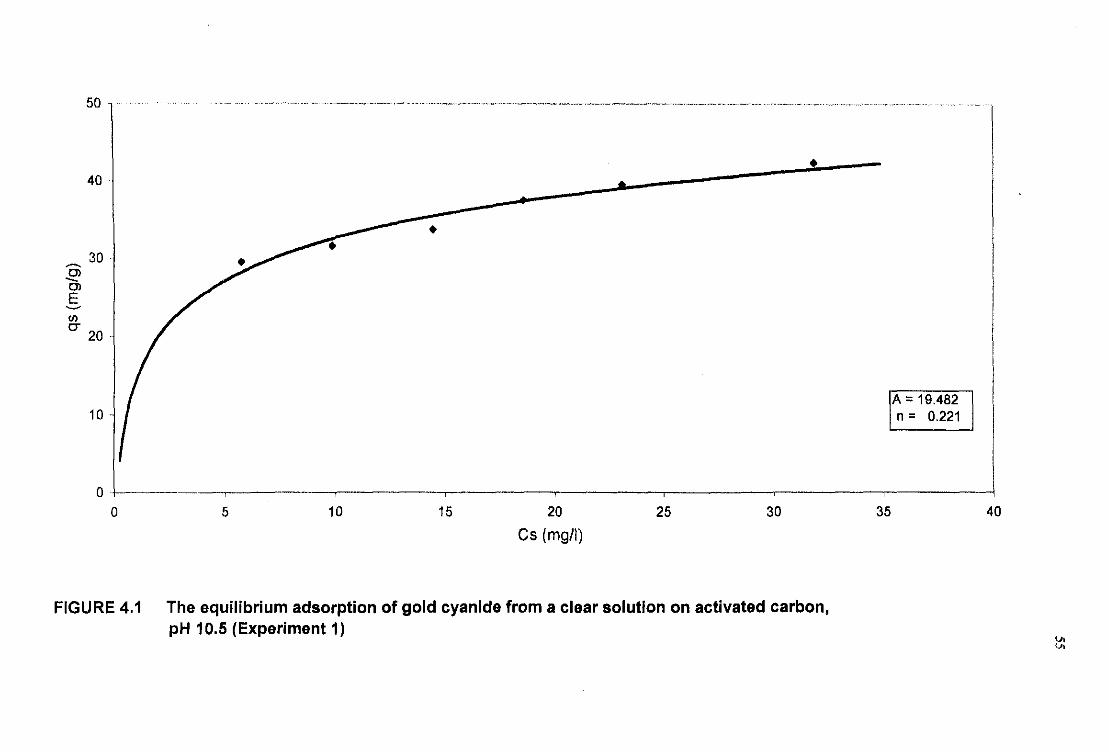
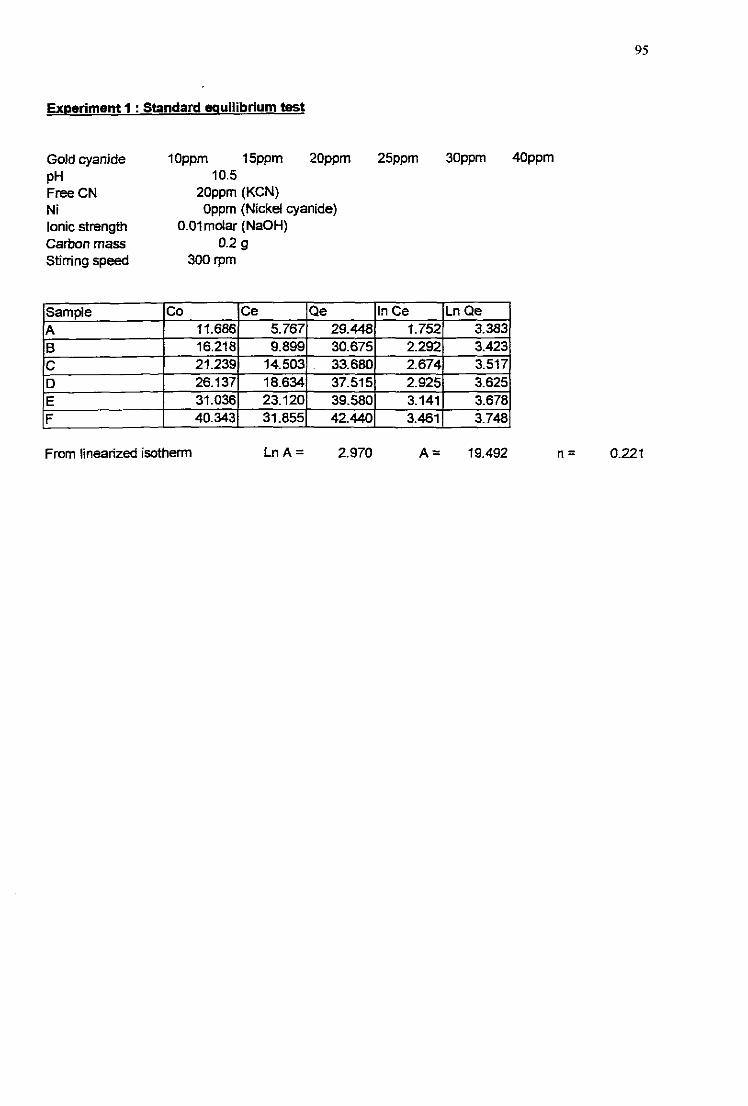
Figure 4.1 The equilibrium adsorption ofgold cyanide from a clear solution 55on activated carbon, pH 10.5 (Experiment 1)
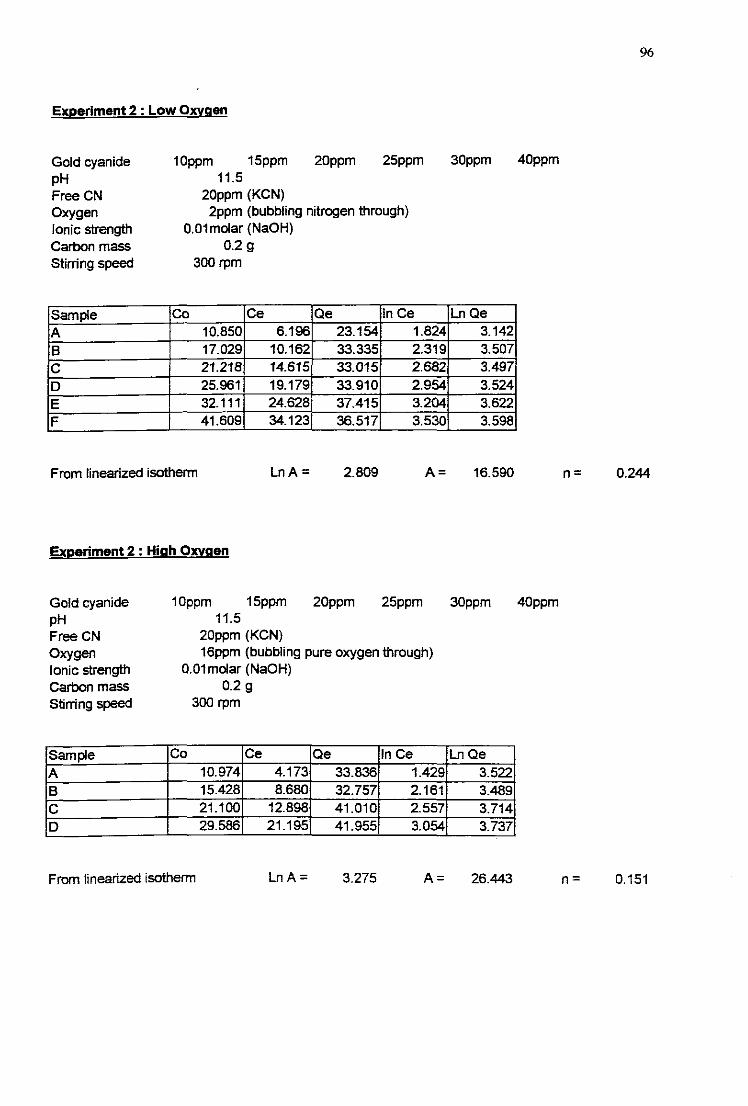
Figure 4.2 The effect on the equilibrium with respectively bubbling oxygenand nitrogen through a clear gold solution. (Experiment 2) 56
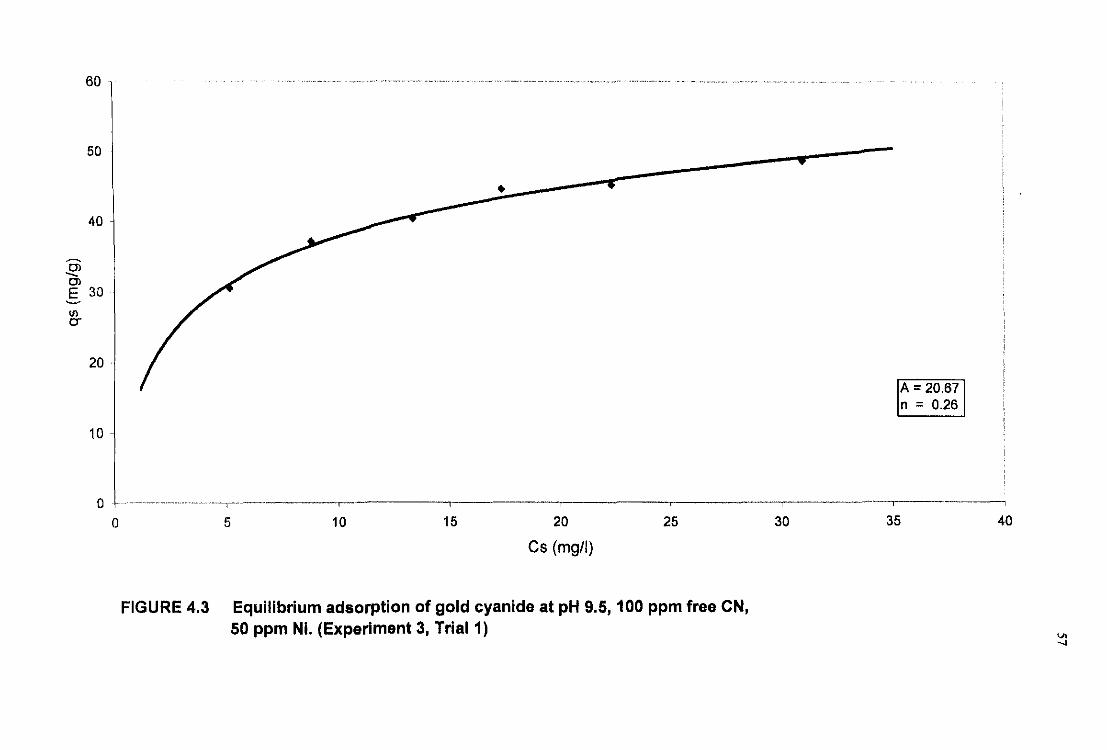
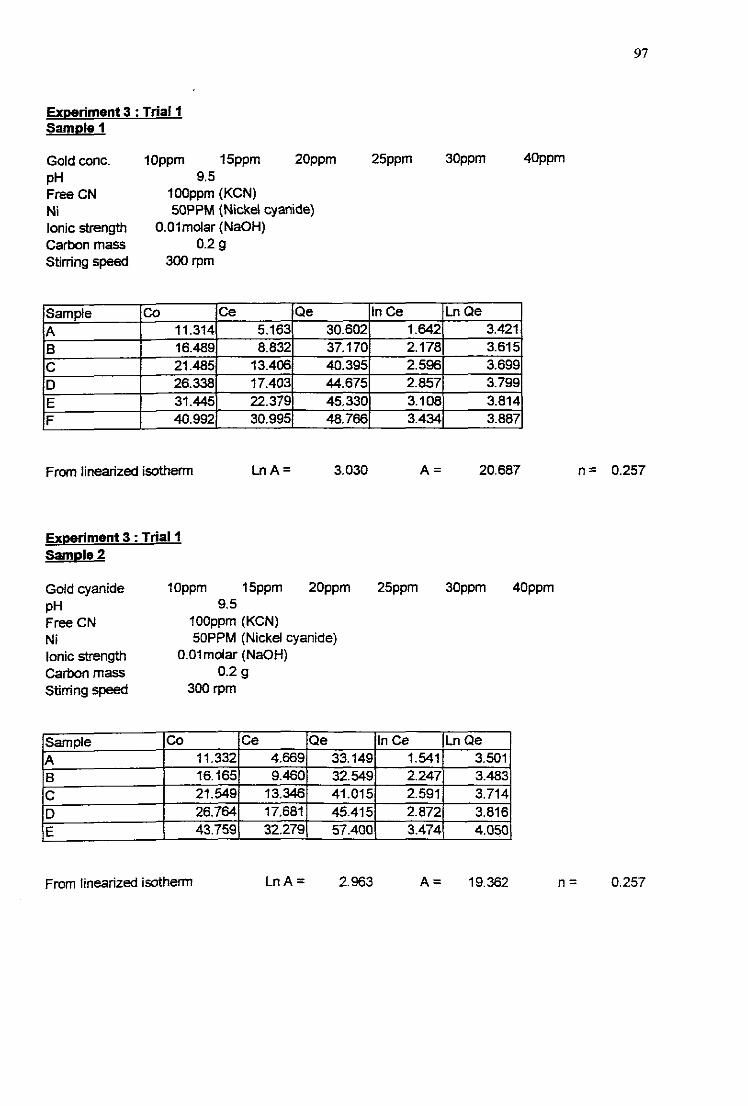
Figure 4.3 Equilibrium adsorption ofgold cyanide at pH 9.5, 100 ppmfree CN, 50 ppm Ni (Experiment 3, Trial 1) 57
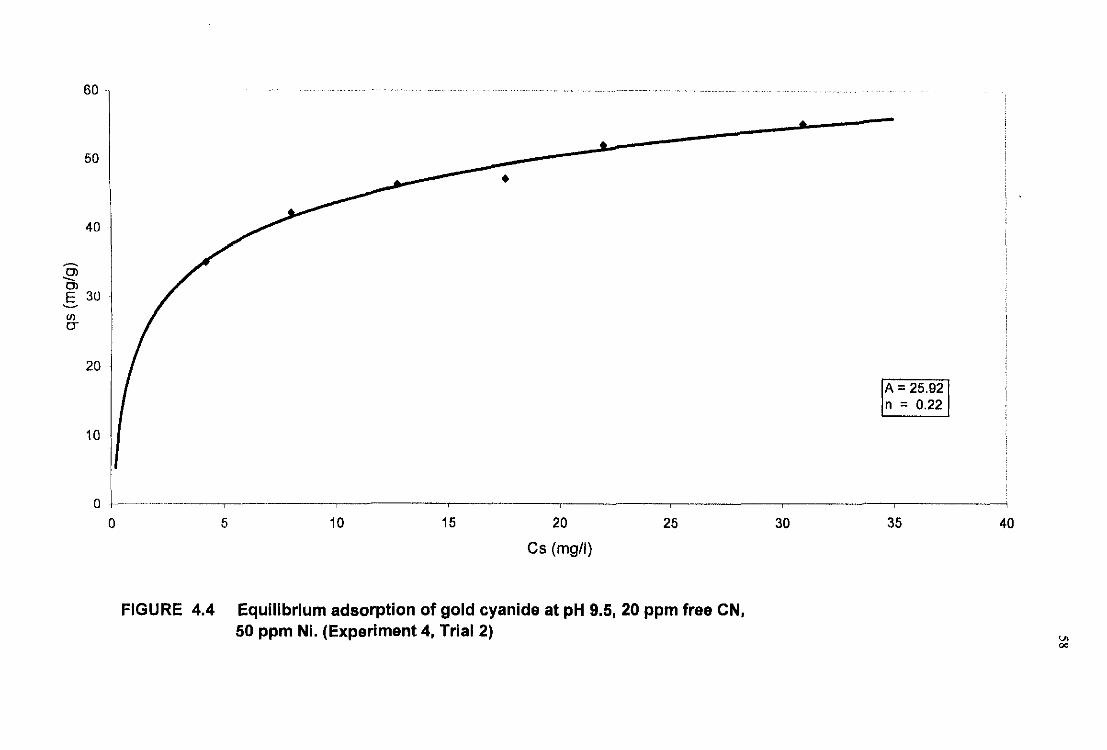
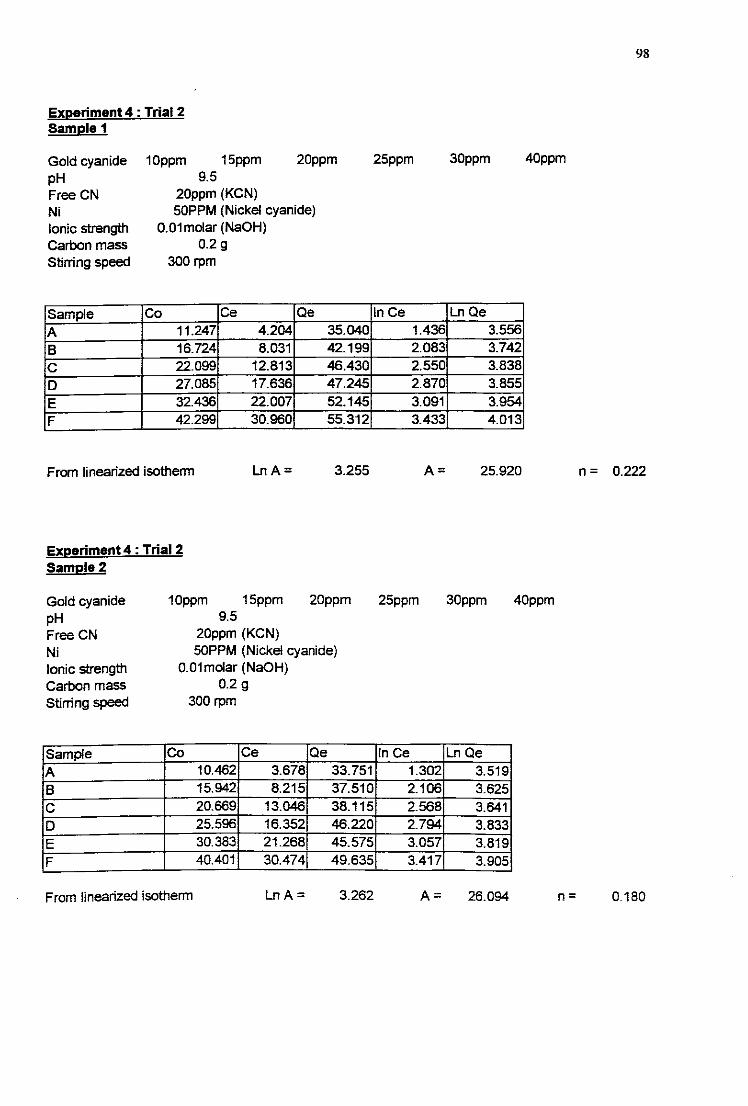
Figure 4.4 Equilibrium adsorption ofgold cyanide at pH 9.5,20 ppmfree CN, 50 ppm Ni (Experiment 4, Trial 2) 58
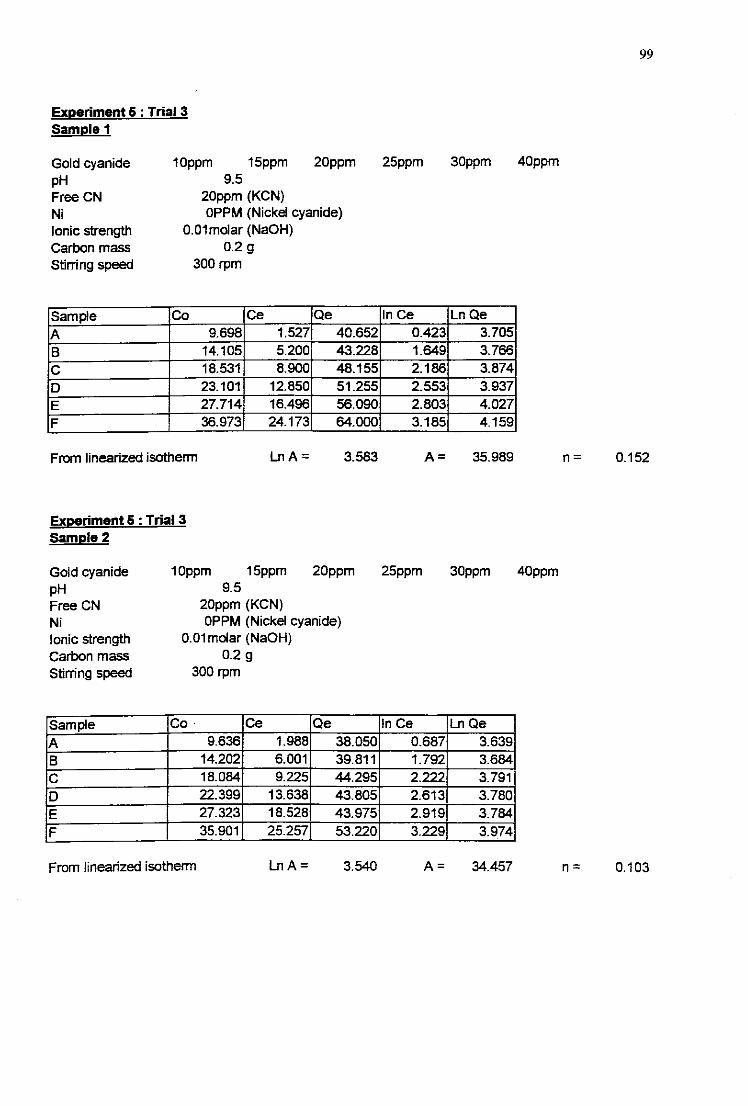
Figure 4.5 Equilibrium adsorption ofgold cyanide at pH 9.5,20 ppmfree CN, 0 ppm Ni (Experiment 5, Trial 3) 59
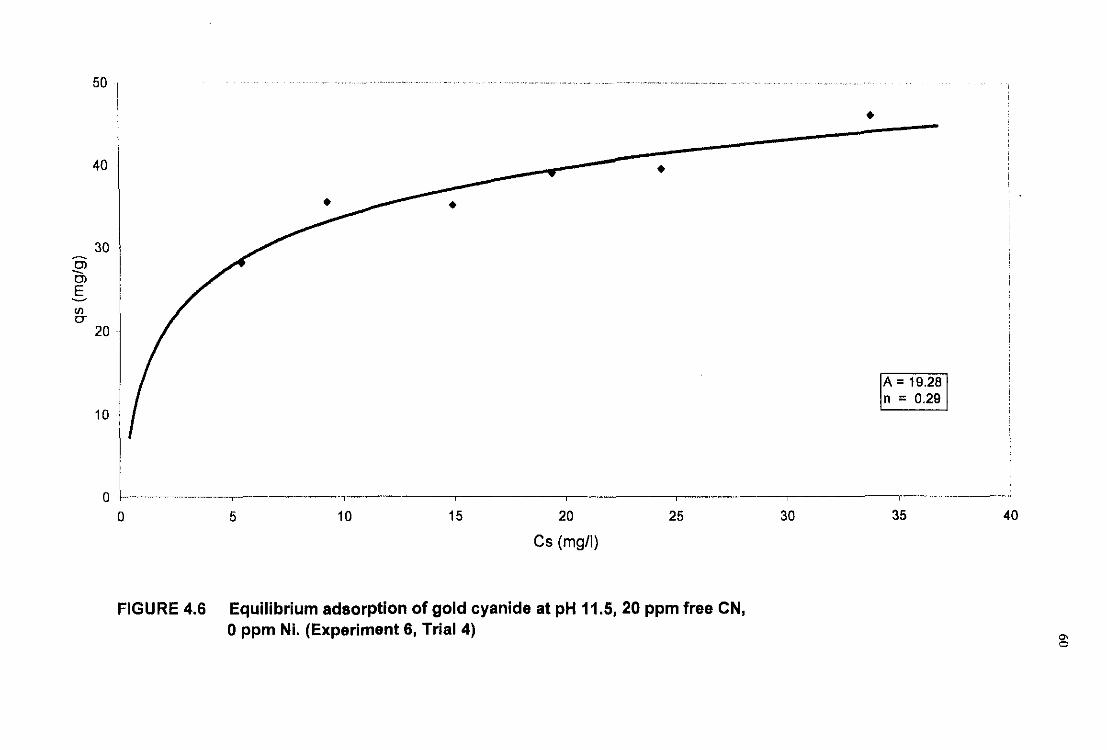
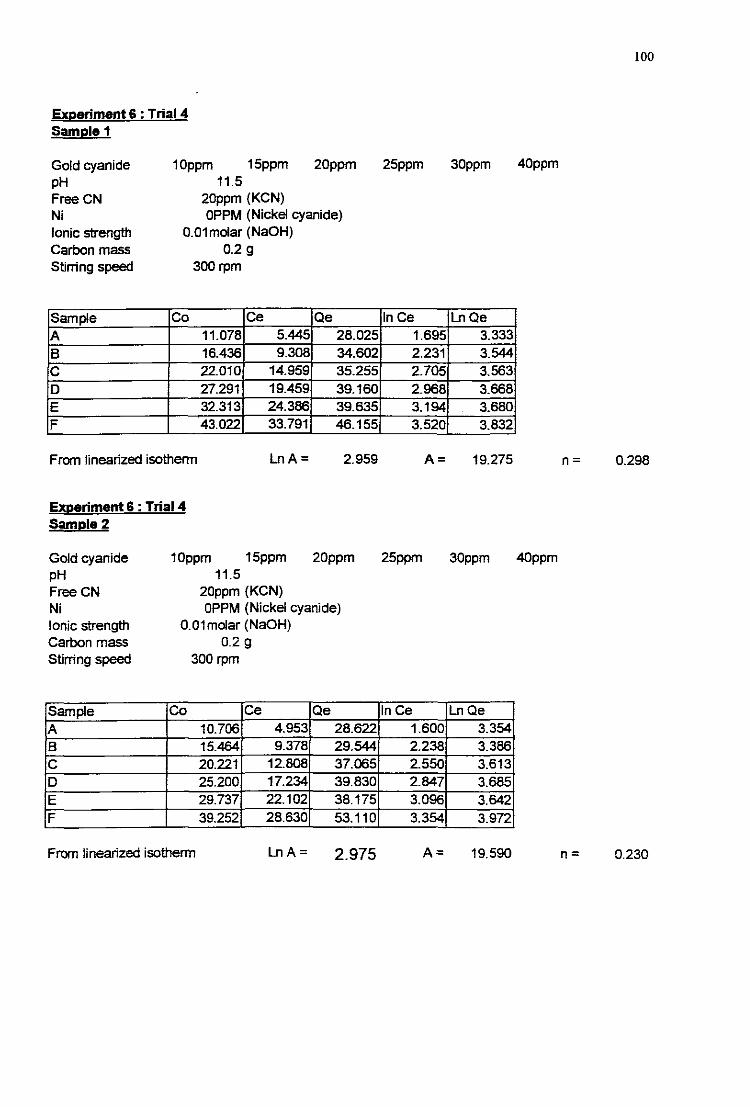
Figure 4.6 Equilibrium adsorption ofgold cyanide at pH 11.5, 20 ppmfree CN, 0 ppm Ni (Experiment 6, Tria14) 60
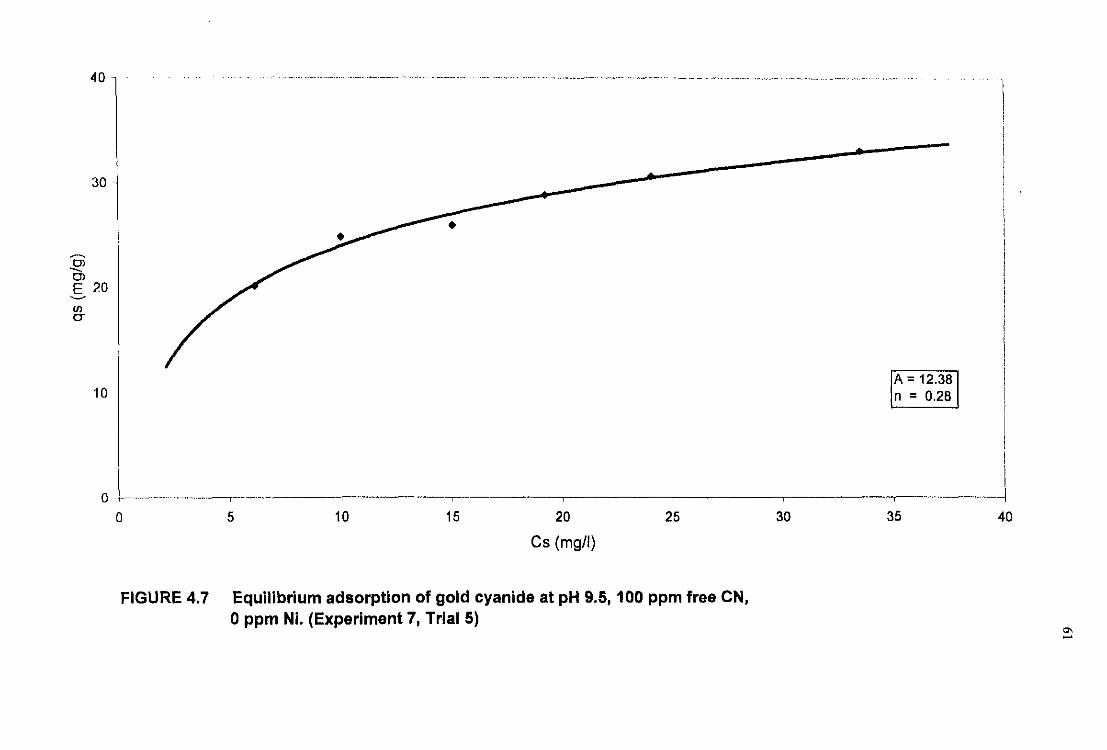
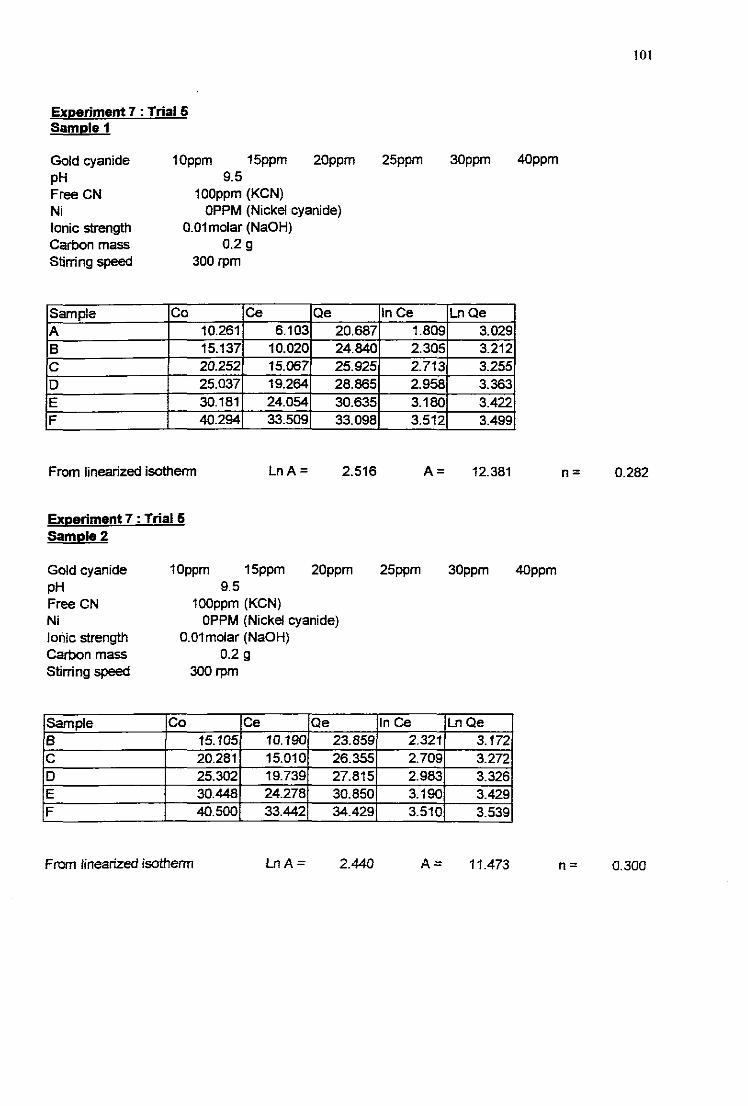
Figure 4.7 Equilibrium adsorption ofgold cyanide at pH 9.5, 100 ppmfree CN, 0 ppm Ni (Experiment 7, TrialS) 61
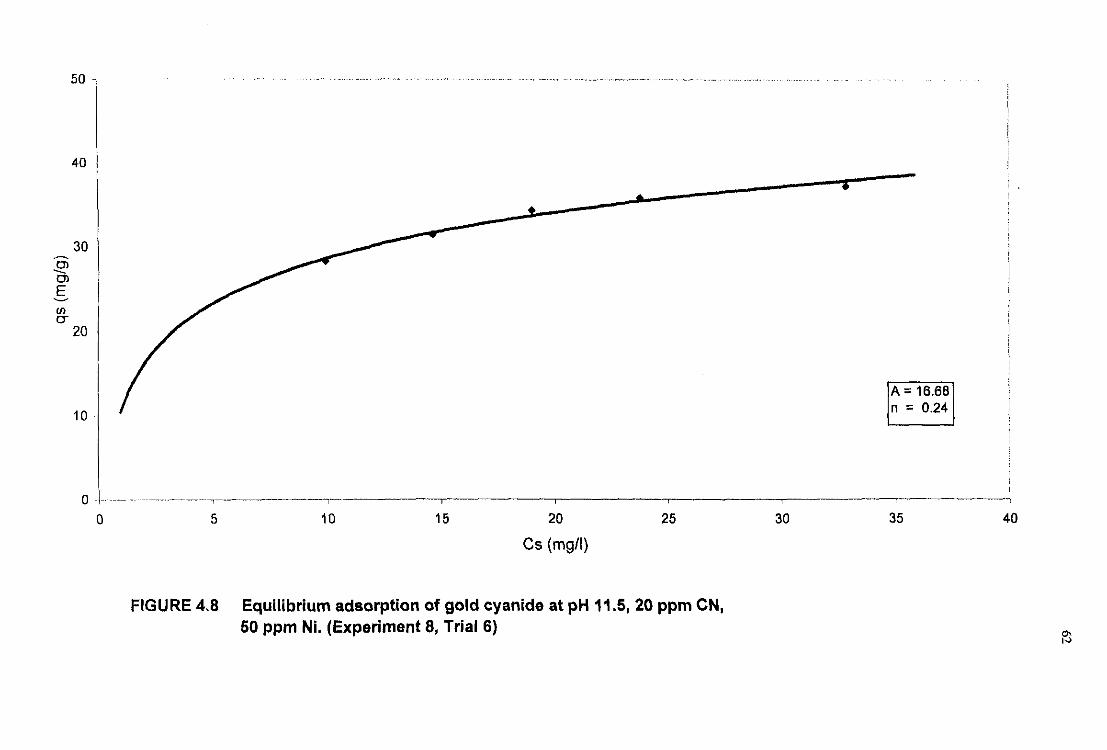
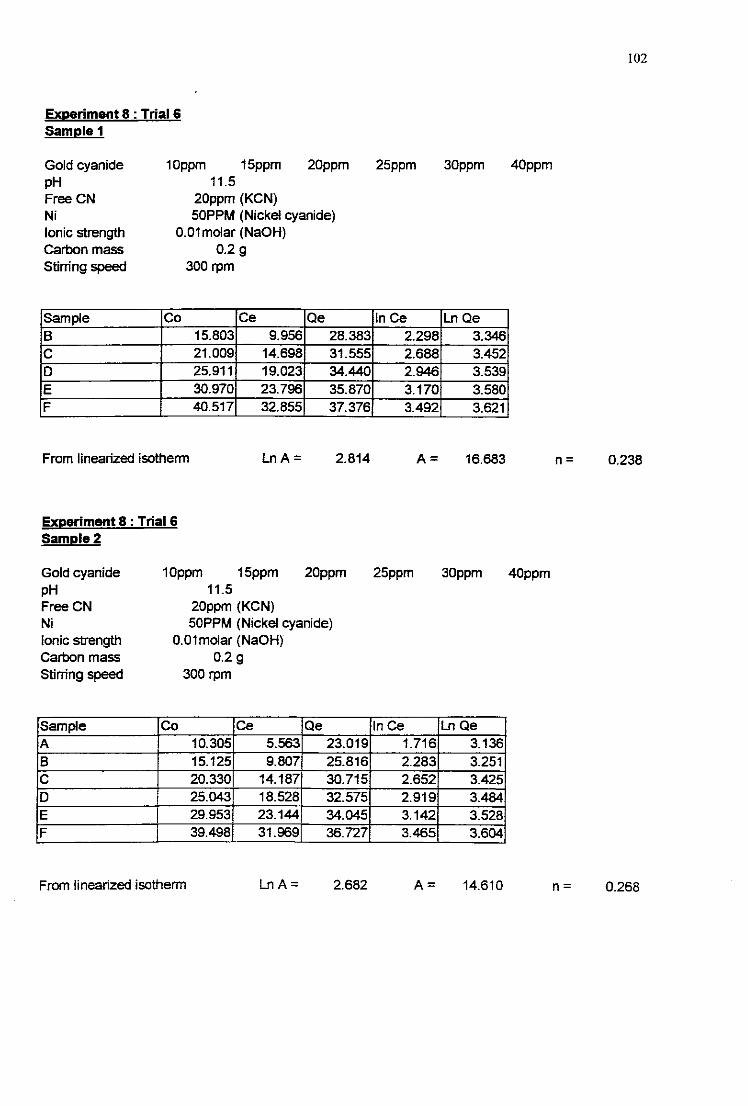
Figure 4.8 Equilibrium adsorption ofgold cyanide at pH 11.5, 20 ppmfree CN, 50 ppm Ni (Experiment 8, Trial 6) 62
Figure 4.9 Equilibrium adsorption ofgold cyanide at pH 11.5, 100 ppmfree CN, 0 ppm Ni (Experiment 9, Trial 7) 63
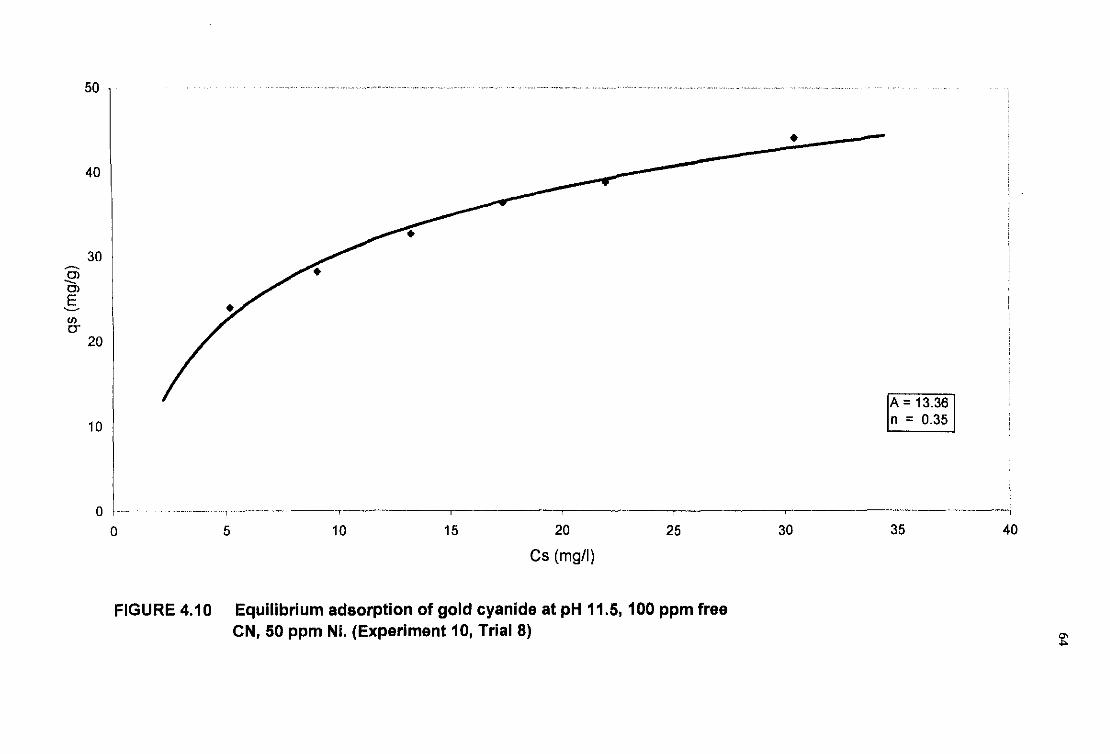
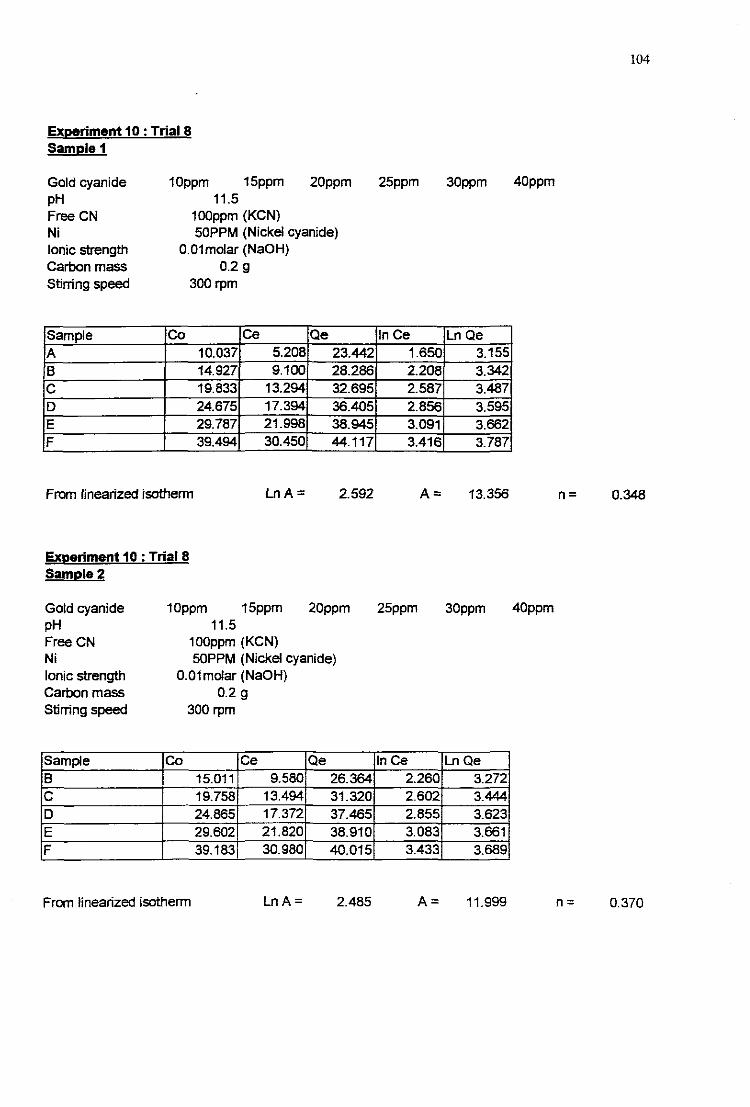
Figure 4.10 Equilibrium adsorption ofgold cyanide at pH 11.5, 100 ppmfree eN, 50 ppm Ni (Experiment 10, Trial 8) 64
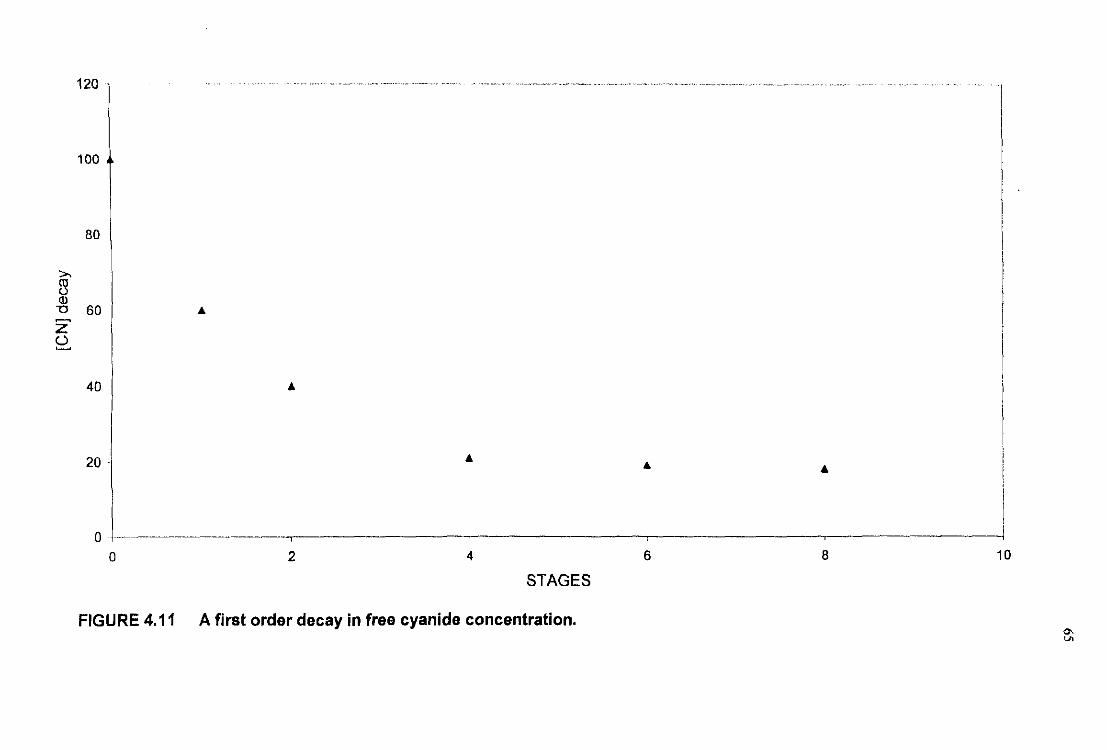
Figure 4.11 A fIrst order decay i'l free cyanide concentration 65
ix
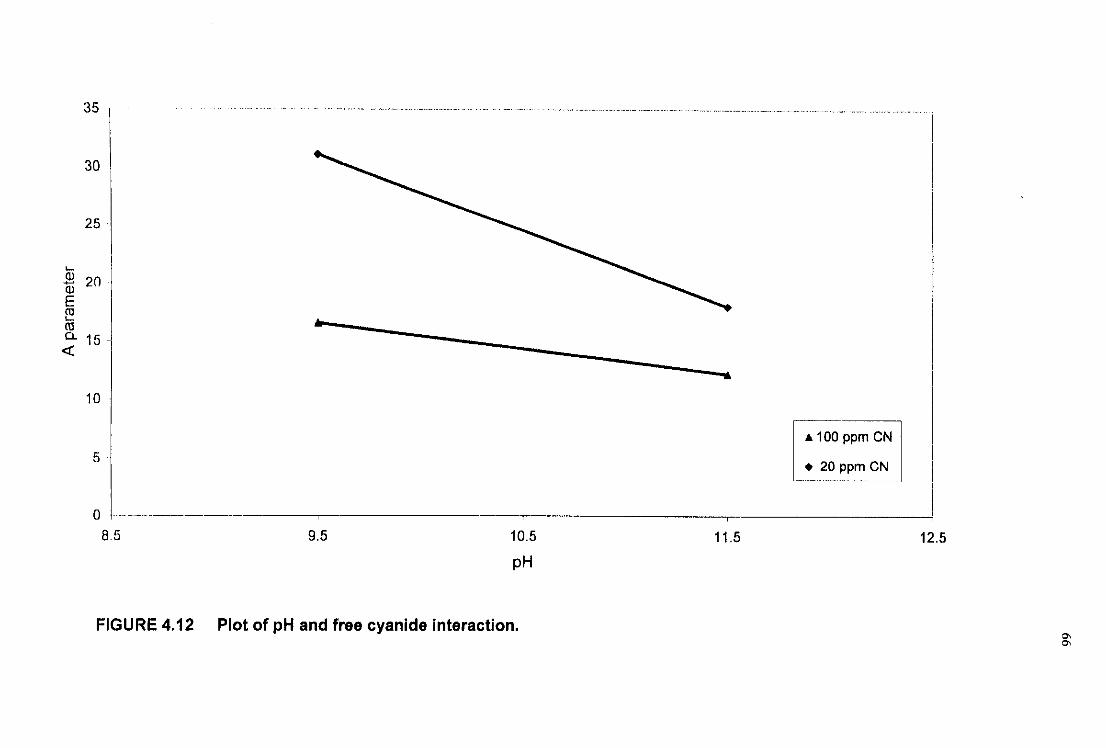
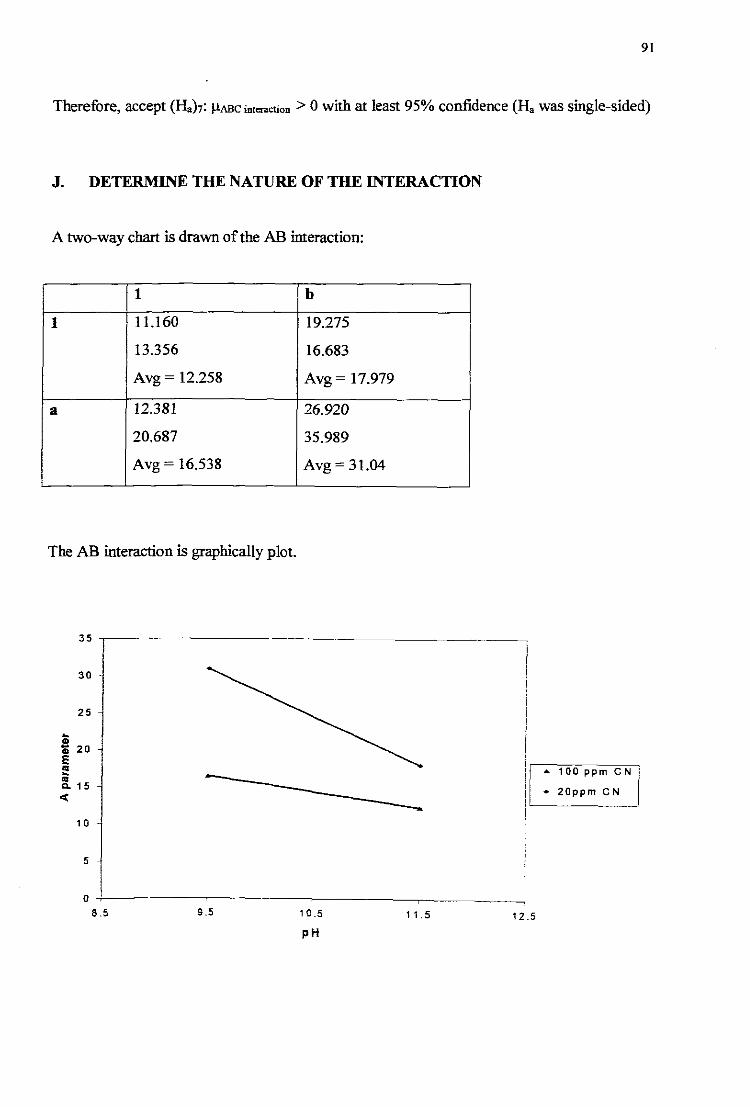
Figure 4.12 Plot ofpH and free cyanide interaction 66
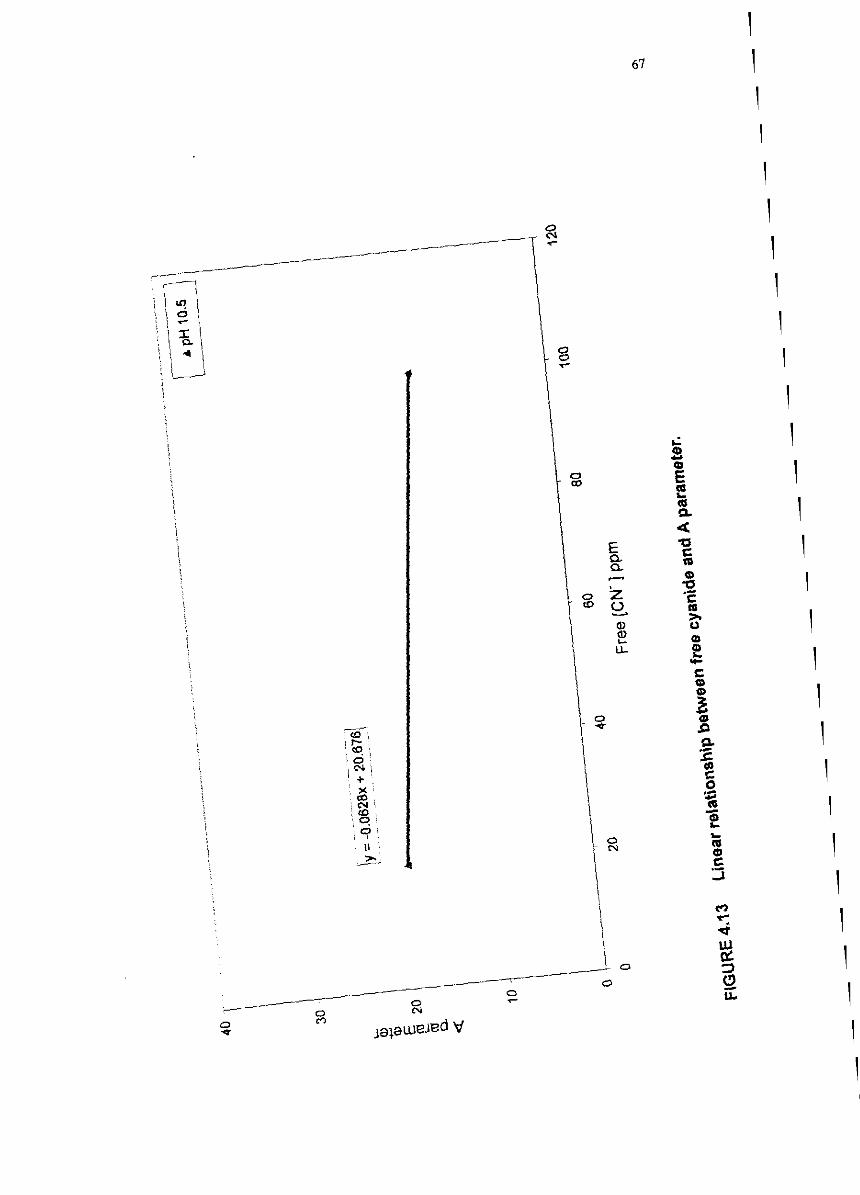
Figure 4.13 Linear relationship between free cyanide and A parameter 67
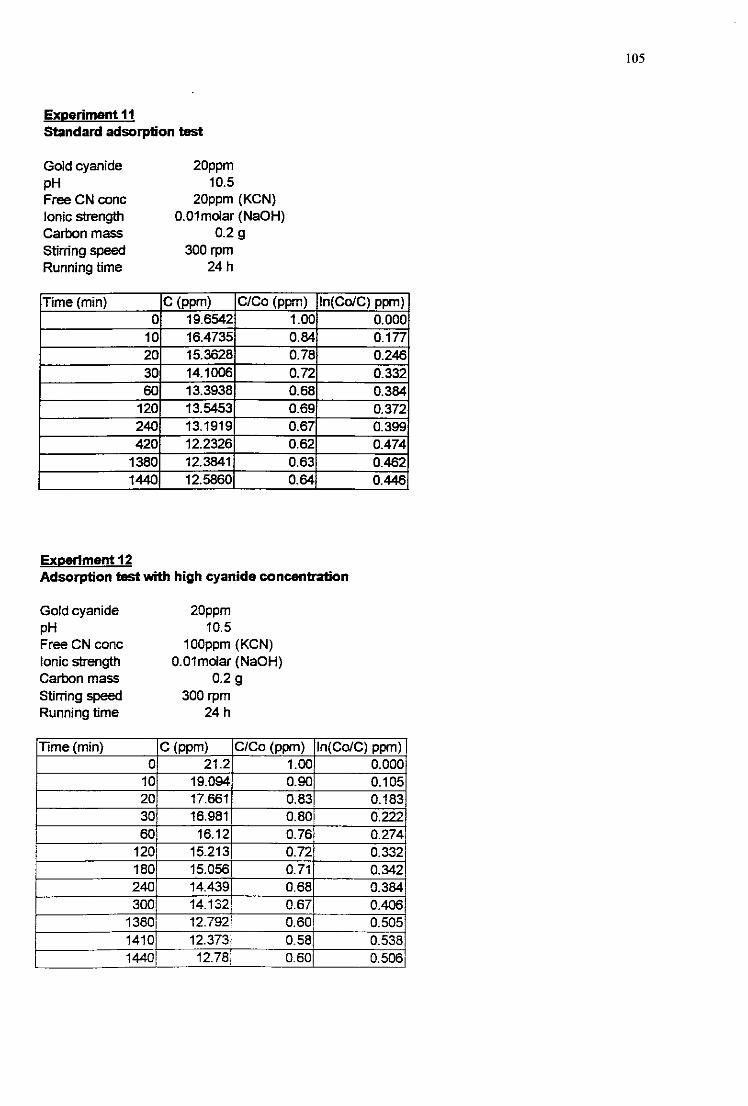
Figure 5.1 Adsorption profile for a clear gold solution (Experiment 11) 72
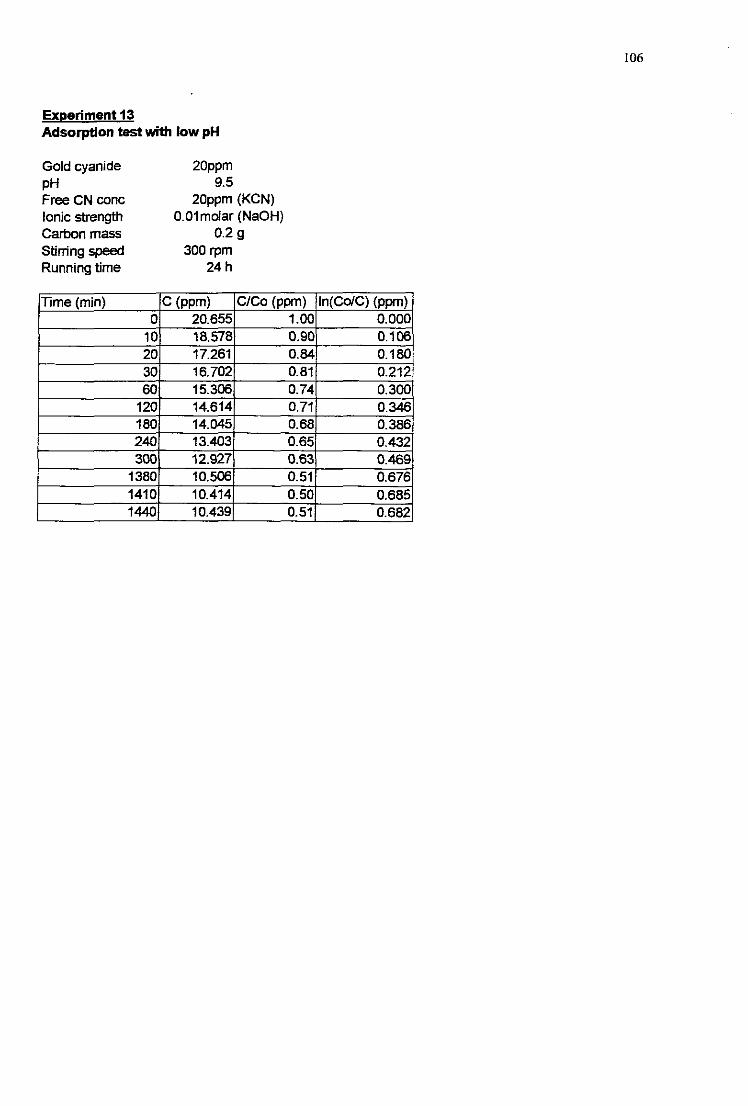
Figure 5.2 The effect ofa change in pH and free cyanide concentrationalternatively on the adsorption profile ofa clear gold solution(Experiments 11, 12, 13) 73
Figure 5.3 Adsorption profile for a clear gold solution fitted with modifiedmodel 74
LIST OF TABLES
x
Pages
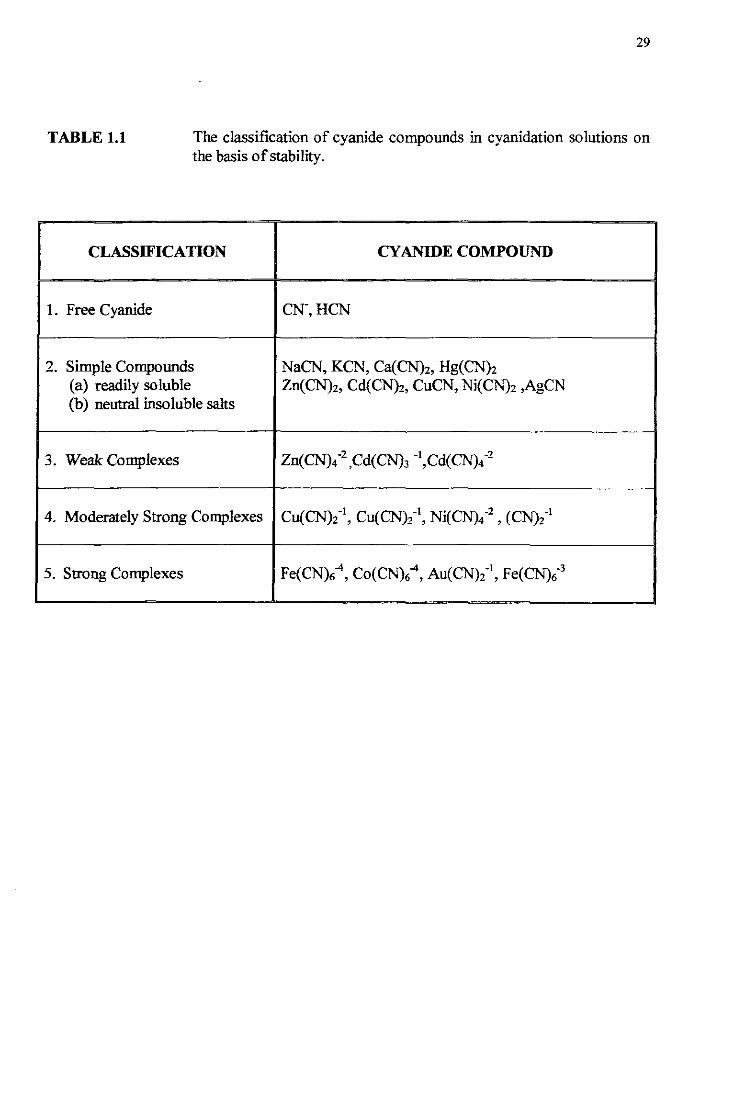
Table 1.1 The classification ofcyanide compounds in cyanidationsolutions on the basis of stability. 29
Table 4.1 Equilibrium parameters in a clear gold cyanide solution(pH 10.5,20 ppm free cyanide). 52
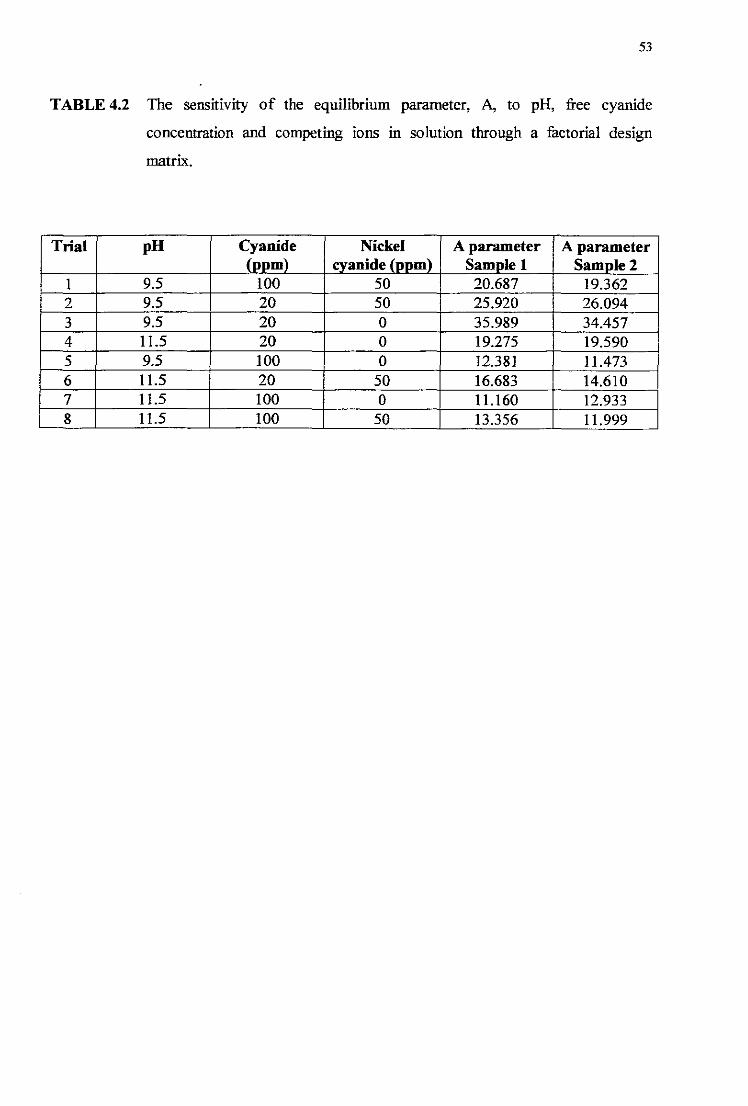
Table 4.2 The sensitivity of the equilibrium parameter, A, to pH,free cyanide concentration and competing ions in solutionthrough a factorial design matrix. 53
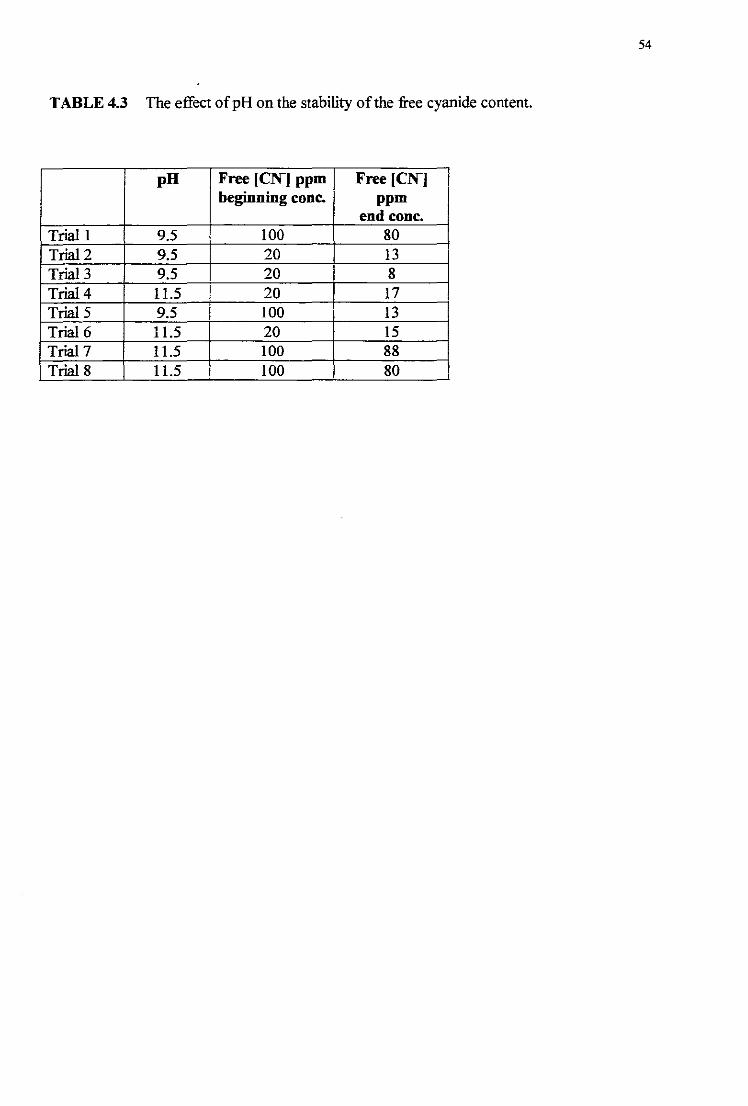
Table 4.3 The effect ofpH on the stability of the free cyanide content. 54
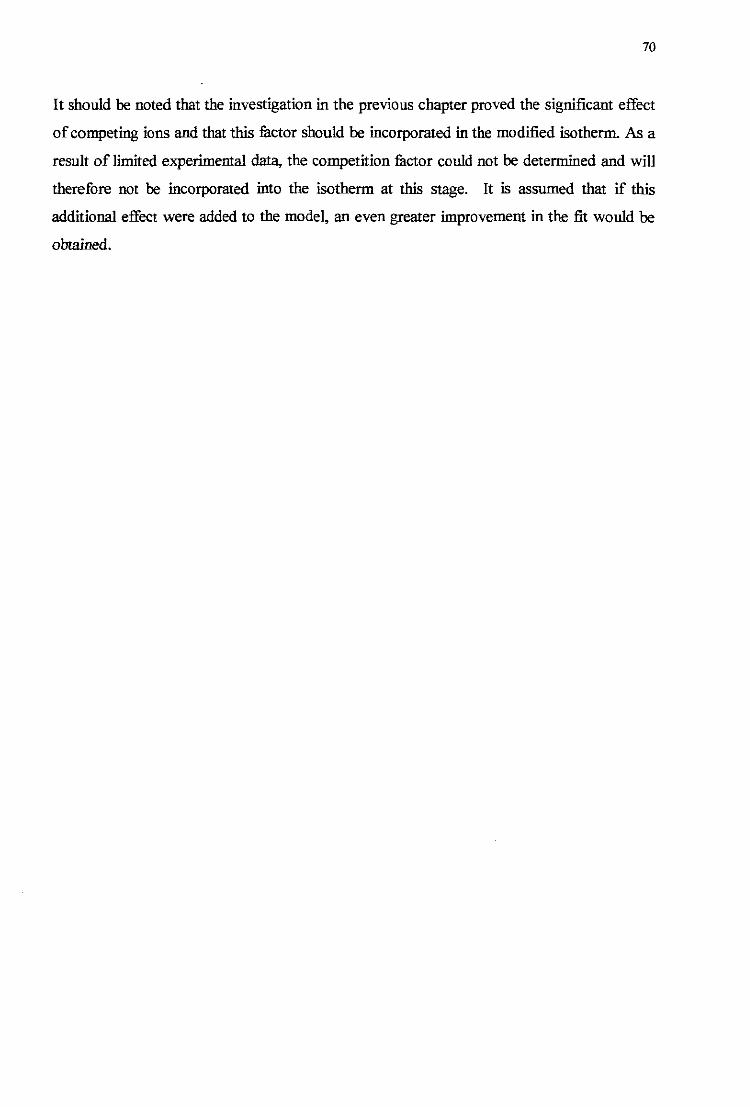
Table 5.1 The kinetic and equilibrium parameters estimated in a cleargold cyanide solution at pH 10.5 and free CN content of20ppm. 71
1
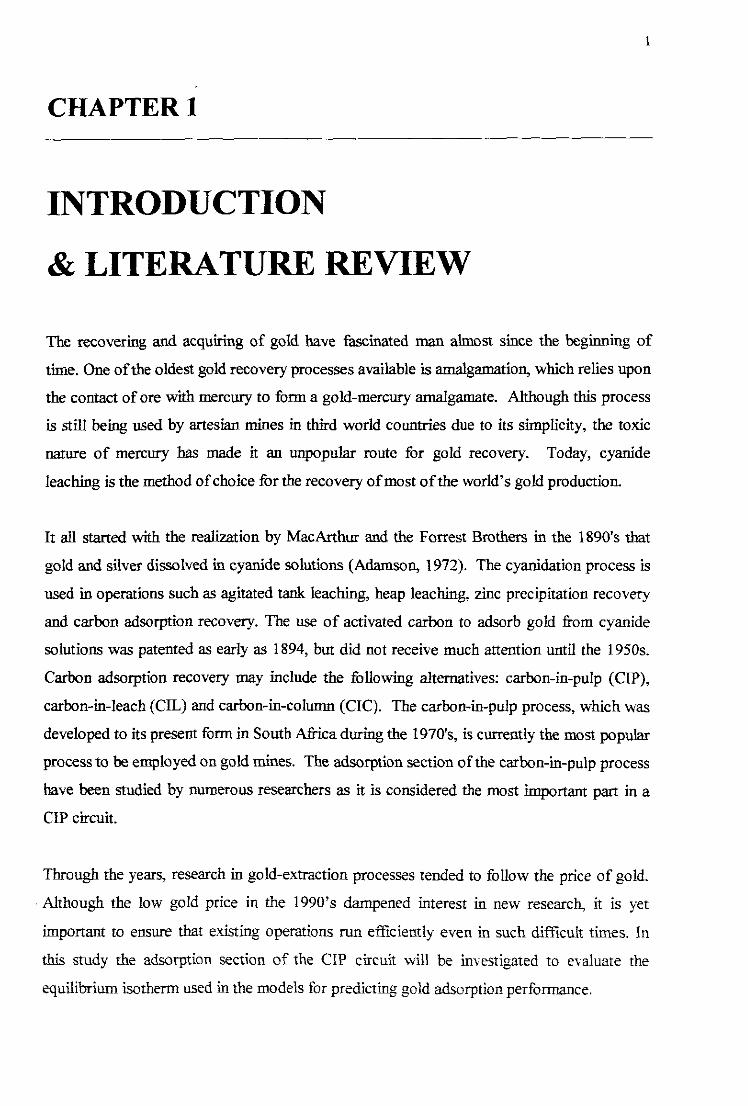
CHAPTER I
INTRODUCTION
& LITERATURE REVIEW
The recovering and acquiring of gold have fascinated man almost since the beginning of
time. One ofthe oldest gold recovery processes available is amalgamation, which relies upon
the contact of ore with mercury to fonn a gold-mercury amalgamate. Although this process
is still being used by artesian mines in third world countries due to its simplicity, the toxic
nature of mercury has made it an unpopular route for gold recovery. Today, cyanide
leaching is the method ofchoice for the recovery ofmost ofthe world's gold production.
It all started with the reaIization by MacArthur and the Forrest Brothers in the 1890's that
gold and silver dissolved in cyanide solutions (Adamson, 1972). The cyanidation process is
used in operations such as agitated tank leaching, heap leaching, zinc precipitation recovery
and carbon adsorption recovery. The use of activated carbon to adsorb gold from cyanide
solutions was patented as early as 1894, but did not receive much attention until the 1950s.
Carbon adsorption recovery may include the following alternatives: carbon-in-pulp (CIP),
carbon-in-Ieach (CIL) and carbon-in-colunm (CIC). The carbon-in-pulp process, which was
developed to its present fonn in South Africa during the 1970's, is currently the most popular
process to be employed on gold mines. The adsorption section ofthe carbon-in-pulp process
have been studied by numerous researchers as it is considered the most important part in a
eIP circuit.
Through the years, research in gold-extraction processes tended to follow the price of gold.
Although the low gold price in the 1990's dampened interest in new research, it is yet
important to ensure that existing operations run efficiently even in such difficult times. In
this study the adsorption section of the CIP circuit will be investigated to evaluate the
equilibrium isotherm used in the models for predicting gold adsorption performance.
2
1.1 THE CARBON-IN-PULP (CIP) PROCESS
In 1973, the Homestake gold Mine in Nevada began recovering gold directly from cyanide
pulp with activated carbon, using and elution method developed at the US Bureau of Mines
in the early 1950s. The first full-scale CIP plant in South Africa was commissioned at
President Brand Gold Mine in August 1980. CIP has been accepted by industry as being
superior to the fonner technology for its simplicity of operation, reduced capital and
operation costs, higher recoveries of gold and versatility for being suited fur small and
medium scale mining (Bailey, 1987; http://www.rrillnek.co.zaJEMD/CIP/cip.htm).
The gold recovery process begins where the broken ore from the mine is first ground to a
fine powder (about 80% - 200 mesh) in large rotary mills. The slurry of the fine ore and
water (referred to as the pulp) is treated with about 2 pounds per ton of sodium cyanide and
enough quick lime (to keep the pH to about 11) in large tanks that are stirred mechanically or
by air-agitatioIL The process in which the gold is leached from the gold bearing ore through
contact with the cyanide solution, is called the cyanidation process. The cyanided pulps are
screened to remove any large particles or wood chips that might possibly block the interstage
screens, before it enters the CIP circuit (Bailey, 1987; Laxen et aI, 1994). The CIP process
comprises mainly ofthe following important operations (see Figure 1.1).
1.1.1 Loading of gold onto carbon
The adsorption circuit is the most important operation in the CIP process, since the
efficiency of adsorption of gold determines not only the amount of soluble gold lost in the
residues, but also the function ofthe other processes in the plant. Activated carbon is used to
adsorb the gold directly from the cyanided pulp in a series of six to eight large adsorption
tanks. These tanks are arranged in a cascade to facilitate the use of gravity for continuous
movement ofthe pulp (Bailey, 1987; Yannopoulos, 1990). Pulp flows continually from the
first vessel to the last in the series, and the carbon is trdllSferred intermittently by pumping it
in the opposite (cQuntercurrent) directioIL Interstage screens between the tanks prevent the
carbon from moving downstrearIL The gold value ofthe pulp decreases downstream, and the
gold loading on the carbon increases upstrearIL with the highest value in the first tank. The
3
pH of the pulp is maintained in the range of 10 to 11 through the addition of lime
(Yannopoulos, 1990).
1.1.2 Elution or stripping of gold from the carbon
All elution processes are based on Fick's First Law where mass transfer is a linear function
of the molar concentration gradient (high temperature)(Coulson and Richardson, 1990).
Two methods of elution are used on South African CIP plants
(http://www.mintek.co.za!EMD/CIP/cip.htm). In the Zadra procedure hot, dilute caustic
solution is recirculated continuously between the elution column and the electrowinning
section (Zadra et aI, 1952). The AARL procedure involves pre-soaking the loaded carbon in
hot, concentrated caustic cyanide solution, followed by elution with hot deionized water
(Davidson, 1986).
1.1.3 Reactivation of spent carbon
The carbon leaving the elution process is regenerated before being recycled to the last stage
of the adsorption circuit. Thermal reactivation of the carbon occurs at 650°C in the absence
of air for about 30 minutes, and then being allowed to cool in air (Bailey, 1987; Laxen et ai,
1994). Regeneration is necessary to remove organic and inorganic substances accumulated
within the pores of activated carbon during adsorption, that are not removed during the
elution of gold. The objective is to recover the original porous structure and activity loss,
with as little damage as possible to the carbon itself.
1.1.4 Electrowinning: metallic gold production
During this procedure, gold metal is recovered from the concentrated solution by an
electrolytic process. Although a number of cells have been designed for this purpose
(cylindrical cell, rectangular cell, Ang10 American cell)(Bailey, 1987), a novel
electrowinning cell was designed by Mintek (the Mintek cell), which has become the
industry standard (http://www.mintek.co.zalEMD/CIP/cip.hun).This cell, which is
manufactured in South Africa, overcame the low efficiencies of existing cells by using six
individual steel-wool cathodes instead of the single one nonnally employed, w"ith an anode
4
placed on each side of the cathodes. The electrochemically active volume of the cell is
accordingly increased 12-fold. The electrolyte flows through each of the 12 active sectors in
sequence, thus further increasing the efficiency ofthe design (http://www.rnintek.co.za
/EMD/CIP/cip.htm).
1.2 GOLD CYANIDE ADSORPTION ONTO ACTIVATED CARBON
1.2.1 Activated carbon
In South Africa the gold-mining industry is the largest single consumer ofactivated carbon.
The important role of activated carbon in the gold recovery process is very clear from the
information supplied in the previous section. Aspects relating to the manufacture ofactivated
carbon, as well as the properties of the resultant products are discussed in the following
section.
1.2.1.1 Background
Activated carbons can be defined as highly porous, carbonaceous materials. The very large
porosity provides a large sur:fuce area, which results in exceptional adsorptive properties.
The process ofactivated carbon generation begins with the selection of a raw carbon source.
The selection of these sources are based on design specifications since different raw sources
will produce activated carbon with different properties. Some of the more common raw
sources include wood, sawdust, peat, coal, coconut shells, peach pips and petroleum residues
(Balci et al, 1994; McDougall and Hancock, 1981; Mattson and Mark, 1971; AWWA,
1994). Activated carbons are available in powdered or granular fonn.
Characteristics of importance in choosing carbon types include pore structure, particle size,
total surface area and void space between particles. The most ideal activated carbon for
applications in gold recovery, is the granular coconut shell carbons with its extremely good
impact hardness and wet abrasion resistance (McDougall and Hancock, 1981).
5
1.2.1.2 Structure
None of the substances which are part of the fiunily of activated carbons can be
characterized by a definite structural formula or by chemical analysis (McDougall and
Hancock, 1981, Yannopolous, 1990).
It was shown through X-ray diffraction studies that the structure of activated carbon is
similar to that of graphite as can be seen in Figure 1.2 (Mattson and Mark, 1971; Bokros,
.1969). The structure of activated carbon is believed to be composed of tiny graphite-like
plates called basal planes. One such plate is shown in Figure 1.3. The basal planes are flat
or somewhat bent, 0.35 nm in thickness and a few nanometres in width and length. The
hexagonal carbon rings are randomly orientated resulting in a very disordered overall
structure which is often referred to as 'turbostratic'. This highly graphitic structure of
activated carbon, aside from its large specific surface area, is the most important property
with respect to gold cyanide adsorption (Ibrado and Fuerstenau, 1992).
In any activated carbon, pores ofdifferent sizes are found. Pores can be distinguished into:
• Micropores (radius below 1 nm)
• Mesopores (radius 1-25 nm), and
• Macropores (radius larger than 25 nm)
The macropores are used as the entrance to the activated carbon, the mesopores for
transportation and the micropores for adsorption (http://www.activated-carbon.com/1
3.htrnl). The pore structure and pore-size distribution are largely predetermined by the
nature of the starting material, while the chemical nature of the surfuce oxides and the
surfuce area of activated carbon is developed during the carbonization and activation
processes.
6
1.2.1.3 Manufacturing
(a) Carbonisation
The main purpose ofthe carbonisation process is to reduce the volatile content of the source
material (a fixed carbon content of80% or higher is desirable) to convert it to a suitable form
for activation (McDougall and Hancock, 1981). Rearrangement of the carbon atom into
graphitic-like structures also occurs during carbonisation. However, the decomposition and
deposition ofdisorganised carbon results in the filling or blocking ofthe created pores.
An activation step is necessary to enhance the low adsorption properties of the carbon and is
basically the development of pores by means of chemical reactions (Bald et al., 1994).
There are two main varieties of the activation process, namely thermal/steam activation and
chemical activation which give fundamentally different pore structures (http://www.norit.
com/carbon/1-0htm).
(b) Thermal/steam activation
In the steam activation process, the carbonised material is reacted with steam, air, flue gas,
or mixtures of these at temperatures between 800°C and 11 OO°C for a period of time. At
these conditions, part of the carbon atoms are removed by 'gasification' (http//www.norit.
com/carbon/1-0htm):
C (solid) + H20 (gas) ~ CO (gas) + H2 (gas)
Due to many factors, the different basal planes in the carbonised material show different
reactivities towards this gasification reaction. As a result, some plates are removed, while
others are not. This yields a very porous structure consisting of micro- and mesopores which
gives the carbon its adsorptive capacity. As a result of this method of production,
micropores are usually more-or-less slit shaped. The rnicropore walls are largely the flat
sides of adjacent basal planes. Progressive activation can enlarge the micropores into
mesopores. In this process, the pore shape becomes more random as seen in Figure 1.4.
7
One of the most important structural characteristics of activated carbon produced through
steam activation from coconut shells, is that it is extremely microporous (the major portion
of its pore volume being represented by pores with a radius of 100 A). For this reason
coconut-shell products are ideal for the adsorption of the small gold-dicyanoarate complex.
The graphitic zones that are believed to exist in thermally activated carbon also playes an
important role in the mechanism of gold extraction from a cyanide medium (McDougall,
1991).
(c) Chemical activation
The chemical activation process is different from the steam activation process, in that
carbonisation and activation occur at the same time, and at lower temperatures. Chemically
activated carbons are produced by mixing an activation chemical with a young carbonaceous
material (usually sawdust) and carbonising the resulting mixture. The most commonly used
activating agents include zinc chloride, phosphoric acid and salts of sodium and magnesium
(Hassler, 1974; McDougall, 1991).
The carbonisation temperature is relatively low between 2000 C and 6500 C. As a result of
the relatively low process temperature, graphitic basal planes are not found in chemically
activated carbons. Instead, each particle can be seen as a partly aromatic, partly aliphatic
organic molecule (http://ww.norit.com/carbon/1-0htm). Chemically activated carbons are
characterized by their generally macroporous structure making them suitable for the
adsorption oflarge molecules (McDougall, 1991).
1.2.1.4 Chemical properties
As already stated, the overall structure of activated carbon is very disordered resulting in a
high levels of structural imperfections. For this reason there are many possibilities for
reactions with carbon atoms at the edges of the planar layers. Oxygen-containing organic
functional groups are present on the surfuce of the carbon as a result of these reactions
(Manson and Mark, 1971; McDougall, 1991). These surfuce oxides are mostly located at
the edges of broken graphitic ring systems and their exact chemical structures are not k...llO\vn
with certainty. It has been suggested though that they may belong to the following groups:
8
carboxy~ phenolic hydroxyl, quinone-type carbonyl, normal lactones, fluoresce in,
carboxylic acid anhydrides and cyclic peroxides. The chemical nature of activated carbon
however, depends on conditions during and after manufucture (Mattson and Mark, 1971;
McDougall,1991).
1.2.1.5 Adsorptive properties
Generally, it is understood that activated carbon owes its adsorptive properties primarily to
its large internal surface area, as well as to its pore-size distribution, and that the external
surface area and the nature ofthe surfuce oxides play minor roles (Mattson and Mark, 1971).
Adsorption is a removal process where certain particles are boWld to an adsorbent particle
surface by either chemical or physical attraction (http://www.ce.vt.edu/envir02/
wtprimer/carbons/sketcarb.html). Activated carbon uses the physical adsorption process,
whereby attractive Van der Waa1s forces (also dipole-dipole interactions and hydrogen
bonding) pull the solute out of solution and onto its surface, and which are generally
reversible (Reynolds and Richard, 1996). Chemical adsorption refers to processes involving
homopolar forces (as in ionic or covalent bonds), and such processes are generally
irreversible. Adsorption requires three processes: macrotransport, nllcrotransport and
sorption (http://www.activated-carbon.comll-3.html). The first step involves diffusion
through a liquid phase to reach the carbon granule. Mictrotransport involves diffusion of
molecules through macropores in the carbon granule to an adsorption site. The third step
involves adsorption ofthe molecule to the surface.
Activated carbon is a very versatile substrate with respect to its interactions with various
organic and inorganic compounds. It can function for instance as a reducing agent or, in the
presence of excess oxygen, as an oxidation catalyst (McDougaR 1991). As a resuh, the
adsorption of inorganic species such as the gold dicyal10aurate anion onto activated carbon,
may occur by several mechanisms, making its identification extremely difficult.
9
1.2.2 Cyanide
The introduction of the cyanide leaching process in the 1890's made a mark in extractive
hydrometallurgy due to the high degree of efficiency that is attained in gold mills
(Yannopoulos, 1990). Cyanide has become a crucial part of the modern gold recovery
process and it is therefore imperative to gain a basic understanding of the relationship
between gold and cyanide.
1.2.2.1 Background
The general term "cyanide" refers to numerous compounds, both natural and man-made,
having the chemical group CN (one atom of carbon and one atom of nitrogen). The acidic
form ofcyanide is called hydrogen cyanide or hydrocyanic acid, HCN. Cyanogen, C2N2, is
formed by the oxidation of cyanide ions whereas a simple cyanide (HCN, NaCN) is a
compound that dissociates to the cyanide anion (eN) and a cation (H+, Na"'). There are
three categories of cyanide that mine operators must normally be concerned with: free
cyanide, weak-acid-dissociable (WAD) cyanide or total cyanide. Often, regulators require
monitoring for only one of these categories. The procedure called total cyanide does not
determine all of the various fonus of cyanide (http://www.mpi.org.auJreportslbob
morans_cyanide-paper.html).
1.2.2.2 Free cyanide
The cyanide ion, CN-, and hydrogen cyanide, HCN, are collectively called free cyanide and
the relative amounts present are largely controlled by the solution pH. Cyanide ion, eN, is
the predominant stable form of free cyanide above a pH ofabout 9.0 to 9.5, depending upon
the dissolved solids concentration ofthe water. As the pH drops, increasing amounts of CN
convert to hydrogen cyanide, HCN. Therefore, most free cyanide in natural waters is present
as HCN since the natural pH range is between about 6.0 and 8.5
(hnp://www.mpi.org.auJreportslbob_morans_cyanide-paper.html). Molecular HCN has a
low boiling point and a high vapour pressure and can be lost from solution, particularly
where there is a water/air interface (Smith and Mudder, 1991). The reaction between
cyanide ion and water is expressed by the following equation:
10
CN- + HOH = HCN + Off
At any particular pH and temperature this system is in equilibrium. This system is important
because in gold cyanide extraction processes that are operated at pH 10.3, most of the free
cyanide in process slurry water will be as CN-. Since the HCN/CN ratio is Iow in process
fluids, the capacity for cyanide loss by volatilisation is limited.
Free cyanide forms readily react with other chemicals they contact, producing a wide variety
ofnew compounds which are often put in the following groups: simple cyanide compounds;
cyanide complexes and cyanide related compounds http://www.mpi.org.au/reports
/bob_moran_cyanideyaper.html). Simple cyanide compounds can be defined as the salts of
hydrocyanic acid (KCN and NaCN), which dissolve completely in solution producing free
alkali earth cations and cyanide anions. It is these forms of cyanide which are initially
employed in the cyanidation process.
1.2.2.3 Cyanide complexes
The chemistry of the cyano-meta1 complex is more involved that that of the simple cyanide
compounds. The alkali-metal cyanide complex have the following general formula:
A"M(CN)", thus the formula KAu(CN)z for potassium aurocyanide (Smith and Mudder,
1991). When an alkali-metal cyanide dissolves in water, the transition metal and cyanide
stay combined together as a complex radical anion. The stability of the metal cyanide
complex anion is dependent on the metal cation with which it is associated with. In Table
1.1 the stability of some of these metal cyanide complexes are shown by Scott and Ingles
(1987). Though under conventional leaching conditions (pH = 10-1 I), Au(CN)2- is the most
stable gold species (Wang and Forssberg, 1990).
Gold forms a large number of complexes with various ligands such as thiocyanate (gold I),
cyanide (gold I), chloride (gold III) and thiosulphate (gold 1). However, the interaction
between activated carbon and the chloride and cyanide complexes of gold have received
predominant attention in literature because of their significance in the hydrometaIIurgical
11
recovery of gold (McDougall and Fleming, 1987). The ability of activated carbon to adsorb
different gold complexes follows the following order:
Because oft.'le strong complex formed between cyanide and gold as well as its solubility,
relatively weak cyanide solutions can be used for the extraction of gold from ore. It should
also be noted that at lower cyanide concentrations, although AU(CN)2' is not the dominant
gold species, it is the dominant stable cyanide species (Wang and Forssberg, 1990). It is for
this reason, as well as the availability ofcyanide, that a cyanide medium is used for gold ore
processing. In gold mine or cyanidation solutions the cyanide compounds present include
free cyanide, the alkali earth salts and the metal cyanide complexes formed with gold,
mercury, zinc, cadmium, silver, copper, nickel iron and cobalt (Smith and Mudder, 1997).
Gold dissolution in a cyanide medium occurs through the overall reaction known as Elsner's
equation as follows:
4Au + 8NaCN + 2H20 = 4NaAu(CN)2 + 2NaOH
In spite of the relative specificity of the gold-cyanide reaction, other metals and inorganic
constituents react both with cyanide and to a certain extent with hydroxide, which must be
present to maintain cyanide in its ionic form. The following is an example of such a reaction:
Hence, metal-cyanide complex ions form as the products of the reaction between the
insoluble cyanide compound and excess cyanide ions.
1.2.3 Adsorption mechanisms for gold cyanide
Despite over 100 years ofresearch and development with activated carbon, there is still not a
complete agreement of the gold adsorption and desorption mechanism (McDougall and
Hancock, 1981; McDougall 1991; Adams et ai, 1987; Van der Merwe and van Deventer,
1988). The main reason for this being the fact that activated carbon can not be investigated
12
by direct physical procedures such as Infra-red specttoscopy or X-ray diffraction, so that
very little is knOWTI about the adsorbent itsel£ Presently, not even the identities of the
oxygen-containing organic functional groups formed on the carbon during activation are
known with certainty. The mechanisms proposed over the years can be simplified into one
of the following three (McDougall and Hancock, 1981; Adams and Fleming, 1989; Wan
and Miller, 1990; Yannopoulos, 1990; Lagerge et aI, 1997):
• The Au(CN)z- ion is adsorbed without undergoing chemical change, and held by
electrostatic or Van der Waals forces,
• The gold compound is decomposed from Au(CN)z- to AuCN and adsorbed as such,
• The aurocyanide is reduced to either gold metal or to a partially reduced state between
gold(I) and gold(O).
The overriding agreement in these studies though, is that Au(CN)z' does not undergo any
change in structure in the adsorption step and that adsorption probably occurres by the
mechanism which involves the extraction of ion pairs of the type [M"l[ Au(CN)zln where
Mn+ = Na+, K+, Caz+, Mgz+, etc., at high pH values, and where Mn+ = W in acidic solution
(McDougall et aI, 1980; Adams and Fleming, 1989).
In terms of the above mechanisms, gold is present on the carbon surface in one of the
following forms (McDougall and Fleming, 1987):
1. Aurocyanide, Au(CN)z- (gold valency 1)
2, Aurocyanide, AuCN (gold valency 1)
3. A cluster compound, AUx{CN}y (gold valency 0-1)
4. Gold metal, Au (gold valency 0)
Recent investigations indicate that the graphite-like structure ofactivated carbon is the most
important factor in the adsorption process. lones et aT (1989) proposed that gold cyanide
resides on the plate faces of the graphite crystallites upon adsorption on activated carbon as
the geometry of the graphitic plane provides an excellent match to the structure of the
Au(CN)z- ion as sho\\TI in Figure lA. These findings presented that oxygen-containing
functional groups play a significantly smaller role than is commonly believed and that the
13
graphitic plates of activated carbon play the most important role. This was confirmed by
Ibrado (1992), although their findings gave no indication of how adsorbed gold cyanide
interacts with the adsorbent surface. lones et al (1989) also contradicted the theory of the
formation ofidentifiable ion pairs [M"l[ Au(CNh10 on the carbon surfuce (McDougal et ai,
1980) by stating that the cations in the system (Na+, Kl co-adsorb non-specifically at the
carbon-solution interfuce.
1.2.4 Adsorption /Equilibrium Isotherm
1.2.4.1 Equilibrium
The practice in CIP technology is to avoid equilibrium conditions being attained, for
effective gold adsorption in each stage ofthe adsorption process. During the establishment of
equilibrium, gold cyanide is presumed to slowly diffuse into the carbon micropores and, as
the cross-sectional area of the micropores approaches that of the aurocyanide ion, the
resistance to mass transfer becomes infinite. The initial film diffusion controlled reaction,
which presumably involves adsorption in the macropores and mesopores, results in the
establishment of a pseudo-equilibrium in 4 to 48 hours. Gold cyanide will continue to
adsorb slowly onto the carbon, diffusing into the micropores, until a true equilibrium is
established which in practice can take up to several weeks. The aurocyanide-carbon
interaction can therefore be considered to possess two thermodynamic reqimes: the
macropore-mesopore equilibrium and the total equilibrium (McDougall and Fleming, 1987).
Most plants use an average carbon residence time of about 24 hours per contactor and
seldom exceed 48 hours. Hence, it is apparent that plants operate predominantly in the
pseudo-equilibrium and that true equilibrium is never reached. The chemical environment
and thermodynamics of the adsorption reaction influences this pseudo-equilibrium in the
same way as a true equilibrium would be affected. An accurate estimation of the equilibrium
conditions and information on the basic features of adsorption isotherms are therefore
important requirements for modelling CIP plants. Adsorption efficiency decreases over time
in the adsorption circuir and eventually activated carbon will need to be replaced or
reactivated.
14
1.2.4.2 Equilibrium capacity
The equilibrium capacity is an important aspect of the efficiency of an adsorbent-adsorbate
system. The rates and equilibrium loading of aurocyanide adsorption onto activated carbon
depend upon the number of active sites available on the carbon. As the carbon becomes
loaded it is slower to take up gold and the concentration of gold in equilibrium increases
(Wan and Miller, 1990). The effect of mctors which affects the carbon loading capacity will
be discussed later in detail.
1.2.4.3 The isotherm relationship
Isotherms are empirical relations, which are used to predict how much solute can be
adsorbed by activated carbon. Each granular activated carbon has its own isotherm curve
and breakpoint characteristics. These belp to predict the adsorptive capacity of particular
activated carbons and give a design estimate for adsorptive life. Reactivation of the carbon
becomes necessary once the breakpoint has been reached. The isotherm and breakpoint
characteristics of a particular carbon are most often determined by modeling, testing, cost
analyses, and pilot studies. The pilot studies ensure that the chosen carbon type effectively
removes the desired substances for the particular raw aqueous source and allows the plant to
reach desired levels of quality before treatment continues. Once a breakpoint of a particular
carbon has been determined the plant operators know approximately how long the carbon
will effectively function. As this time approaches the carbon must be changed to ensure
FIGURE 1.2 A schematic representation ofthe structure of (A) graphite and (B) theproposed structure of activated carbon. The circles denote thepositions of carbon atoms, while the horizontal lines represent carbonto-carbon bonds.
FIGURE 1.3
27
H-.-....0
,~ I
Tnm
Tue structure of a lrdSal plane ill a steam activated carbon. Oxygencontaining functional groups are located at the edges of brokengraphitic rings.
FIGURE 1.4 A crossectional view of micro- and mesopores
• P: basal planes• B: mesopores• C: micropores
28
TABLE 1.1
29
The classification of cyanide compounds in cyanidation solutions onthe basis of stability.
FIGURE 4.10 Equilibrium adsorption of gold cyanide at pH 11.5, 100 ppm freeeN, 50 ppm NI. (Experiment 10, Trial 8)
:E::
120
100
80
>,
rlQl"0 60 I ...Z(.).~
40 I ...
20 - ... ... ...
o ,------------o 2
,--- -,---- --,
4 6 8 10
STAGES
FIGU RE 4.11 A first order decay in free cyanide concentration.'"Uo
35
30
25
'-
.l!l 20QlE~l1l0. 15«
10
~
"'
5
o -,-----------85 9.5 10.5
pH
11.5
~100 ppm eN
.20 ppm eN-----~---
I,
12.5
FIGURE 4.12 Plot of pH and free cyanide interaction.~
1
67 1
1
1
1
~---------
~1
~
P~
1
\e \I :I: '
\ ~ \
1
LJ
1ClCl~ 1
1
.:. 1~
ClID
co E 1as...asCL 1«
E "00.. c: 1Cl. as- ID
Cl 'z "0 1<0 U
'c~
ascD ~ 1cD.... IDU- ID...- 1c:
Q)
~,
ID
\1'-'
Cl~ 1
,<0
...I c:i !
!
jN\
CL 1
+'
~i
.-~
ca
1
Cl
0
, ci i
~
if'
as
1\
- 1
~
<Il
Cl
...N
...as
1<IlC.J
I1
\..,......,f 1UJ
;..-------------------J-- Cl
et.
ClCl
ClCl
Cl
::;) 1
... '"N
~
~
Ja18WEued 'r/
u. 1
1
1
68
CHAPTERS
APPLICATION OF MODIFIEDISOTHERM
The logarithmic relationship between the solution concentration and the carbon loading is
fundamentally important in the kinetic modelling of the gold adsorption system This
relationship is expressed in terms of the Freundlich isotherm as earlier explained. In the
previous chapter the influence of three operating variables namely pH, free cyanide
concentration and the concentration of nickel in solution were investigated and their
influence on the equilibrium expression were established. The conditions of free cyanide
concentration and pH are two parameters that can practically be measured on a real CIP
plant. A correlation between pH and free cyanide in a batch reactor yielded a modified A
parameter in the Freundlich isotherm that lumps the effect of these two factors together. It
was attempted to account for the effect of competitive adsorption by determining the
competition coefficients of gold and nickel. As a result of limited experimental data, the
competition factor could not be determined and will therefore not be incorporated into the
modified isotherm
5.1 A SINGLE COMPONENT ISOTHERM
In practice a constant Freundlich isotherm is used in the kinetic model for the prediction of
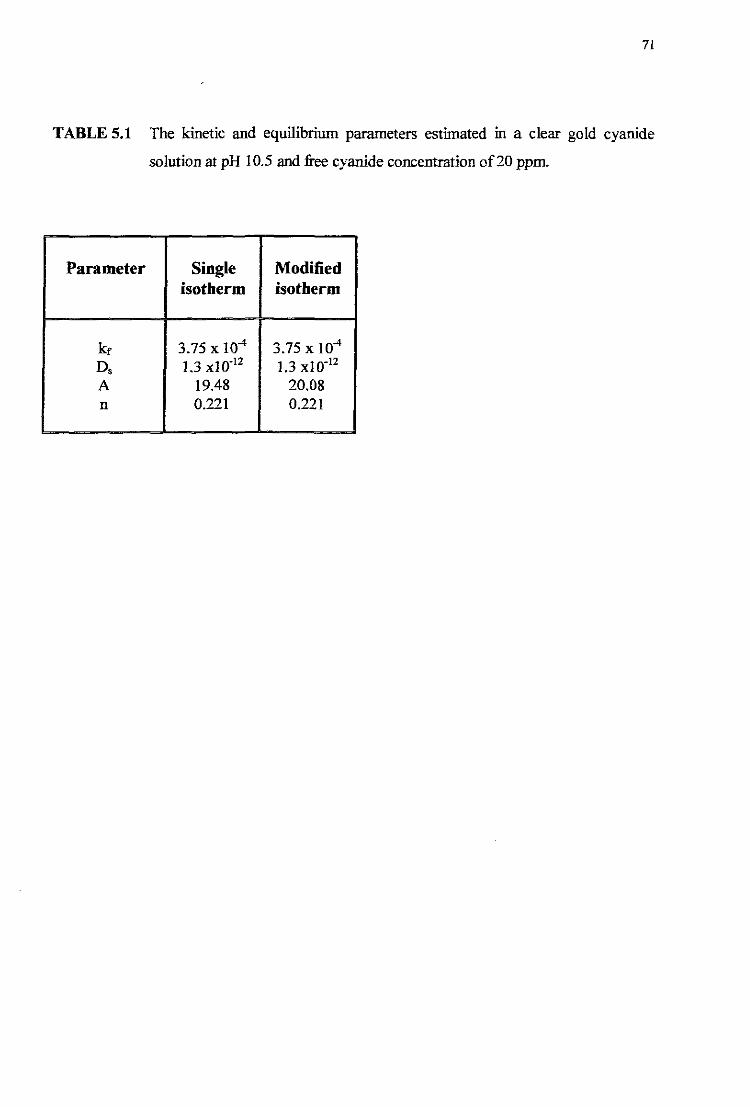
gold adsorption rates. The adsorption profile of a standard batch adsorption test of a clear
gold solution was plotted graphically as illustrated in Figure 5.1. A mass of 0.2 g of
activated carbon was contacted with 20 ppm clear gold cyanide solution at a pH of 10.5 with
a free cyanide content of 20 ppm for a period of 24 hours. The external mass transfer
coefficient, kf, was obtained by using a curve fitting program while an estimated value was
used for the surface diffusion coefficient, D,. The kinetic and equilibrium parameters
estimated is shown in Table 5.1 (Experiment 11).
69
A surface diffusion/film diffusion model was used for the estimation of the adsorption
profile and was plotted against the actual results obtained as seen in Figure 5.1. This graphic
representation shows that the model fits the actual experimental data with an accuracy of
±90%.
This error emphasises the importance of a method for predicting changes in adsorption
behaviour. The typical changes in adsorption conditions that would most likely cause such a
deviation can therefore be contributed to changes in pH and free cyanide concentrations.
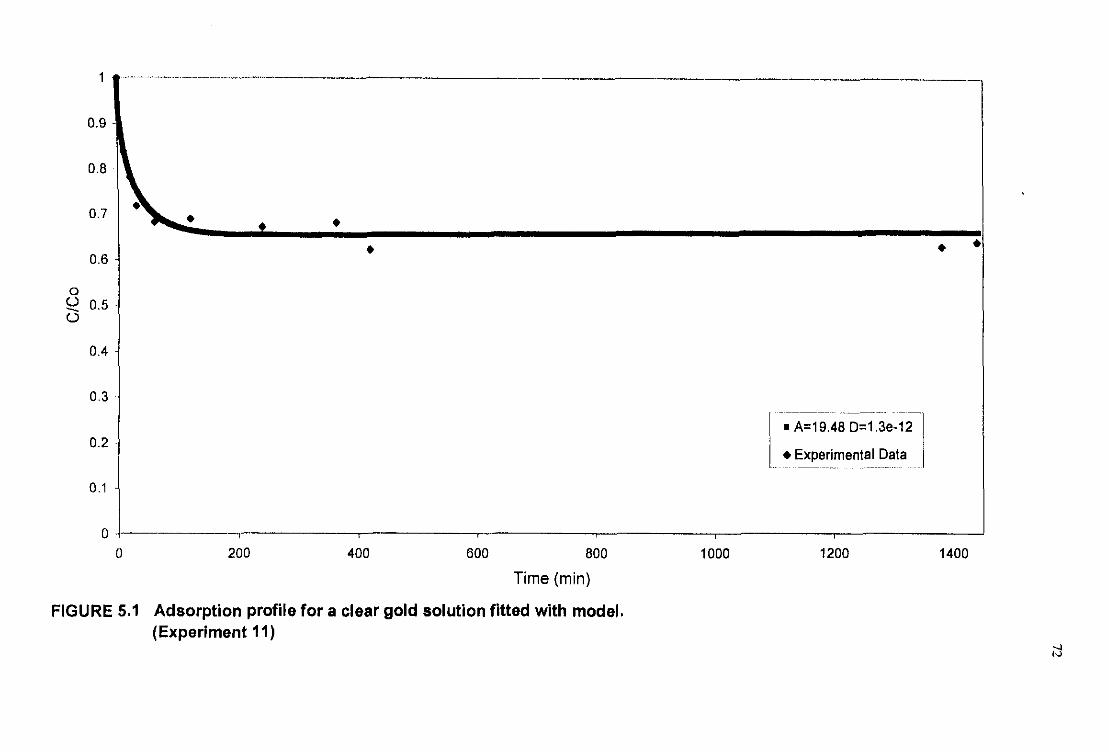
Figure 5.2 shows the difference in adsorption if the pH changes to 9.5 and the free cyanide
content changes to 100 ppm respectively. This demonstrates the need to expand the model in
order to describe the influence of operating variables on the extraction performance.
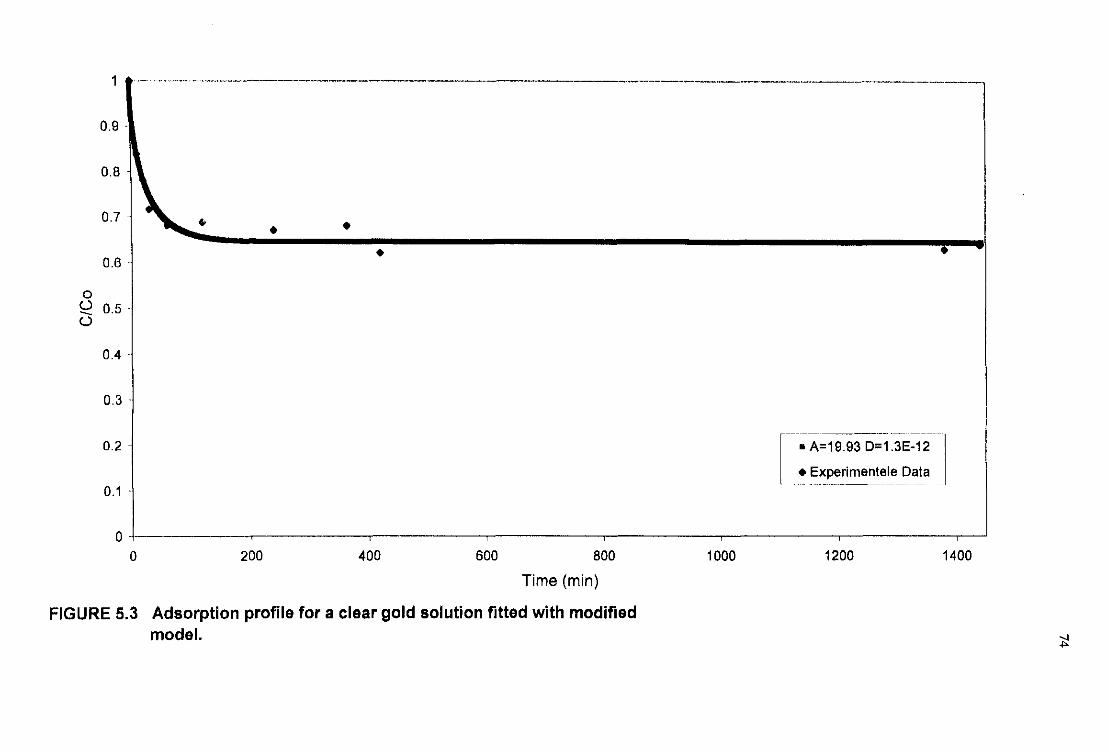
5.2 A MODIFIED ISOTHERM
A difference in the adsorption profile was observed with changing operating variables, hence
the equilibrium expression should also be influenced. The influence of certain factors on the
equilibrium isotherm was thoroughly investigated and ascribed as an effect on the
equilibrium A parameter which resulted in a modified isotherm Previous work showed that
the changing conditions of a solution have a negligible effect on the n parameter in the
isotherm, hence it was assumed that it stayed constant.
In order to obtain an acceptable fit fur the model, the A parameter is the only parameter that
could be changed if it is understood that the values of kf and D, stay constant. A modified A
parameter was proposed in the previous chapter, which accounts for changes in pH and free
cyanide concentration. If this modified A parameter is incorporated in the model the error in
the fit to the experimental data is much smaller as seen in Figure 5.3. The value of the A
parameter, hence the fit of the model was improved with 51 %. It can be assumed that if
such an error were found in a single batch reactor, the error would even be larger if the same
conditions were applied to a cascade system
70
It should be noted that the investigation in the previous chapter proved the significant effect
of competing ions and that this factor should be incorporated in the modified isotherm. As a
result of limited experimental data, the competition factor could not be determined and will
therefore not be incorporated into the isotherm at this stage. It is assumed that if this
additional effect were added to the model, an even greater improvement in the fit would be
obtained.
71
TABLE 5.1 The kinetic and equilibrium parameters estimated in a clear gold cyanide
solution at pH 10.5 and:free cyanide concentration of20 ppm.
Parameter Single Modifiedisotherm isotherm
kr 3.75 x 10⁻⁴ 3.75 X 10⁻⁴D, 1.3 XIO-12 1.3 XIO-12
A 19.48 20.08n 0.221 0.221
id
•
1400
•
1200
• A=19A8 D=1.3e-12
• Experimental Data
1000400
••
0.9
0.8
07
1 ~0.6
0~ 0.5U
OA
03
0.2
0.1
o .2000 600 800
Time (min)
FIGURE 5.1 Adsorption profile for a clear gold solution fitted with model.(Experiment 11)
1.20--
1.00
•-0.80 -I ••.' I• •0
~ 060 I
... ! •... • • ••••... ... ...
0.40-
0.20 - • Standard Au solution
• 100 ppm Free [eN]
... pH 9.5
1600140012001000800
Time
600400
0.00 +-----..-·,.i----,-------,------.----,------,----~-==:.Jo 200 i I
FIGURE 5.2 The effect of a change In pH and free cyanide concentration alternatively on theadsorption profile of a clear gold solution. (Experiments 11, 12, 13) -.J
w
~
14001200
1
--- --------..• A=19.93 D=1.3E-12
• Experimentele Data.....__ .,._ .._._---------
1000
----_._-_._-----_._._-_.._._------_._.__._-
•••..
,-.._..•._---._-----------"--------1
0.9 .
0.8
0.7
0.6
0U 05·- .U
0.4 -
0.3 -
0.2 -
0.1 -
00 200 400 600 800
Time (min)
FIGURE 5.3 Adsorption profile for a clear gold solution fitted with modifiedmodel.
75
CHAPTER 6
CONCLUSIONS AND
RECOMMENDATIONS
The :fOllowing conclusions could be made on the basis of the research performed in this
thesis:
• The main objective of this study was to identify operating conditions, which could be
practically measured on a CIP plant; that will cause an isotherm shift. CIP circuits
generally operate under conditions ofhigh ionic strength and free cyanide content and at
oxygen levels above 3 ppm. It was found that a change in either ionic strength or oxygen
concentration under these conditions would not significantly affect the adsorption
equilibrium of gold and that the influence ofthese variables could be ignored.
• Vast changes in the degree of fouling of organics and other minerals are found within a
cascade of adsorption tanks and also between different plants. This makes it impossible
to measure the effect of each individual species on the equilibrium. The influence of
:fOuling as an operating parameter can therefore be lumped with the effect of competing
ions in a combined competitive coefficient.
• The most significant factors causing an isotherm shift were minimised to pH, free
cyanide concentration and competing ions in solution. It was concluded that pH as an
operational parameter is important in view of the effect it bas on other operating
parameters. A pH shift between 11.5 and 9.5 may result in a 46 % change in the
equilibrium loading. It is known that the adsorption of aurocyanide is accompanied by a
pH shift. For this reason it is obvious that the pH should be monitored and adjusted
regularly to avoid a shift in equilibrium.
76
• It was found that the stability of free cyanide concentration is to a large extent controlled
by the pH of the solution. Low pH levels results in a significant decrease in cyanide
concentration. A relationship was postulated between the cyanide profile in the
adsorption circuit and the initial cyanide concentration, which yielded a first order decay
in cyanide represented by the following expression:
• The effect of a change in free cyanide concentration is significant in the range from 100
ppm to 20 ppm free cyanide. The experimental resuhs showed an increase of64 % in the
equilibrium A parameter if such a decrease should occur. The detrimental effect of high
cyanide concentration was also found to be more prominent than the effect of competing
ions. It can be concluded from the interacting effect between free cyanide and pH, that
the influence ofa change in free cyanide content on the equilibrium is larger at a low pH
than at a high pH. A linear relationship was formed at a pH of 10.5 between the free
cyanide concentration and the equilibrium A parameter, which is represented by the
following equation:
A = 20.676- O.062l{CN-]
• This work resuhed in a modified A parameter when the two proJXlsed expressions were
combined. The modified A parameter can be substituted in the existing Freundlich
isotherm which will modify the isotherm.
• A surface diffusion/film diffusion model was fitted to the experimental data to estimate
the adsorption profile. The modified A parameter was incorporated into the model and it
proved that a better fit (51 % improvement) could be obtained when a change in pH and
free cyanide concentration was accounted for.
77
• As a result of limited experimental data the competition factor for gold and nickel could
not be determined. It is suggested that future work should include the effect of
competing ions, in order to include this factor in the modified Freundlich isotherm. It is
assumed that if this additional effect were added to the model, an even greater fit of the
model predictions would be obtained.
78
CHAPTER 7
REFERENCES
Adams, M. D., McDougall, G. J., Hancock, RD., Modelsfor the Adsorption ofAurocyanide
onto Activated Carbon: Part Ill: Comparison between the extraction of Aurocyanide by