August 1, 2017 Analyst: Rohan Mandora [email protected] (+91-9737065666)/Ankit Choudhary [email protected] Page 1 of 13
Before reading this report, you must refer to the disclaimer on the last page.
Equitas Holding Absolute :REDUCE
Relative : UNDERWEIGHT
1QFY18 Results: Est. (), Target (), Rating () Regular Coverage 4% Downside in 14Months
Return ratios to take time to normalize; retain REDUCE Financials
© 2017Equirus All rights reserved
Rating Information
Price (Rs) 168
Target Price (Rs) 161
Target Date 30th Sep ’18
Target Set On 31st Jul ’17
Implied yrs of growth (ERE) 20
Fair Value (ERE) 161
Fair Value (DDM) NA
Ind Benchmark BANKEX
Model Portfolio Position -
Stock Information
Market Cap (Rs mn) 56,689
Free Float (%) 100.00 %
52 Wk H/L (Rs) 200.75/138.35
Avg Daily Volume (1yr) 1,633,971
Avg Daily Value (1yr) 272
Equity Cap (Rs Mn) 3,384
Face Value (Rs) 10
Bloomberg Code EQUITAS IN
Ownership Recent 3M 12M %
Promoters 0.0 % 0.0 % 0.0 %
DII 37.3 % 4.8 % 8.3%
FII 16.0 % 6.3 % 4.5%
Public 46.7 % -11.1 % -12.8%
Price % 1M% 3M% 12M%
Absolute 11.7 % 0.8 % -14.6 %
Vs Industry 3.6 % -11.3 % -45.5 %
UJJIVAN 4.4 % -15.3 % -36.8 %
BHARATFIN 17.2 % 5.1 % -6.9 %
Consolidated Quarterly EPS forecast
Rs/Share 1Q 2Q 3Q 4Q
EPS (17A) 1.9 1.4 1.3 0.2
EPS (18E) 0.5 0.3 0.5 0.7
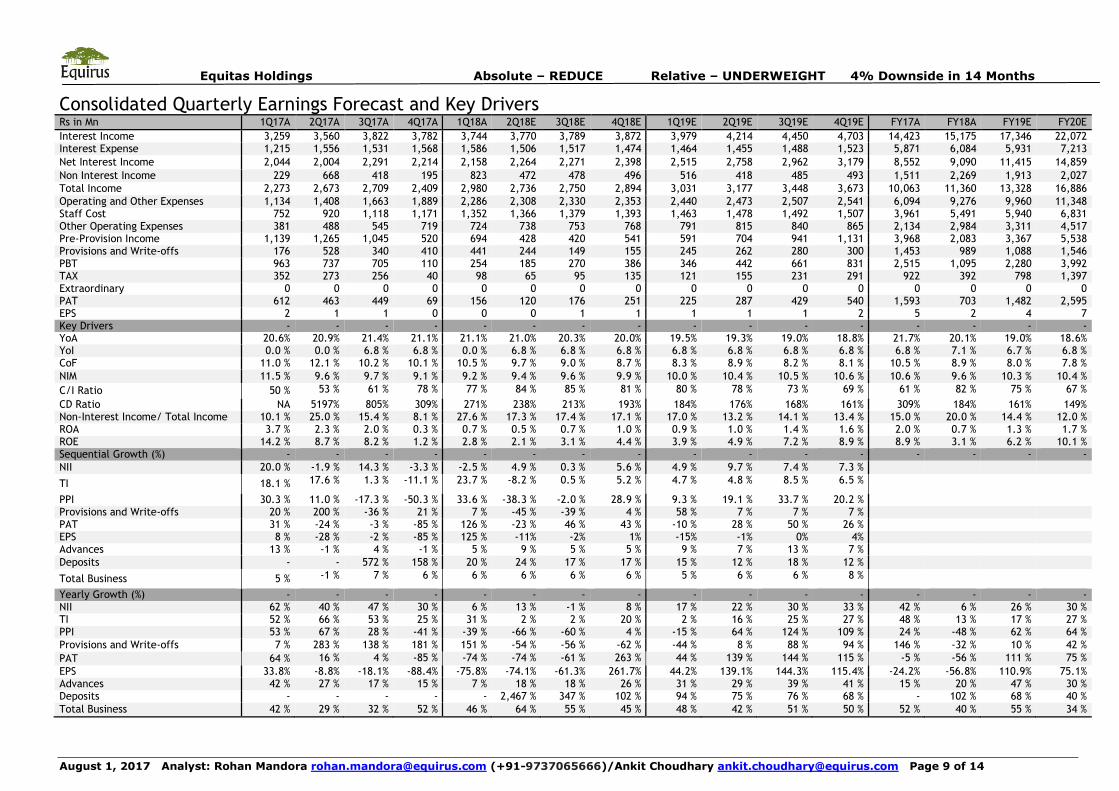
Equitas Holding Ltd (EQUITAS) saw a 31% yoy decline in 1QFY18 PAT to Rs 156mn (EE
Rs 226mn) on higher opex (+102% yoy) and provisions (+151% yoy), even as it booked
Rs 601mn as PSLC fees. MFI disbursements (-57% yoy/-22% qoq) remained weak and in
line with management strategy to reduce the MFI loan share to ~30% by FY18E (1QFY18:
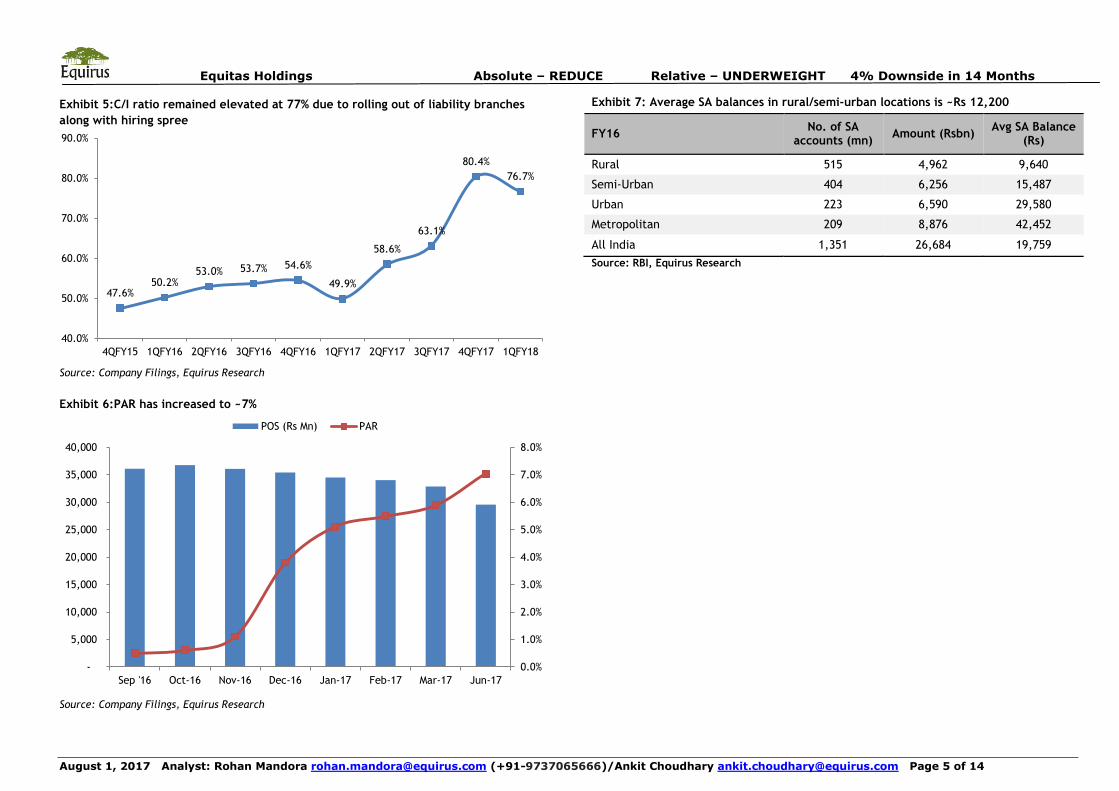
42%). Asset quality remained stressed as PAR >0/>90 days stood at ~7%/~4.1% (vs.
~5.9%/~2.7%). First-month MFI collection efficiency declined further with Jun’17
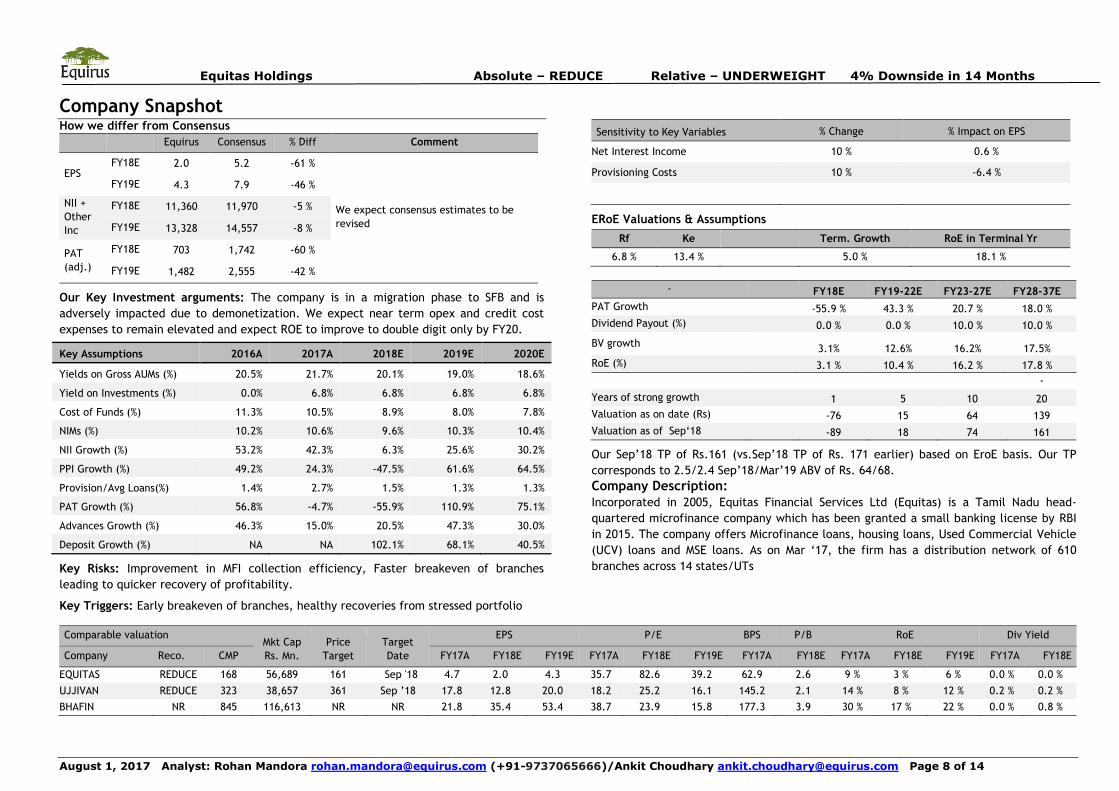
collection at 94% (Mar’17: 94.4%). We pare FY18E/FY19E EPS as we build in higher opex
expenses and reduce NII assumptions for FY18E. Maintain REDUCE with an ERoE-based
Sep’18 TP of Rs 161 (Rs 171 earlier) set at 2.5/2.4 Sep’18/Mar’19 ABV of Rs 64/67. Weak disbursements lead to subdued 7% yoy AUM growth: EQUITAS reported gross
AUM growth of 7% yoy/-2% qoq to Rs 70.4bn. While MFI disbursements declined 57%
yoy, non-MFI disbursements were also modest at 20% yoy. The share of MFI/UCV/M-LAP
in disbursements was at 33%/27%/20%. Deposit growth remained healthy at 19.6% qoq
to Rs 22.6bn with retail TDs (<Rs 10mn) constituted ~35% of total deposits. CASA ratio
stood at 26%/9% of total deposits/liabilities. Avg. balance per customer of CA/SA
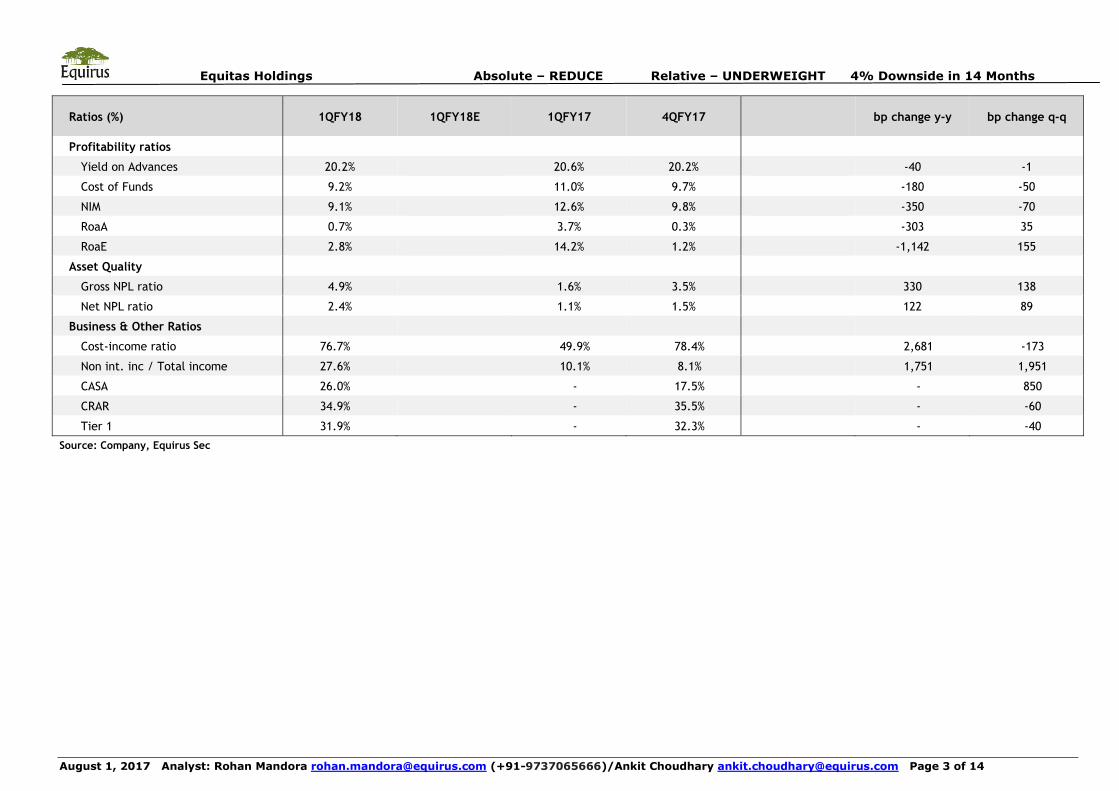
deposits was Rs 95k/Rs 48k. Higher opex, provisions drag down PAT: NII growth was subdued at 5.6% yoy/-2.5%
qoq as NIM declined 70bps qoq on a change in the AUM mix and lower excess interest
spreads on the securitized portfolio. EQUITAS sold PSLCs worth Rs 36bn and booked
entire fee income of Rs 0.6bn during 1QFY18. The company has sold Rs 150mn by
premium value of insurance products and has mobilized 6000 MF SIPs in 1QFY18. Opex
increased by 102% yoy/21% qoq as branch and employee expenses remained elevated. GNPL ratio ~5% for both MFI/non-MFI loans: GNPA/NNPA ratios stood at 4.9%/2.4%
(+138bps/+89bps qoq). Of total GNPAs of Rs 3bn, Rs 1.21bn were related to MFIs
(~5%) and the rest Rs 1.79bn to the non-MFI book (~4.9%). UCV/M-LAP GNPLs stood at
~6.5%/~1.5%. Maharashtra contributes ~55% of MFI PAR>0. Only 25% of delinquent
customers have been regular in re-paying recent installments. Management expects
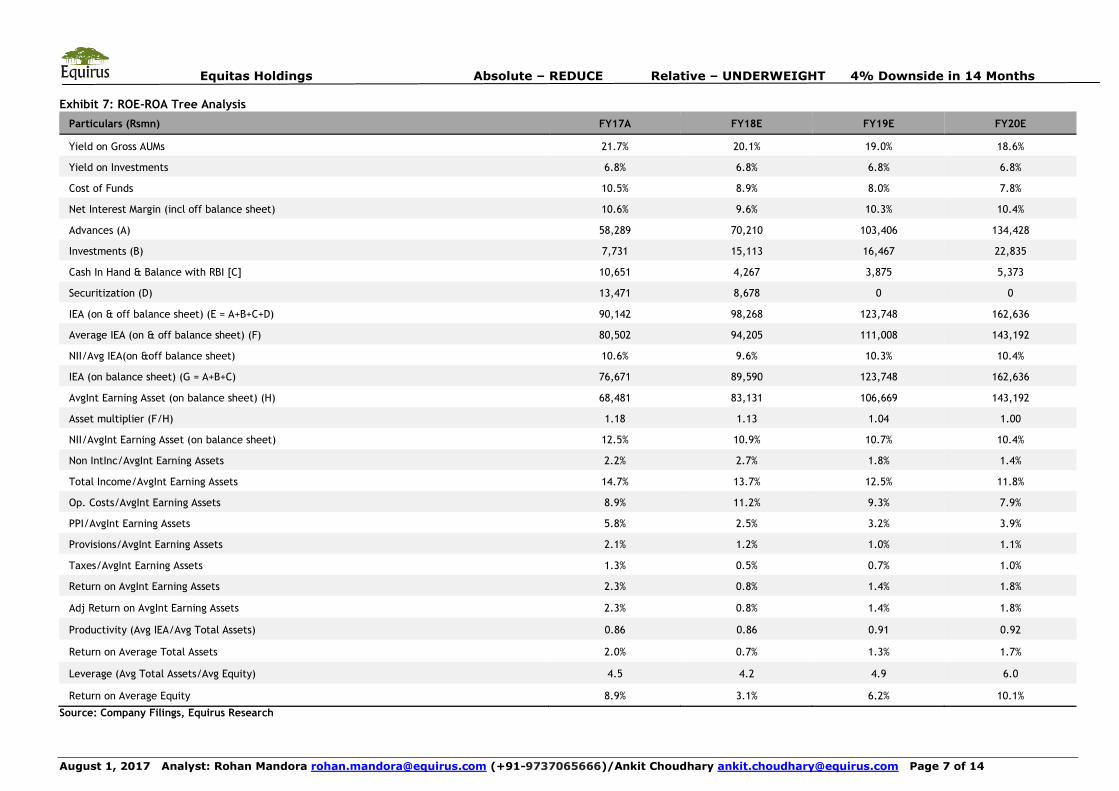
MFI collections to improve post the list of individuals eligible for waivers is released. Retain REDUCE with a Sep ’18 TP of Rs 161: EQUITAS re-aligned its provisioning
policy in line with RBI guidelines. Consequently, we trim our provision estimates for
FY18E/FY19E. Given better-than-expected deposit and CASA traction, we raise FY19E
NII estimates by 3% while lowering FY18E NII estimates by 8% on a change in the AUM
mix in favor of lower-yielding loans. Maintain REDUCE with an ERoE based Sep’18 TP of
Rs 161 (Rs 171 earlier). An improvement in MFI collections and faster breakeven of
branches leading to a quicker recovery of profitability are the key risks.
Revised Estimates % Change
FY18E FY19E FY18E FY19E
NII 9,090 11,415 -8.0% 3.0%
Provisions 989 1,088 -36.3% -37.0%
PAT (Adj) 703 1,482 -51.9% -28.2%
EPS (Rs.) 2.0 4.3 -52.9% -28.8%
Advances 70,210 103,406 0.8% 21.6%
Deposits 38,105 64,047 46.5% 59.1%
Consolidated Financials
Rs. Mn YE Mar FY17A FY18E FY19E FY20E
Interest Income 14,423 15,175 17,346 22,072
Interest Expense 5,871 6,084 5,931 7,213
Net Interest Inc. 8,552 9,090 11,415 14,859
Other Income 1,511 2,269 1,913 2,027
Operating Exp 6,094 9,276 9,960 11,348
Provisions 1,453 989 1,088 1,546
PAT 1,593 703 1,482 2,595
Loan and Advances
58,289 70,210 103,406 134,428
Deposits 18,857 38,105 64,047 89,983
Net Worth 22,309 23,011 24,493 27,088
NIM 10.6 % 9.6 % 10.3 % 10.4 %
Prov/Avg Loan 2.7% 1.5% 1.3% 1.3%
Rs Per Share FY17A FY18E FY19E FY20E
EPS 4.7 2.0 4.3 7.5
Adjusted EPS 4.7 2.0 4.3 7.5
Book Value 66.0 68.1 72.5 80.2
Adjusted BVPS 62.9 63.7 66.9 73.4
DPS 0.0 0.0 0.0 0.0
P/B (x) 2.5 2.5 2.3 2.1
Adj P/B (x) 2.7 2.6 2.5 2.3
Adj ROE (%) 8.9 % 3.1 % 6.2 % 10.1 %
RoA (%) 2.0 % 0.7 % 1.3 % 1.7 %
Equitas Holdings Absolute – REDUCE Relative – UNDERWEIGHT 4% Downside in 14 Months
August 1, 2017 Analyst: Rohan Mandora [email protected] (+91-9737065666)/Ankit Choudhary [email protected] Page 2 of 14
Quarterly Results Table
Particulars
%Variation
P&L Statement (Rsmn) 1QFY18 1QFY18E 1QFY17 4QFY17 % change vs Est % change y-y % change q-q
Net interest income (NII) 2,158 2,259 2,044 2,214 -4.5% 5.6% -2.5%
Other income 823 464 229 195 77.2% 258.7% 322.1%
Total income 2,980 2,724 2,273 2,409 9.4% 31.1% 23.7%
Operating expenses 2,286 2,015 1,134 1,889 13.4% 101.6% 21.0%
Staff expenses 1,352 1,209 752 1,171 11.8% 79.7% 15.5%
Other expenses 934 806 381 719 15.8% 144.8% 29.9%
Operating profit 694 708 1,139 520 -1.9% -39.0% 33.6%
Total provisions 441 366 176 410 20.5% 151.1% 7.5%
Exceptional items - - - - - - -
Profit before tax 254 342 963 110 -25.9% -73.7% 131.5%
Tax 98 116 352 40 -16.1% -72.3% 141.1%
Profit after tax 156 226 612 69 -30.9% -74.5% 125.9%
Adjusted PAT 156 226 612 69 -30.9% -74.5% 125.9%
Balance sheet (Rs mn) 1QFY18 1QFY18E 1QFY17 4QFY17 % change vs Est % change y-y % change q-q
Deposits 22,550 20,487 - 18,850 10.1% - 19.6%
CASA 5,879
- 3,337
- 76.2%
Borrowings 42,771 43,556 41,518 46,579 -1.8% 3.0% -8.2%
Advances 61,049 60,994 57,103 58,289 0.1% 6.9% 4.7%
Total gross AUMs 70,361 74,630 65,589 71,820 -5.7% 7.3% -2.0%
Disbursement 10,550 13,910 10,360 -24.2% 1.8%
MFI Disbursement 3,482 8,020 4,455 -56.6% -21.8%
Non MFI Disbursement 7,069 5,890 5,905 20.0% 19.7%
Gross NPL (Rsmn) 3,000 - 918 2,060
226.9% 45.6%
Net NPL (Rsmn) 1,640 - 652 1,050
151.6% 56.2%
Equitas Holdings Absolute – REDUCE Relative – UNDERWEIGHT 4% Downside in 14 Months
August 1, 2017 Analyst: Rohan Mandora [email protected] (+91-9737065666)/Ankit Choudhary [email protected] Page 3 of 14
Ratios (%) 1QFY18 1QFY18E 1QFY17 4QFY17
bp change y-y bp change q-q
Profitability ratios
Yield on Advances 20.2%
20.6% 20.2%
-40 -1
Cost of Funds 9.2%
11.0% 9.7%
-180 -50
NIM 9.1%
12.6% 9.8%
-350 -70
RoaA 0.7%
3.7% 0.3%
-303 35
RoaE 2.8%
14.2% 1.2%
-1,142 155
Asset Quality
Gross NPL ratio 4.9%
1.6% 3.5%
330 138
Net NPL ratio 2.4%
1.1% 1.5%
122 89
Business & Other Ratios
Cost-income ratio 76.7%
49.9% 78.4%
2,681 -173
Non int. inc / Total income 27.6% 10.1% 8.1% 1,751 1,951
CASA 26.0% - 17.5% - 850
CRAR 34.9% - 35.5% - -60
Tier 1 31.9%
- 32.3%
- -40 Source: Company, Equirus Sec
Equitas Holdings Absolute – REDUCE Relative – UNDERWEIGHT 4% Downside in 14 Months
August 1, 2017 Analyst: Rohan Mandora [email protected] (+91-9737065666)/Ankit Choudhary [email protected] Page 4 of 14
Exhibit 1:GNPA further deteriorated by 138bps qoq with higher GNPA of MFI Loans
Source: Company Filings, Equirus Research Exhibit 2:Share of Microfinance AUM dropped from ~46% to ~42% qoq
Source: Company Filings, Equirus Research
Exhibit 3:CASA and term deposit growth showed good traction during 1QFY18
Source: Company Filings, Equirus Research
Exhibit 4:NIMs continues to decline lower share of MFI loans in the AUM mix and
lower interest contribution from the securitized portfolio
Source: Company Filings, Equirus Research
0.3% 0.3% 0.3%
2.5%
5.0%
3.0%
4.8%
4.4% 4.4%
4.9%
1.6%
2.5% 2.5%
3.5%
4.9%
0.0%
1.0%
2.0%
3.0%
4.0%
5.0%
6.0%
Q1FY17 Q2FY17 Q3FY17 Q4FY17 Q1FY18
MF
Non-MF
Total
42.0%
27.7%
22.9%
3.7%
2.0% 0.9% 0.2% 0.4% 0.2% Microfinance
UCV
Micro LAP
Housing
Business Loan
Agri Loan
Gold Loan
Small and Mid Corporate Loans
Others
6.8%
17.2%
28.6%
4.1%
4.6%
0.0%
9.0%
25.6%
4.2% Term Loan
Refinance
Debenture
Sub Ordinated Debt
Commercial Paper
Unsecured Loan from Banks/FII
CASA
Term Deposit
CBLO
11.9% 11.8% 11.3% 11.2%
12.6%
10.0% 10.5%
9.8% 9.1%
0.0%
2.0%
4.0%
6.0%
8.0%
10.0%
12.0%
14.0%
0.0%
5.0%
10.0%
15.0%
20.0%
25.0%
30.0%
1QFY16 2QFY16 3QFY16 4QFY16 1QFY17 2QFY17 3QFY17 4QFY17 1QFY18
Yield Funding Cost NIMs
Equitas Holdings Absolute – REDUCE Relative – UNDERWEIGHT 4% Downside in 14 Months
August 1, 2017 Analyst: Rohan Mandora [email protected] (+91-9737065666)/Ankit Choudhary [email protected] Page 5 of 14
Exhibit 5:C/I ratio remained elevated at 77% due to rolling out of liability branches
along with hiring spree
Source: Company Filings, Equirus Research
Exhibit 6:PAR has increased to ~7%
Source: Company Filings, Equirus Research
Exhibit 7: Average SA balances in rural/semi-urban locations is ~Rs 12,200
Source: RBI, Equirus Research
47.6%
50.2% 53.0% 53.7% 54.6%
49.9%
58.6%
63.1%
80.4%
76.7%
40.0%
50.0%
60.0%
70.0%
80.0%
90.0%
4QFY15 1QFY16 2QFY16 3QFY16 4QFY16 1QFY17 2QFY17 3QFY17 4QFY17 1QFY18
0.0%
1.0%
2.0%
3.0%
4.0%
5.0%
6.0%
7.0%
8.0%
-
5,000
10,000
15,000
20,000
25,000
30,000
35,000
40,000
Sep '16 Oct-16 Nov-16 Dec-16 Jan-17 Feb-17 Mar-17 Jun-17
POS (Rs Mn) PAR
FY16 No. of SA accounts (mn) Amount (Rsbn) Avg SA Balance
(Rs)
Rural 515 4,962 9,640
Semi-Urban 404 6,256 15,487
Urban 223 6,590 29,580
Metropolitan 209 8,876 42,452
All India 1,351 26,684 19,759
Equitas Holdings Absolute – REDUCE Relative – UNDERWEIGHT 4% Downside in 14 Months
August 1, 2017 Analyst: Rohan Mandora [email protected] (+91-9737065666)/Ankit Choudhary [email protected] Page 6 of 14
Concall highlights SFB transition update
Challenges faced by Equitas are:
1. Leveraging new branch infrastructure and incurred costs for CASA
origination and cross-sell income
2. Scaling up new asset products with stable asset quality
3. Leveraging physical infrastructure and staff for new products
4. Getting MFI business back to normal levels
The company added 51 new branches during 1QFY18. Of these, 35 branches
are ready for operations with employees already recruited and technology
expenses incurred.
Costs incurred for branch expansion are in line with management estimates.
New asset products have been launched from ~130 branches.
Training of employees on newer products would not entail significant costs as
many products (agri loans, M-LAP) are cross-sold to existing MFI customers.
Also, ~60% of M-LAP customers are MFI customers. The overlap of newer
products with MFI customers is much lower.
Infrastructure cost per branch is Rs 3.5mn. Yearly operating costs including
salary and rentals stand at Rs 4.5-5mn/ branch.
MFI business
Of Rs 2.08bn of PAR in microfinance, ~Rs 370mn is in securitized loans. About
~Rs 700mn of provisions are outstanding against MFI loans.
Collection efficiency in MFI loans disbursed post 1 Jan’17 was at 99.8%. All
(100%) disbursements post demonetization were through bank accounts
During 1QFY18, EQUITAS changed its MFI provision in line with RBI guidelines.
Out of the overdue customers, ~35% have paid at least one installment in the
past two or three months.
As observed in the state of Uttar Pradesh (UP) by other MFIs, a recovery from
overdue Maharashtra customers is likely once the list of individuals eligible for
loan waivers is released.
Losses in MFI securitized book will adversely impact NIMs due to lower excess
income spread book by EQUITAS.
Non-MFI business
EQUITAS sold Rs 36bn of PSLCs during the quarter. The entire fee income of
Rs 600mn from PSLC sale was booked in 1QFY18 and has not been amortized over
the year.
As on date, there is no further headroom for additional sale of PSLCs. However,
there could be additional opportunity to sell PSLCs based on fresh disbursements
done over FY18E, over and above PSL requirements.
Business loan/agri/gold loans have taken off well and now constitute ~3.5% of
the AUM.
Share of CV/M-LAP in incremental disbursements is ~27%/20%
Due to GST, there is a slowdown in MSME and business loans amid confusion and
lack of clarity among borrowers.
Currently EQUITAS is only disbursing agri loans to farmers with land between 1-5
acres. It will roll out products for farmers with land above five acres soon.
About 70% of retail borrowers also are savings account customers.
NIMs declined due to lower earnings on the securitized portfolio and change in
mix of AUM. More than 30-40bps of NIM decline was due to lower Excess interest
Spread (from securitization transaction)
Asset quality
GNPA is the non-MFI book primarily stemmed from UCV and M-LAP. GNPAs for
UCV/M-LAP stood at ~6.5%/~1%.
EQUITAS expects a decline in non-MFI GNPLs going ahead as the product mix
will include higher share of larger-ticket secured loans to better quality
customers, albeit at a lower interest rates.
Unsold vehicle stock is shown as NPA in Bank.
Guidance
The company expects FY18 ROE to be lower than FY17 as FY18 includes the
full impact of transition towards SFB. Management guides for ROA and ROE of
2-2.5% and 16-20% in the next 3-5 years.
EQUITAS expects the MFI book to be below 30% by FY18 from current levels of
42%. Management is keen on building a stable book that is insulated from the
external environment.
EQUITAS expects to serve 10-11mn households by 2025 vs. 2.5-3.0mn
households currently.
Equitas Holdings Absolute – REDUCE Relative – UNDERWEIGHT 4% Downside in 14 Months
August 1, 2017 Analyst: Rohan Mandora [email protected] (+91-9737065666)/Ankit Choudhary [email protected] Page 7 of 14
Exhibit 7: ROE-ROA Tree Analysis
Particulars (Rsmn) FY17A FY18E FY19E FY20E
Yield on Gross AUMs 21.7% 20.1% 19.0% 18.6%
Yield on Investments 6.8% 6.8% 6.8% 6.8%
Cost of Funds 10.5% 8.9% 8.0% 7.8%
Net Interest Margin (incl off balance sheet) 10.6% 9.6% 10.3% 10.4%
Advances (A) 58,289 70,210 103,406 134,428
Investments (B) 7,731 15,113 16,467 22,835
Cash In Hand & Balance with RBI [C] 10,651 4,267 3,875 5,373
Securitization (D) 13,471 8,678 0 0
IEA (on & off balance sheet) (E = A+B+C+D) 90,142 98,268 123,748 162,636
Average IEA (on & off balance sheet) (F) 80,502 94,205 111,008 143,192
NII/Avg IEA(on &off balance sheet) 10.6% 9.6% 10.3% 10.4%
IEA (on balance sheet) (G = A+B+C) 76,671 89,590 123,748 162,636
AvgInt Earning Asset (on balance sheet) (H) 68,481 83,131 106,669 143,192
Asset multiplier (F/H) 1.18 1.13 1.04 1.00
NII/AvgInt Earning Asset (on balance sheet) 12.5% 10.9% 10.7% 10.4%
Non IntInc/AvgInt Earning Assets 2.2% 2.7% 1.8% 1.4%
Total Income/AvgInt Earning Assets 14.7% 13.7% 12.5% 11.8%
Op. Costs/AvgInt Earning Assets 8.9% 11.2% 9.3% 7.9%
PPI/AvgInt Earning Assets 5.8% 2.5% 3.2% 3.9%
Provisions/AvgInt Earning Assets 2.1% 1.2% 1.0% 1.1%
Taxes/AvgInt Earning Assets 1.3% 0.5% 0.7% 1.0%
Return on AvgInt Earning Assets 2.3% 0.8% 1.4% 1.8%
Adj Return on AvgInt Earning Assets 2.3% 0.8% 1.4% 1.8%
Productivity (Avg IEA/Avg Total Assets) 0.86 0.86 0.91 0.92
Return on Average Total Assets 2.0% 0.7% 1.3% 1.7%
Leverage (Avg Total Assets/Avg Equity) 4.5 4.2 4.9 6.0
Return on Average Equity 8.9% 3.1% 6.2% 10.1%
Source: Company Filings, Equirus Research
Equitas Holdings Absolute – REDUCE Relative – UNDERWEIGHT 4% Downside in 14 Months
August 1, 2017 Analyst: Rohan Mandora [email protected] (+91-9737065666)/Ankit Choudhary [email protected] Page 8 of 14
Company SnapshotHow we differ from Consensus
Equirus Consensus % Diff Comment
EPS FY18E 2.0 5.2 -61 %
We expect consensus estimates to be
revised
FY19E 4.3 7.9 -46 %
NII +
Other
Inc
FY18E 11,360 11,970 -5 %
FY19E 13,328 14,557 -8 %
PAT
(adj.)
FY18E 703 1,742 -60 %
FY19E 1,482 2,555 -42 %
Our Key Investment arguments: The company is in a migration phase to SFB and is
adversely impacted due to demonetization. We expect near term opex and credit cost
expenses to remain elevated and expect ROE to improve to double digit only by FY20.
Key Assumptions 2016A 2017A 2018E 2019E 2020E
Yields on Gross AUMs (%) 20.5% 21.7% 20.1% 19.0% 18.6%
Yield on Investments (%) 0.0% 6.8% 6.8% 6.8% 6.8%
Cost of Funds (%) 11.3% 10.5% 8.9% 8.0% 7.8%
NIMs (%) 10.2% 10.6% 9.6% 10.3% 10.4%
NII Growth (%) 53.2% 42.3% 6.3% 25.6% 30.2%
PPI Growth (%) 49.2% 24.3% -47.5% 61.6% 64.5%
Provision/Avg Loans(%) 1.4% 2.7% 1.5% 1.3% 1.3%
PAT Growth (%) 56.8% -4.7% -55.9% 110.9% 75.1%
Advances Growth (%) 46.3% 15.0% 20.5% 47.3% 30.0%
Deposit Growth (%) NA NA 102.1% 68.1% 40.5% Key Risks: Improvement in MFI collection efficiency, Faster breakeven of branches
leading to quicker recovery of profitability. Key Triggers: Early breakeven of branches, healthy recoveries from stressed portfolio
Sensitivity to Key Variables % Change % Impact on EPS
Net Interest Income 10 % 0.6 %
Provisioning Costs 10 % -6.4 %
ERoE Valuations & Assumptions
Rf Ke Term. Growth RoE in Terminal Yr
6.8 % 13.4 % 5.0 % 18.1 %
- FY18E FY19-22E FY23-27E FY28-37E
PAT Growth -55.9 % 43.3 % 20.7 % 18.0 %
Dividend Payout (%) 0.0 % 0.0 % 10.0 % 10.0 %
BV growth 3.1% 12.6% 16.2% 17.5%
RoE (%) 3.1 % 10.4 % 16.2 % 17.8 %
-
Years of strong growth 1 5 10 20
Valuation as on date (Rs) -76 15 64 139
Valuation as of Sep‘18 -89 18 74 161
Our Sep’18 TP of Rs.161 (vs.Sep’18 TP of Rs. 171 earlier) based on EroE basis. Our TP
corresponds to 2.5/2.4 Sep’18/Mar’19 ABV of Rs. 64/68.
Company Description:
Incorporated in 2005, Equitas Financial Services Ltd (Equitas) is a Tamil Nadu head-
quartered microfinance company which has been granted a small banking license by RBI
in 2015. The company offers Microfinance loans, housing loans, Used Commercial Vehicle
(UCV) loans and MSE loans. As on Mar ‘17, the firm has a distribution network of 610
branches across 14 states/UTs
Comparable valuation Mkt Cap
Rs. Mn.
Price
Target
Target
Date
EPS P/E BPS P/B RoE Div Yield
Company Reco. CMP FY17A FY18E FY19E FY17A FY18E FY19E FY17A FY18E FY17A FY18E FY19E FY17A FY18E
EQUITAS REDUCE 168 56,689 161 Sep '18 4.7 2.0 4.3 35.7 82.6 39.2 62.9 2.6 9 % 3 % 6 % 0.0 % 0.0 %
UJJIVAN REDUCE 323 38,657 361 Sep ’18 17.8 12.8 20.0 18.2 25.2 16.1 145.2 2.1 14 % 8 % 12 % 0.2 % 0.2 %
BHAFIN NR 845 116,613 NR NR 21.8 35.4 53.4 38.7 23.9 15.8 177.3 3.9 30 % 17 % 22 % 0.0 % 0.8 %
Equitas Holdings Absolute – REDUCE Relative – UNDERWEIGHT 4% Downside in 14 Months
August 1, 2017 Analyst: Rohan Mandora [email protected] (+91-9737065666)/Ankit Choudhary [email protected] Page 9 of 14
Consolidated Quarterly Earnings Forecast and Key Drivers Rs in Mn 1Q17A 2Q17A 3Q17A 4Q17A 1Q18A 2Q18E 3Q18E 4Q18E 1Q19E 2Q19E 3Q19E 4Q19E FY17A FY18A FY19E FY20E
Interest Income 3,259 3,560 3,822 3,782 3,744 3,770 3,789 3,872 3,979 4,214 4,450 4,703 14,423 15,175 17,346 22,072 Interest Expense 1,215 1,556 1,531 1,568 1,586 1,506 1,517 1,474 1,464 1,455 1,488 1,523 5,871 6,084 5,931 7,213
Net Interest Income 2,044 2,004 2,291 2,214 2,158 2,264 2,271 2,398 2,515 2,758 2,962 3,179 8,552 9,090 11,415 14,859
Non Interest Income 229 668 418 195 823 472 478 496 516 418 485 493 1,511 2,269 1,913 2,027
Total Income 2,273 2,673 2,709 2,409 2,980 2,736 2,750 2,894 3,031 3,177 3,448 3,673 10,063 11,360 13,328 16,886
Operating and Other Expenses 1,134 1,408 1,663 1,889 2,286 2,308 2,330 2,353 2,440 2,473 2,507 2,541 6,094 9,276 9,960 11,348 Staff Cost 752 920 1,118 1,171 1,352 1,366 1,379 1,393 1,463 1,478 1,492 1,507 3,961 5,491 5,940 6,831 Other Operating Expenses 381 488 545 719 724 738 753 768 791 815 840 865 2,134 2,984 3,311 4,517 Pre-Provision Income 1,139 1,265 1,045 520 694 428 420 541 591 704 941 1,131 3,968 2,083 3,367 5,538 Provisions and Write-offs 176 528 340 410 441 244 149 155 245 262 280 300 1,453 989 1,088 1,546 PBT 963 737 705 110 254 185 270 386 346 442 661 831 2,515 1,095 2,280 3,992 TAX 352 273 256 40 98 65 95 135 121 155 231 291 922 392 798 1,397 Extraordinary 0 0 0 0 0 0 0 0 0 0 0 0 0 0 0 0 PAT 612 463 449 69 156 120 176 251 225 287 429 540 1,593 703 1,482 2,595 EPS 2 1 1 0 0 0 1 1 1 1 1 2 5 2 4 7 Key Drivers - - - - - - - - - - - - - - - - YoA 20.6% 20.9% 21.4% 21.1% 21.1% 21.0% 20.3% 20.0% 19.5% 19.3% 19.0% 18.8% 21.7% 20.1% 19.0% 18.6% YoI 0.0 % 0.0 % 6.8 % 6.8 % 0.0 % 6.8 % 6.8 % 6.8 % 6.8 % 6.8 % 6.8 % 6.8 % 6.8 % 7.1 % 6.7 % 6.8 % CoF 11.0 % 12.1 % 10.2 % 10.1 % 10.5 % 9.7 % 9.0 % 8.7 % 8.3 % 8.9 % 8.2 % 8.1 % 10.5 % 8.9 % 8.0 % 7.8 %
NIM 11.5 % 9.6 % 9.7 % 9.1 % 9.2 % 9.4 % 9.6 % 9.9 % 10.0 % 10.4 % 10.5 % 10.6 % 10.6 % 9.6 % 10.3 % 10.4 %
C/I Ratio 50 % 53 % 61 % 78 % 77 % 84 % 85 % 81 % 80 % 78 % 73 % 69 % 61 % 82 % 75 % 67 % CD Ratio NA 5197% 805% 309% 271% 238% 213% 193% 184% 176% 168% 161% 309% 184% 161% 149% Non-Interest Income/ Total Income 10.1 % 25.0 % 15.4 % 8.1 % 27.6 % 17.3 % 17.4 % 17.1 % 17.0 % 13.2 % 14.1 % 13.4 % 15.0 % 20.0 % 14.4 % 12.0 % ROA 3.7 % 2.3 % 2.0 % 0.3 % 0.7 % 0.5 % 0.7 % 1.0 % 0.9 % 1.0 % 1.4 % 1.6 % 2.0 % 0.7 % 1.3 % 1.7 % ROE 14.2 % 8.7 % 8.2 % 1.2 % 2.8 % 2.1 % 3.1 % 4.4 % 3.9 % 4.9 % 7.2 % 8.9 % 8.9 % 3.1 % 6.2 % 10.1 % Sequential Growth (%) - - - - - - - - - - - - - - - -
NII 20.0 % -1.9 % 14.3 % -3.3 % -2.5 % 4.9 % 0.3 % 5.6 % 4.9 % 9.7 % 7.4 % 7.3 %
TI 18.1 % 17.6 % 1.3 % -11.1 % 23.7 % -8.2 % 0.5 % 5.2 % 4.7 % 4.8 % 8.5 % 6.5 %
PPI 30.3 % 11.0 % -17.3 % -50.3 % 33.6 % -38.3 % -2.0 % 28.9 % 9.3 % 19.1 % 33.7 % 20.2 % Provisions and Write-offs 20 % 200 % -36 % 21 % 7 % -45 % -39 % 4 % 58 % 7 % 7 % 7 % PAT 31 % -24 % -3 % -85 % 126 % -23 % 46 % 43 % -10 % 28 % 50 % 26 % EPS 8 % -28 % -2 % -85 % 125 % -11% -2% 1% -15% -1% 0% 4% Advances 13 % -1 % 4 % -1 % 5 % 9 % 5 % 5 % 9 % 7 % 13 % 7 %
Deposits - - 572 % 158 % 20 % 24 % 17 % 17 % 15 % 12 % 18 % 12 %
Total Business 5 % -1 % 7 % 6 % 6 % 6 % 6 % 6 % 5 % 6 % 6 % 8 % Yearly Growth (%) - - - - - - - - - - - - - - - - NII 62 % 40 % 47 % 30 % 6 % 13 % -1 % 8 % 17 % 22 % 30 % 33 % 42 % 6 % 26 % 30 % TI 52 % 66 % 53 % 25 % 31 % 2 % 2 % 20 % 2 % 16 % 25 % 27 % 48 % 13 % 17 % 27 % PPI 53 % 67 % 28 % -41 % -39 % -66 % -60 % 4 % -15 % 64 % 124 % 109 % 24 % -48 % 62 % 64 %
Provisions and Write-offs 7 % 283 % 138 % 181 % 151 % -54 % -56 % -62 % -44 % 8 % 88 % 94 % 146 % -32 % 10 % 42 %
PAT 64 % 16 % 4 % -85 % -74 % -74 % -61 % 263 % 44 % 139 % 144 % 115 % -5 % -56 % 111 % 75 % EPS 33.8% -8.8% -18.1% -88.4% -75.8% -74.1% -61.3% 261.7% 44.2% 139.1% 144.3% 115.4% -24.2% -56.8% 110.9% 75.1% Advances 42 % 27 % 17 % 15 % 7 % 18 % 18 % 26 % 31 % 29 % 39 % 41 % 15 % 20 % 47 % 30 % Deposits - - - - - 2,467 % 347 % 102 % 94 % 75 % 76 % 68 % - 102 % 68 % 40 %
Total Business 42 % 29 % 32 % 52 % 46 % 64 % 55 % 45 % 48 % 42 % 51 % 50 % 52 % 40 % 55 % 34 %
Equitas Holdings Absolute – REDUCE Relative – UNDERWEIGHT 4% Downside in 14 Months
August 1, 2017 Analyst: Rohan Mandora [email protected] (+91-9737065666)/Ankit Choudhary [email protected] Page 10 of 14
Consolidated Financials P&L FY17A FY18A FY19E FY20E
Balance Sheet (Rs mn) FY17A FY18A FY19E FY20E
FY17A FY18A FY19E FY20E
Interest Income 14,423 15,175 17,346 22,072 Capital 3,381 3,381 3,381 3,381 Asset Quality
Interest Expense 5,871 6,084 5,931 7,213 Reserves and Surplus 18,928 19,631 21,112 23,707 Gross NPA (Rs mn) 2,060 2,954 3,696 4,494
Net Interest Income 8,552 9,090 11,415 14,859 Deposits 18,857 38,105 64,047 89,983 Gross NPA (%) 3.5% 4.2% 3.6% 3.3%
% Growth 42.3% 6.3% 25.6% 30.2% Borrowings 46,572 33,015 13,443 17,476 Net NPA (Rs mn) 1,050 1,505 1,884 2,291
Other Income 1,511 2,269 1,913 2,027 Other Liabilities &
Provisions 6,698 3,984 33,387 41,875 Net NPA (%) 1.5% 2.1% 1.8% 1.7%
Total Income 10,063 11,360 13,328 16,886 Total liabilities 94,435 98,115 135,371 176,422 % coverage of NPA 49.0% 49.0% 49.0% 49.0%
Employees Expenses 3,961 5,491 5,940 6,831 Cash & Cash Equivalent 10,651 4,267 3,875 5,373
Other Op. Expenses 2,134 2,984 3,311 4,517 Investments 7,731 15,113 16,467 22,835 Business Ratios
Total Expenses 6,094 9,276 9,960 11,348 Advances 58,289 70,210 103,406 134,428 Credit /
Borrowing(%) 89.1% 98.7% 133.4% 125.1%
Operating Profit 1,593 703 1,482 2,595 Int Earnings Assets 66,020 85,323 119,873 157,263 Investment /
Deposit (%) 41.0% 39.7% 25.7% 25.4%
% Growth 24.3% -47.5% 61.6% 64.5% Fixed Assets 3,288 5,589 8,384 10,061 RoaA (%) 2.0% 0.7% 1.3% 1.7%
Tax 922 392 798 1,397 Other Assets 14,476 2,935 3,239 3,725 RoE (%) 8.9% 3.1% 6.2% 10.1%
Total Provisions 1,453.3 988.7 1,087.6 1,545.9
Total assets 94,435 98,115 135,371 176,422 Dividend Yield (%) 0.0% 0.0% 0.0% 0.0%
Net Profit 1,593.1 702.6 1,481.9 2,594.8 % Growth 45.1% 3.9% 38.0% 30.3%
% Growth -4.7% -55.9% 110.9% 75.1% Key assumptions Growth (%)
Earnings Ratios Borrowings Total IncGro 48.2% 12.9% 17.3% 26.7%
IntInc/Avg asset (%) 18.1% 15.8% 14.9% 14.2% Avg Borrowing gro (%) 39.7% 8.7% 9.0% 38.7%
Total Exp Gr 69.4% 52.2% 7.4% 13.9%
Int Exp./Avg. assets
(%) 7.4 % 6.3 % 5.1 % 4.6 % Avg cost of funds (%) 10.5% 8.9% 8.0% 7.8%
Provision Growth 145.9% -32.0% 10.0% 42.1%
NIM (%) - computed 10.6 % 9.6 % 10.3 % 10.4 % Advances
Int. exp/ Int earned
(%) 40.7 % 40.1 % 34.2 % 32.7 % Avg. advgro (%) 15.0% 20.5% 47.3% 30.0% Per Share Data
Oth. Inc./ Tot. Inc.
(%) 15.0 % 20.0 % 14.4 % 12.0 % Avg yield on AUM (%) 21.7% 20.1% 19.0% 18.6% BVPS Rs 66.0 68.1 72.5 80.2
Staff exp/Total opt.
exp (%) 65.0 % 59.2 % 59.6 % 60.2 % Investments Adj. BVPS, Rs. 62.9 63.7 66.9 73.4
Cost/ Income Ratio
(%) 60.6 % 81.7 % 74.7 % 67.2 % Avg. investmtgro (%) 6412.8% 95.5% 9.0% 38.7% Price/ Adj. BV 2.7 2.6 2.5 2.3
Prov./ Operating
Profit (%) 36.6 % 47.5 % 32.3 % 27.9 %
Avg. YoI (%) 6.8% 6.8% 6.8% 6.8%
EPS, Rs. 4.7 2.0 4.3 7.5
P/E Ratio 35.7 82.6 39.2 22.4
Equitas Holdings Absolute – REDUCE Relative – UNDERWEIGHT 4% Downside in 14 Months
August 1, 2017 Analyst: Rohan Mandora [email protected] (+91-9737065666)/Ankit Choudhary [email protected] Page 11 of 14
Historical Consolidated Financials P&L FY14A FY15A FY16A FY17A
Balance Sheet FY14A FY15A FY16A FY17A
FY14A FY15A FY16A FY17A
Interest Income 4,355 6,868 10,368 14,423 Capital 730 2,689 2,699 3,381 Asset Quality
Interest Expense 1,895 2,947 4,360 5,871 Reserves and Surplus 6,690 9,019 10,714 18,928 Gross NPA (Rs mn) 155 374 681 2,060
Net Interest Income 2,460 3,921 6,008 8,552 Deposits 0 0 0 18,857 Gross NPA (%) 0.7% 1.1% 1.3% 3.5%
% Growth 67.4% 59.4% 53.2% 42.3% Borrowings 18,492 30,322 46,833 46,572 Net NPA (Rs mn) 130 278 478 1,050
Other Income 480 691 780 1,511 Other Liabilities 1,604 2,619 4,819 6,698 Net NPA (%) 0.6% 0.8% 0.9% 1.5%
Total Income 2,940 4,612 6,789 10,063 Total liabilities 27,516 44,649 65,065 94,435 % coverage of NPA 16.4% 25.7% 29.9% 49.0%
Employees Expenses 1,003 1,551 2,338 3,961 Cash & Cash Equivalent 4,147 5,574 9,470 10,651
Other Op. Expenses 615 921 1,259 2,134 Investments 34 1,755 119 7,731 Business Ratios
Total Expenses 1,618 2,472 3,597 6,094 Advances 21,232 34,646 50,702 58,289 Credit / Borrowing 114.8% 114.3% 108.3% 89.1%
Operating Profit 1,322 2,140 3,192 3,968 Int Earnings Assets 21,266 36,401 50,821 66,020 Investment/Deposit NA NA NA 41.0%
% Growth 166.8% 61.9% 49.2% 24.3% Fixed Assets 272 467 658 3,288 RoaA (%) 3.2% 3.0% 3.0% 2.0%
Tax 395 570 930 922 Other Assets 1,831 2,206 4,117 14,476 RoE (%) 12.2% 11.1% 13.3% 8.9%
Total Provisions 183.9 504.3 591.1 1,453.3 Total assets 27,516 44,649 65,065 94,435 Dividend Yield (%) 0.0% 0.0% 0.0% 0.0%
Net Profit 743.4 1,066.0 1,671.1 1,593.1 % Growth 48.4% 62.3% 45.7% 45.1%
% Growth 126.8% 43.4% 56.8% -4.7% Key assumptions Growth (%)
Earnings Ratios Borrowings
Total Income Gr 67.5% 56.9% 47.2% 48.2%
Int Inc./Avg. Assets 18.9% 19.0% 18.9% 18.1%
Avg Borrowing growth 45.1% 64.0% 54.5% 39.7%
Total Exp Gr 28.4% 52.8% 45.5% 69.4%
Int Exp./Avg. assets 8.2% 8.2% 7.9% 7.4% Avg cost of funds (%) 11.8% 11.6% 11.3% 10.5% Provision Growth 106.3% 174.3% 17.2% 145.9%
NIM (%) - computed 10.2% 10.3% 10.2% 10.6% Advances
Int. exp/ Int earned 43.5% 42.9% 42.0% 40.7% Avg. advances growth 75.0% 63.2% 46.3% 15.0%
Per Share Data
Oth. Inc./ Tot. Inc. 16.3% 15.0% 11.5% 15.0% Avg yield on AUM (%) 21.9% 21.1% 20.5% 21.7% BVPS 102.1 43.5 49.7 66.0
Staff exp/Opex 62.0% 62.7% 65.0% 65.0% Investments Adj. BVPS, Rs. 100.4 42.5 47.9 62.9
Cost/ Income Ratio 55.0% 53.6% 53.0% 60.6% Avg. investments Gr -13.8% 5060.2% -93.2% 6412.8% Price/ Adj. BVPS 1.7 3.9 3.5 2.7
Prov./ Op Profit 13.9% 23.6% 18.5% 36.6%
Avg. YoI 0.0% 0.0% 0.0% 6.8%
EPS, Rs. 4.0 4.5 6.2 4.7
P/E Ratio 42.0 37.5 27.1 35.7
Equitas Holdings Absolute – REDUCE Relative – UNDERWEIGHT 4% Downside in 14 Months
August 1, 2017 Analyst: Rohan Mandora [email protected] (+91-9737065666)/Ankit Choudhary [email protected] Page 12 of 14
Equirus Securities
Research Analysts Sector/Industry Email
Equity Sales E-mail
Abhishek Shindadkar IT Services [email protected] 91-22-43320643 VishadTurakhia [email protected] 91-22-43320633
Ashutosh Tiwari Auto, Metals & Mining [email protected] 91-79-61909517 Subham Sinha [email protected] 91-22-43320631
Depesh Kashyap Mid-Caps [email protected] 91-79-61909528 SwetaSheth [email protected] 91-22-43320634
Devam Modi Power & Infrastructure [email protected] 91-79-61909516 Viral Desai [email protected] 91-22-43320635
DhavalDama FMCG, Mid-Caps [email protected] 91-79-61909518 BinoyDharia [email protected] 91-22-43320632
Manoj Gori Consumer Durables [email protected] 91-79-61909523 Dealing Room E-mail
Maulik Patel Oil and Gas [email protected] 91-79-61909519 Ashish Shah [email protected] 91-22-43320662
Praful Bohra Pharmaceuticals [email protected] 91-79-61909532 IleshSavla [email protected] 91-22-43320666
Rohan Mandora Banking & Financial Services [email protected] 91-79-61909529 Manoj Kejriwal [email protected] 91-22-43320663
Associates E-mail Dharmesh Mehta [email protected] 91-22-43320661
Ankit Choudhary [email protected] 91-79-61909533 SandipAmrutiya [email protected] 91-22-43320660
Ashdeep Kaur [email protected] 91-79-61909595 Compliance Officer E-mail
Bharat Celly [email protected] 91-79-61909524 Jay Soni [email protected] 91-79-61909561
Harshit Patel [email protected] 91-79-61909522
Meet Chande [email protected] 91-79-61909513
ParvaSoni [email protected] 91-79-61909521
Pranav Mehta [email protected] 91-79-61909514
RonakSoni [email protected] 91-79-61909525
Samkit Shah [email protected] 91-79-61909520
ShreepalDoshi [email protected] 91-79-61909541
Vikas Jain [email protected] 91-79-61909531
Rating & Coverage Definitions: Absolute Rating • LONG : Over the investment horizon, ATR >= Ke for companies with Free Float market cap >Rs 5 billion andATR>= 20% for rest of the companies • ADD: ATR >= 5% but less than Ke over investment horizon • REDUCE: ATR >= negative 10% but <5% over investment horizon • SHORT: ATR < negative 10% over investment horizon Relative Rating • OVERWEIGHT: Likely to outperform the benchmark by at least 5% over investment horizon • BENCHMARK: likely to perform in line with the benchmark • UNDERWEIGHT: likely to under-perform the benchmark by at least 5% over investment horizon Investment Horizon Investment Horizon is set at a minimum 3 months to maximum 18 months with target date falling on last day of a calendar quarter. Lite vs. Regular Coverage vs. Spot Coverage We aim to keep our rating and estimates updated at least once a quarter for Regular Coverage stocks. Generally, we would have access to the company and we would maintain detailed financial model for Regular coverage companies. We intend to publish updates on Lite coverage stocks only an opportunistic basis and subject to our ability to contact the management. Our rating and estimates for Lite coverage stocks may not be current. Spot coverage is meant for one-off coverage of a specific company and in such cases, earnings forecast and target price are optional. Spot coverage is meant to stimulate discussion rather than provide a research opinion.
Registered Office: Equirus Securities Private Limited Unit No. 1201, 12th Floor, C Wing, Marathon Futurex, N M Joshi Marg, Lower Parel, Mumbai-400013. Tel. No: +91 – (0)22 – 4332 0600 Fax No:+91-(0)22 – 4332 0601
Corporate Office: 3rd floor, House No. 9, Magnet Corporate Park, Near Zydus Hospital, B/H Intas Sola Bridge, S.G. Highway Ahmedabad-380054 Gujarat Tel. No: +91 (0)79 - 6190 9550 Fax No:+91 (0)79 – 6190 9560
Equitas Holdings Absolute – REDUCE Relative – UNDERWEIGHT 4% Downside in 14 Months
August 1, 2017 Analyst: Rohan Mandora [email protected] (+91-9737065666)/Ankit Choudhary [email protected] Page 13 of 14
© 2017 Equirus Securities Private Limited. All rights reserved. For Private Circulation only. This report or any portion hereof may not
be reprinted, sold or redistributed without the written consent of Equirus Securities Private Limited
Analyst Certification
We, Rohan Mandora/Ankit Choudhary, author to this report, hereby certify that all of the views expressed in this report accurately reflect my personal views about the subject company or companies and its or
their securities. I also certify that no part of my compensation was, is or will be, directly or indirectly, related to the specific recommendations or views expressed in this report.
Disclosures
Equirus Securities Private Limited (ESPL) having Corporate Identification Number U65993MH2007PTC176044 is registered in India with Securities and Exchange Board of India (SEBI) as a trading member on the
Capital Market (Reg. No. INB231301731), Futures & Options Segment (Reg. No.INF231301731) of the National Stock Exchange of India Ltd. (NSE) and on Cash Segment (Reg. No.INB011301737) of Bombay Stock
Exchange Limited (BSE).ESPL is also registered with SEBI as Research Analyst under SEBI (Research Analyst) Regulations, 2014 (Reg. No. INH000001154), as a Portfolio Manager under SEBI (Portfolio Managers
Regulations, 1993 (Reg. No.INP000005216) and as a Depository Participant of the Central Depository Services (India) Limited (Reg. No.IN-DP-324-2017). There are no disciplinary actions taken by any regulatory
authority against ESPL. ESPL is a subsidiary of Equirus Capital Pvt. Ltd. (ECPL) which is registered with SEBI as Category I Merchant Banker and provides investment banking services including but not limited to
merchant banking services, private equity, mergers & acquisitions and structured finance.
As ESPL and its associates are engaged in various financial services business, it might have: - (a) received compensation (except in connection with the preparation of this report) from the subject company for
investment banking or merchant banking or brokerage services in the past twelve months;(b) managed or co-managed public offering of securities for the subject company in the past twelve months; or (c) have
received a mandate from the subject company; or (d) might have other financial, business or other interests in entities including the subject company (ies) mentioned in this Report. ESPL & its associates, their
directors and employees may from time to time have positions or options in the company and buy or sell the securities of the company (ies) mentioned herein. ESPL and its associates collectively do not own (in
their proprietary position) 1% or more of the equity securities of the subject company mentioned in the report as the last day of the month preceding the publication of the research report. ESPL or its Analyst or
Associates did not receive any compensation or other benefits from the companies mentioned in the report or third party in connection with preparation of the research report. Accordingly, neither ESPL nor
Research Analysts have any material conflict of interest at the time of publication of this report. Compensation of our Research Analysts is not based on any specific merchant banking, investment banking or
brokerage service transactions. ESPL has not been engaged in market making activity for the subject company.
The Research Analyst engaged in preparation of this Report:-
(a) has not received any compensation from the subject company in the past twelve months; (b) has not managed or co-managed public offering of securities for the subject company in the past twelve months;
(c) has not received any compensation for investment banking or merchant banking or brokerage services from the subject company in the past twelve months; (d) has not received any compensation for products
or services other than investment banking or merchant banking or brokerage services from the subject company in the past twelve months; (e) has not received any compensation or other benefits from the
subject company or third party in connection with the research report; (f) might have served as an officer, director or employee of the subject company; (g) is not engaged in market making activity for the
subject company.
This document is not directed or intended for distribution to, or use by, any person or entity who is a citizen or resident of or located in any locality, state, country or other jurisdiction, where such distribution,
publication, availability or use would be contrary to law, regulation or which would subject ESPL and affiliates to any registration or licensing requirement within such jurisdiction. The securities described herein
may or may not be eligible for sale in all jurisdictions or to a certain category of investors. Persons in whose possession of this document are required to inform themselves of, and to observe, such applicable
restrictions. Please delete this document if you are not authorized to view the same. By reading this document you represent and warrant that you have full authority and all rights necessary to view and read this
document without subjecting ESPL and affiliates to any registration or licensing requirement within such jurisdiction.
This document has been prepared solely for information purpose and does not constitute a solicitation to any person to buy, sell or subscribe any security. ESPL or its affiliates are not soliciting any action based
on this report. The information and opinions contained herein is from publicly available data or based on information obtained in good faith from sources believed to be reliable but ESPL provides no guarantee as
to its accuracy or completeness. The information contained herein is as on date of this report, and is subject to change or modification and any such changes could impact our interpretation of relevant
information contained herein. While we would endeavour to update the information herein on reasonable basis, ESPL and its affiliates, their directors and employees are under no obligation to update or keep the
information current. Also there may be regulatory, compliance, or other reasons that may prevent ESPL and its group companies from doing so. This document is prepared for assistance only and is not intended
to be and must not alone be taken as the basis for an investment decision. Each recipient of this document should make such investigations as it deems necessary to arrive at an independent evaluation of an
investment in the securities of companies referred to in this document including the merits and risks involved. This document is intended for general circulation and does not take into account the specific
investment objectives, financial situation or particular needs of any particular person. ESPL and its group companies, employees, directors and agents accept no liability, and disclaim all responsibility, for the
consequences of you or anyone else acting, or refraining to act, in reliance on the information contained in this publication or for any decision based on it. ESPL/its affiliates do and seek to do business with
companies covered in its research report. Thus, investors should be aware that the firm may have conflict of interest.
Equitas Holdings Absolute – REDUCE Relative – UNDERWEIGHT 4% Downside in 14 Months
August 1, 2017 Analyst: Rohan Mandora [email protected] (+91-9737065666)/Ankit Choudhary [email protected] Page 14 of 14
A graph of daily closing prices of securities is available at http://www.nseindia.com/ChartApp/install/charts/mainpage.jsp and www.bseindia.com (Choose a company from the list on the browser and select the
“three years” period in the price chart).
Disclosure of Interest statement for the subject Company Yes/No If Yes, nature of such interest
Research Analyst’ or Relatives’ financial interest No
Research Analyst’ or Relatives’ actual/beneficial ownership of 1% or more No
Research Analyst’ or Relatives’ material conflict of interest No
Disclaimer for U.S. Persons
ESPL/its affiliates are not a registered broker–dealer under the U.S. Securities Exchange Act of 1934, as amended (the“1934 act”) and under applicable state laws in the United States. In addition Equirus is not a
registered investment adviser under the U.S. Investment Advisers Act of 1940, as amended (the "Advisers Act" and together with the 1934 Act, the “Acts”), and under applicable state laws in the United States.
Accordingly, in the absence of specific exemption under the Acts, any brokerage and investment services provided by Equirus, including the products and services described herein are not available to or intended
for U.S. persons. The information contained in this Report is not intended for any person who is a resident of the United States of America or a resident of any jurisdiction, the laws of which imposes prohibition
on soliciting the securities business in that jurisdiction without going through the registration requirements and/ or prohibit the use of any information contained in this report. This Report and its respective
contents do not constitute an offer or invitation to purchase or subscribe for any securities or solicitation of any investments or investment services and/or shall not be considered as an advertisement tool. "U.S.
Persons" are generally defined as a natural person, residing in the United States or any entity organized or incorporated under the laws of the United States. US Citizens living abroad may also be deemed "US
Persons" under certain rules.