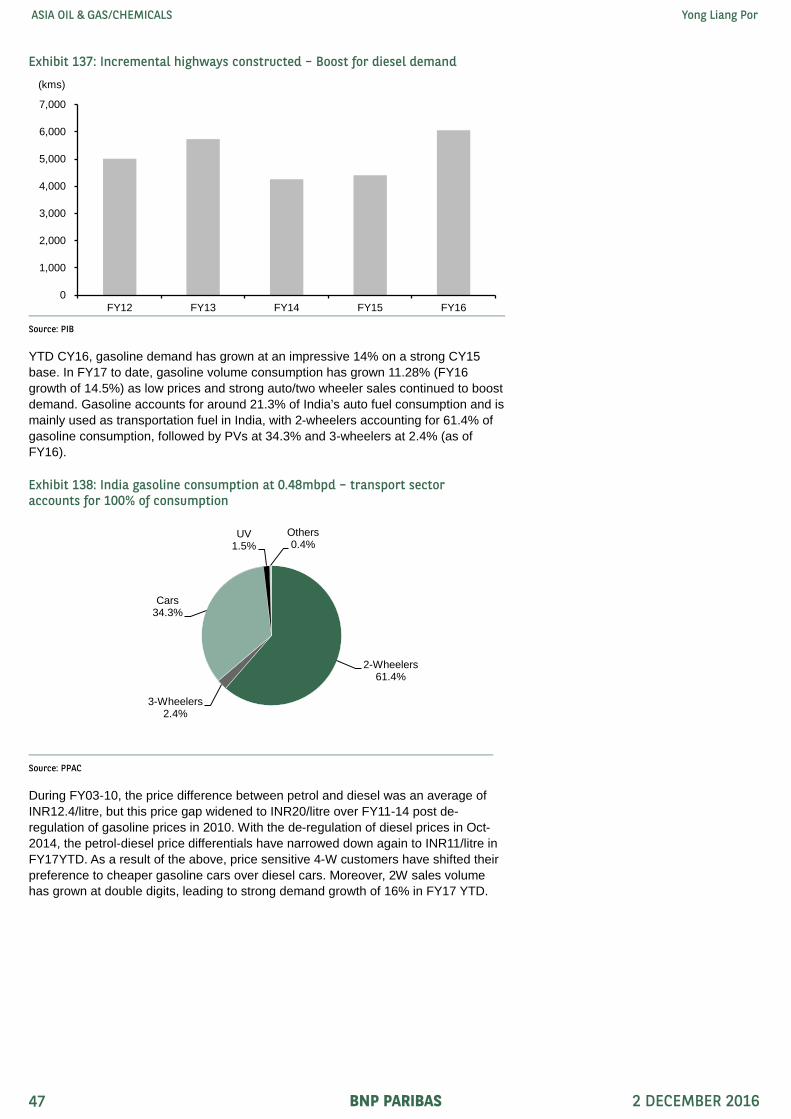
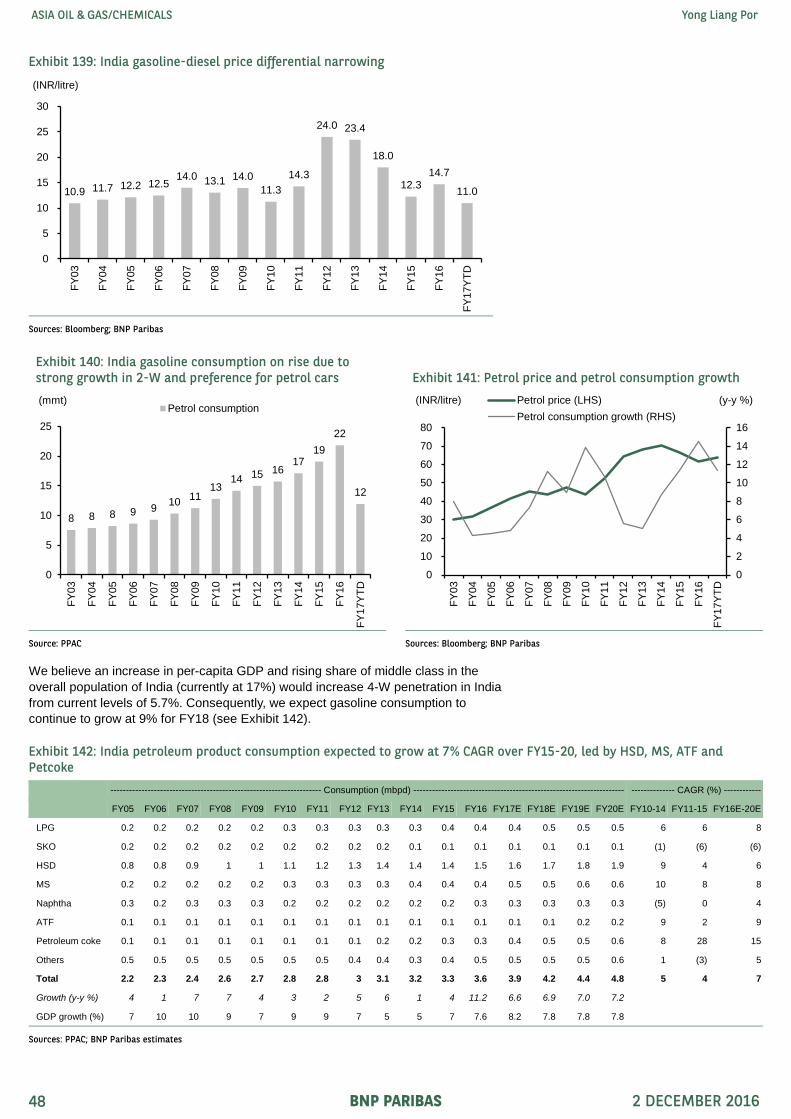
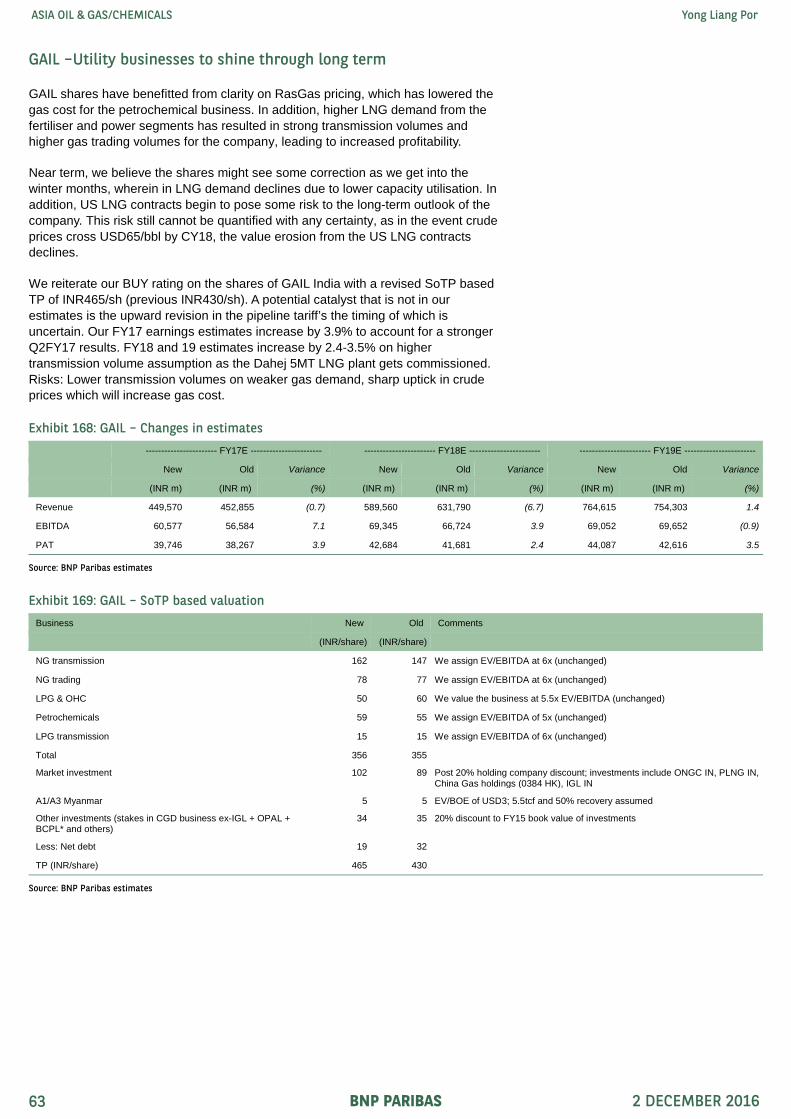
EQUITIES RESEARCH ASIA OIL & GAS/CHEMICALS 2017 Outlook: Less is more A range of production curbs, from OPEC cuts to China’s supply side reform, is reflating prices in the oil markets from upstream to downstream. We forecast a 2017 Brent price of USD58/bbl (+USD14/bbl y-y) and strong chemical margins. Heightened price volatility is a natural consequence of greater policy interference and thus uncertainty. We expect the refining and chemical upcycle to continue into its third year, with rebounding diesel demand and stricter gasoline standards boosting refining margins. Our refining BUYs are SKI, S-Oil and TOP. Despite peaking ethylene margins, overall chemical margins are supported by strong demand and supply-side measures in China. Our chemical BUYs are LC, NYP and PTTGC. Recovering oil prices and diesel demand are positive for CNOOC and Sinopec (both BUY), but current high implied LT oil prices and diminishing oil reserves remain concerns. In India, our top BUYs are HPCL, PLNG and GAIL as beneficiaries of continued strong domestic oil & gas demand growth. Yong Liang Por [email protected]+852 2825 1877 Amit Shah [email protected]+91 22 6196 4394 Our research is available on Thomson One, Bloomberg, TheMarkets.com, Factset and on http://eqresearch.bnpparibas.com/index. Please contact your salesperson for authorisation. Please see the important notice on the inside back cover. 2 DECEMBER 2016 PREPARED AND PUBLISHED BY NON-US BROKER-DEALER(S): BNP PARIBAS SECURITIES (ASIA) LTD, BNP PARIBAS SECURITIES INDIA PVT. LTD. (SEBI REGISTERED RESEARCH ANALYST). THIS MATERIAL HAS BEEN APPROVED FOR U.S DISTRIBUTION. ANALYST CERTIFICATION AND IMPORTANT DISCLOSURES CAN BE FOUND AT APPENDIX ON PAGE 124
Transcript
EQUITIES RESEARCH
ASIA OIL & GAS/CHEMICALS 2017 Outlook: Less is more
A range of production curbs, from OPEC cuts to China’s supply side reform, is reflating prices in the oilmarkets from upstream to downstream. We forecast a 2017 Brent price of USD58/bbl (+USD14/bbl y-y)and strong chemical margins. Heightened price volatility is a natural consequence of greater policyinterference and thus uncertainty.
We expect the refining and chemical upcycle to continue into its third year, with rebounding dieseldemand and stricter gasoline standards boosting refining margins. Our refining BUYs are SKI, S-Oiland TOP. Despite peaking ethylene margins, overall chemical margins are supported by strongdemand and supply-side measures in China. Our chemical BUYs are LC, NYP and PTTGC.
Recovering oil prices and diesel demand are positive for CNOOC and Sinopec (both BUY), but currenthigh implied LT oil prices and diminishing oil reserves remain concerns. In India, our top BUYs areHPCL, PLNG and GAIL as beneficiaries of continued strong domestic oil & gas demand growth.
Our research is available on Thomson One, Bloomberg, TheMarkets.com, Factset and on http://eqresearch.bnpparibas.com/index. Please contact your salesperson for authorisation. Please see the important notice on the inside back cover.
2 DECEMBER 2016 PREPARED AND PUBLISHED BY NON-US BROKER-DEALER(S): BNP PARIBAS SECURITIES (ASIA) LTD, BNP PARIBAS SECURITIES INDIA PVT. LTD. (SEBI REGISTERED RESEARCH ANALYST). THIS MATERIAL HAS BEEN APPROVED FOR U.S DISTRIBUTION. ANALYST CERTIFICATION AND IMPORTANT DISCLOSURES CAN BE FOUND AT APPENDIX ON PAGE 124
ASIA OIL & GAS/CHEMICALS Yong Liang Por
To find out more about BNP Paribas Equities Research:
Visit : http://eqresearch.bnpparibas.com/ For ipad users : http://appstore.apple.com/BNPP-equities/
ASIA OIL & GAS/CHEM ICALS BNP PARIBAS Yong Li ang Por
THIS REPORT IS SOLELY FOR RECIPIENTS WHO ARE NON-CHINESE INVESTORS LOCATED OUTSIDE THE PEOPLE'S REPUBLIC OF CHINA ("PRC"). WITHOUT THE PRIOR WRITTEN CONSENT OF BNP PARIBAS, THE RECIPIENTS OF THIS REPORT SHALL NOT FURTHER DISTRIBUTE SUCH REPORT OR DISCLOSE ANY INFORMATION THEREIN TO ANY OTHER PERSON INCLUDING BUT NOT LIMITED TO ANY OTHER NON-CHINESE INVESTORS OR ANY PERSON IN PRC. 2 DECEMBER 2016 SECTOR REPORT
ASIA OIL & GAS/CHEMICALS
2017 Outlook: Less is more
Increased intervention The oil markets, from upstream to downstream, are being reflated by a broad range of supply-
side measures. OPEC’s decision on 30 November to cut production heralds the return of the Saudi put, tightening the oil market for at least the duration of the initial six-month agreement. We assume a Brent price of USD58/bbl for 2017 (vs USD44/bbl in 2016). Similarly, chemicals have benefited from China’s cut in coal production and rising freight costs. We think the price of increased intervention, and thus policy uncertainty, is heightened volatility.
Refining and Chemical upcycles continue
We expect Asian refining margins to improve modestly in 2017, on the back of rebounding diesel demand, gasoline specification changes and stable China exports. Our Refining BUYs are SKI, S-Oil and Thai Oil, which we favour for their attractive valuations and high dividend yields. Despite peaking ethylene margins, we expect overall chemical margins to remain strong, boosted by rebounding China demand, weakening competitiveness of coal-chemicals, and slowing capacity additions. Our Chemical BUYs are Lotte Chemical, NYP and PTTGC.
China recovers; India boom continues
China NOCs stand to benefit from rising oil prices and recovering diesel demand, but share price performance may be curbed by high implied LT oil prices and diminishing oil reserves. Our China BUYs are CNOOC and Sinopec, which offer higher dividends and cheaper valuations than PetroChina (HOLD). In India, our top BUYs are HPCL, PLNG and GAIL, as beneficiaries of continued strong oil and gas demand growth and more favourable gas pricing. We also rate RIL BUY as plant expansions are now closer to starting up and the telecom launch has been successful.
We have a positive top-down view on the Asian Oil & Gas and chemical sector, where we see reflation taking hold in 2017 as overproduction is reined in on all fronts.
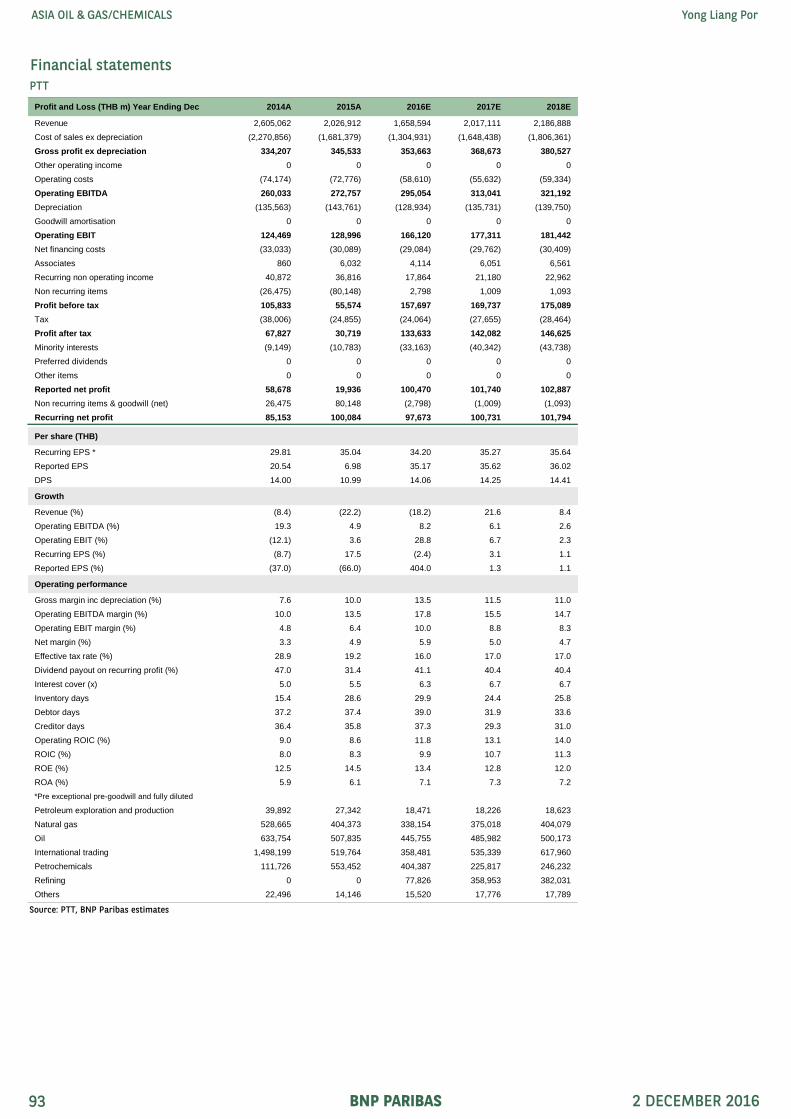
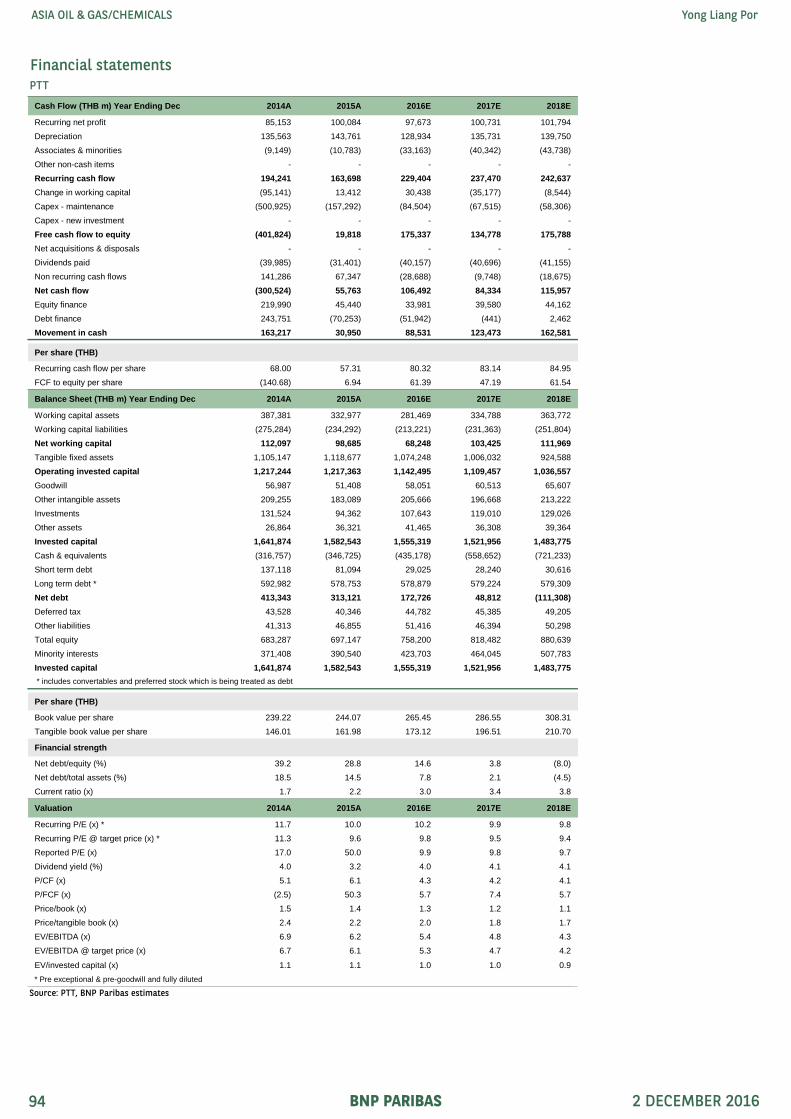
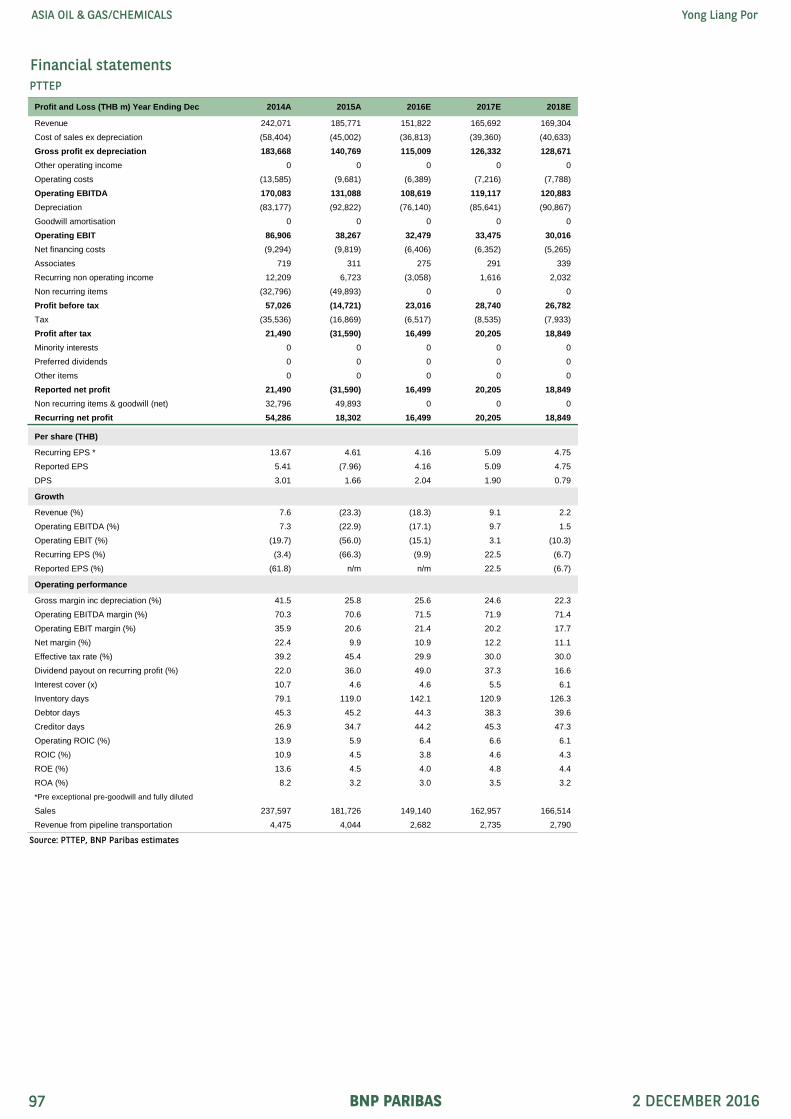
We believe OPEC’s decision on 30 Nov to reduce oil production, leading to a rebalanced market, signals the bottom for oil prices. We forecast a Brent price of USD58/bbl in 2017 and have BUYs on CNOOC, PTTEP and Sinopec.
We expect the period of high margins and steady earnings for the refining sector to continue, with supply-demand balanced between rebounding diesel demand, changing gasoline standards, and rising China exports. Our BUYs are SKI, S-Oil and Thai Oil.
Despite falling ethylene margins, we expect overall chemical margins to remain strong, as rebounding demand, weakening competitiveness of coal-chemicals and slowing capacity growth boost margins of aromatics, chlor-alkali and polyester chains. Our BUYs are Lotte Chem, NYP and PTTGC.
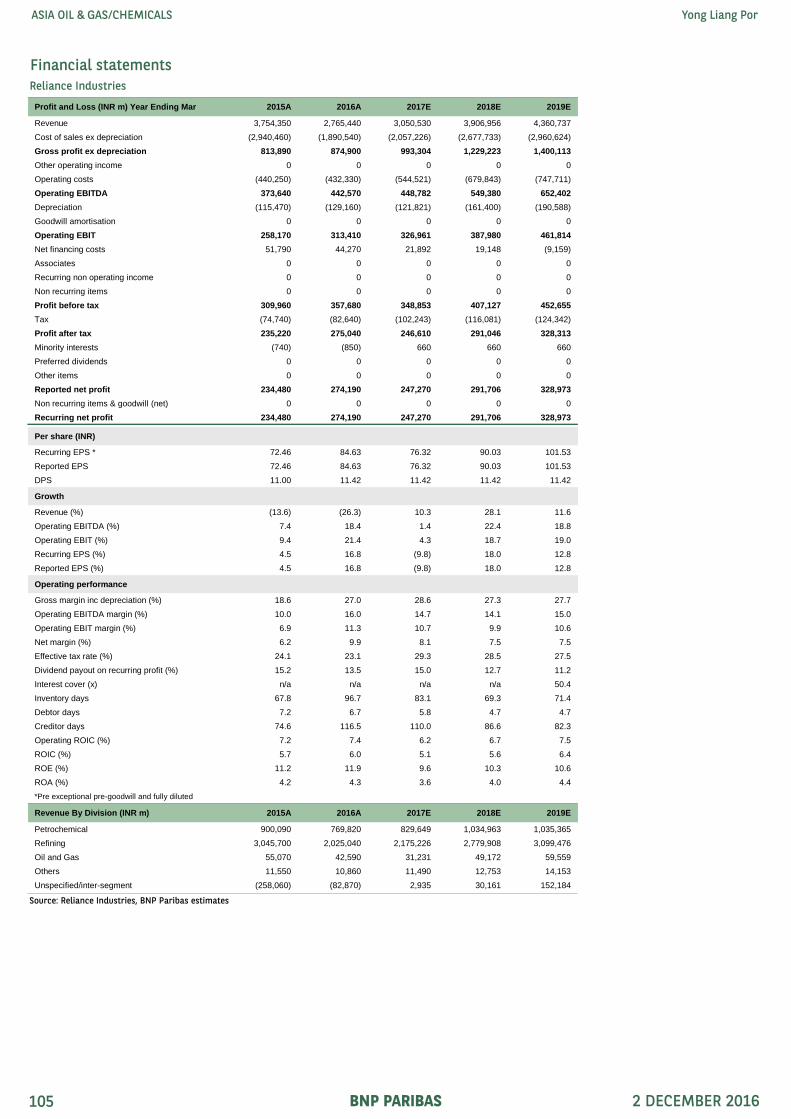
In India, our top BUYs are HPCL, PLNG and GAIL, as beneficiaries of continued strong oil and gas demand growth and more favourable gas pricing. We also rate RIL BUY as plant expansions are now closer to starting up and the telecom launch has been successful.
Catalysts
In 2017, we see reflationary dynamics in the energy markets being driven by 1) rising oil prices following OPEC’s decision to cut production; 2) rebounding diesel demand with recovering commodity production; and 3) China’s supply side reforms, which have reduced chemical oversupply.
Risks to our call
Oil prices may not recover if OPEC members do not adhere to the production cut targets, or if US production rebounds more quickly than we expect.
Refining margins may fall if refiners excessively increase runs or if our anticipated rebound in diesel demand does not materialise.
Chemical margins may falter if the current strength in Chinese demand is due to commodity speculation instead of end-product demand.
In 2016 to date, Brent prices fell to a bottom of USD28/bbl in January and rallied strongly to USD49/bbl by June, as discussions over a production freeze in April improved sentiment while significant production disruptions in Nigeria and Canada brought the market to a balance in mid-16. Subsequently, production growth resumed, resulting in falling prices, leading OPEC to propose a production cut in September.
On 30 November, OPEC followed through with its September proposal, agreeing on a 1.2mb/d production cut effective from 1 January 2017, for a duration of six months and extendable by another six months. Other non-OPEC countries, including Russia, indicated they would contribute production cuts of 600kb/d.
With this production cut, we expect the oil market to tighten in 2017 by up to 0.9mb/d. We now have more conviction in a tightening market as we believe there is upside to major agencies’ oil demand forecasts; we expect diesel demand to rebound in 2017 after a record 400kb/d fall in 2016.
From this point, we believe the trajectory of oil prices will depend on compliance with OPEC cuts and the pace of US production increases. Near term, oil prices remain restrained by record inventories and the rising USD; the latter point leads us to slightly lower 2017/18 Brent assumptions by USD2/bbl each to USD58/68 per barrel.
In these circumstances, our BUYs are CNOOC, PTTEP and Sinopec, as beneficiaries of modestly rising oil prices and reasonable valuations. We are cautious on PetroChina as we believe there is less upside potential to gas prices, while valuations and dividend yields are relatively less attractive.
Exhibit 1: Global oil supply less demand Exhibit 2: Global oil demand growth comparison
As of 30 Nov 2016 Sources: Bloomberg; BNP Paribas estimates
(1.5)
(1.0)
(0.5)
0.0
0.5
1.0
1.5
2.0
10 11 12 13 14 15 16 17E
Without OPEC cut With OPEC cut(mb/d)
Surplus
Deficit
0.6
0.7
0.8
0.9
1.0
1.1
1.2
1.3
1.4
1.5
1.6
16E 17E
(mb/d)IEA BNPP IHS
BNP PARIBAS 2 DECEMBER 2016 5
ASIA OIL & GAS/CHEMICALS Yong Liang Por
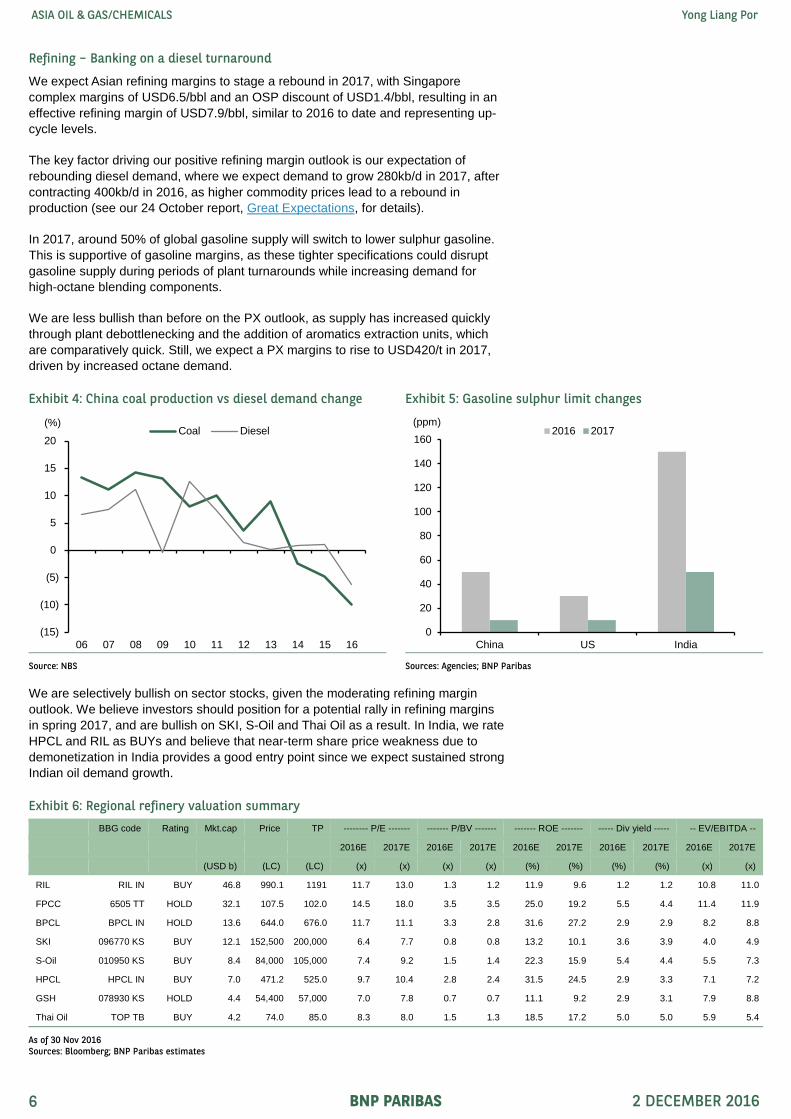
Refining – Banking on a diesel turnaround
We expect Asian refining margins to stage a rebound in 2017, with Singapore complex margins of USD6.5/bbl and an OSP discount of USD1.4/bbl, resulting in an effective refining margin of USD7.9/bbl, similar to 2016 to date and representing up-cycle levels.
The key factor driving our positive refining margin outlook is our expectation of rebounding diesel demand, where we expect demand to grow 280kb/d in 2017, after contracting 400kb/d in 2016, as higher commodity prices lead to a rebound in production (see our 24 October report, Great Expectations, for details).
In 2017, around 50% of global gasoline supply will switch to lower sulphur gasoline. This is supportive of gasoline margins, as these tighter specifications could disrupt gasoline supply during periods of plant turnarounds while increasing demand for high-octane blending components.
We are less bullish than before on the PX outlook, as supply has increased quickly through plant debottlenecking and the addition of aromatics extraction units, which are comparatively quick. Still, we expect a PX margins to rise to USD420/t in 2017, driven by increased octane demand.
We are selectively bullish on sector stocks, given the moderating refining margin outlook. We believe investors should position for a potential rally in refining margins in spring 2017, and are bullish on SKI, S-Oil and Thai Oil as a result. In India, we rate HPCL and RIL as BUYs and believe that near-term share price weakness due to demonetization in India provides a good entry point since we expect sustained strong Indian oil demand growth.
Exhibit 4: China coal production vs diesel demand change Exhibit 5: Gasoline sulphur limit changes
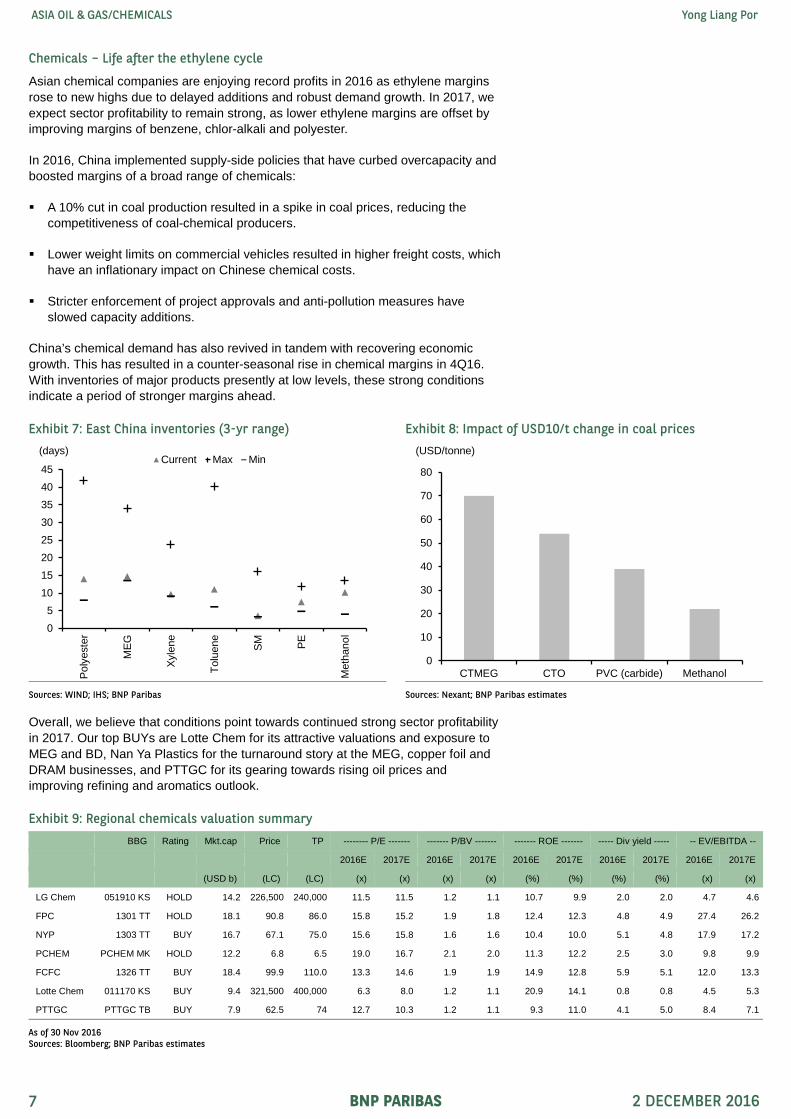
Asian chemical companies are enjoying record profits in 2016 as ethylene margins rose to new highs due to delayed additions and robust demand growth. In 2017, we expect sector profitability to remain strong, as lower ethylene margins are offset by improving margins of benzene, chlor-alkali and polyester.
In 2016, China implemented supply-side policies that have curbed overcapacity and boosted margins of a broad range of chemicals:
A 10% cut in coal production resulted in a spike in coal prices, reducing the competitiveness of coal-chemical producers.
Lower weight limits on commercial vehicles resulted in higher freight costs, which have an inflationary impact on Chinese chemical costs.
Stricter enforcement of project approvals and anti-pollution measures have slowed capacity additions.
China’s chemical demand has also revived in tandem with recovering economic growth. This has resulted in a counter-seasonal rise in chemical margins in 4Q16. With inventories of major products presently at low levels, these strong conditions indicate a period of stronger margins ahead.
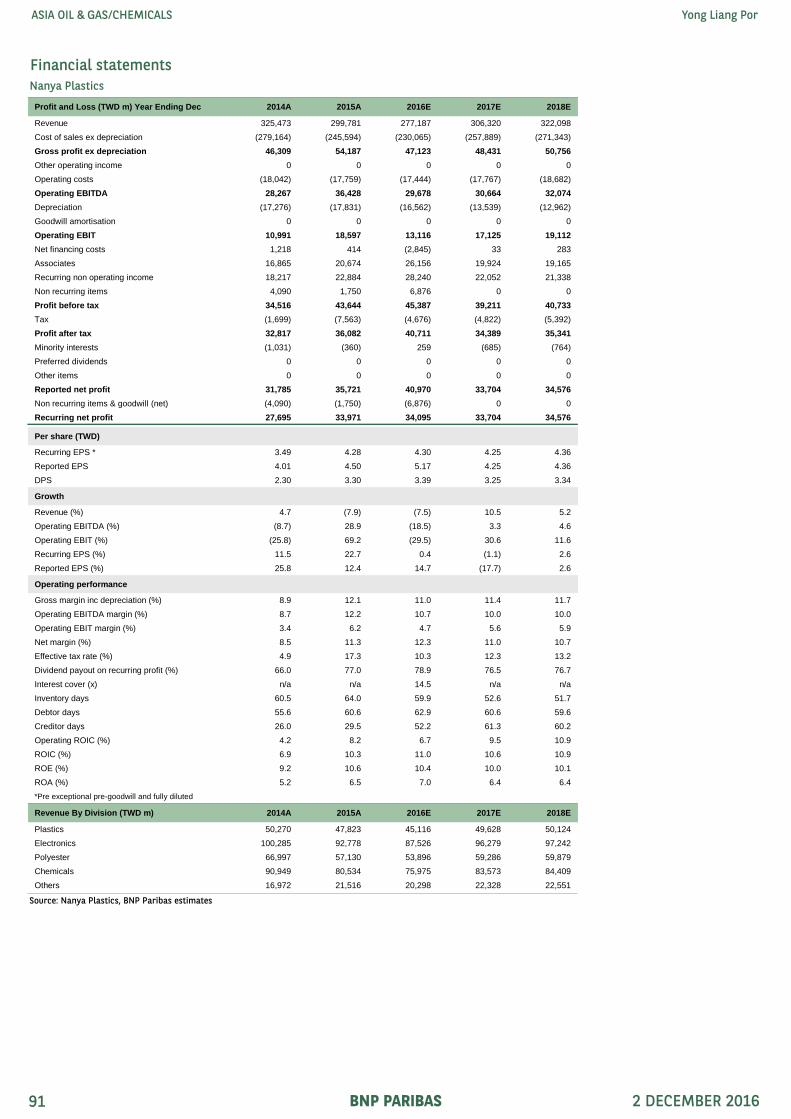
Overall, we believe that conditions point towards continued strong sector profitability in 2017. Our top BUYs are Lotte Chem for its attractive valuations and exposure to MEG and BD, Nan Ya Plastics for the turnaround story at the MEG, copper foil and DRAM businesses, and PTTGC for its gearing towards rising oil prices and improving refining and aromatics outlook.
Exhibit 7: East China inventories (3-yr range) Exhibit 8: Impact of USD10/t change in coal prices
As of 30 Nov 2016 Sources: Bloomberg; BNP Paribas estimates
As of 30 Nov 2016 Sources: Bloomberg; BNP Paribas estimates
Exhibit 13: Regional Chemicals – P/BV comparisons
As of 30 Nov 2016 Sources: Bloomberg; BNP Paribas estimates
(30)
(20)
(10)
0
10
20
30TO
P
Sino
pec
FPC
C
FPC
BPC
L
OIN
L
FCFC
Petro
Chi
na
NY
P
PCH
EM PTT
PTTG
C
GAI
L
SKI
CN
OO
C
LGC
GS
PLN
G
RIL
PTTE
P
S-O
il
LC
ON
GC
(%)
Under
Over
0.5
0.7
0.9
1.1
1.3
1.5
1.7
1.9
2.1
SNP PTR CNOOC PTT PTTEP
(x)8yr avg. 16E PB 11 P/BV 08 P/BV
0.0
0.5
1.0
1.5
2.0
2.5
3.0
3.5
4.0
TOP SKI SOIL GSH
(x)8yr avg. 16E P/BV 11 P/BV 08 P/BV
0.0
0.5
1.0
1.5
2.0
2.5
3.0
3.5
4.0
4.5
FPC NYP FCFC LGC LC
(x)8yr avg. 16E P/BV 11 P/BV 08 P/BV
BNP PARIBAS 2 DECEMBER 2016 8
ASIA OIL & GAS/CHEMICALS Yong Liang Por
Oil market outlook – The intervention game
2016 – Light at the end of the tunnel
Brent prices fell to a 12-year low of USD28/bbl in January 2016, on concerns over the lifting of Iran sanctions and storage tanks running out of capacity. In response, key producers agreed to discuss a production freeze in Doha in April, which triggered oil prices to rally to USD40/bbl by March.
The Doha discussions subsequently failed, on Iran’s insistence to raise production, but oil prices continued to rise as Canadian wildfires and violence in Nigeria caused global oil production to contract by an average of 0.4mb/d y-y from May to August 2016, bringing the oil market closer to balance.
The balanced oil market in mid-16 resulted in the Brent price rising to USD49/bbl in June, but persistently high stocks blunted the price increase, while the steady increase in oil production from July onwards, particularly from OPEC, reawakened oversupply concerns.
Again, in response to oversupply concerns, OPEC announced in late September a plan to cut production to 32.5-33mb/d, sending oil prices back to USD50/bbl in October. On 30 November, OPEC agreed to cut production by 1.2mb/d to 32.5mb/d from 1 January 2017 for a period of six months, extendable by another six months.
Exhibit 16: OECD industry stocks Exhibit 17: Global oil production
Source: IEA Source: IEA
2030405060708090
100110120
Jan-
14M
ar-1
4M
ay-1
4Ju
l-14
Sep-
14N
ov-1
4Ja
n-15
Mar
-15
May
-15
Jul-1
5Se
p-15
Nov
-15
Jan-
16M
ar-1
6M
ay-1
6Ju
l-16
Sep-
16N
ov-1
6
(USD/b)
OPEC chooses not to cut production
US rig count collapses
Iran sanctions
lifted
OPEC proposes
cuts
Iran deal, China equity
decline
(80)
(60)
(40)
(20)
0
20
40
60
Peak 2 4 6 8 10 12 14
1986 1996 2008 2014
(% change from peak year)
(Year of low prices per downturn)
2,500
2,600
2,700
2,800
2,900
3,000
3,100
3,200
Jan Feb Mar Apr May Jun Jul Aug Sep Oct Nov Dec
(mm bbl)5-yr avg 2016
28
29
30
31
32
33
34
35
60
61
62
63
64
65
66
Jan-
14M
ar-1
4M
ay-1
4Ju
l-14
Sep-
14N
ov-1
4Ja
n-15
Mar
-15
May
-15
Jul-1
5Se
p-15
Nov
-15
Jan-
16M
ar-1
6M
ay-1
6Ju
l-16
Sep-
16
(mb/d)(mb/d) Non-OPEC (LHS) OPEC (RHS)
BNP PARIBAS 2 DECEMBER 2016 9
ASIA OIL & GAS/CHEMICALS Yong Liang Por
Non-OPEC supply on the mend
In 2016 to date, global oil supply has grown 0.3mb/d, the slowest growth since 2009, as non-OPEC production growth contracted by 1mb/d, offset by OPEC production growth of 1.3mb/d.
Non-OPEC production declined the most in the US (-0.6mb/d) and China (-0.3mb/d). US production fell 0.4mb/d in conjunction with a 40% decline in US E&P capex, while China production fell as production at high cost fields was cut. Russian production was the biggest positive surprise this year, rising 0.2mb/d to date, as rouble depreciation significantly lowered costs.
In 2017, the IEA forecasts non-OPEC production to grow by 0.5mb/d, with increases in Russia, Kazakhstan and Brazil offsetting declines in China. In our view, the risks regarding non-OPEC production growth are skewed to the upside:
US oil production remains resilient, as declining production at Bakken and Eagle Ford basins is being offset by higher production at the Permian Basin. In fact, overall US oil production may already be recovering, rising to 8.68mb/d in November 2016 from 8.49mb/d in October 2016, while the US oil rig count has recovered to 471 at present from 316 in May.
Since 2015, oil producers have successfully cut costs, with global breakeven costs falling USD5/bbl to USD46/bbl at present. Russian and UK costs have fallen the most, which we attribute to local currency depreciation.
Source: IEA data and forecasts Source: IEA data and forecasts
Exhibit 20: US oil production by basin Exhibit 21: Global break-even price comparison
Source: EIA Source: IHS
(1.5)
(1.0)
(0.5)
0.0
0.5
1.0
1.5
2.0
2.5
3.0
3.5
11 12 13 14 15 16E 17E
OPEC Non-OPEC(mb/d)
(1.5)
(1.0)
(0.5)
0.0
0.5
1.0
1.5
2.0
11 12 13 14 15 16E 17E
(mb/d)Russia US China Brazil
500
700
900
1,100
1,300
1,500
1,700
1,900
2,100
13 14 15 16
(kb/d)Bakken Eagle Ford Permian
0
10
20
30
40
50
60
70
80
Kaza
khst
an
US
- G
OM UK
Can
ada
Chi
na
Rus
sia
Iran
Saud
i
Glo
bal
(USD/b)2015 2017
BNP PARIBAS 2 DECEMBER 2016 10
ASIA OIL & GAS/CHEMICALS Yong Liang Por
OPEC accelerating before braking
In 2016 to date, OPEC production has risen by 1.3mb/d y-y to a new record of 33.8mb/d, an increase of 4.8mb/d from 2010 levels. The major contributors of the increase were Iran, Iraq and Saudi Arabia, whom we assume were motivated to raise production ahead of production cut discussions.
On 30 November, OPEC agreed to a 1.2mb/d cut in production. We believe that a high degree of compliance is likely, for these reasons:
OPEC members have seen a significant deterioration in their fiscal positions since 2014, with key members remaining in deficit even with oil prices of USD60/bbl. Iraq is the most indebted major OPEC producer, while Saudi Arabia has implemented significant cost-cutting measures, such as reducing fuel subsidies and cutting civil servant salaries.
There is very little spare capacity left in OPEC following the rapid production increase in 2016. The IEA estimates OPEC’s spare capacity in October 2016 at just 2.1mb/d, its lowest level since 2008.
The largest share of the production cut is being borne by Saudi Arabia, restoring Saudi spare capacity to above 2mb/d, in line with its historical range, and also lowering Saudi’s market share of OPEC production closer to 2009 levels, which was the last time that OPEC made a collective cut.
Exhibit 22: OPEC fiscal breakeven sensitivity analysis (2016) Exhibit 23: Government debt as % of GDP
Source: Wood Mackenzie Source: IMF data and forecasts
A major concern to oil markets this year has been the deceleration of demand growth. Based on the aggregated data of 16 major countries representing over 80% of global demand, we estimate that oil product demand grew 740kb/d in 9M16, compared with 1.2mb/d in 2015, which is disappointing considering that oil prices had averaged USD10/bbl lower in 2016 vs 2015.
The main culprit of weakening global oil demand in 2016 to date has been the 407kb/d decline in diesel demand, a similar decline to that during the financial crisis. If diesel demand had been flat, global oil demand growth would have been flat y-y. In 2016, gasoline demand growth has slowed, but is still growing well above the historical trend, while jet demand growth has remained stable at above 200kb/d.
We attribute this sharp fall in diesel demand to declining commodity production globally, with record declines of oil and coal production in the US and China. US coal production fell as utility providers switched to cheaper natural gas, while China coal production fell after the government cut the number of working days for coal miners from 330 to 276 from April 2016.
In response to these production cuts, and factoring in recovering commodity demand in China, prices of main commodities, particularly coal, have risen sharply from October. The Chinese government has since temporarily rescinded the coal miners’ working day restriction for November and December, to boost coal production, while the EIA forecasts US coal production to rise 3% in 2017.
Exhibit 26: Global oil product demand growth Exhibit 27: Global oil demand growth breakdown
Source: IEA Source: IEA
Exhibit 28: US & China commodity production Exhibit 29: Coal, iron ore & Henry Hub prices
Sources: EIA; CEIC Source: Datastream
0
200
400
600
800
1,000
1,200
1,400
2011 2012 2013 2014 2015 9M16
(kb/d)
(1,000)
(500)
0
500
1,000
1,500
2,000
2011 2012 2013 2014 2015 9M16
(kb/d) LPG Naphtha Gasoline Diesel Jet Fuel oil
(20)
(15)
(10)
(5)
0
5
10
15
20
2011 2012 2013 2014 2015 9M16
(%)China coal China oil US coal US oil
0
20
40
60
80
100
120
140
160
180
10 11 12 13 14 15 16
(index) Coal (Newcastle port) Iron ore (Qingdao port)
Henry Hub
BNP PARIBAS 2 DECEMBER 2016 12
ASIA OIL & GAS/CHEMICALS Yong Liang Por
As a result of recovering commodity production, we believe global diesel demand can grow at 280kb/d in 2017, a modest level relative to the historical 10-year average growth rate of 340kb/d pa.
In summary, we expect global diesel growth to rebound from negative 400kb/d in 2016 to positive 280kb/d in 2017, a swing of 680kb/d, which underpins our view that global oil demand growth could surprise on the upside in 2017 by 100-300kb/d compared with agency forecasts.
The unexpected increase in fuel oil demand in 2016 to date further convinces us that global oil demand could surprise positively. In 2016, fuel oil demand has risen 130kb/d, the first year since 2005 that fuel oil demand growth has been positive.
We attribute the increase primarily to higher marine fuel sales, as seen in their rising sales in Singapore and the US, on China’s renewed appetite for commodity imports, with copper, iron ore and coal imports rising by 34%, 9% and 9% y-y for 9M16.
Next year, these strong positive factors may not be repeated, but we believe that as long as oil prices do not rise above USD60/bbl, the pace of fuel oil demand destruction may remain slower than the historical trend.
Exhibit 30: Global diesel demand growth Exhibit 31: Global oil demand growth comparison
Exhibit 32: Global fuel oil supply and demand Exhibit 33: Singapore marine bunker sales
Source: IEA Source: Port of Singapore
(0.6)
(0.4)
(0.2)
0.0
0.2
0.4
0.6
0.8
1.0
1.2
1.4
04 05 06 07 08 09 10 11 12 13 14 15 16E17E18E
(mb/d)
0.6
0.7
0.8
0.9
1.0
1.1
1.2
1.3
1.4
1.5
1.6
16E 17E
(mb/d)IEA BNPP IHS
(400)
(300)
(200)
(100)
0
100
200
2011 2012 2013 2014 2015 8M16
(kb/d)Demand Supply
(2)
0
2
4
6
8
10
12
14
2008 2009 2010 2011 2012 2013 2014 2015 10M16
(y-y %)
BNP PARIBAS 2 DECEMBER 2016 13
ASIA OIL & GAS/CHEMICALS Yong Liang Por
We estimate 2017 Brent price of USD58/bbl
With OPEC’s production cut, we expect the oil market to tighten in 2017 by up to 0.9mb/d. We have added conviction in a tightening market, as we believe there is upside potential to major agencies’ oil demand forecasts; we expect diesel demand to rebound in 2017 after a record 400kb/d fall in 2016.
From this point, we believe the trajectory of oil prices will depend on compliance with OPEC cuts and the pace of US production increases. Near term, oil prices remain restrained by record inventories and the rising USD; on which latter point we slightly lower our 2017/18 Brent assumptions by USD2/bbl each, to USD58/68 per barrel.
We believe the larger significance of the November 30 meeting is the re-emergence of OPEC as the swing producer in the global oil market, forced upon it by its weakening fiscal position and the recognition of US tight oil producers as a long-term presence in the oil markets.
The key risks to our view of oil prices are:
Upside could emerge if non-OPEC countries, such as Russia, were to implement the 600kb/d cut in 2017 production that was proposed during the 30 November OPEC meeting. However, we are sceptical this can be implemented as there does not seem to be any incentive to do so and have not factored this in.
Historically, the USD has had a negative correlation with oil prices. BNPP forecasts stronger US economic growth under the Trump administration leading the Fed to raise rates six times to 2.25% by 4Q18, causing USD appreciation and weighing down oil prices.
Supply from Libya and Nigeria is dependent on political outcomes that could rapidly move production higher or lower. If the Nigerian government were to reach an agreement with militants, output could rise by a few hundred thousand barrels a day. Libya also has upside potential, with output rising to 500kb/d in early October from less than 300kb/d in August.
At present, both the IEA and EIA forecast flat US oil production of 8.7mb/d in 2017, but this could be revised upwards since the average breakeven cost of new US tight oil production is now at USD50/bbl. Still, we believe this is likely to take up to a year to significantly ramp up production, given the lead times for obtaining drill permits and site preparation, drilling, pressure pumping, and factoring in delays to first production.
Exhibit 34: Global oil supply less demand (annual) Exhibit 35: Global oil supply less demand (quarterly)
2016 – High expectations and weak diesel sink margins
In 2016 to date, Asian refining margins have weakened to USD6.1/bbl from USD7.7/bbl in 2015. Margins began the year strongly, but quickly declined with sharply rising oil product inventories, bottoming out at USD3.9/bbl in August. Margins rebounded strongly from September onwards as refineries severely lowered runs in September-October.
By product, gasoline, diesel, jet and LPG saw weakening margins, partially mitigated by rising margins of fuel oil and naphtha. Diesel margins declined to USD10.7/bbl, the lowest level since 2009 and representing the 5th consecutive year of decline. Fuel oil margins were the biggest positive surprise, leading simple margins to USD4.1/bbl in November, the highest level in the past two years.
During 2016, refineries anticipated strong gasoline and weak diesel demand, and adjusted their product yields accordingly. As gasoline demand growth slowed significantly and diesel demand fell sharply, this resulted in surpluses of these two major products, whose high inventories have only begun receding since September.
In our view, the most important reason for the y-y decline in complex margins this year was the record 400kb/d decline in diesel demand, on a par with the decline of the financial crisis in 2009. We attribute this decline to the effects of declining commodity production, slowing industrial production and a mild winter.
Exhibit 43: Global supply vs demand growth (2016, y-y chg) Exhibit 44: Global diesel demand by country (2016, y-y chg)
Source: IEA Source: IEA
2
3
4
5
6
7
8
9
10
11
Jan Feb Mar Apr May Jun Jul Aug Sep Oct Nov Dec
(USD/b) 2016 2015 5-year av
(20)
(15)
(10)
(5)
0
5
10
15
20
Gasoline Diesel HSFO Naphtha
(USD/b)2013 2014 2015 2016
(600)
(400)
(200)
0
200
400
600
800
Gasoline Diesel Jet Fuel oil
(kb/d)Supply Demand
(250)
(200)
(150)
(100)
(50)
0
50
100
Chi
na US
Braz
il
Saud
i
Can
ada
Iran
Rus
sia
Indo
nesi
a
Aust
ralia
Japa
n
Taiw
an
Mex
ico
Thai
land
Kore
a
EU
Indi
a
(kb/d)
BNP PARIBAS 2 DECEMBER 2016 16
ASIA OIL & GAS/CHEMICALS Yong Liang Por
Recovery on multiple fronts
We expect to see a broad-based refining margin recovery in 2017, driven by recovering gasoline and diesel margins as well as strong fuel oil margins.
We believe diesel demand should recover strongly, as
commodity production, particularly coal, should increase in the coming months in response to higher prices. For example, the Chinese government has allowed coal mines to increase production since October, and the EIA forecasts US coal production to rise 3% in 2017 after falling 18% in 2016, and
China demand should recover as major economic indicators have turned positive this year. The recent ban on truck overloading and reduced maximum truck tonnage may also boost diesel demand due to a higher frequency of trips.
In 2016, global gasoline demand has grown by 324kb/d, half the growth of 2015, but we think that underlying trends are still healthy as:
China gasoline demand growth is likely understated by up to 250kb/d, as we believe the spike in China’s mixed xylene imports this year was because it was used as gasoline blendstock, but not accounted for as gasoline for tax reasons.
Gasoline imports by developing countries are likely to rise next year, due to a combination of weak production in Latin America (Petrobras and Pemex facing financial issues) and recovering commodity production (Africa and Latin America).
Exhibit 47: Mexico and Brazil refinery runs Exhibit 48: Mexico and Brazil gasoline imports
Source: IEA Source: IEA
0
20
40
60
80
100
120
140
160
180
200
11 12 13 14 15 16
(USD/tonne) Newcastle coal Iron ore (Qingdao)
(20)
(15)
(10)
(5)
0
5
10
15
20
25
30
2010 2011 2012 2013 2014 2015 2016
(%) Electricity FAIRetail Construction
0.5
1.0
1.5
2.0
2.5
3.0
3.5
4.0
2010 2011 2012 2013 2014 2015 2016
(mb/d)Mexico Brazil
0
100
200
300
400
500
600
700
2010 2011 2012 2013 2014 2015 2016
(kb/d)Mexico Brazil
BNP PARIBAS 2 DECEMBER 2016 17
ASIA OIL & GAS/CHEMICALS Yong Liang Por
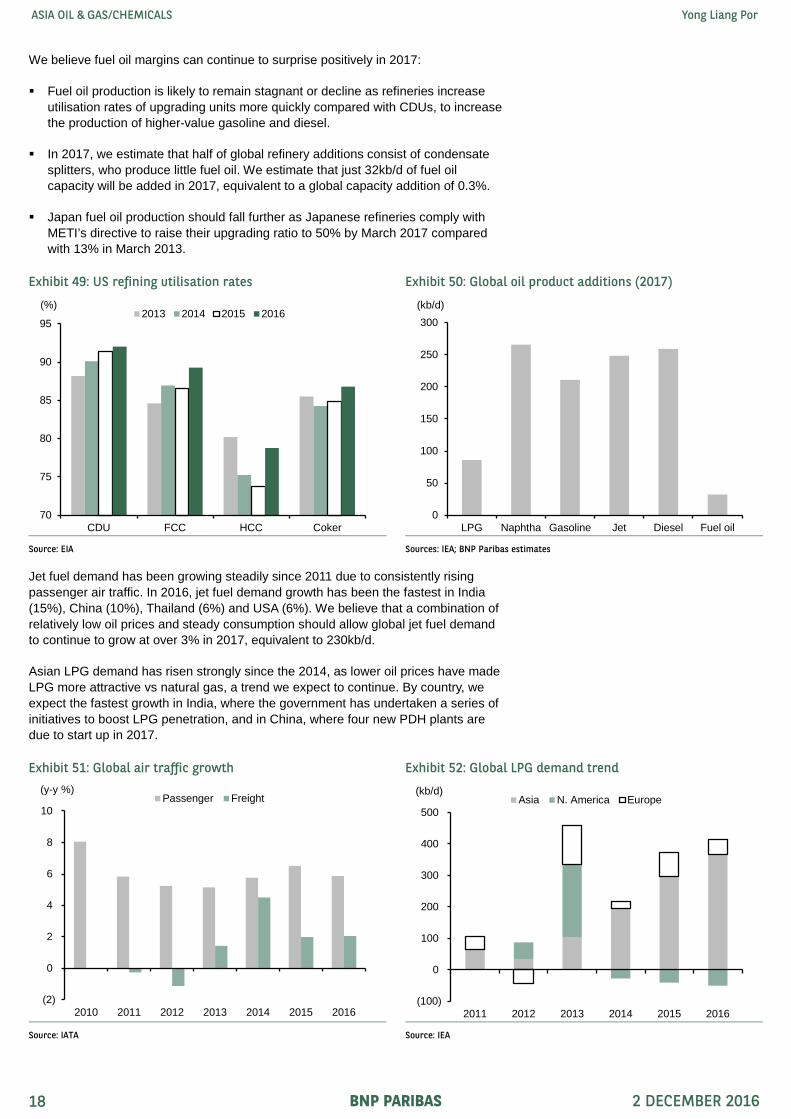
We believe fuel oil margins can continue to surprise positively in 2017:
Fuel oil production is likely to remain stagnant or decline as refineries increase utilisation rates of upgrading units more quickly compared with CDUs, to increase the production of higher-value gasoline and diesel.
In 2017, we estimate that half of global refinery additions consist of condensate splitters, who produce little fuel oil. We estimate that just 32kb/d of fuel oil capacity will be added in 2017, equivalent to a global capacity addition of 0.3%.
Japan fuel oil production should fall further as Japanese refineries comply with METI’s directive to raise their upgrading ratio to 50% by March 2017 compared with 13% in March 2013.
Jet fuel demand has been growing steadily since 2011 due to consistently rising passenger air traffic. In 2016, jet fuel demand growth has been the fastest in India (15%), China (10%), Thailand (6%) and USA (6%). We believe that a combination of relatively low oil prices and steady consumption should allow global jet fuel demand to continue to grow at over 3% in 2017, equivalent to 230kb/d.
Asian LPG demand has risen strongly since the 2014, as lower oil prices have made LPG more attractive vs natural gas, a trend we expect to continue. By country, we expect the fastest growth in India, where the government has undertaken a series of initiatives to boost LPG penetration, and in China, where four new PDH plants are due to start up in 2017.
Exhibit 49: US refining utilisation rates Exhibit 50: Global oil product additions (2017)
Source: EIA Sources: IEA; BNP Paribas estimates
Exhibit 51: Global air traffic growth Exhibit 52: Global LPG demand trend
Source: IATA Source: IEA
70
75
80
85
90
95
CDU FCC HCC Coker
(%)2013 2014 2015 2016
0
50
100
150
200
250
300
LPG Naphtha Gasoline Jet Diesel Fuel oil
(kb/d)
(2)
0
2
4
6
8
10
2010 2011 2012 2013 2014 2015 2016
(y-y %)Passenger Freight
(100)
0
100
200
300
400
500
2011 2012 2013 2014 2015 2016
(kb/d)Asia N. America Europe
BNP PARIBAS 2 DECEMBER 2016 18
ASIA OIL & GAS/CHEMICALS Yong Liang Por
Changing fuel standards provide support for gasoline and PX
In 2017, these countries are switching to lower sulphur gasoline:
China is switching to Standard V fuels for inland markets, which lowers sulphur content in gasoline and diesel to 10ppm from 50ppm.
US is switching to Tier-3 gasoline, which lowers sulphur content to 10ppm from 30ppm.
India is switching to nation-wide Bharat-IV fuels in April 2017, which lowers sulphur content in gasoline to 50ppm from 150ppm.
Pakistan is switching to 92 RON gasoline from 87 RON.
Altogether, these changes could cause disruptions to gasoline supply in 2017, since:
Refiners may face increased difficulties in maintaining gasoline supply during turnarounds of sulphur-reducing units, according to industry consultants Turner, Mason & Co.
Sulphur-reducing units will need to be run at a higher severity than before, which could lead to more frequent or more lengthy maintenance.
Not all refineries may have the financial resources to upgrade their equipment to meet these new standards. In the US, Philadelphia Energy Solutions (Not listed), which operates a 330kb/d refinery on the US east coast, disclosed that it would have to undertake capex to meet the Tier-3 standard, but financial difficulties have caused it to defer capital spending in 2016.
Another effect of the tightening gasoline standards is the loss of octane, since more severe sulphur-reduction causes octane loss, which we calculate could reduce global PX supply by 7% in 2017 (see Turbocharging PX, 6 June 2016, for full details).
The tightness in octane is most obvious in the US, where premium gasoline, which has a higher octane, has continued to raise its market share, to 11.9% in August 2016, a 13-year high that we believe is being driven by the rising adoption of turbo-charged engines. As a consequence, the price of premium gasoline in the US has averaged USD0.44/gallon higher than conventional gasoline in 2016, a historical high.
Downside risk from China exports and PX capacity creep
In 2016, Chinese oil product exports have risen more quickly than we anticipated, to 366kb/d in 2016, triple the figure of one year ago and equivalent to the output of a new world-scale refinery. On 4 November 2016, China increased the VAT rebate for oil product exports to 17%, stoking concerns that exports would further increase.
Exhibit 53: US premium gasoline market share Exhibit 54: US premium less regular gasoline price
We expect China oil product exports to remain high in 2017, but for the pace of increase to slow down, since we expect diesel demand to recover, a sharp slowdown in new crude import quotas, and stricter enforcement to reduce tax evasion among independent refineries, leading them to lower runs.
In 2016, PX margins have risen USD50/t to USD395/t, which we attribute to a shortage of octane triggered by a switch to Standard V fuels in East China from 1 January 2016, which resulted in a spike of mixed aromatic imports for gasoline blending that in turn reduced PX supply.
This tightness has been alleviated in 4Q16, as refineries have been able to increase MX and PX capacity by more than we anticipated. A total of six new MX plants started up in North Asia in 2H16, while major PX producers have debottlenecked capacity by 5-10% this year in response to the strong margins.
These capacity additions have blunted the strength in PX, and we now expect PX margins to be subdued for the next few months until Reliance begins full commercial production of the second phase of its 1.4m t PX plant in early 2017.
Exhibit 55: China oil product trade Exhibit 56: China new crude import quotas
Source: CEIC Source: NDRC
Exhibit 57: MX & PX additions in Asia Exhibit 58: China imports of gasoline blendstocks
Sources: ICIS; BNP Paribas estimates Source: CEIC
(400)
(300)
(200)
(100)
0
100
200
300
400
2010 2011 2012 2013 2014 2015 2016
(kb/d)
Net exports
Net imports0
200
400
600
800
1,000
1,200
1,400
3Q15 4Q15 1Q16 2Q16 3Q16 Total
(kb/d)
0
200
400
600
800
1,000
1,200
1,400
1,600
1Q16 2Q16 3Q16 4Q16
('000 tpa)MX PX
0
500
1,000
1,500
2,000
2,500
3,000
Jan-
15
Mar
-15
May
-15
Jul-1
5
Sep-
15
Nov
-15
Jan-
16
Mar
-16
May
-16
Jul-1
6
Sep-
16
('000 tonnes)Naphtha Mixed aromatics
BNP PARIBAS 2 DECEMBER 2016 20
ASIA OIL & GAS/CHEMICALS Yong Liang Por
Investment strategy – primed for a spring surge
To reflect the developments discussed above, we make the following changes:
We raise our 2016-18 Singapore complex refining margin forecasts by USD0.1-0.3/bbl, to reflect the stronger outlook for gasoline and diesel.
We lower 2017-18 PX margin forecasts by USD20/t for each year, to reflect the larger-than-expected MX additions and PX capacity creep.
To reflect these changes in margin assumptions, we make the following changes to our earnings estimates and target prices.
We expect GRMs to descend from the current high levels in December 2016 and January 2017 as refineries return from maintenance. However, we expect a strong rebound in spring 2017 as when the IEA projects a significant level of refinery maintenance in March and April 2017, while US refinery maintenance could be complicated by the shift to Tier-3 gasoline standards, as detailed above.
SKI, which we believe offers a favourable risk/reward balance due to its attractive valuations (2017E P/B of 0.8x vs ROE of 10%) and attractive 2017E dividend yield of 3.9%. We believe the key positive catalysts for SKI are: 1) the final decision on 2016 DPS in February 2017; and 2) securing suitable M&A targets at fair prices.
S-Oil, whose recent confirmation of a 40% dividend payout ratio on 2016 earnings demonstrates that the interests of the major shareholder, Saudi Aramco (Not listed), are aligned with minority shareholders. We believe S-Oil’s plant optimisation and upgrade projects should create long-term value.
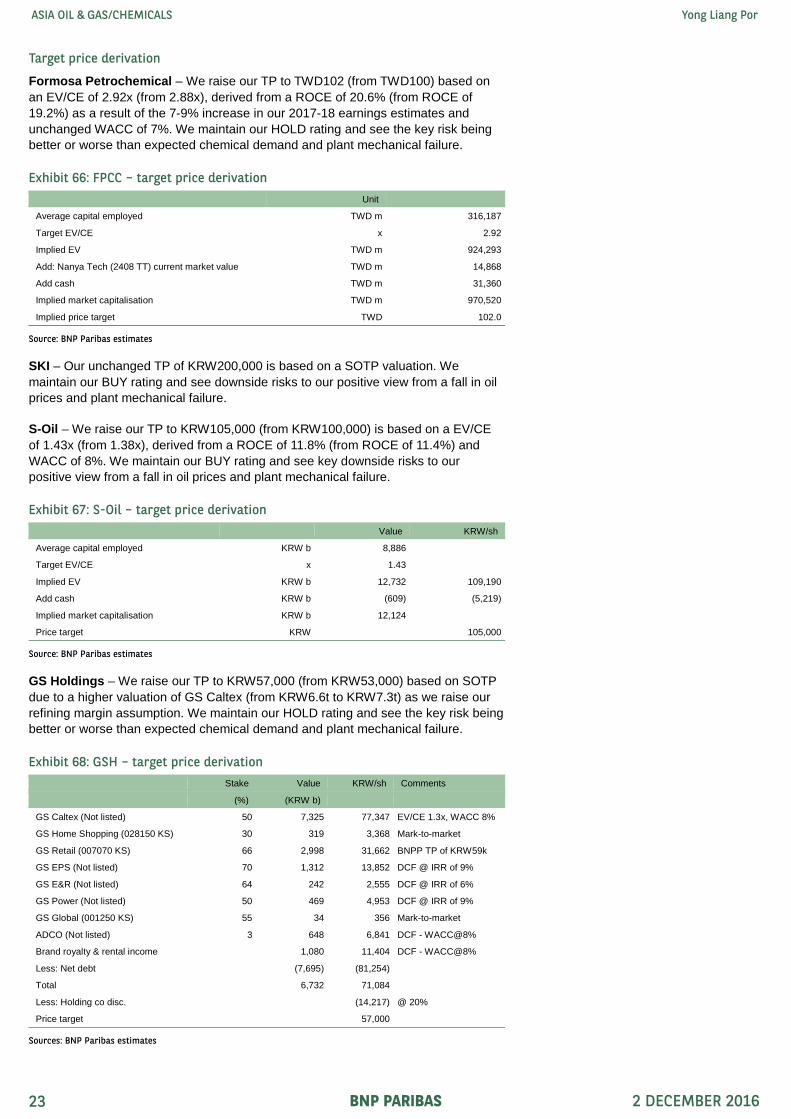
Formosa Petrochemical – We raise our TP to TWD102 (from TWD100) based on an EV/CE of 2.92x (from 2.88x), derived from a ROCE of 20.6% (from ROCE of 19.2%) as a result of the 7-9% increase in our 2017-18 earnings estimates and unchanged WACC of 7%. We maintain our HOLD rating and see the key risk being better or worse than expected chemical demand and plant mechanical failure.
SKI – Our unchanged TP of KRW200,000 is based on a SOTP valuation. We maintain our BUY rating and see downside risks to our positive view from a fall in oil prices and plant mechanical failure.
S-Oil – We raise our TP to KRW105,000 (from KRW100,000) is based on a EV/CE of 1.43x (from 1.38x), derived from a ROCE of 11.8% (from ROCE of 11.4%) and WACC of 8%. We maintain our BUY rating and see key downside risks to our positive view from a fall in oil prices and plant mechanical failure.
GS Holdings – We raise our TP to KRW57,000 (from KRW53,000) based on SOTP due to a higher valuation of GS Caltex (from KRW6.6t to KRW7.3t) as we raise our refining margin assumption. We maintain our HOLD rating and see the key risk being better or worse than expected chemical demand and plant mechanical failure.
Exhibit 66: FPCC – target price derivation Unit
Average capital employed TWD m 316,187
Target EV/CE x 2.92
Implied EV TWD m 924,293
Add: Nanya Tech (2408 TT) current market value TWD m 14,868
Add cash TWD m 31,360
Implied market capitalisation TWD m 970,520
Implied price target TWD 102.0
Source: BNP Paribas estimates
Exhibit 67: S-Oil – target price derivation Value KRW/sh
GS Power (Not listed) 50 469 4,953 DCF @ IRR of 9%
GS Global (001250 KS) 55 34 356 Mark-to-market
ADCO (Not listed) 3 648 6,841 DCF - WACC@8%
Brand royalty & rental income 1,080 11,404 DCF - WACC@8%
Less: Net debt (7,695) (81,254) Total 6,732 71,084 Less: Holding co disc. (14,217) @ 20%
Price target 57,000
Sources: BNP Paribas estimates
BNP PARIBAS 2 DECEMBER 2016 23
ASIA OIL & GAS/CHEMICALS Yong Liang Por
Chemical outlook – Life after the ethylene cycle
In 2016, chemical margins have staged a strong post-CNY rally, as rising oil prices, seasonal maintenance, low inventories, prolonged shutdown of Shell’s (RDSA LN, NR) Singapore cracker and closure of Asahi Kasei’s (3407 JP, NR) cracker in January triggered restocking, which caused a rapid increase in product margins from March to May. In 2Q, ethylene margins averaged USD731/t, the second strongest quarter on record.
Unlike 2015, chemical margins remained steady throughout 3Q16 as heavy plant maintenance continued throughout the quarter, which was partly caused by enforced plant closures in China for the G-20 summit. Most surprisingly, margins of PVC, caustic soda, methanol and urea have rallied strongly in 4Q as the coal price spiked.
On a y-y basis, products whose margins rose were butadiene, ethylene, benzene, PX, styrene and PVC. Products with stable margins were PE, PP and ABS. Products with deteriorating margins were MEG, butyl acrylate, epoxy resins and 2-EH.
In 2016, ethylene margins have averaged USD670/t, a record high, which lifted margins of PE to record highs. Benzene and PX margins improved but are still near the bottom of their recent historical ranges. Products at the bottom of their historical ranges are MEG, AN, ABS, 2-EH, methanol and urea.
Exhibit 69: Margin performance of key products (2016 to date)
Source: Datastream
Exhibit 70: Margin performance of key products – 2016 vs 2015 vs historical six-year average
Source: Datastream
(200)
0
200
400
600
800
1,000
1,200
1,400
Ethy
lene
Prop
ylen
e
BD
Benz
ene
PX
HD
PE
LDP
E
PP
MEG PT
A
PVC
SM AN ABS
Phen
ol
2-E
H
Met
hano
l
Ure
a
(USD/tonne)Current Average Max Min
(200)
0
200
400
600
800
1,000
1,200
1,400
Ethy
lene
Prop
ylen
e
BD
Benz
ene
PX
HD
PE
LDP
E
PP
MEG PT
A
PVC
SM AN ABS
Phen
ol
2-E
H
Met
hano
l
Ure
a
(USD/tonne)2016 2015 Max Min
BNP PARIBAS 2 DECEMBER 2016 24
ASIA OIL & GAS/CHEMICALS Yong Liang Por
A broad-based demand revival
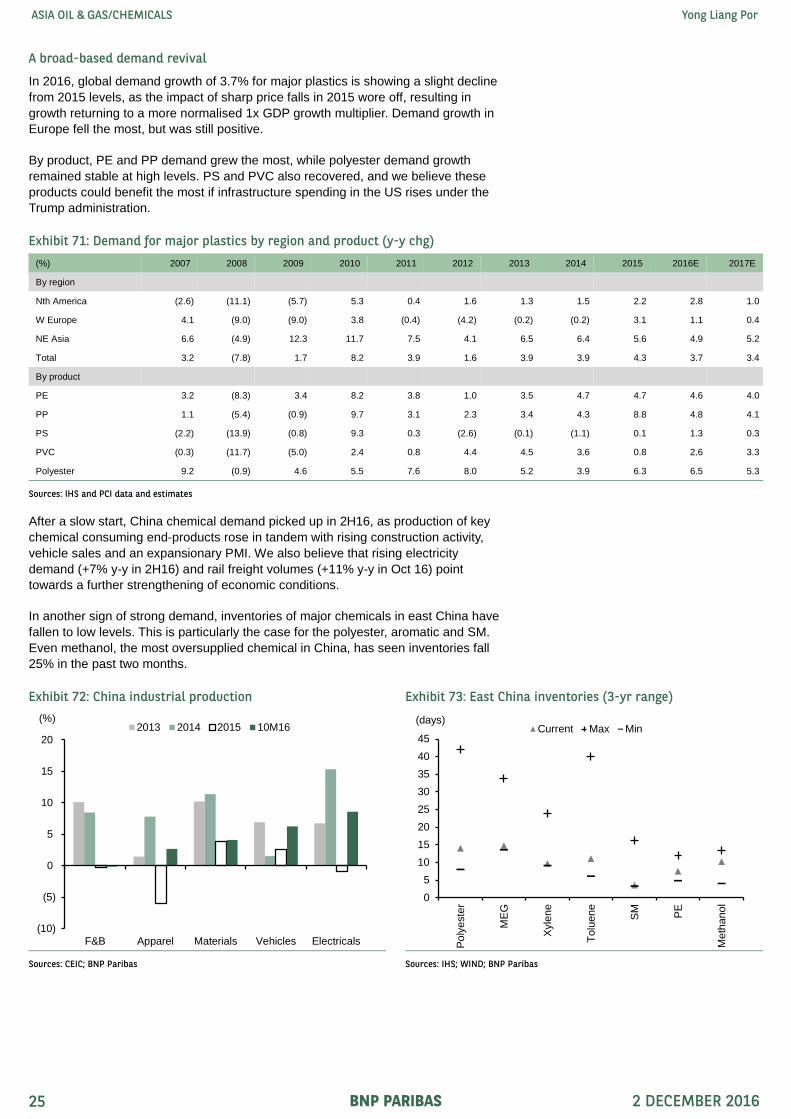
In 2016, global demand growth of 3.7% for major plastics is showing a slight decline from 2015 levels, as the impact of sharp price falls in 2015 wore off, resulting in growth returning to a more normalised 1x GDP growth multiplier. Demand growth in Europe fell the most, but was still positive.
By product, PE and PP demand grew the most, while polyester demand growth remained stable at high levels. PS and PVC also recovered, and we believe these products could benefit the most if infrastructure spending in the US rises under the Trump administration.
After a slow start, China chemical demand picked up in 2H16, as production of key chemical consuming end-products rose in tandem with rising construction activity, vehicle sales and an expansionary PMI. We also believe that rising electricity demand (+7% y-y in 2H16) and rail freight volumes (+11% y-y in Oct 16) point towards a further strengthening of economic conditions.
In another sign of strong demand, inventories of major chemicals in east China have fallen to low levels. This is particularly the case for the polyester, aromatic and SM. Even methanol, the most oversupplied chemical in China, has seen inventories fall 25% in the past two months.
Exhibit 71: Demand for major plastics by region and product (y-y chg)
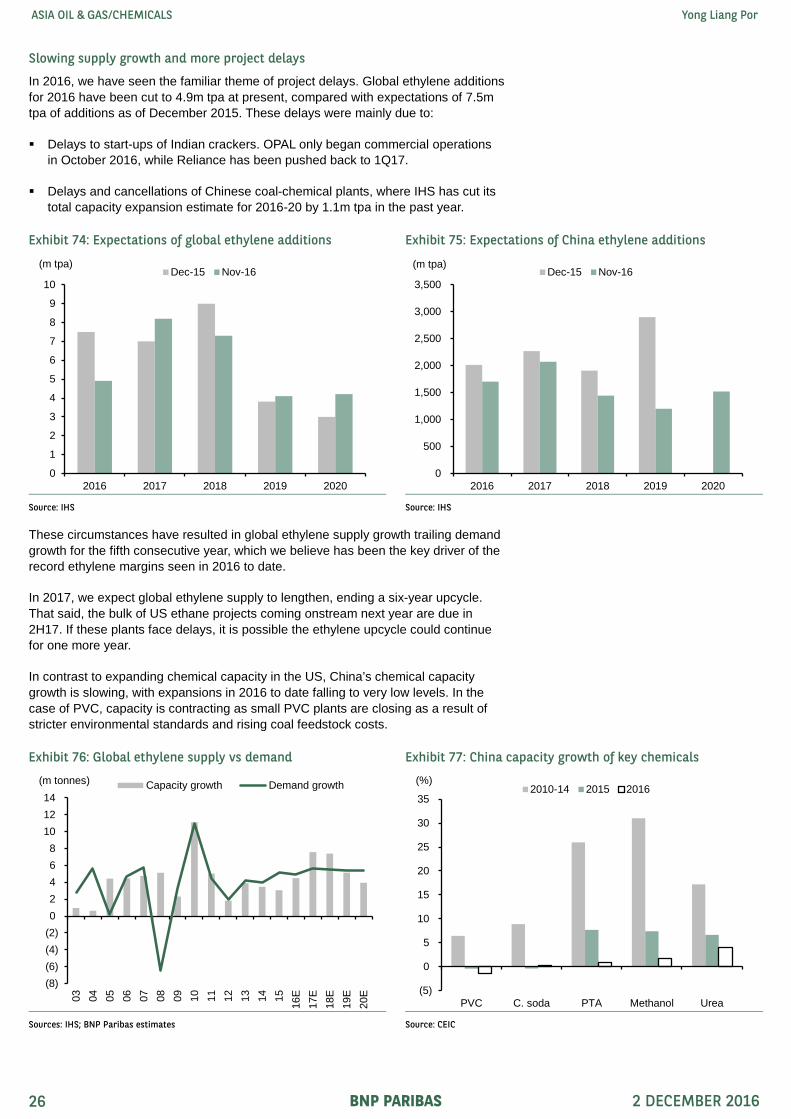
In 2016, we have seen the familiar theme of project delays. Global ethylene additions for 2016 have been cut to 4.9m tpa at present, compared with expectations of 7.5m tpa of additions as of December 2015. These delays were mainly due to:
Delays to start-ups of Indian crackers. OPAL only began commercial operations in October 2016, while Reliance has been pushed back to 1Q17.
Delays and cancellations of Chinese coal-chemical plants, where IHS has cut its total capacity expansion estimate for 2016-20 by 1.1m tpa in the past year.
These circumstances have resulted in global ethylene supply growth trailing demand growth for the fifth consecutive year, which we believe has been the key driver of the record ethylene margins seen in 2016 to date.
In 2017, we expect global ethylene supply to lengthen, ending a six-year upcycle. That said, the bulk of US ethane projects coming onstream next year are due in 2H17. If these plants face delays, it is possible the ethylene upcycle could continue for one more year.
In contrast to expanding chemical capacity in the US, China’s chemical capacity growth is slowing, with expansions in 2016 to date falling to very low levels. In the case of PVC, capacity is contracting as small PVC plants are closing as a result of stricter environmental standards and rising coal feedstock costs.
Exhibit 74: Expectations of global ethylene additions Exhibit 75: Expectations of China ethylene additions
Source: IHS Source: IHS
Exhibit 76: Global ethylene supply vs demand Exhibit 77: China capacity growth of key chemicals
Sources: IHS; BNP Paribas estimates Source: CEIC
0
1
2
3
4
5
6
7
8
9
10
2016 2017 2018 2019 2020
(m tpa)Dec-15 Nov-16
0
500
1,000
1,500
2,000
2,500
3,000
3,500
2016 2017 2018 2019 2020
Dec-15 Nov-16(m tpa)
(8)(6)(4)(2)02468
101214
03 04 05 06 07 08 09 10 11 12 13 14 15 16E
17E
18E
19E
20E
(m tonnes) Capacity growth Demand growth
(5)
0
5
10
15
20
25
30
35
PVC C. soda PTA Methanol Urea
(%)2010-14 2015 2016
BNP PARIBAS 2 DECEMBER 2016 26
ASIA OIL & GAS/CHEMICALS Yong Liang Por
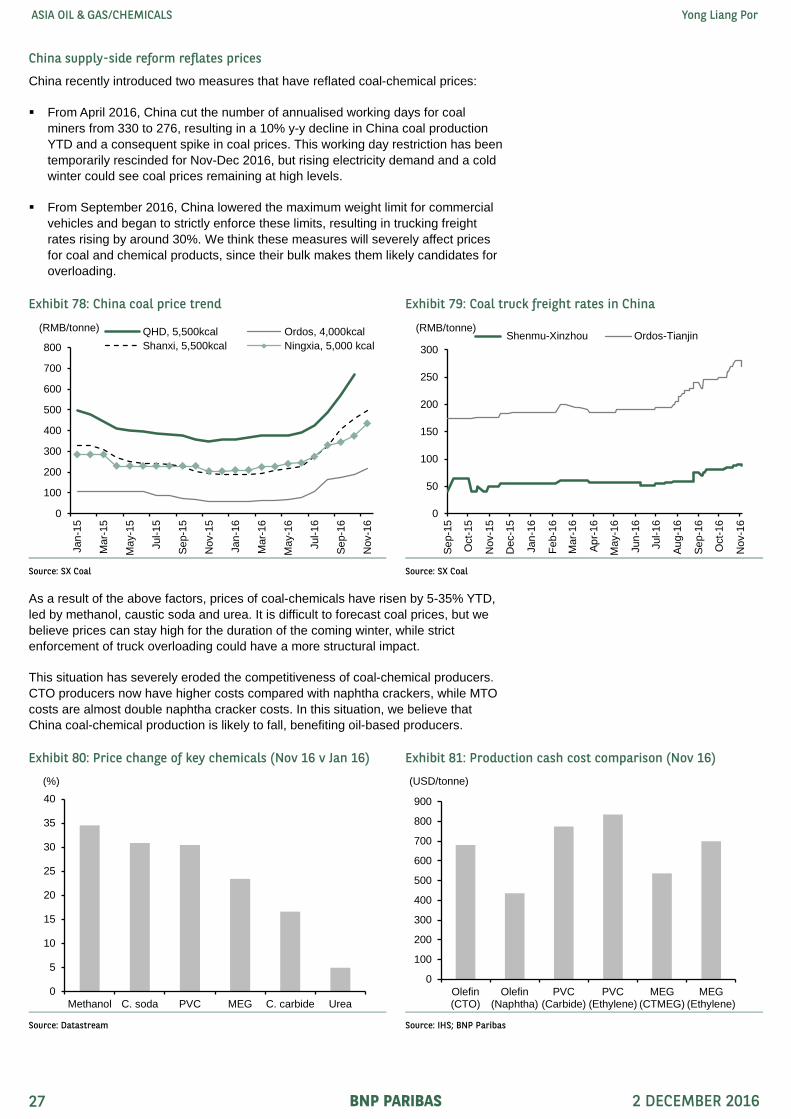
China supply-side reform reflates prices
China recently introduced two measures that have reflated coal-chemical prices:
From April 2016, China cut the number of annualised working days for coal miners from 330 to 276, resulting in a 10% y-y decline in China coal production YTD and a consequent spike in coal prices. This working day restriction has been temporarily rescinded for Nov-Dec 2016, but rising electricity demand and a cold winter could see coal prices remaining at high levels.
From September 2016, China lowered the maximum weight limit for commercial vehicles and began to strictly enforce these limits, resulting in trucking freight rates rising by around 30%. We think these measures will severely affect prices for coal and chemical products, since their bulk makes them likely candidates for overloading.
As a result of the above factors, prices of coal-chemicals have risen by 5-35% YTD, led by methanol, caustic soda and urea. It is difficult to forecast coal prices, but we believe prices can stay high for the duration of the coming winter, while strict enforcement of truck overloading could have a more structural impact.
This situation has severely eroded the competitiveness of coal-chemical producers. CTO producers now have higher costs compared with naphtha crackers, while MTO costs are almost double naphtha cracker costs. In this situation, we believe that China coal-chemical production is likely to fall, benefiting oil-based producers.
Exhibit 78: China coal price trend Exhibit 79: Coal truck freight rates in China
Source: SX Coal Source: SX Coal
Exhibit 80: Price change of key chemicals (Nov 16 v Jan 16) Exhibit 81: Production cash cost comparison (Nov 16)
In 2016 to date, the average price of cotton has risen 4% while that of natural rubber fell 7%. Cotton prices rose with the declining trend in global inventories, while natural rubber prices fell as global inventories remained stubbornly high. Natural rubber prices have risen 17% in the past two months, which we attribute to disrupted production from heavy rains caused by La Nina weather conditions.
We believe cotton prices have the potential to appreciate, as the USDA expects global production to remain low in 2017 as farmers decrease plantings in response to the low price of cotton and more attractive price of soybean (+11% YTD).
In contrast, the supply-demand balance for natural rubber could remain in surplus, as rubber plantings continue to rise and demand remains subdued. Industry consultant The Rubber Economist, estimates that global natural rubber acreage increased at a 5% CAGR from 2010-15, mainly from smaller rubber producers such as Laos, Cambodia, Myanmar and Ghana.
While supply continues to rise, global rubber demand has grown at just 1% in both 2015 and 2016 to date, due to subdued rubber tyre demand. In 2017, the Rubber Economist forecasts demand to grow at 2.8%, but this is still below production growth of 4%. Hence, we do not believe the recent increase in natural rubber prices is sustainable.
Exhibit 82: Global cotton inventory and price Exhibit 83: Global cotton production
Sources: USDA; Datastream Source: USDA
Exhibit 84: Global natural rubber inventory and prices Exhibit 85: Global natural rubber production
(m tonnes)(m hectares)Acreage (LHS) Production (RHS)
BNP PARIBAS 2 DECEMBER 2016 28
ASIA OIL & GAS/CHEMICALS Yong Liang Por
Long term trends: Synthetic materials propel polyester growth
In 2016, PCI forecasts global polyester demand growth of 6.5%, which is higher than the growth rate of other major chemicals such as PE and PP, whose growth is usually in line with GDP growth. We believe the following two structural trends support polyester’s continued strong growth:
The growing preference for man-made fibres over natural fibres. Synthetic fabrics have increased their acceptance in mainstream apparel, particularly in active-wear. In 2014, the US imported more textiles and apparel made of synthetic fibres than natural fibres for the first time. In turn, this has led textile producers to configure machines to use synthetic fibres, creating a self-reinforcing trend.
Cotton prices are 71% more expensive than polyester, which is partly due to the oil price decline since November 2014. We believe this premium is likely to persist in the coming years, based on our assumption of Brent oil prices of USD58/bbl in 2017 and USD68/bbl in 2018.
Consequently, we expect man-made fibres to further increase their textile volume market share to 73% and reach total sales volume of 83m tonnes by 2020. As we assume the majority of man-made fibre growth will come from polyester, this is sufficient to generate global polyester demand growth of between 4m and 5m tonnes per annum for 2015-2020E.
Exhibit 86: US imports of textiles and apparel Exhibit 87: Cotton and polyester price trend
Source: US Dept of Commerce Source: US Dept of Commerce
Exhibit 88: Global demand of textile fibres Exhibit 89: Global polyester demand growth
Long-term trends: Unlocking developing Asian demand
From 2005-2015, we estimate that China chemical demand saw a CAGR of 10%, accounting for 45% of global chemical demand growth in that period. As China’s economic growth is slowing down and the country is transitioning to a more service-led economy, this source of demand growth is likely to ebb, in our view.
We believe the rapid development of other developing Asian economies can partially offset slowing China demand growth. These countries include Vietnam, India, Indonesia and the Philippines (VIIP), who have a combined population of 1.7b, GDP of USD3.7t and a GDP per capita of USD2,340. GDP growth of VIIP averaged 6.3% pa from 2010-15, and the IMF forecasts growth of 6.4% pa for 2016-20.
In comparison with China, the VIIP economy is presently only the same size as the Chinese economy in 2007, and the growth rate is slower compared with China at the equivalent GDP level. However, there is significant room for growth, as VIIP chemical consumption per capita was very low at just 7.7kg in 2015.
In this regard, we believe India has the greatest potential for growth, as the government has introduced measures to boost infrastructure spending and domestic consumption. For example, the Clean India programme entails construction of a new sewerage system, which requires significant volumes of PVC and PP for pipes. We estimate that annual VIIP demand for chemicals will expand by 14m tonnes from 2015 to 2020, equivalent to six new world-scale crackers.
Exhibit 90: GDP growth of key developing countries Exhibit 91: Aggregate GDP per capita of VIIP
Source: IMF Source: IMF
Exhibit 92: GDP comparison vs China Exhibit 93: Polyolefin demand vs GDP per capita (2015)
Source: IMF Sources: IHS; IMF; BNP Paribas estimates
In 2017, we expect a majority of chemicals to face a tightening supply-demand balance, as capacity expansions slow following years of rapid expansion. Products that face lengthening supply include AN, PE, PX, urea and ethylene. Our key conclusions for 2017 product margins are:
Ethylene and PE to fall from 2016 levels, but remain at still-high levels.
PX margins should improve after 1Q17 once Reliance starts up its new plant.
BD, benzene and SM margins should further improve.
SBR overcapacity continues to weigh on non-integrated margins.
Strong margins of coal-chemicals such as PVC, caustic soda, MEG and PP, although this is dependent on continued high coal prices. For these products, our nameplate utilisation rate model is less useful as China’s supply-side measures play a more important role in price formation.
For 2018, we expect only three of 22 chemicals to see excess supply, as capacity expansions slow down further. We expect the biggest beneficiaries to be MEG, benzene, PX, BPA, phenol and SBR, as they face the largest tightening scenarios, which should bring about significant improvements in their utilisation rates.
Exhibit 94: Global supply less demand change (2017) Exhibit 95: Global utilisation rate (2017)
Investment strategy – Bullish on value and laggard plays
We make no significant changes to our chemical margin estimates in this report, as we had already made upward revisions to prices and margins of coal-chemicals in our previous report, Black Beauty, 8 November 2016. To take into account company-specific factors, we make the following earnings revisions:
Formosa Plastics, Formosa Chemicals and Nan Ya Plastics – we raise 2017-18 earnings estimates by 2-4% to reflect the stronger contributions from FPCC, where we had raised earnings by 7-9% over the corresponding period.
LG Chem – we lower 2017-18 earnings estimates by 5-7% to reflect lower EV battery sales in China following the recent proposal by the Ministry of Industry and Information Technology (MIIT) to raise the bar for annual output of certified lithium-ion battery makers to 8GWh.
Our top sector BUYs are:
Lotte Chem offers a favourable risk/reward balance due to its attractive valuations (2017E P/B of 1.1x vs ROE of 14%) and exposure to MEG and SM, whose margins could positively surprise. We believe LC’s focus on chemical capacity expansions should enable it to create long-term value.
Nan Ya Plastic is a potential turnaround story, in our view, due to rebounding MEG margins, rising copper foil margins and reduced DRAM exposure. YTD, NYP’s share price performance has significantly lagged its sister Formosa group companies, and we expect improving product margins to enable its share price to catch up.
PTTGC is well placed to benefit from potentially rising oil prices in 2017E, while y-y comparisons should benefit from the low base effect in 2016, when earnings have been negatively affected by a series of unplanned plant shutdowns.
In 2017, we believe these factors could further boost the chemical outlook: 1) USD strength benefits local currency operating profits; and 2) increased US infrastructure spending should boost chemical demand. The key downside risks to our positive view are: 1) a sharp fall in coal prices; and 2) China commodity speculation, which has played a part in driving chemical prices higher, may be curbed.
Exhibit 98: Changes to earnings estimates and target prices
LG Chem – We cut our TP to KRW240,000 (from KRW265,000) based on a EV/CE of 1.25x (from 1.38x), derived from a lower ROCE of 10.5% (from 11.6%) as a result of the 5-7% cut to 2017-18E earnings estimates and WACC of 8%. We maintain our HOLD rating and see the key upside/downside risks being stronger/weaker-than-expected chemical and EV battery demand.
Petronas Chem – Our unchanged TP of MYR6.5 is based on a target EV/CE of 1.64x, derived from a ROCE of 13.4% and WACC of 8% (unchanged). We maintain our HOLD rating and see the key upside/downside risk to our TP coming from volatile oil prices.
Formosa Plastic – We raise our TP to TWD86 (from TWD85) based on SoTP, due to our higher valuation of FPCC (from TWD281b to TWD286b). We maintain our HOLD rating and see the key risk being better or worse than expected chemical demand and plant mechanical failure.
Lotte Chemical – We raise our TP to KRW400,000 (from KRW390,000) which is based on a EV/CE of 1.4x (from 1.7x), derived from an ROCE of 12.5% (from 14.7%) and as we roll over capital employed to 2017E (from 2016E) and WACC of 9% (unchanged). We maintain our BUY rating and see the key downside risk coming from weaker-than-expected chemical demand and plant mechanical failure.
Exhibit 102: LGC – TP derivation Value Won/sh
Average capital employed KRW b 13,168
Target EV/CE x 1.25
Implied EV KRW b 16,516 225,939
add cash KRW b 1,163 15,905
Implied market capitalisation KRW b 17,679
Price target KRW 240,000
Source: BNP Paribas estimates
Exhibit 103: FPC – TP derivation Value TWD/ Comments
(TWD m) share
Average invested capital TWD m 120,161 At 1.2x EV/IC
Target EV/IC x 1.2
Implied EV TWD m 140,670 22.1
Less debt TWD m (57,763) (9.1) 2016E net debt
Add investments:
Formosa Petrochem. (30%) TWD m 286,637 45.0 TP @TWD102
Nan Ya Plastic (10%) TWD m 58,124 9.1 TP @TWD75
Formosa Chemical (3%) TWD m 18,436 2.9 TP @TWD110
Formosa Sumco (3532 TT) TWD m 7,810 1.2 Market price @TWD41.7as at 30/11
Nanya Tech (2408 TT) TWD m 15,985 2.5 Market price @TWD40as at 30/11
Other investments TWD m 74,579 11.7 At 1x book value
Implied market capitalisation TWD m 544,493
Price target TWD 86.0
Source: BNP Paribas estimates
Exhibit 104: LC – TP derivation Value KRW/sh
Average capital employed KRW b 11,523
Target EV/CE x 1.4
Implied EV KRW b 15,671 457,223
Add cash KRW b (1,998) (58,289)
Price target KRW 400,000
Sources: BNP Paribas estimates
BNP PARIBAS 2 DECEMBER 2016 34
ASIA OIL & GAS/CHEMICALS Yong Liang Por
PTTGC – Our unchanged TP of THB70 is derived from a 2017E P/B multiple of 1.2x. We maintain our BUY rating and see the key downside risks coming from unplanned shutdowns, a sharp decline in crude oil price, and crack spread weakness.
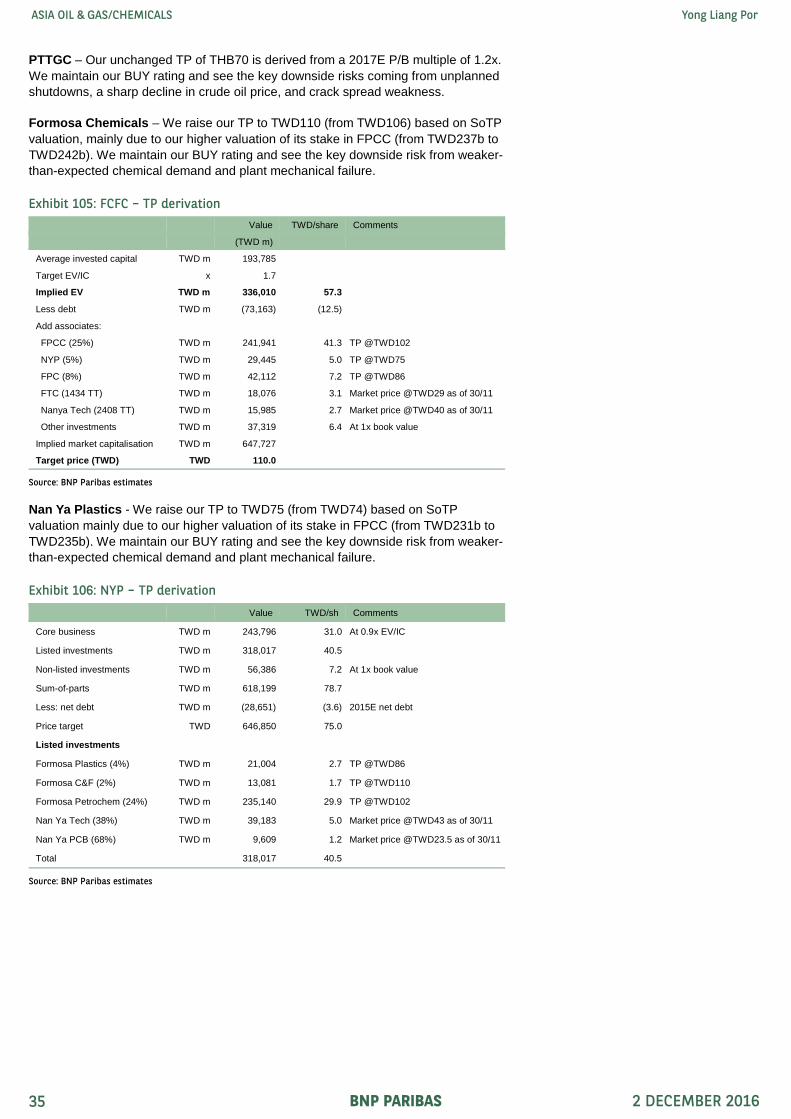
Formosa Chemicals – We raise our TP to TWD110 (from TWD106) based on SoTP valuation, mainly due to our higher valuation of its stake in FPCC (from TWD237b to TWD242b). We maintain our BUY rating and see the key downside risk from weaker-than-expected chemical demand and plant mechanical failure.
Nan Ya Plastics - We raise our TP to TWD75 (from TWD74) based on SoTP valuation mainly due to our higher valuation of its stake in FPCC (from TWD231b to TWD235b). We maintain our BUY rating and see the key downside risk from weaker-than-expected chemical demand and plant mechanical failure.
Exhibit 105: FCFC – TP derivation
Value TWD/share Comments
(TWD m)
Average invested capital TWD m 193,785
Target EV/IC x 1.7
Implied EV TWD m 336,010 57.3
Less debt TWD m (73,163) (12.5)
Add associates:
FPCC (25%) TWD m 241,941 41.3 TP @TWD102
NYP (5%) TWD m 29,445 5.0 TP @TWD75
FPC (8%) TWD m 42,112 7.2 TP @TWD86
FTC (1434 TT) TWD m 18,076 3.1 Market price @TWD29 as of 30/11
Nanya Tech (2408 TT) TWD m 15,985 2.7 Market price @TWD40 as of 30/11
Other investments TWD m 37,319 6.4 At 1x book value
Implied market capitalisation TWD m 647,727
Target price (TWD) TWD 110.0
Source: BNP Paribas estimates
Exhibit 106: NYP – TP derivation
Value TWD/sh Comments
Core business TWD m 243,796 31.0 At 0.9x EV/IC
Listed investments TWD m 318,017 40.5
Non-listed investments TWD m 56,386 7.2 At 1x book value
Sum-of-parts TWD m 618,199 78.7
Less: net debt TWD m (28,651) (3.6) 2015E net debt
Price target TWD 646,850 75.0
Listed investments
Formosa Plastics (4%) TWD m 21,004 2.7 TP @TWD86
Formosa C&F (2%) TWD m 13,081 1.7 TP @TWD110
Formosa Petrochem (24%) TWD m 235,140 29.9 TP @TWD102
Nan Ya Tech (38%) TWD m 39,183 5.0 Market price @TWD43 as of 30/11
Nan Ya PCB (68%) TWD m 9,609 1.2 Market price @TWD23.5 as of 30/11
Total 318,017 40.5
Source: BNP Paribas estimates
BNP PARIBAS 2 DECEMBER 2016 35
ASIA OIL & GAS/CHEMICALS Yong Liang Por
China outlook – Step by step
2016 – Government lends a helping hand
In 2016 to date, the China oil & gas sector has had a less eventful year than usual, with no major policy or price changes. Government measures were mainly supportive of NOCs, in recognition of the difficult operating conditions. The major reform announced this year concerned the gas transmission tariff, which would not have any significant impact on companies’ earnings.
China’s supply-side reform has extended to the oil & gas sector, with China oil production declining by 6% in 2016 to date, the largest fall on record as NOCs cut production at high-cost fields. To make up for the lower production, China’s oil imports have risen by 0.9 mb/d in 2016 to 7.7mb/d, a record high. This trend was also evident in the gas sector, as production growth slowed and imports jumped.
In 1Q16, as NOCs suffered large upstream losses, the government froze oil product prices at mid-December 2015 levels, effectively setting a price floor for oil at USD40/bbl. This allowed Chinese refineries to generate a record operating profit in that quarter, which the government has so far allowed them to keep despite an earlier directive to direct these windfall profits to an unspecified environmental fund.
To alleviate refining sector overcapacity, the government has encouraged capacity rationalisation among independent refiners and increased oil product export quotas, causing oil product exports, notably diesel, to sharply rise in 2016.
Exhibit 107: China oil production & imports Exhibit 108: China gas production and imports
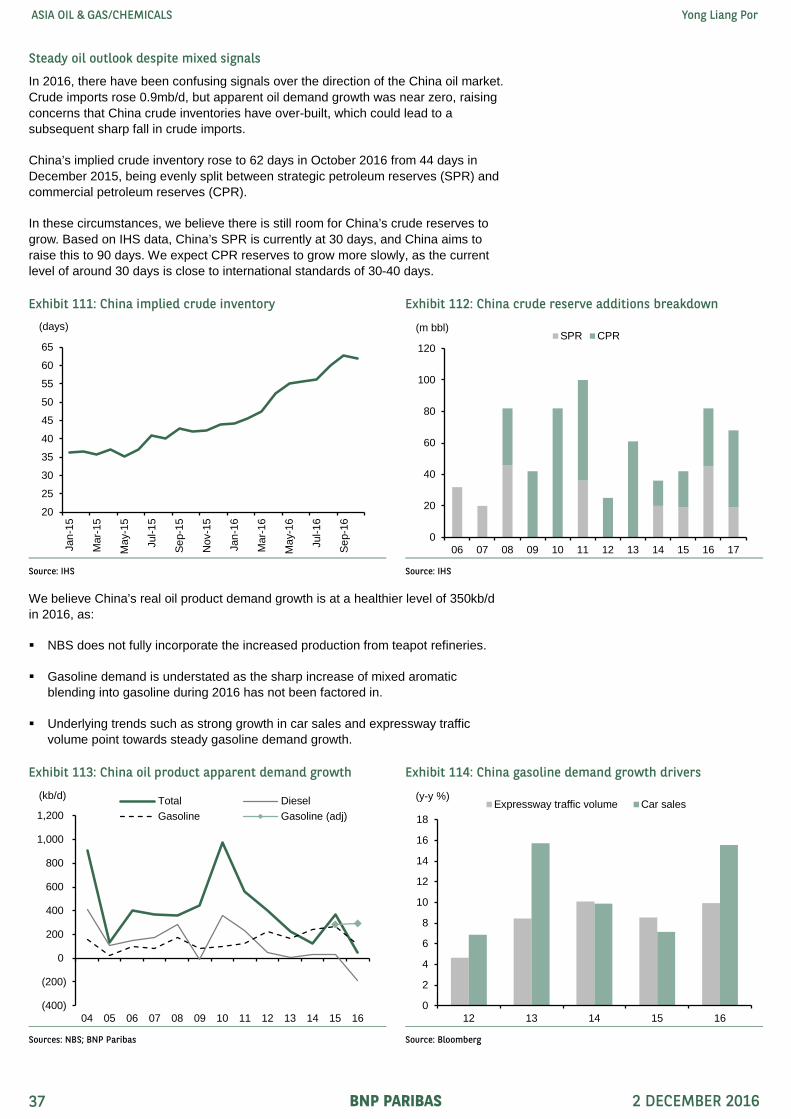
In 2016, there have been confusing signals over the direction of the China oil market. Crude imports rose 0.9mb/d, but apparent oil demand growth was near zero, raising concerns that China crude inventories have over-built, which could lead to a subsequent sharp fall in crude imports.
China’s implied crude inventory rose to 62 days in October 2016 from 44 days in December 2015, being evenly split between strategic petroleum reserves (SPR) and commercial petroleum reserves (CPR).
In these circumstances, we believe there is still room for China’s crude reserves to grow. Based on IHS data, China’s SPR is currently at 30 days, and China aims to raise this to 90 days. We expect CPR reserves to grow more slowly, as the current level of around 30 days is close to international standards of 30-40 days.
We believe China’s real oil product demand growth is at a healthier level of 350kb/d in 2016, as:
NBS does not fully incorporate the increased production from teapot refineries.
Gasoline demand is understated as the sharp increase of mixed aromatic blending into gasoline during 2016 has not been factored in.
Underlying trends such as strong growth in car sales and expressway traffic volume point towards steady gasoline demand growth.
Exhibit 111: China implied crude inventory Exhibit 112: China crude reserve additions breakdown
Source: IHS Source: IHS
Exhibit 113: China oil product apparent demand growth Exhibit 114: China gasoline demand growth drivers
Sources: NBS; BNP Paribas Source: Bloomberg
20
25
30
35
40
45
50
55
60
65
Jan-
15
Mar
-15
May
-15
Jul-1
5
Sep-
15
Nov
-15
Jan-
16
Mar
-16
May
-16
Jul-1
6
Sep-
16(days)
0
20
40
60
80
100
120
06 07 08 09 10 11 12 13 14 15 16 17
(m bbl)SPR CPR
(400)
(200)
0
200
400
600
800
1,000
1,200
04 05 06 07 08 09 10 11 12 13 14 15 16
(kb/d) Total DieselGasoline Gasoline (adj)
0
2
4
6
8
10
12
14
16
18
12 13 14 15 16
(y-y %)Expressway traffic volume Car sales
BNP PARIBAS 2 DECEMBER 2016 37
ASIA OIL & GAS/CHEMICALS Yong Liang Por
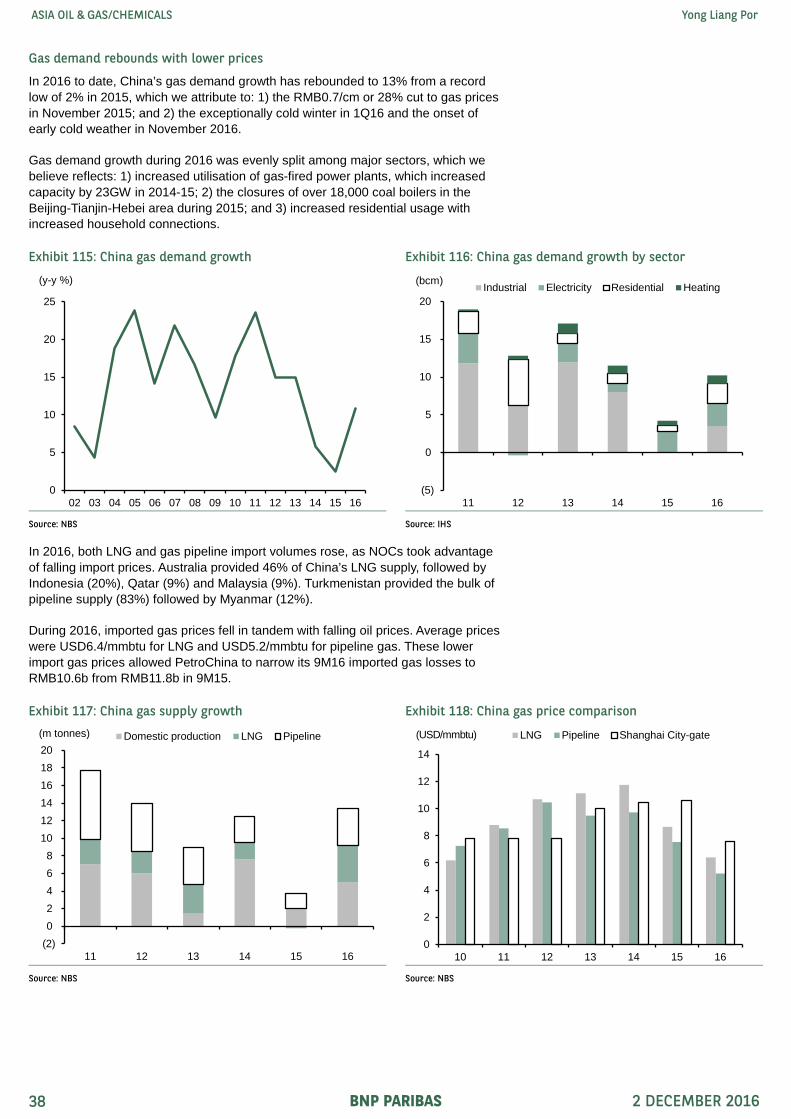
Gas demand rebounds with lower prices
In 2016 to date, China’s gas demand growth has rebounded to 13% from a record low of 2% in 2015, which we attribute to: 1) the RMB0.7/cm or 28% cut to gas prices in November 2015; and 2) the exceptionally cold winter in 1Q16 and the onset of early cold weather in November 2016.
Gas demand growth during 2016 was evenly split among major sectors, which we believe reflects: 1) increased utilisation of gas-fired power plants, which increased capacity by 23GW in 2014-15; 2) the closures of over 18,000 coal boilers in the Beijing-Tianjin-Hebei area during 2015; and 3) increased residential usage with increased household connections.
In 2016, both LNG and gas pipeline import volumes rose, as NOCs took advantage of falling import prices. Australia provided 46% of China’s LNG supply, followed by Indonesia (20%), Qatar (9%) and Malaysia (9%). Turkmenistan provided the bulk of pipeline supply (83%) followed by Myanmar (12%).
During 2016, imported gas prices fell in tandem with falling oil prices. Average prices were USD6.4/mmbtu for LNG and USD5.2/mmbtu for pipeline gas. These lower import gas prices allowed PetroChina to narrow its 9M16 imported gas losses to RMB10.6b from RMB11.8b in 9M15.
Exhibit 115: China gas demand growth Exhibit 116: China gas demand growth by sector
Source: NBS Source: IHS
Exhibit 117: China gas supply growth Exhibit 118: China gas price comparison
Source: NBS Source: NBS
0
5
10
15
20
25
02 03 04 05 06 07 08 09 10 11 12 13 14 15 16
(y-y %)
(5)
0
5
10
15
20
11 12 13 14 15 16
(bcm) Industrial Electricity Residential Heating
(2)02468
101214161820
11 12 13 14 15 16
(m tonnes) Domestic production LNG Pipeline
0
2
4
6
8
10
12
14
10 11 12 13 14 15 16
(USD/mmbtu) LNG Pipeline Shanghai City-gate
BNP PARIBAS 2 DECEMBER 2016 38
ASIA OIL & GAS/CHEMICALS Yong Liang Por
Depleting oil production and reserves point to M&A
In 2016 to date, China’s domestic oil production has fallen 5%, the second-largest decline after the US, representing a reversal from the historical 10-year CAGR of 1.9%. Wood Mackenzie projects China oil production falling to 3.5mb/d by 2020 due to:
The impact of heavy capex cuts since 2015, which have cut production most heavily at mature oil fields such as Daqing (PetroChina) and Shengli (Sinopec), and high-cost heavy oil fields like Liaohe (PetroChina).
High likelihood of more field shut-ins at high-cost China oil wells, where one-third of production currently generates a negative net present value at Brent prices of USD40/bbl.
The high cost of pre-development projects in China, of whom 35% are loss-making at USD40/bbl and are at risk of deferral or cancellation.
This weak production outlook points towards continued weakness in the oil services sector. IHS estimates that onshore wells drilled in China are likely to remain range-bound at 17,000 wells pa from 2016-20, half the levels of 2013, as China NOCs prioritise higher efficiency and cost-effectiveness.
In this scenario, IHS expects China’s fracturing utilisation rates to only gradually recover to 40% in 1H18 from 32% in 1H16.In this segment, PetroChina enjoys a higher utilisation rate of around 50%, compared with Sinopec at 30%.
Exhibit 119: China domestic oil production Exhibit 120: China oil supply breakeven cost (NPV 10)
Source: Wood Mackenzie Source: Wood Mackenzie
Exhibit 121: China onshore wells drilled Exhibit 122: China fracturing utilisation rates
Source: IHS Source: IHS
1.0
1.5
2.0
2.5
3.0
3.5
4.0
4.5
10 11 12 13 14 15 16 17E 18E 19E 20E
(mb/d)PetroChina Sinopec CNOOC Others
0
20
40
60
100 600 1,100 1,600 2,100 2,600 3,100 3,600
(USD/boe)
Liquid production in 2016 (kb/d)
MainlyCNOOC
MainlyPetroChina
MainlySinopec
4
6
8
10
12
14
16
18
20
1H13
2H13
1H14
2H14
1H15
2H15
1H16
2H16
1H17
2H17
1H18
2H18
1H19
2H19
1H20
2H20
('000 wells)
20
25
30
35
40
45
50
55
60
65
1H13
2H13
1H14
2H14
1H15
2H15
1H16
2H16
1H17
2H17
1H18
2H18
1H19
2H19
1H20
2H20
(%)
BNP PARIBAS 2 DECEMBER 2016 39
ASIA OIL & GAS/CHEMICALS Yong Liang Por
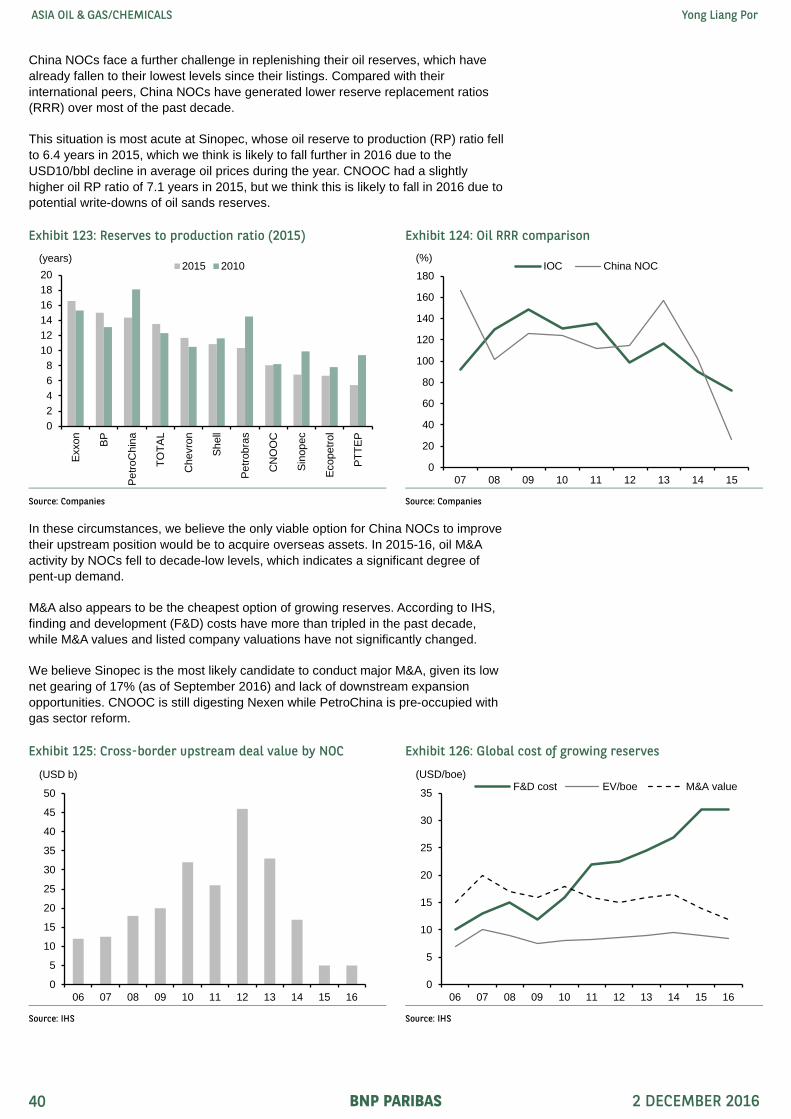
China NOCs face a further challenge in replenishing their oil reserves, which have already fallen to their lowest levels since their listings. Compared with their international peers, China NOCs have generated lower reserve replacement ratios (RRR) over most of the past decade.
This situation is most acute at Sinopec, whose oil reserve to production (RP) ratio fell to 6.4 years in 2015, which we think is likely to fall further in 2016 due to the USD10/bbl decline in average oil prices during the year. CNOOC had a slightly higher oil RP ratio of 7.1 years in 2015, but we think this is likely to fall in 2016 due to potential write-downs of oil sands reserves.
In these circumstances, we believe the only viable option for China NOCs to improve their upstream position would be to acquire overseas assets. In 2015-16, oil M&A activity by NOCs fell to decade-low levels, which indicates a significant degree of pent-up demand.
M&A also appears to be the cheapest option of growing reserves. According to IHS, finding and development (F&D) costs have more than tripled in the past decade, while M&A values and listed company valuations have not significantly changed.
We believe Sinopec is the most likely candidate to conduct major M&A, given its low net gearing of 17% (as of September 2016) and lack of downstream expansion opportunities. CNOOC is still digesting Nexen while PetroChina is pre-occupied with gas sector reform.
Exhibit 123: Reserves to production ratio (2015) Exhibit 124: Oil RRR comparison
Source: Companies Source: Companies
Exhibit 125: Cross-border upstream deal value by NOC Exhibit 126: Global cost of growing reserves
Source: IHS Source: IHS
02468
101214161820
Exxo
n
BP
Petro
Chi
na
TOTA
L
Che
vron
Shel
l
Petro
bras
CN
OO
C
Sino
pec
Ecop
etro
l
PTTE
P
(years)2015 2010
0
20
40
60
80
100
120
140
160
180
07 08 09 10 11 12 13 14 15
(%)IOC China NOC
0
5
10
15
20
25
30
35
40
45
50
06 07 08 09 10 11 12 13 14 15 16
(USD b)
0
5
10
15
20
25
30
35
06 07 08 09 10 11 12 13 14 15 16
(USD/boe)F&D cost EV/boe M&A value
BNP PARIBAS 2 DECEMBER 2016 40
ASIA OIL & GAS/CHEMICALS Yong Liang Por
Healthy gas volume growth but limited price upside potential
In contrast to oil, China’s gas sector continues to enjoy strong demand growth and stable prices. In 2016, the shape of gas sector reform has become clearer, with the government stepping back from a big-bang approach (such as creating an independent pipeline company) and towards these incremental measures:
On 12 October, NDRC announced a tariff-setting mechanism for pipeline tariffs and pipeline operating rate of return, based on an after-tax return on full investment of 8%. This system improves pricing transparency and paves the way for eventual liberalisation of well-head and city-gate prices.
On 16 November, NDRC announced that the city-gate gas price in Fujian (3% of China demand) would be liberalised and based on negotiations between suppliers and customers. We assume this liberalisation will be extended to other major cities in due course.
On 20 November, NDRC removed the price cap of natural gas for fertiliser producers, which would allow gas suppliers to significantly raise gas prices equivalent to 7% of China’s demand.
On 22 November, local news reported that PetroChina would lift non-residential city-gas prices by 10-15% from 20 November 2016 to15 March 2017, the first time that PetroChina has applied for a price increase since NDRC granted gas suppliers flexibility to negotiate prices within a +/- 20% range.
Broadly, these measures have moved the gas market closer to full deregulation with greater price flexibility, improved third-party access and lowered transmission costs. These measures are broadly positive for demand growth, by better matching supply with demand, and should allow gas demand to return to mid-teens growth.
While we are positive on gas volume growth in China, we see less upside potential for gas prices due to considerable oversupply:
IHS estimates global LNG capacity to grow 46% over 2015-20, in excess of demand growth of 36% over the same period, resulting in rising overcapacity.
Long term, global natural gas prices could be determined by North American LNG production, whose economics continue to be helped by cheap shale gas resources, and whose access to international gas markets is rapidly rising.
As a result, we do not see much upside potential for China city-gate gas prices, which are currently 33% more expensive than the NDRC’s proposed pricing formula based on oil prices. We believe gas prices are likely to exhibit more pronounced seasonal swings, but the annual price to remain largely unchanged over the next few years.
Exhibit 127: Global LNG capacity vs demand Exhibit 128: US break-even price for gas resources
Investment strategy – Prefer low cost or strong downstream
To take into account our lower oil price assumptions (-USD2/bbl for both 2017E and 2018E), and company specific factors, we make the following changes:
PetroChina – we significantly cut our 2016 reported net profit estimates as we now factor in only RMB25b of exceptional gains vs our previous assumption of RMB30b. We raise our 2017-18E reported net profit by 5% each as we factor in stronger refining and marketing profitability, which offset the impact of lower upstream profits.
Sinopec – we make only minor adjustments to 2017-18E reported net profit estimates as we factor in stronger refining and marketing profitability, which offsets the impact of lower upstream profits.
CNOOC – we cut 2017E and 2018E net profit by 9-16% to reflect our lower oil price assumptions and a 2% decline in 2017E oil & gas production vs our previous assumption of flat production.
In our view, there are limited downside risks for China NOCs, given the benign regulatory environment, significant cost savings achieved and strong positive OpFCF generation. Conversely, we do not expect sector stocks to enjoy the strong performance seen in previous oil upcycles, as we believe current share prices are already factoring in long-term oil prices of around USD65/bbl.
In our base case that assumes a modest rise in oil prices, we expect Sinopec and CNOOC to outperform PetroChina as:
Sinopec and CNOOC are trading at lower EV/EBITDA multiples compared with PetroChina while offering higher dividend yields.
PetroChina’s downstream operations are weaker than Sinopec while the upstream operations have higher costs than CNOOC. Therefore, Sinopec offers more direct exposure to a potential diesel demand rebound, while CNOOC offers potentially higher profitability.
The key risk to this stock selection would be if oil prices were to increase by more than we expect, since PetroChina’s earnings are most geared towards oil prices – each USD1/bbl change to our base case affects 2017E earnings for PetroChina by 11%, Sinopec by 3% and CNOOC by 7%, all else being equal.
Exhibit 129: Changes to earnings estimates and target price
As of 30 Nov 2016 Sources: Bloomberg; BNP Paribas estimates
BNP PARIBAS 2 DECEMBER 2016 42
ASIA OIL & GAS/CHEMICALS Yong Liang Por
Target price derivation
Sinopec–A – Our unchanged TP of RMB6.65 is based on SoTP. The main downside risk is from lower-than-expected oil prices.
Sinopec-H – Our unchanged TP of HKD7.00 is based on SoTP. The main downside risk is from lower-than-expected oil prices.
PetroChina-H – Our unchanged TP of HKD5.80 is based on SoTP. The key upside/downside risks come from higher-/lower-than-expected oil prices.
PetroChina-A – Our unchanged TP of RMB6.00 is based on SoTP. The key upside risk comes from higher-than-expected oil prices.
CNOOC – We lower our TP to HKD12.40 (from HKD12.80) based on DCF that assumes an unchanged WACC of 9% (risk free rate of 4% and beta of 1.1x) and g of zero. The key reason for the lower TP is that we cut our 2017 earnings estimate by 16%. The key downside risk comes from lower-than-expected oil prices.
BNP PARIBAS 2 DECEMBER 2016 43
ASIA OIL & GAS/CHEMICALS Yong Liang Por
India outlook – Downstream benefits and attractive investments midstream
In line with our expectations for 2016, the Indian O&G sector has returned 29% YTD compared with the SENSEX at 1.54%. The outperformance of the refining and marketing companies was driven by strong petroleum product demand (up 6.5% YTD), upstream benefitted from zero subsidy contribution and hence increased realisations. Midstream gas utilities companies also performed well due to higher LNG demand and renegotiation of the RasGas contract benefitting both PLNG and GAIL.
For 2017, we believe that a similar theme as 2016 will hold true for the Indian oil and gas sector, as long as crude prices remain below the USD65/bbl mark:
Petroleum demand should remain strong, albeit the high base effect of 2016 should mean growth will be lower. We expect total petroleum demand to grow 6.6% y-y for FY17 and 6.9% for FY18, compared with 11.2% for FY16. FY16 was driven by 14.5% demand growth for Gasoline, 7.6% for diesel and 23% for Naphtha.
OMCs have performed very well within the India oil & gas space in 2016 with YTD returns of 43.5% for BPCL and 58.2% for HPCL vs a 1.54% gain in SENSEX. We expect OMCs’ performance to remain resilient, supported by strong demand for auto fuels - MS grew 11.4% y-y and HSD by 3.3% y-y for April-October 2016, coupled with stable marketing margins. The resilient refining margin should further improve the earnings visibility for OMCs.
Stocks of upstream PSUs rallied in 2016 to date (ONGC up 15.2% and Oil India by 9.8% vs a 1.54% increase in SENSEX) mainly due to a slight recovery in the crude oil realisation, nil discount on crude oil to OMCs and lower cess. We believe the stocks have factored in all the positives and are likely to remain range-bound until there is a spike in the oil price and uptick in oil and gas production.
For 2017, we believe PSU upstream companies have limited upside potential following the recent rally, in spite of weakness in crude, which was driven by the GOI’s announcement of full realisation on crude for FY17. The recent agreement within OPEC to cut production levels should provide a near-term boost, but a sustained rally in crude would once again put realisations under pressure as under-recoveries begin to hamper them.
We expect a USD60/bbl crude price for FY18 (CY17 estimate of USD58/bbl and CY18 estimate of USD68/bbl) and hence assume some under-recovery contribution, resulting in realisation of USD56/bbl for ONGC.
We expect Indian O&G production to remain largely flat, which will result in higher LNG imports, benefiting the midstream companies.
Among midstream companies, we prefer Petronet LNG and GAIL. PLNG in particular has become a structural play post the resolution with RasGas regarding LNG off-take and pricing of the long-term cargo. With a large part of its incremental LNG capacity contracted, the visibility and predictability of earnings makes PLNG an interesting story. GAIL has also benefited from the resolution with RasGas. The company’s petchem business benefited from a lower cost of contracted LNG, which is used as a feedstock. Incremental power demand, coupled with a fall in prices of contracted LNG, should boost the company’s transmission and trading volumes.
BNP PARIBAS 2 DECEMBER 2016 44
ASIA OIL & GAS/CHEMICALS Yong Liang Por
Indian petroleum demand to remain robust in 2017E
India added 0.34mbpd in FY16 (3.64mbpd in total demand) and YTD FY17 total demand has been 0.13mbpd higher. Diesel, after contributing 41% of FY16 demand, has contributed 40% YTD FY17; however, incremental growth for YTD FY17 was driven by Naphtha and LPG.
Our analysis suggests that India’s diesel consumption growth is strongly linked to GDP growth with a six- to 12-month lag. During FY07-14, India’s diesel consumption grew at an average rate of 7.9% y-y, compared with average GDP growth of 7.8% over the same period. With over 7% GDP growth in FY15, India’s diesel consumption grew by 7.6% to 75mmt during FY16. We expect diesel growth to pick up to 6.4% for CY17, slightly lower than its GDP growth rate of 7.5% (BNPP estimate); the lower growth expectation is due to slower industrial demand recovery and also a switch to cheaper gasoline vehicles, as the price difference between the two fuels remains narrow.
Exhibit 131: India diesel consumption at 1.5mbpd – transport sector accounts for 70% of diesel consumption
Source: PPAC
Exhibit 132: Diesel consumption highly correlated to GDP growth with 6-12 month lag
Sources: PPAC
PVs28.5%
CVs37.8%
Railways3.2%
Other transport (Aviation/ Shipping)
0.5%
Agriculture13.0%
Industry9.0%
Mobile towers1.5%
Others 6.4%
(2)
0
2
4
6
8
10
12
FY03
FY04
FY05
FY06
FY07
FY08
FY09
FY10
FY11
FY12
FY13
FY14
FY15
FY16
FY17
YTD
(%) Diesel consumption y-y growth GDP growth
BNP PARIBAS 2 DECEMBER 2016 45
ASIA OIL & GAS/CHEMICALS Yong Liang Por
For CY17, the IMF expects India’s GDP growth to pick up 7.5% vs sub 5% levels over CY12-14. However, due to a decline in industrial activity (FY17 to date India manufacturing IIP growth has slowed down to 1.2% y-y vs 2% in FY16) and a 3.3% increase in diesel price, we expect growth in road freight traffic (elasticity with GDP of 1.2x) might slow down slightly in CY17. Tractor sales volumes, on the other hand, have increased by 21% and CV sales by 7% YTD FY17, which could potentially result in diesel demand improving and our assumption proving conservative, especially in the 2H of CY17.
Road construction activities have substantially increased bitumen and bulk diesel consumption over the last couple of years. We expect consumption to remain strong as the revenue collected from the increase in excise duties on petroleum products is spent by the GOI on infrastructure building, particularly roads.
Exhibit 133: India diesel consumption recovering in FY16 and FY17 to date, post flat growth over FY14-15 on high diesel price
Exhibit 134: Diesel price and diesel consumption growth
Sources: PPAC; BNP Paribas Research Sources: PPAC; BNP Paribas
Exhibit 135: India IIP – Weakening IIP in FY17 can curb diesel growth
Exhibit 136: India manufacturing IIP – Weak manufacturing can cause near-term weakness in petroleum product demand
YTD CY16, gasoline demand has grown at an impressive 14% on a strong CY15 base. In FY17 to date, gasoline volume consumption has grown 11.28% (FY16 growth of 14.5%) as low prices and strong auto/two wheeler sales continued to boost demand. Gasoline accounts for around 21.3% of India’s auto fuel consumption and is mainly used as transportation fuel in India, with 2-wheelers accounting for 61.4% of gasoline consumption, followed by PVs at 34.3% and 3-wheelers at 2.4% (as of FY16).
During FY03-10, the price difference between petrol and diesel was an average of INR12.4/litre, but this price gap widened to INR20/litre over FY11-14 post de-regulation of gasoline prices in 2010. With the de-regulation of diesel prices in Oct-2014, the petrol-diesel price differentials have narrowed down again to INR11/litre in FY17YTD. As a result of the above, price sensitive 4-W customers have shifted their preference to cheaper gasoline cars over diesel cars. Moreover, 2W sales volume has grown at double digits, leading to strong demand growth of 16% in FY17 YTD.
Exhibit 137: Incremental highways constructed – Boost for diesel demand
Source: PIB
Exhibit 138: India gasoline consumption at 0.48mbpd – transport sector accounts for 100% of consumption
Source: PPAC
0
1,000
2,000
3,000
4,000
5,000
6,000
7,000
FY12 FY13 FY14 FY15 FY16
(kms)
2-Wheelers61.4%
3-Wheelers2.4%
Cars34.3%
UV1.5%
Others 0.4%
BNP PARIBAS 2 DECEMBER 2016 47
ASIA OIL & GAS/CHEMICALS Yong Liang Por
We believe an increase in per-capita GDP and rising share of middle class in the overall population of India (currently at 17%) would increase 4-W penetration in India from current levels of 5.7%. Consequently, we expect gasoline consumption to continue to grow at 9% for FY18 (see Exhibit 142).
Exhibit 139: India gasoline-diesel price differential narrowing
Sources: Bloomberg; BNP Paribas
Exhibit 140: India gasoline consumption on rise due to strong growth in 2-W and preference for petrol cars
Source: PPAC
Exhibit 141: Petrol price and petrol consumption growth
Sources: Bloomberg; BNP Paribas
Exhibit 142: India petroleum product consumption expected to grow at 7% CAGR over FY15-20, led by HSD, MS, ATF and Petcoke
The government has taken initiatives, such as the Pradhan Mantri Ujjwala Yojana (PMUY) scheme, to increase the penetration of LPG in rural areas and increase kerosene substitution with LPG. The government has earmarked INR80b for providing LPG connections to 50 million households below the poverty line. During May-October, the government released more than 10m LPG connections under the scheme. As a result, LPG consumption grew 11.25% y-y in FY17 YTD. Given the above-mentioned scheme and continued success in the implementation of DBTL, we expect LPG consumption to grow 7.8% in FY18 (last ten years’ growth rate 6.1%).
Petroleum product demand may be impacted near term
With the overall economy widely expected to slow down over the next couple of quarters due to demonetisation, medium and heavy commercial vehicles could be the most affected, after strong growth in October 2016. This is another reason for our slightly conservative assumption on diesel demand growth. Most of the other petroleum products should only see a near term demand-related impact, and hence we are not too concerned about overall petroleum product demand being weak.
Exhibit 145: India MHCV demand remains strong
Sources: SIAM; BNP Paribas
(60)
(40)
(20)
0
20
40
60
80
0
5,000
10,000
15,000
20,000
25,000
30,000
35,000
40,000
45,000
Jan-
12
Mar
-12
May
-12
Jul-1
2
Sep-
12
Nov
-12
Jan-
13
Mar
-13
May
-13
Jul-1
3
Sep-
13
Nov
-13
Jan-
14
Mar
-14
May
-14
Jul-1
4
Sep-
14
Nov
-14
Jan-
15
Mar
-15
May
-15
Jul-1
5
Sep-
15
Nov
-15
Jan-
16
Mar
-16
May
-16
Jul-1
6
Sep-
16
(y-y %)('0s) MHCV sales volume (LHS) Growth (RHS)
BNP PARIBAS 2 DECEMBER 2016 50
ASIA OIL & GAS/CHEMICALS Yong Liang Por
OMCs continue to fend off private competition
We believe OMCs will face limited competition from private players. They have doubled their number of retail outlets since FY06 and introduced loyalty schemes to retain customers. OMCs operate 52,604 retail outlets as on March-16, with almost 39% of its fuel outlets now automated. Moreover, OMCs have roughly one retail outlet every 9km on average on highways, making private sector penetration difficult, especially for diesel.
We expect new dealers to have little incentive to partner with private players under dealer-owned dealer-operated (DoDo) models, given limited success and low return ratios, based on earlier experiences. Post demonetisation, we would expect private players to see weaker sales, as they have stopped accepting the old currency while the oil marketing companies are accepting it, on the GoI mandate, making them more popular with customers. As this is just a near-term phenomenon, and barring sharp discounts by the private players that cannot be sustainable in the long run, it will be very difficult for private players to take market share from the OMCs, especially retail pump sales. One caveat is that private players are being competitive in the bulk diesel segment and have gained some market share. Overall, we estimate the private players will take not more than 5-7% market share in bulk diesel from the OMCs.
Exhibit 146: Total number of retails outlets (OMCs)
Source: OMC Annual reports
Exhibit 147: Automated retail outlets as % of installed base for OMCs
Note: data is as of March-15 Sources: Annual reports
(no. of outlets)Total ROs (including rural ROs) Automated ROs
BNP PARIBAS 2 DECEMBER 2016 51
ASIA OIL & GAS/CHEMICALS Yong Liang Por
LNG should continue to see an increase in demand
YTD 2016, compared with the petroleum demand story, the Indian gas demand story has been equally attractive. LNG demand in FY17 to date has increased 26.2%, in the absence of any new capacity addition, as a function of lower spot prices, gas pooling for the power sector and also better affordability to the fertiliser sector.
The fertiliser sector has contributed the most to the recent demand growth, while the power sector has been the second highest contributor.
Exhibit 148: Fertiliser and Power saw the highest demand growth
Sources: DGH, PPAC & PNGRB
Exhibit 149: LNG imports continue to grow as demand for gas increases
Sources: PPAC, Company Reports
86.5 104.59 122.69 140.78 158.8859.86
59.9660.39
72.0996.8596
101106
113
122
242266
289
326
378
0
50
100
150
200
250
300
350
400
FY13 FY14 FY15 FY16 FY17E
(mmscmd)Demand-power Demand-fertiliser Demand-others Total supply
(%)(mmscmd)Imported LNG (LHS) Share of LNG in India gas consumption (RHS)
BNP PARIBAS 2 DECEMBER 2016 52
ASIA OIL & GAS/CHEMICALS Yong Liang Por
Exhibit 150: Gas production September 2016 Exhibit 151: LNG share in gas consumption increases
Source: PPAC Source: PPAC
Exhibit 152: Improving trend in LNG imports
Source: PPAC
Fertiliser43.59
Power35.54
City Gas20.6
Petchem/Refineries and
others39.6
Sponge Iron/Steel
2.0
Industrial1.8
Fertiliser21.9
Power9.7
City Gas7.9
Petchem/Refineries and
others29.1
Sponge Iron/Steel
2.0
Industrial1.3
(25)(20)(15)(10)(5)0510152025
0.00.20.40.60.81.01.21.41.61.82.0
Apr-1
5
May
-15
Jun-
15
Jul-1
5
Aug-
15
Sep-
15
Oct
-15
Nov
-15
Dec
-15
Jan-
16
Feb-
16
Mar
-16
Apr-1
6
May
-16
Jun-
16
Jul-1
6
Aug-
16
Sep-
16
Oct
-16
(m-m %)(mmt)LNG imports (LHS) Growth (RHS)
BNP PARIBAS 2 DECEMBER 2016 53
ASIA OIL & GAS/CHEMICALS Yong Liang Por
Indian O&G: Earnings momentum makes it attractive
The BSE India O&G index has been a strong performer ever since crude prices began their fall, returning 31.8% YTD CY16. For the third year in a row, we remain bullish on the sector, as oil prices are once again expected to remain below the threshold that is advantageous for India (USD60/bbl), wherein on account of the lower crude price the fiscal deficit situation improves, and low prices also boost demand for petroleum products. Broadly, the key drivers for the sector make for an interesting investment case.
PSU Upstream companies: While the recent rally vis-à-vis crude prices seems a bit overdone, the overall fundamentals remain healthy, as the GOI has assured full realisation for FY17. In the event oil prices remain below USD60/bbl, the downside risk for these companies seems limited, as under-recoveries should be manageable by the GOI itself.
Downstream and marketing companies: The downstream and marketing companies remain the best positioned in our view, as improving diesel and fuel oil economics should keep refining margins stable. In addition, any surge in crude prices would bring in inventory gains. As discussed above, Indian petroleum demand remains healthy, and hence the marketing business should continue to show earnings growth even if marketing margins are flat.
Midstream: Earnings visibility remains the most attractive within the midstream space, which we believe could mean stocks here are awarded a premium. LNG demand should once again remain robust, with the 5MT Dahej expansion coming online during CY17. This will boost transmission volumes as well, which bodes well for the pipeline companies.
We remain Overweight on India O&G as the sector, in addition to improving fundamentals, remains fairly shielded from near-term uncertainties with regard to demonetisation. Also, low crude oil prices protect the sector against any regulatory uncertainties and bring the focus solely to the growth prospects, which we believe remain strong.
BNP PARIBAS 2 DECEMBER 2016 54
ASIA OIL & GAS/CHEMICALS Yong Liang Por
RIL – Stock trading at core refining & petchem valuations
CY16 has been a mixed year for RIL shares; they benefitted from early strength in refining in early 2016 and performed well going into the telecom launch. The telecom launch was a success as the company ramped up to 16m subscribers in its first month of free service. However, post 2QFY17, the shares gave up almost all the gains made in the year so far, due to continued delays at the ROGC and petcoke gasifier projects. Also, telecom subscriber growth has slowed down and the lack of clarity with regard to the start of operations (end of the free service period) further impacted the stock, while refining weakness further justified the correction.
However, since then, refining has bounced back on strong demand for diesel and fuel oil, and chemical margins remain stable. After delays, the petchem expansion projects of ROGC and petcoke gasifier now seem to be on track. Our expectations with regard to a diesel recovery would aide RIL in FY18E, which prompts us to increase our FY18 estimates slightly. Our FY17 estimates also increase slightly, to account for a better-than-expected 2QFY17. While telecom subscriber growth has been strong, the extension of the free service period further delays the monetisation prospect for telecom, which is a slight concern.
We reiterate our BUY rating on RIL while slightly increasing our SoTP-based TP to INR1191/sh (previously INR1185/sh). The increase in TP is due to the higher diesel margin assumptions, in line with our house view, and also a better than expected performance in the retail business. We believe 2017 will be a crucial year for RIL as the telecom business will begin to start having an impact on group earnings and the earnings outlook for the company will become clearer. At the current price, the shares are trading slightly higher than the value of the core refining and chemical businesses, which gives us comfort from a downside buffer perspective. We believe any positive progress on the telecom business could result in a re-rating. Risks: weaker than expected GRMs, delay in the commissioning of the ROGC and petcoke gasifier projects, and further delay in monetising the telecom business.
PAT 253,472 253,004 0.2 291,581 284,951 2.3 328,856 330,771 (0.6)
Source: BNP Paribas estimates
BNP PARIBAS 2 DECEMBER 2016 55
ASIA OIL & GAS/CHEMICALS Yong Liang Por
Exhibit 154: RIL – SoTP based valuation changes
Fair value (INR/share) New Old Comments
Refining and Petrochemicals
Refining - incl. RPL 548 543 Valued at 6 x EV/EBITDA (unchanged), in line with global peers in-spite of high complexity refineries
Petrochemicals 430 430 Valued at 6x EV/EBITDA (unchanged), in line with global peers in-spite of a relatively flexible product slate
Sub total 978 973
E & P
Oil and Gas - PMT 14 15 Valued at 4x EV/EBITDA (unchanged); maturing fields + under CAG lens - hence a de-rated multiple
KG D6 Gas (D1/D3) 43 43 DCF at 10% WACC (unchanged). Using a 2P reserve estimate of 6.6tcf of gas; lower LT domestic gas price assumption of USD5.5/mmbtu (vs USD6/mmbtu earlier)
KG D6 Oil (MA) 3 4 DCF at 10% WACC (unchanged). Using a 2P reserve estimate of 44m bbls of oil
Sub total 60 62
Total standalone 1,038 1,035
Net Cash (308) (308) Includes cash + liquid investments
Standalone equity value 730 727
RIL – Shale ventures
Atlas JV 12 12 Cost of capital of 10% and average long-term gas price assumption of USD4.5/mmbtu
Pioneer JV 11 11 Cost of capital of 10% and average long term gas price assumption of USD4.5/mmbtu; NGL+condensate linked to crude prices
Carizzo JV 2 2 Valued recoverable reserves of 3.4tcfe, 60% stake at EV/boe of USD2
Shale sub total 25 25
Reliance Retail 59 56 Valued at 0.60x EV/Sales
Telecom 377 377
Target price (INR) 1,191 1,185
Sources: BNP Paribas estimates
BNP PARIBAS 2 DECEMBER 2016 56
ASIA OIL & GAS/CHEMICALS Yong Liang Por
HPCL – Re-rating to continue as fundamentals remain strong
The shares of HPCL have had a strong run during CY16, benefitting from strength in refining in the early part of 2016, followed by inventory gains on strengthening crude and the continued trend of strong petroleum demand YTD in CY16 (up 9.1%), which boosted earnings.
HPCL has reported stronger earnings growth than its peers due to greater exposure to marketing business, particularly benefitting from higher sales of lubes and bitumen, which boosted margins.
We increase our FY18 and FY19 estimates to factor in an improved diesel spread. Our FY17E earnings decline slightly to factor in a weaker-than-expected 2QFY17. While HPCL has had a strong run this year, there could be a near-term correction due to the sudden spike in crude prices, raising concerns about petroleum product demand; however we continue to like the fundamentals, as the company offers exposure to both refining and marketing. There could be upside to our earnings forecasts if crude prices rally, as the company will benefit from inventory gains.
We reiterate our BUY rating and raise our TP from INR490/sh to INR525/sh (unchanged 9x P/E on FY18E earnings). We value the investments at a 20% discount to current book value. We expect earnings CAGR of 12.2% from FY17 to FY19, with ROE around the 22-24% level, making current valuations very attractive for investors, in spite of the strong outperformance. Downside risks: Sharp decline in crude prices, and a drop in refining margins.
PAT 46,226 47,069 (1.8) 54,918 53,823 2.0 58,147 56,871 2.2
Source: BNP Paribas estimates
Exhibit 156: HPCL – SoTP based valuation changes
(INR/share) New Old Comments
Standalone business 469 435 We value the standalone business at 9.0x P/E (FY17E) (unchanged)
Investment in MRPL (MRPL IN) + Oil India (OINL IN) + Bhatinda Refinery (not listed)
56 55 20% holding discount (P/B multiple of 0.35x for Bhatinda refinery) (unchanged)
Fair value 525 490
Source: BNP Paribas estimates
Exhibit 157: HPCL – Consolidated ROE profile
Sources: Company reports; BNP Paribas estimates
18.3
13.4
6.9
12.6 13.4
1.33.7
7.810.7
31.4
24.5 24.822.4
0
5
10
15
20
25
30
35
FY07
FY08
FY09
FY10
FY11
FY12
FY13
FY14
FY15
FY16
FY17
E
FY18
E
FY19
E
(%)
BNP PARIBAS 2 DECEMBER 2016 57
ASIA OIL & GAS/CHEMICALS Yong Liang Por
BPCL – Expensive relative to HPCL, with greater refining exposure
In the past, we preferred BPCL to HPCL, primarily due to the former being more efficient in its operations. However, we now prefer HPCL. Since the decline in crude prices HPCL has caught up with BPCL in terms of working capital management, and BPCL’s lower marketing exposure has resulted in lower earnings growth.
Shares of BPCL on a standalone basis have performed well, but have underperformed HPCL by c18%, YTD CY16. We believe this is warranted as BPCL still trades at more than a 22% premium to HPCL with comparable ROEs and an earnings CAGR of 4.8% over FY17-18E. On our FY18 estimates, BPCL trades at 7.3x EV/EBITDA, compared with HPCL at 5.9x. We believe the decline in crude prices has resulted in what was once the flagship business of E&P being a drag on the company’s balance sheet.
We reiterate our HOLD rating on the shares of BPCL, while revising our SoTP-based TP upwards from INR635/sh to INR676/sh. We continue to like BPCL from a long-term perspective, but would await a correction before revisiting our stance; given the premium valuation to HPCL, at least until the E&P business begins to garner more interest. Downside risks: Slowdown in demand for petroleum products, subsidy sharing in the event the crude oil price increases further, and continued weakness in refining margins. Upside risks: Higher than expected refining margins and continued strong demand for petroleum products.
PAT 83,924 85,405 (1.7) 89,111 86,948 2.5 92,190 90,600 1.8
Sources: BNP Paribas estimates
Exhibit 159: BPCL – SoTP based valuation change (INR/share) New Old Comments
Equity value 565 525 We value the standalone business at 9x P/E (unchanged)
Market investments 37 37 Market investments valued using 20% holding company discount (unchanged)
Bina 26 26 Bina Refinery valued at 1.5x book value (1 yr fwd) (unchanged)
Numaligarh 15 14 Valued at 3x (1 yr fwd) EV/EBITDA (unchanged)
E&P 34 34 Reserves of 50tcf (unchanged) and long-term FX rate of INR66/USD (unchanged) at USD1.5/boe (unchanged)
Fair value 676 635
Source: BNP Paribas estimates
Exhibit 160: BPCL – Consolidated RoE profile
Sources: Company reports; BNP Paribas estimates
20.1
14.5
4.8
11.8 11.0
5.0
11.5
21.5 22.9
31.5
27.224.2
21.3
0
5
10
15
20
25
30
35
FY07
FY08
FY09
FY10
FY11
FY12
FY13
FY14
FY15
FY16
E
FY17
E
FY18
E
FY19
E
(%)
BNP PARIBAS 2 DECEMBER 2016 58
ASIA OIL & GAS/CHEMICALS Yong Liang Por
PLNG – Earnings visibility should get a premium
A low crude price continues to make PLNG a very attractive stock to own, as LNG demand remains strong. The stock price performance in CY16 to date has been largely driven by continued strength in volumes, which consistently beat market expectations, as the Dahej plant worked at more than 100% utilisation. The first leg of share appreciation was driven by strong volumes, largely driven by short-term cargos and the resolution of contracts with RasGas in late 2015, which ensured the long-term volume off-take once again reached its historical levels. The second leg of recovery, partly seen in 1QFY17 results and more so in 2QFY17 results, was PLNG’s ability to process spot cargoes, which enabled the company to charge higher margins and resulted in an earnings surprise.
LNG volumes for 1HFY17 were up 25.6% on a y-y basis, which resulted in earnings growth of almost 60%, beating the Bloomberg consensus estimate. Near term, volumes may decline as we get into the winter months, wherein plant utilisation drops resulting in lower volumes. This could result in the share being range bound near term, which would coincide with the additional 5MT Dahej capacity beginning to ramp up.
Starting from FY18, we believe the new Dahej capacity will start contributing to earnings, and any clarity on the Kochi pipeline would further boost the long-term outlook for earnings, as the Kochi terminal (5MT) continues to work at less than 10% utilisation due to a lack of pipeline connectivity.
We reiterate our BUY rating on the shares of PLNG with a revised DCF- (unchanged DCF assumptions) based TP of INR425/sh (previously INR391/sh). Our FY17 earnings forecast increases sharply, to account for stronger-than-expected earnings in 1HFY17. Our FY18 and19 earnings estimates move up slightly on higher utilisation assumptions (from 105% to 107% for both FY18 and 19). We like the earnings visibility that PLNG offers, with potential earnings catalysts should PLNG be able to market higher spot cargoes, as well as clarity on Kochi pipeline completion. Risks: Uptick in LNG prices resulting in lower utilisation and continued delays at Kochi.
ONGC shares have had a year of ups and downs, wherein a lack of clarity on subsidy and no catalysts resulted in a lacklustre share price performance. However, post 1QFY17 results, catalysts emerged in terms of lower cess, a higher sales volume for crude due to internal efficiencies, and no subsidy sharing for FY17. The rally in the shares post these events largely captures the above benefits, in our view. In the event crude prices rally beyond our estimate of USD60/bbl for FY18, realisation will begin to drop as subsidy sharing will once again kick in. At the current price, we believe the shares are factoring in all the positives, with realisation for FY18E at USD56/bbl along with a gas price of USD4.2/mmbtu, which seems optimistic compared with the current level of USD2.8/mmbtu.
ONGC management highlighted that production for FY17 will fall slightly short of guidance. In addition, operating costs have declined in recent quarters, largely due to lower work over-expenditure, as the company spent more on exploratory initiatives, which are capitalised. However, these costs will remain lower only for FY17E, and FY18E could once again see an increase, in our view. In addition, we remain concerned by ONGC’s change in accounting policy. Previously, the company could hold exploratory wells on the books for two years before writing them off, if it so decided. Now, the holding period has been extended to three years for onshore wells, five years for shallow water offshore and seven years for deep water wells. This is also reflected in the increase in wells under progress on the balance sheet, exposing ONGC to large swings in well write-off costs in the years to come.
We see limited upside potential from the current share price (based on our scenario analysis), even after factoring in net realisation of USD55/bbl, a gas price of USD4.2/mmbtu, a lower cess rate of 10% and an oil/gas production increase of 2%/2% into our FY18 base case assumptions. We reiterate our HOLD rating with an unchanged TP of INR293/sh.
Upside risks: Sharp increase in oil price and higher than expected production. Downside risks: Higher subsidy sharing and lower production meant for sale.
Exhibit 164: ONGC – SoTP based valuation TP Comments
(INR/share)
ONGC standalone 229 EV/EBITDA of 4x (unchanged) on FY18E (unchanged)
ONGC Videsh 35 EV/BOE of USD2.3/boe (unchanged)
MRPL 11 EV/EBITDA at 4x FY18E (unchanged)
Investments 18 Valued using 20% holding company discount to market value (unchanged)
TP (INR/share) 293
Source: BNP Paribas estimates
Exhibit 165: Scenario analysis of ONGC fair value and FY18E EPS Worst case Base case Best case
We missed the rally in the shares of Oil India, which was driven by improvements in production, no subsidy impact and lower cess. In addition, investments in IOC (IOC IN, NR) also now form a material component of Oil India’s valuation. Similar to ONGC, OINL also benefitted from improving crude prices, which boosted realisation.
However, we believe the overhang from the Mozambique acquisition and the recent acquisition of a stake in the Vankor and Taas-Yuriakh fields will put pressure on borrowing for the company, with cash flows likely to be flat in the future, especially in the case of Mozambique. In addition, continued low gas prices will also restrict earnings growth, which recently got a boost from improving realisations on the crude front.
On the production front, Oil India continues to have a mixed outlook, wherein crude production continues to struggle to show any growth after a 5.6% decline for FY16. For 1HFY17, crude production was down 3%, reinforcing concerns from a crude production perspective. Gas production has surprised us with 4% growth for FY16, and production for 1HFY17 was up 9.6% y-y; however, low gas prices (USD2.8/ mmbtu) have hurt the company as it barely is able to break even on the sale of natural gas, limiting any benefit from an increase in production.
We reiterate our HOLD rating on the shares of Oil India, with a revised SoTP-based TP of INR429/sh (previous INR363/sh). We raise our FY17/18 earnings estimates by 2.3%/12.6% and introduce our FY19 earnings estimates, which show 6% y-y earnings growth. Our increase in earnings is largely driven by our estimate of better realisations for FY17/18, as the subsidy impact becomes less material. In addition, OINL’s investment in IOC also adds materially to our increase in TP, due to the strong share price performance of IOC (we value all investments at a 20% holding company discount). We like the outlook for Oil India, but await a correction before revisiting our stance, which could be a function of decline in crude prices. Downside risks: Higher than expect under-recoveries and write off at Mozambique. Upside risks: Lower than expected cess rate and material increase in oil/gas production.
Exhibit 167: Oil India SoTP based valuation changes
Valuation (INR/share) New Old Comments
Standalone 293 254.0 Valuation at 4x EV/EBITDA (unchanged) on FY18E basis, rolled over from FY17E
Investments 109 67.0 Valued at 20% discount to market value (unchanged)
Mozambique 28 41.0 Valued a reduced USD1.5 EV/BOE from USD2 EV/Boe in line with other stake owners
Total 429 363
Source: BNP Paribas estimates
BNP PARIBAS 2 DECEMBER 2016 62
ASIA OIL & GAS/CHEMICALS Yong Liang Por
GAIL –Utility businesses to shine through long term
GAIL shares have benefitted from clarity on RasGas pricing, which has lowered the gas cost for the petrochemical business. In addition, higher LNG demand from the fertiliser and power segments has resulted in strong transmission volumes and higher gas trading volumes for the company, leading to increased profitability.
Near term, we believe the shares might see some correction as we get into the winter months, wherein in LNG demand declines due to lower capacity utilisation. In addition, US LNG contracts begin to pose some risk to the long-term outlook of the company. This risk still cannot be quantified with any certainty, as in the event crude prices cross USD65/bbl by CY18, the value erosion from the US LNG contracts declines.
We reiterate our BUY rating on the shares of GAIL India with a revised SoTP based TP of INR465/sh (previous INR430/sh). A potential catalyst that is not in our estimates is the upward revision in the pipeline tariff’s the timing of which is uncertain. Our FY17 earnings estimates increase by 3.9% to account for a stronger Q2FY17 results. FY18 and 19 estimates increase by 2.4-3.5% on higher transmission volume assumption as the Dahej 5MT LNG plant gets commissioned. Risks: Lower transmission volumes on weaker gas demand, sharp uptick in crude prices which will increase gas cost.
PAT 39,746 38,267 3.9 42,684 41,681 2.4 44,087 42,616 3.5
Source: BNP Paribas estimates
Exhibit 169: GAIL – SoTP based valuation
Business New Old Comments
(INR/share) (INR/share)
NG transmission 162 147 We assign EV/EBITDA at 6x (unchanged)
NG trading 78 77 We assign EV/EBITDA at 6x (unchanged)
LPG & OHC 50 60 We value the business at 5.5x EV/EBITDA (unchanged)
Petrochemicals 59 55 We assign EV/EBITDA of 5x (unchanged)
LPG transmission 15 15 We assign EV/EBITDA of 6x (unchanged)
Total 356 355
Market investment 102 89 Post 20% holding company discount; investments include ONGC IN, PLNG IN, China Gas holdings (0384 HK), IGL IN
A1/A3 Myanmar 5 5 EV/BOE of USD3; 5.5tcf and 50% recovery assumed
Other investments (stakes in CGD business ex-IGL + OPAL + BCPL* and others)
34 35 20% discount to FY15 book value of investments
Less: Net debt 19 32
TP (INR/share) 465 430
Source: BNP Paribas estimates
BNP PARIBAS 2 DECEMBER 2016 63
ASIA OIL & GAS/CHEMICALS Yong Liang Por
Thailand outlook – PTTGC/PTTEP offer most upside potential
Energy outlook – slowing gas growth and rising competition
In 2016, Thailand’s oil product demand has risen 2%, but gas consumption contracted 1%. Oil production has risen 12% while natural gas production has fallen 2%. Natural gas remains the largest source of energy consumption, with 43% volume share in 9M16. The Power Development Plan 2015 (PDP 2015) plans to shift Thailand’s energy mix away natural gas and oil and towards hydro and imported electricity over the long term.
Long term, we expect natural gas demand for the power sector to show minimal growth as: 1) electricity demand in Thailand will be increasingly served by coal-fired power plants and electricity imports; and 2) new gas-fired plants should be more efficient, resulting in less natural gas consumption.
We expect Thailand to take advantage of current low LNG prices to secure long -term contracts, which should boost LNG terminal usage. With Third Party Access (TPA) codes for use of gas pipelines and LNG terminals in place, we expect the gas supply market to become more competitive, eroding PTT’s monopoly position.
PTT’s LNG capacity is scheduled to increase from 5mtpa in 2015 to 11.5mtpa in 2020 after LNG terminal 1 phase 2 and LNG terminal 1 expansion are completed. Given that PTT has been allowed to construct LNG terminal 1 and 2, future new LNG terminals may be open for bidding from EGAT and other private power companies. Therefore, there is a risk that PTT may not get full benefit of higher LNG volumes in the longer term.
Exhibit 170: Thailand primary energy consumption Exhibit 171: Thailand primary energy production
Source: EPPO Source: EPPO
Exhibit 172: Installed capacity of power plants Exhibit 173: LNG capacity expansion plan
Source: EPPO (PDP 2015) Source: PTT
0.0
0.5
1.0
1.5
2.0
2.5
2011 2012 2013 2014 2015 9M16
(mboed) Petroleum products NG & LNGCoal LigniteHydro & Imported electricity
0.0
0.2
0.4
0.6
0.8
1.0
1.2
2011 2012 2013 2014 2015 9M16
(mboed) Crude Condensate Natural gas Lignite Hydro
0
10,000
20,000
30,000
40,000
50,000
60,000
2015 2016 2017 2018 2019 2020
(MW) Natural gas Coal Import Renewable Others
0
2
4
6
8
10
12
14
2015 2016 2017 2018 2019 2020
(m tpa) LNG GSP
BNP PARIBAS 2 DECEMBER 2016 64
ASIA OIL & GAS/CHEMICALS Yong Liang Por
Limited proved reserves is a growing concern
Thailand’s proven oil & gas reserves fell to 1,690 mmboe in 2015, down 5% y-y. Natural gas proven reserves, which commanded the largest portion with 78% share in 2015, fell 6% y-y, equivalent to a natural reserve gas life of five years.
To prevent a further decline in production, the Thai government has opened for bidding expiring oil & gas contracts held by Chevron (CVX US, NR) and PTTEP. The terms and criteria for this auction will be completed by end-16, and the winners will be announced in September 2017.
LNG imports are growing amid stable gas consumption
Thailand’s gas supply dropped to 5,034mmscfd in 8M16 (-78mmscfd y-y) due to lower domestic production and lower gas imports from Myanmar (-78mmscfd y-y), which were partly offset by an increase in LNG imports, which stayed at 400mmscfd in 8M16, up from 339mmscfd in 2015.
For 2017, we expect LNG imports to rise further because of declining domestic gas production at some large fields, whose concessions are expiring. These declines may be larger if there is any delay to the award of new energy concessions.
We expect PTT to soon finalise ongoing deals with Shell and BP, each of which involves imports of an additional 1mtpa of LNG. We thus expect LNG imports to rise to 5mtpa in 2017, from 3mtpa in 2016, equivalent to half of Thailand’s LNG terminal capacity of 10mtpa in 2017.
Exhibit 176: Thailand gas supply breakdown Exhibit 177: Thailand gas consumption breakdown
Sources: DMF and PTT Source: EPPO
0
500
1,000
1,500
2,000
2,500
3,000
2007 2008 2009 2010 2011 2012 2013 2014 2015
(mmboe) Crude oil Condensate Natural gas
(15)
(10)
(5)
0
5
10
15
2008 2009 2010 2011 2012 2013 2014 2015
(y-y %) Crude oil Condensate Natural gas
0
1,000
2,000
3,000
4,000
5,000
6,000
2007 2008 2009 2010 2011 2012 2013 2014 2015 8M16
(mmscfd)Domestic International LNG
0
500
1,000
1,500
2,000
2,500
3,000
3,500
4,000
4,500
5,000
2011 2012 2013 2014 2015 9M16
(mmscfd) EGAT IPP SPP Industry GSP NGV
BNP PARIBAS 2 DECEMBER 2016 65
ASIA OIL & GAS/CHEMICALS Yong Liang Por
Refining hiccups amid strong demand
Oil products supply fell 5% y-y to 1,426kbd in 8M16, compared with growth of 6% in 2015, largely due to PTTGC’s refinery shutdown in 2Q16, which saw the average run rate of its crude distillation unit (CDU) fall to 35% in 2Q16. Thai Oil and Star Petroleum (SPRC TB, NR) took advantage of strong margins to run throughputs at above 100% of nameplate capacity.
In 2016 to date, Thailand’s oil product demand has maintained steady growth of 2% (+20kb/d). As production was adversely affected by PTTGC’s 2Q16 shutdown, the shortfall was filled by rising imports, which marked a new high at 196kbd in 8M16.
Gasoline was the fastest-growing product, up 11% y-y in 9M16, followed by jet fuel at 8% and diesel at 4% y-y in 9M16. Surprisingly, fuel oil sales, which have seen negative growth over the last eight years, posted impressive growth of 15% y-y in 9M16 due to rising marine bunker demand.
For 2017, we expect demand growth to moderate. We expect diesel sales volumes to grow 2%-3%, on a par with our Thailand GDP growth estimate at 3%. We expect gasoline volumes to grow 6% from steady auto sales (25.5m vehicles sold in 2016).
Exhibit 178: Oil products production Exhibit 179: Refinery material intake
Source: EPPO Source: EPPO
Exhibit 180: Oil products consumption
Exhibit 181: Oil products imports
Source: EPPO
Source: EPPO
(10)
(5)
0
5
10
15
20
0
200
400
600
800
1,000
1,200
1,400
1,600
2007 2008 2009 2010 2011 2012 2013 2014 2015 8M16
(%)(kbd) Oil products production (LHS)Growth (RHS)
0
50
100
150
200
250
300
350
400
TOP BCP ESSO IRPC PTTGC SPRC
(kbd)Capacity Material intake
(6)
(4)
(2)
0
2
4
6
8
0
200
400
600
800
1,000
1,200
2007 2008 2009 2010 2011 2012 2013 2014 2015 8M16
(%)(kbd) Consumption (LHS) Growth (RHS)
(40)
(20)
0
20
40
60
80
100
0
50
100
150
200
250
2007 2008 2009 2010 2011 2012 2013 2014 2015 8M16
(%)(kbd) Imports (LHS) Growth (RHS)
BNP PARIBAS 2 DECEMBER 2016 66
ASIA OIL & GAS/CHEMICALS Yong Liang Por
Cracker shutdown and price liberalisation hit LPG consumption
In 2016 to date, Thailand’s demand for LPG and propane has fallen 10% y-y, due to slowing demand from automobiles and as feedstock. Demand declined due to higher LPG price on account of LPG price liberalisation since January 2015, which has made LPG more expensive compared with naphtha and gasoline.
LPG supply grew 3% y-y to 4,201kt in 9M16, boosted by higher production from both refineries and PTT’s gas separation plants (GSP). However, as a result of weakening domestic demand from PTTGC’s olefins cracker shutdown in 1H16 and its weaker economics, Thailand’s LPG imports fell sharply, by 68% y-y.
Oil fund strong in spite of lower levies, provides cushion against higher crude
Throughout 2016, the Energy Policy Administration Committee (EPAC) has generally lowered levies on almost all petroleum products in Thailand. This is largely owing to a high oil fund balance, which has been driven by higher sales volumes of oil products
Thailand’s Oil Fund Status remains solid, with the outstanding fund at THB41.7b at the end of September 2016, compared with THB42.6b at the end of 2015, when falling oil prices at the end of 2014 stimulated oil product demand and lessened the Oil Fund’s subsidy burden.
Exhibit 182: Sales growth of petroleum products Exhibit 183: Net exports of petroleum products
('000 tonnes) Cooking Industry AutomobileFeedstock Own used
(150)
(100)
(50)
0
50
100
150
200
2007 2008 2009 2010 2011 2012 2013 2014 2015 9M16
('000 tonnes)
BNP PARIBAS 2 DECEMBER 2016 67
ASIA OIL & GAS/CHEMICALS Yong Liang Por
Investment strategy – Top BUYs are PTTGC and PTTEP
PTTGC (PTTGC TB, BUY) – Attractive valuation and smoother operations PTTGC’s planned and unplanned shutdowns at its refinery and 1-mta ethane cracker in 1H16 have hurt earnings and its share price performance during 2016, although earnings recovered in 3Q16 as these plants restarted. For 2017, we expect PTTGC’s earnings to be boosted by a higher run rate of its olefin crackers, improving diesel spreads and a lower level of plant shutdowns
For 2017-18, we believe ethylene margins will decline from peak levels in 2016, due to start-ups of Indian crackers and US ethane projects. However, strong demand growth should keep margins at still strong levels. As a gas-fired cracker, PTTGC should benefit from low gas feed costs, at least until 2Q17E, after which we expect domestic gas prices to move up along with crude prices.
In 2017, PTTGC should reach Final Investment Decisions (FID) for key projects, including Map Ta Phut Retrofit (upgrade of internal naphtha to olefins), the PO/Polyols project (upgrade propylene to higher-valued PO and Polyols) and Project Max, (improving plant productivity).
We lower our earnings estimates by 13-16% in 2017-2018, as we lower olefins and PE run rates, partially offset by higher GRM assumptions. We expect PTTGC to achieve a market GRM of USD4.9 - 5.3/bbl during 2017-2018, up from USD4.6/bbl in 2016, driven by rising middle distillate spreads and the absence of refinery maintenance. Our CY16 estimate changes slightly after adjusting for lower than expected 3Q16 results.
PTTGC is our top pick with a revised P/B-based TP of THB74 (previously THB70/sh), based on a target multiple of 1.3x 2017E P/B (previously 1.2x). We believe the recent OPEC agreement on a crude oil production cut will help balance the oil markets and pave the way for a steady crude recovery for CY17. Higher crude prices bode well for PTTGC, as its gas cracker economics improve, benefitting the olefins business. Hence, we believe a higher P/B multiple is justified for PTTGC, albeit still below its five-year historical average. The current share price offers an undemanding forward P/B of 0.9x, 1 standard deviation below its long-term historical average.
Downside risks to our TP include unplanned shutdowns, higher-than-expected gas feed costs, softening petrochemical demand, and a potential FID announcement for construction of the US ethane cracker.
PTT Exploration & Production (PTTEP TB, BUY) – Gas price should bottom out PTTEP’s share price has performed well YTD, in line with rising oil prices. Its successful cost reduction programme resulted in production costs falling to USD30/boe in 9M16, from USD38.9/boe in 2015, which helped to minimise the impact of declining gas prices. Sales volumes in 9M16 were also stable y-y, despite rising concerns over the lack of new asset additions.
We expect gas prices to recover from 2Q17 onward, on a price adjustment at Bongkot field (25% of total gas volumes) and taking into account the six-month lag between gas prices and oil prices. We expect sales volume growth of 1% and for production costs to remain at low levels.
We raise our earnings estimates by 9% for both 2017 and 2018: 1) we cut our production cost estimates by 7%-9%; 2) we lower our blended ASP assumption by 5%-6%; and 3) we cut capex by 22% to USD1.5b in 2016 and by 4% to USD2.1b pa for 2017-2018 following the company's published guidance. Our CY16 estimate increases, largely due to adjusting for better-than-expected 3Q16 results.
Consequently, we raise our DCF-based TP to THB99/sh from THB92/sh. Our DCF assumptions remain unchanged, using a WACC of 10.12%. The current share price offers a 12M forward P/B of 0.8x, 1.5 STD below the five-year historical average, and factors in a long-term crude oil price at USD54/bbl with an average decline of 4% pa in sales volume from 2017E onwards.
We believe M&A or new asset addition plans could be positive catalysts. Downside risks include impairment of existing assets, a slower-than-expected gas price recovery, and failure of the cost reduction programme.
Thai Oil (TOP TB, BUY) – Diesel to drive 2017E earnings For 2017, we expect TOP’s market GRM to benefit from improving diesel and fuel oil spreads, driven by rising commodity production and a recovery in China’s demand. We also expect TOP to benefit from lower feedstock costs as more Arab Extra Light crude and Arab Light crude is used in 2017-2018. This also helps TOP to produce more feedstock for high-value base oil.
We raise our earnings estimates by 10.5-22.1% for 2017-2018, taking into account a higher crack spread offset by narrowing OSP discounts. We expect TOP’s refinery to run above full nameplate capacity for 2017-2018. Our CY16 estimate changes largely due to better-than-expected 3QCY16 results accounted for in our full-year estimate.
Following our forecast changes, we raise TOP’s TP to THB85 from THB76, derived from an unchanged target P/B multiple of 1.4x. The current share price values TOP at 1.3x 12M forward P/B, 0.5 STD below its five-year historical average. We therefore maintain our BUY rating on the stock.
Downside risks include unplanned shutdowns and lower-than-expected earnings contributions from TOP’s subsidiaries.
Exhibit 187: PTTEP - changes in earnings estimates
PTT PCL – Valuation not attractive, despite continued gas turnaround PTT’s gas business has performed well in 2016 to date, as cheap gas costs benefit the gas separation division and NGV liberalisation reduces the subsidy burden. In 1H16, PTT’s earnings were boosted by strong inventory gains at the oil trading, petrochemical and refining divisions while PTTEP benefited from the cost minimisation programme.
For 2017, we expect PTT’s gas business to grow, driven by the absence of scheduled GSP maintenance, leading to higher gas sales volume. PTTEP’s performance should improve as we expect oil & gas prices to recover.
We lower our earnings estimate by 13% in 2018, to take into account a slowdown in gas business, lower ethylene margins, slightly higher E&P costs and a higher tax rate.
We raise our SoTP based TP to THB336 from THB292, as we roll over our TP to end-17E (from 2016E). We also increase our target EBITDA multiples (from 5x to 5.5x) for the gas and trading divisions, to take into account their recent strong performance. The current share price implies a forward P/B of 1.2x, 1 STD below its long-term historical average, but we prefer PTTGC and PTTEP because of the greater benefit they should derive from an uptick in crude price. We maintain our HOLD rating.
Downside risks are weaker-than-expected gas margins, unplanned shutdowns, and a slower-than-expected crude price recovery. Upside risks include higher-than-expected gas sales volume and better-than-expected gas price recovery.
EV/invested capital (x) 0.9 0.9 0.8 0.8 0.8* Pre exceptional & pre-goodwill and fully diluted
Source: GS Holdings, BNP Paribas estimates
* includes convertables and preferred stock which is being treated as debt
BNP PARIBAS 2 DECEMBER 2016 120
ASIA OIL & GAS/CHEMICALS Yong Liang Por
NOTES
NOTES
\
\
\
\
\
\
\
\
\
\
BNP PARIBAS 2 DECEMBER 2016 121
ASIA OIL & GAS/CHEMICALS Yong Liang Por
NOTES
NOTES
\
\
\
\
\
\
\
\
\
\
BNP PARIBAS 2 DECEMBER 2016 122
ASIA OIL & GAS/CHEMICALS Yong Liang Por
NOTES
NOTES
\
\
\
\
\
\
\
\
\
\
BNP PARIBAS 2 DECEMBER 2016 123
ASIA OIL & GAS/CHEMICALS Yong Liang Por
Disclaimers and Disclosures
APPENDIX
DISCLAIMERS AND DISCLOSURES APPLICABLE TO NON-US BROKER-DEALER(S): BNP PARIBAS SECURITIES (ASIA) LTD, BNP PARIBAS SECURITIES INDIA PVT. LTD. (SEBI REGISTERED RESEARCH ANALYST)
ANALYST(S) CERTIFICATION
Yong Liang Por, BNP Paribas Securities (Asia) Ltd, +852 2825 1877, [email protected] Amit Shah, BNP Paribas Securities India Pvt. Ltd. (SEBI registered research analyst), +91 22 6196 4394, [email protected] The BNP Paribas Securities (Asia) Ltd, BNP Paribas Securities India Pvt. Ltd. (SEBI registered research analyst) Analysts mentioned in this disclaimer are employed by a non-US affiliate of BNP Paribas Securities Corp., and are not registered/ qualified pursuant to NYSE and/or FINRA regulations
The individual(s) identified above certify(ies) that (i) all views expressed in this report accurately reflect the personal view of the analyst(s) with regard to any and all of the subject securities, companies or issuers mentioned in this report; and (ii) no part of the compensation of the analyst(s) was, is, or will be, directly or indirectly, related to the specific recommendations or views expressed herein.
IMPORTANT DISCLOSURES REQUIRED IN THE UNITED STATES BY FINRA RULES AND OTHER JURISDICTIONS "BNP Paribas” is the marketing name for the global banking and markets business of BNP Paribas Group. No portion of this report was prepared by BNP Paribas Securities Corp (US) personnel, and it is considered Third-Party Affiliate research under NASD Rule 2711. The following disclosures relate to relationships between companies covered in this research report and the BNP entity identified on the cover of this report, BNP Securities Corp., and other entities within the BNP Paribas Group (collectively, "BNP Paribas"). The disclosure column in the following table lists the important disclosures applicable to each company that has been rated and/or recommended in this report:
BNP Paribas represents that: 1. Within the past year, it has managed or co-managed a public offering for this company, for which it received fees. 2. It had an investment banking relationship with this company in the last 12 months. 3. It received compensation for investment banking services from this company in the last 12 months. 4. It expects to receive or intends to seek compensation for investment banking services from the subject company/ies in the next 3 months. 5. It beneficially owns 1% or more of any class of common equity securities of the subject company. 6. It makes a market in securities in respect of this company. 7. The analyst(s) or an individual who assisted in the preparation of this report (or a member of his/her household) has a financial interest position in
securities issued by this company. The financial interest is in the common stock of the subject company, unless otherwise noted. 8. The analyst (or a member of his/her household) is an officer, director, employee or advisory board member of this company or has received
compensation from the company.
IMPORTANT DISCLOSURES REQUIRED IN KOREA The disclosure column in the following table lists the important disclosures applicable to each Korea listed company that has been rated and/or recommended in this report:
Company Ticker Disclosure (as applicable)
Bharat Petroleum BPCL IN 2, 3, 4
CNOOC Ltd 883 HK 6
Formosa Chem & Fibre 1326 TT 2, 3, 4
Formosa Petro 6505 TT 2, 3, 4
Formosa Plastics 1301 TT 2, 3, 4, 6
GAIL India GAIL IN 2, 3, 4
Hindustan Petro HPCL IN 2, 3, 4
Lotte Chemical 011170 KS 2, 3, 4
Nanya Plastics 1303 TT 2, 3, 4, 6
Oil & Natural Gas ONGC IN 2, 3, 4
PetroChina 857 HK 6
Petronet LNG PLNG IN 2, 3, 4
PTT PTT TB 2, 3, 4
PTT Global Chemical PTTGC TB 2, 3, 4
PTTEP PTTEP TB 2, 3, 4
Reliance Industries RIL IN 2, 3, 4
S-Oil Corp 010950 KS 2, 3, 4
Sinopec 386 HK 6
Thai Oil TOP TB 2, 3, 4
Company Ticker Price (as of 30-Nov-2016 closing price) InterestGS Holdings 078930 KS KRW54,400 N/A
LG Chem 051910 KS KRW226,500 N/ALotte Chemical 011170 KS KRW321,500 N/A
1. The performance of obligations of the Company is directly or indirectly guaranteed by BNP Paribas Securities Korea Co. Ltd (“BNPPSK”) by means of
payment guarantees, endorsements, and provision of collaterals and/or taking over the obligations. 2. BNPPSK owns 1/100 or more of the total outstanding shares issued by the Company. 3. The Company is an affiliate of BNPPSK as prescribed by Item 3, Article 2 of the Monopoly Regulation and Fair Trade Act. 4. BNPPSK is the financial advisory agent of the Company for the Merger and Acquisition transaction or of the Target Company whereby the size of the
transaction does not exceed 5/100 of the total asset of the Company or the total number of outstanding shares. 5. BNPPSK has taken financial advisory service regarding listing to the Company within the past 1 year. 6. With regards to the tender offer initiated by the Company based on Item 2, Article 133 of the Financial Investment Services and Capital Market Act,
BNPPSK acts in the capacity of the agent for the tender offer designated either by the Company or by the target company, provided that this provision shall apply only where tender offer has not expired.
7. The listed company which issued the stocks in question in case where 40 days has not passed since the new shares were listed from the date of entering into arrangement for public offering or underwriting-related agreement for issuance of stocks
8. The Company that has signed a nominated advisor contract with BNPPSK as defined in Item 2 of Article 8 of the KONEX Market Listing Regulation. 9. The Company is recognized as having considerable interests with BNPPSK in relation to No.1 to No. 8. 10. The analyst or his/her spouse owns (including delivery claims of marketable securities based on legal regulations and trading and misc. contracts) the
following securities or rights (hereinafter referred to as “Securities, etc.” in this Article) regardless of whose name is used in the trading. 1) Stocks, bond with stock certificate, and certificate of pre-emptive rights issued by the Company whose securities dealings are being solicited. 2) Stock options of the Company whose securities dealings are being solicited. 3) Individual stock future, stock option, and warrants that use the stocks specified in Item 1) as underlying.
History of change in investment rating and/or target price
SK Innovation (096770 KS)
Yong Liang Por started covering this stock from 17 Jan 2012 Price and TP are in local currency Sources: FactSet; BNP Paribas
60,000
90,000
120,000
150,000
180,000
210,000
240,000Dec-13 Jun-14 Dec-14 Jun-15 Dec-15 Jun-16
SK Innovation Target Price(KRW)
Date Rating Target price Date Rating Target price Date Rating Target price30-Nov-13 Buy 185,000.00 09-Oct-14 Hold 85,000.00 22-Jun-15 Buy 160,000.0010-Jan-14 Buy 180,000.00 25-Nov-14 Buy 120,000.00 20-Aug-15 Buy 135,000.0012-Mar-14 Buy 163,000.00 10-Dec-14 Buy 115,000.00 10-Dec-15 Buy 160,000.0008-Apr-14 Buy 150,000.00 19-Jan-15 Buy 110,000.00 07-Jan-16 Buy 180,000.0030-May-14 Hold 118,000.00 12-Mar-15 Buy 115,000.00 04-Mar-16 Buy 185,000.0008-Jul-14 Hold 115,000.00 17-Apr-15 Buy 136,000.00 08-Apr-16 Buy 220,000.0015-Aug-14 Hold 105,000.00 14-May-15 Buy 150,000.00 06-Jun-16 Buy 200,000.00
BNP PARIBAS 2 DECEMBER 2016 125
ASIA OIL & GAS/CHEMICALS Yong Liang Por
S-Oil Corp (010950 KS)
Yong Liang Por started covering this stock from 17 Jan 2012 Price and TP are in local currency Sources: FactSet; BNP Paribas
Lotte Chemical (011170 KS)
Yong Liang Por started covering this stock from 17 Jan 2012 Price and TP are in local currency Sources: FactSet; BNP Paribas
20,000
40,000
60,000
80,000
100,000
120,000Dec-13 Jun-14 Dec-14 Jun-15 Dec-15 Jun-16
S-Oil Corp Target Price(KRW)
Date Rating Target price Date Rating Target price Date Rating Target price30-Nov-13 Hold 75,000.00 19-Jan-15 Hold 49,000.00 07-Jan-16 Buy 90,000.0010-Jan-14 Hold 72,000.00 12-Mar-15 Hold 60,000.00 04-Mar-16 Buy 95,000.0012-Mar-14 Hold 60,000.00 17-Apr-15 Buy 85,000.00 08-Apr-16 Buy 108,000.0008-Apr-14 Hold 56,000.00 14-May-15 Buy 90,000.00 06-Jun-16 Buy 98,000.0030-May-14 Reduce 40,000.00 22-Jun-15 Buy 95,000.00 20-Jul-16 Buy 100,000.0015-Aug-14 Reduce 36,000.00 20-Aug-15 Buy 80,000.0025-Nov-14 Hold 50,000.00 10-Dec-15 Buy 86,000.00
100,000
150,000
200,000
250,000
300,000
350,000
400,000
450,000Dec-13 Jun-14 Dec-14 Jun-15 Dec-15 Jun-16
Lotte Chemical Target Price(KRW)
Date Rating Target price Date Rating Target price Date Rating Target price30-Nov-13 Buy 280,000.00 19-Jan-15 Buy 205,000.00 10-Dec-15 Hold 250,000.0026-Mar-14 Buy 255,000.00 12-Mar-15 Buy 235,000.00 04-Mar-16 Hold 340,000.0013-Jun-14 Buy 215,000.00 17-Apr-15 Buy 275,000.00 08-Apr-16 Hold 355,000.0008-Jul-14 Buy 210,000.00 14-May-15 Buy 320,000.00 06-Jun-16 Hold 295,000.0015-Aug-14 Buy 205,000.00 22-Jun-15 Buy 350,000.00 20-Jul-16 Hold 300,000.0009-Oct-14 Buy 200,000.00 20-Aug-15 Buy 325,000.00 12-Aug-16 Buy 380,000.0017-Nov-14 Buy 210,000.00 24-Sep-15 Buy 320,000.00 08-Nov-16 Buy 390,000.0010-Dec-14 Buy 215,000.00 15-Oct-15 Buy 315,000.00
BNP PARIBAS 2 DECEMBER 2016 126
ASIA OIL & GAS/CHEMICALS Yong Liang Por
LG Chem (051910 KS)
Yong Liang Por started covering this stock from 17 Jan 2012 Price and TP are in local currency Sources: FactSet; BNP Paribas
GS Holdings (078930 KS)
Yong Liang Por started covering this stock from 17 Jan 2012 Price and TP are in local currency Sources: FactSet; BNP Paribas
120,000
160,000
200,000
240,000
280,000
320,000
360,000
400,000Dec-13 Jun-14 Dec-14 Jun-15 Dec-15 Jun-16
LG Chem Target Price(KRW)
Date Rating Target price Date Rating Target price Date Rating Target price30-Nov-13 Buy 350,000.00 19-Jan-15 Buy 250,000.00 10-Dec-15 Buy 350,000.0026-Mar-14 Buy 330,000.00 12-Mar-15 Buy 270,000.00 08-Apr-16 Buy 360,000.0013-Jun-14 Buy 300,000.00 17-Apr-15 Buy 300,000.00 06-Jun-16 Buy 320,000.0008-Jul-14 Hold 295,000.00 14-May-15 Buy 315,000.00 12-Aug-16 Buy 330,000.0009-Oct-14 Hold 258,000.00 22-Jun-15 Buy 330,000.00 07-Sep-16 Hold 270,000.0017-Nov-14 Buy 255,000.00 20-Aug-15 Buy 310,000.00 08-Nov-16 Hold 265,000.0010-Dec-14 Buy 260,000.00 24-Sep-15 Buy 305,000.00
28,000
35,000
42,000
49,000
56,000
63,000
70,000
77,000
84,000Dec-13 Jun-14 Dec-14 Jun-15 Dec-15 Jun-16
GS Holdings Target Price(KRW)
Date Rating Target price Date Rating Target price Date Rating Target price30-Nov-13 Hold 58,000.00 25-Nov-14 Hold 47,000.00 20-Aug-15 Buy 60,000.0012-Mar-14 Hold 48,000.00 10-Dec-14 Buy 50,000.00 24-Sep-15 Buy 65,000.0008-Apr-14 Hold 45,000.00 19-Jan-15 Buy 49,000.00 10-Dec-15 Buy 68,000.0013-Jun-14 Hold 42,000.00 12-Mar-15 Buy 50,000.00 07-Jan-16 Buy 71,000.0007-Jul-14 Hold 41,000.00 17-Apr-15 Buy 54,000.00 08-Apr-16 Buy 72,000.0015-Aug-14 Reduce 36,000.00 14-May-15 Buy 65,000.00 06-Jun-16 Hold 53,000.0009-Oct-14 Reduce 35,000.00 22-Jun-15 Buy 68,000.00
BNP PARIBAS 2 DECEMBER 2016 127
ASIA OIL & GAS/CHEMICALS Yong Liang Por
Company Ticker Price Rating Valuation & Risks
Bharat Petroleum BPCL IN INR 643.95 Hold Our TP is based on SoTP. Downside risks: Slowdown in demand for petroleum products, subsidy sharing in the event the crude oil price increases further, and continued weakness in refining margins. Upside risks: Higher than expected refining margins and continued strong demand for petroleum products
CNOOC Ltd 883 HK HKD 9.78 Buy Our target price is based on DCF that assumes a WACC of 9% (risk free rate of 4% and beta of 1.1x) and g of zero. The key downside risk comes from lower-than-expected oil prices
Formosa Chem & Fibre 1326 TT TWD 99.90 Buy Our TP is based on SoTP. Key downside risk from weaker-than-expected chemical demand and plant mechanical failure.
Formosa Petro 6505 TT TWD 107.50 Hold Our TP is based on an EV/CE of 2.92x, derived from a ROCE of 20.6%. We see the key risk being better or worse than expected chemical demand and plant mechanical failure.
Formosa Plastics 1301 TT TWD 90.80 Hold Our TP is based on SoTP. We see the key risk being better or worse than expected chemical demand and plant mechanical failure
GAIL India GAIL IN INR 424.75 Buy SoTP based. Risks: Lower transmission volumes on weaker gas demand, sharp uptick in crude prices which will increase gas cost.
GS Holdings 078930 KS KRW 54,400 Hold Target price is based on SoTP. We see the key risk being better or worse than expected chemical demand and plant mechanical failure.
Hindustan Petro HPCL IN INR 471.20 Buy SoTP-based. Downside risks: Sharp decline in crude prices, and a drop in refining margins LG Chem 051910 KS KRW 226,500 Hold Our TP is based on a EV/CE of 1.25x, derived from a ROCE of 10.5%. We see the key
upside/downside risks being stronger/weaker-than-expected chemical and EV battery demand. Lotte Chemical 011170 KS KRW 321,500 Buy Target price based from 1.4x EV/CE. We see the key downside risk coming from weaker-than-
expected chemical demand and plant mechanical failure. Nanya Plastics 1303 TT TWD 67.10 Buy Our TP is based on SoTP. We see the key downside risk from weaker-than-expected chemical
demand and plant mechanical failure. Oil & Natural Gas ONGC IN INR 288.90 Hold SoTP; Upside risks: Sharp increase in oil price and higher than expected production. Downside
risks: Higher subsidy sharing and lower production meant for sale. PetroChina 857 HK HKD 5.27 Hold Our target price is based on sum-of-the-parts. The key upside/downside risks come from higher-
/lower-than-expected oil prices. PetroChina-A 601857 CH RMB 7.62 Reduce Our target price is based on sum-of-the-parts. The key upside risk comes from higher-than-
expected oil prices. Petronas Chemicals PCHEM MK MYR 6.83 Hold Our TP is based on a target EV/CE of 1.64x, derived from a ROCE of 13.4% and WACC of 8%
(unchanged). We maintain our HOLD rating and see the key upside/downside risk to our TP coming from volatile oil prices
Petronet LNG PLNG IN INR 388.70 Buy Our TP is based on DCF. Risks: Uptick in LNG prices resulting in lower utilisation and continued delays at Kochi
PTT PTT TB THB 349.00 Hold SOTP-based TP. Downside risks are weaker-than-expected gas margins, unplanned shutdowns, and a slower-than-expected crude price recovery. Upside risks include higher-than-expected gas sales volume and better-than-expected gas price recovery.
PTT Global Chemical PTTGC TB THB 62.50 Buy Our TP is based on a target multiple of 1.3x 2017E P/B. Downside risks to our TP include unplanned shutdowns, higher-than-expected gas feed costs, softening petrochemical demand, and a potential FID announcement for construction of the US ethane cracker.
PTTEP PTTEP TB THB 82.50 Buy DCF-based TP. We believe M&A or new asset addition plans could be positive catalysts. Downside risks include impairment of existing assets, a slower-than-expected gas price recovery, and failure of the cost reduction programme.
Reliance Industries RIL IN INR 990.05 Buy Risks to our SoTP-based TP: weaker than expected GRMs, delay in the commissioning of the ROGC and petcoke gasifier projects, and further delay in monetising the telecom business.
S-Oil Corp 010950 KS KRW 84,000 Buy Target price is based on an EV/CE of 1.43x derived from a ROCE of 11.8% and WACC of 8%. We key Downside risks are a fall in oil prices and plant mechanical failure.
Sinopec 386 HK HKD 5.42 Buy Our TP is based on SOTP. Downside risks from weaker-than-expected oil prices. Sinopec-A 600028 CH RMB 5.12 Buy Our TP is based on SOTP. Downside risks from weaker-than-expected oil prices. SK Innovation 096770 KS KRW 152,500 Buy Target price based on SoTP. We see downside risks to our positive view from a fall in oil prices
and plant mechanical failure. Thai Oil TOP TB THB 74.00 Buy PB-based TP. Downside risks include unplanned shutdowns and lower-than-expected earnings
contributions from TOP’s subsidiaries.. Oil India OINL IN INR 419.35 Hold Our TP is based on SOTP. Downside risks: Higher than expect under-recoveries and write off at
Mozambique. Upside risks: Lower than expected cess rate and material increase in oil/gas production.
Sources: Factset; BNP Paribas
BNP PARIBAS 2 DECEMBER 2016 128
ASIA OIL & GAS/CHEMICALS Yong Liang Por
GENERAL DISCLAIMER
This report was produced by BNP Paribas Securities (Asia) Ltd, BNP Paribas Securities India Pvt. Ltd. (SEBI registered research analyst), member company(ies) of the BNP Paribas Group.
This report is for the use of intended recipients only and may not be reproduced (in whole or in part) or delivered or transmitted to any other person without our prior written consent. By accepting this report, the recipient agrees to be bound by the terms and limitations set forth herein. This report does not constitute a personal recommendation or take into account the particular investment objectives, financial situations, or needs of individual clients. Customers are advised to use the information contained herein as just one of many inputs and considerations prior to engaging in any trading activity. This report does not constitute a prospectus or other offering document or an offer or solicitation to buy or sell any securities or other investments. This report is not intended to provide the sole basis of any evaluation of the subject securities and companies mentioned in this report. Information and opinions contained in this report are published for reference of the recipients and are not to be relied upon as authoritative or without the recipient’s own independent verification, or taken in substitution for the exercise of judgment by the recipient. Additionally, the products mentioned in this report may not be available for sale in certain jurisdictions. As an investment bank with a wide range of activities, BNP Paribas may face conflicts of interest, which are resolved under applicable legal provisions and internal guidelines. You should be aware, however, that BNP Paribas may engage in transactions in a manner inconsistent with the views expressed in this document, either for its own account or for the account of its clients. Australia: This report is being distributed in Australia by BNP Paribas Sydney Branch, registered in Australia as ABN 23 000 000 117 at 60 Castlereagh Street Sydney NSW 2000. BNP Paribas Sydney Branch is licensed under the Banking Act 1959 and the holder of Australian Financial Services Licence no. 238043 and therefore subject to regulation by the Australian Securities & Investments Commission in relation to delivery of financial services. By accepting this document you agree to be bound by the foregoing limitations, and acknowledge that information and opinions in this document relate to financial products or financial services which are delivered solely to wholesale clients (in terms of the Corporations Act 2001, sections 761G and 761GA; Corporations Regulations 2001, division 2, reg. 7.1.18 & 7.1.19) and/or professional investors (as defined in section 9 of the Corporations Act 2001). Canada: The information contained herein is not, and under no circumstances is to be construed as, a prospectus, an advertisement, a public offering, an offer to sell securities described herein, or solicitation of an offer to buy securities described herein, in Canada or any province or territory thereof. Any offer or sale of the securities described herein in Canada will be made only under an exemption from the requirements to file a prospectus with the relevant Canadian securities regulators and only by a dealer properly registered under applicable securities laws or, alternatively, pursuant to an exemption from the dealer registration requirement in the relevant province or territory of Canada in which such offer or sale is made. The information contained herein is under no circumstances to be construed as investment advice in any province or territory of Canada and is not tailored to the needs of the recipient. To the extent that the information contained herein references securities of an issuer incorporated, formed or created under the laws of Canada or a province or territory of Canada, any trades in such securities must be conducted through a dealer registered in Canada. No securities commission or similar regulatory authority in Canada has reviewed or in any way passed judgment upon these materials, the information contained herein or the merits of the securities described herein, and any representation to the contrary is an offence. Hong Kong: This report is prepared for professional investors and is being distributed in Hong Kong by BNP Paribas Securities (Asia) Limited to persons whose business involves the acquisition, disposal or holding of securities, whether as principal or agent. BNP Paribas Securities (Asia) Limited, a subsidiary of BNP Paribas, is regulated by the Securities and Futures Commission for the conduct of dealing in securities, advising on securities, dealing in futures contracts and advising on corporate finance. For professional investors in Hong Kong, please contact BNP Paribas Securities (Asia) Limited (address: 63/F Two International Finance Centre, 8 Finance Street, Central, Hong Kong; tel:2909 8888; fax: 2845 2232) for all matters and queries relating to this report. India: In India, this document is being distributed by BNP Paribas Securities India Pvt. Ltd. ("BNPPSIPL"), having its registered office at 5th floor, BNP Paribas House, 1 North Avenue, Maker Maxity, Bandra Kurla Complex, Bandra (East), Mumbai 400 051, INDIA (Tel. no. +91 22 3370 4000 / 6196 4000, Fax no. +91 22 6196 4363). BNPPSIPL is registered with the Securities and Exchange Board of India (“SEBI”) as a research analyst (Regn. No. INH000000792) and as a stockbroker in the Equities and the Futures & Options segments of National Stock Exchange of India Ltd. (“NSE”) and BSE Ltd. and in the Currency Derivatives segment of NSE (SEBI Regn. Nos.: INB/INF/NSF/NSE231474835, INB/INF011474831; CIN: U74920MH2008FTC182807; Website: www.bnpparibas.co.in). No material disciplinary action has been taken against BNPPSIPL by any regulatory or government authority. BNPPSIPL or its associates may have received compensation or other benefits for brokerage services or for other products or services, from the company(ies) that have been rated and/or recommended in the report and / or from third parties. Indonesia: This report is being distributed to Indonesia based clients by the publishing entity shown on the front page of this report. Neither this report nor any copy hereof may be distributed in Indonesia or to any Indonesian citizens except in compliance with applicable Indonesian capital market laws and regulations. This report is not an offer of securities in Indonesia and may not be distributed within the territory of the Republic of Indonesia or to Indonesian citizens in circumstance which constitutes an offering within the meaning of Indonesian capital market laws and regulations. Japan: This report is being distributed to Japanese based firms by BNP Paribas Securities (Japan) Limited or by a subsidiary or affiliate of BNP Paribas not registered as a financial instruments firm in Japan, to certain financial institutions defined by article 17-3, item 1 of the Financial Instruments and Exchange Law Enforcement Order. BNP Paribas Securities (Japan) Limited is a financial instruments firm registered according to the Financial Instruments and Exchange Law of Japan and a member of the Japan Securities Dealers Association, the Financial Futures Association of Japan and the Type II Financial Instruments Firms Association. BNP Paribas Securities (Japan) Limited accepts responsibility for the content of a report prepared by another non-Japan affiliate only when distributed to Japanese based firms by BNP Paribas Securities (Japan) Limited. Some of the foreign securities stated on this report are not disclosed according to the Financial Instruments and Exchange Law of Japan. Malaysia: This report is issued and distributed by BNP Paribas Capital (Malaysia) Sdn Bhd. The views and opinions in this research report are our own as of the date hereof and are subject to change. BNP Paribas Capital (Malaysia) Sdn Bhd has no obligation to update its opinion or the information in this research report. This publication is strictly confidential and is for private circulation only to clients of BNP Paribas Capital (Malaysia) Sdn Bhd. This publication is being provided to you strictly on the basis that it will remain confidential. No part of this material may be (i) copied, photocopied, duplicated, stored or reproduced in any form by any means or (ii) redistributed or passed on, directly or indirectly, to any other person in whole or in part, for any purpose without the prior written consent of BNP Paribas Capital (Malaysia) Sdn Bhd. Philippines: This report is being distributed in the Philippines by BNP Paribas Manila Branch, an Offshore Banking Unit (OBU) of BNP Paribas whose head office is in Paris, France. BNP Paribas Manila OBU is registered as an offshore banking unit under Presidential Decree No. 1034 (PD 1034), and regulated by the Bangko Sentral ng Pilipinas. This report is being distributed in the Philippines to qualified clients of OBUs as allowed under PD 1034, and is qualified in its entirety to the products and services allowed under PD 1034. Singapore: This report is distributed in Singapore by BNP Paribas Securities (Singapore) Pte Ltd ("BNPPSSL") and may be distributed in Singapore only to an Accredited or Institutional Investor, each as defined under the Financial Advisers Regulations ("FAR") and the Securities and Futures Act (Chapter 289) of Singapore, as amended from time to time. In relation to the distribution to such categories of investors, BNPPSSL and its representatives are exempted under Regulation 35 of the FAR from the requirements in Section 36 of the Financial Advisers Act of Singapore, regarding the disclosure of certain interests in, or certain interests in the acquisition or disposal of, securities referred to in this report. For Institutional and Accredited Investors in Singapore, please contact BNP Paribas Securities (Singapore) Ptd Ltd (company registration number: 199801966C; address: 10 Collyer Quay, 34/F Ocean Financial Centre, Singapore 049315; tel: (65) 6210 1288; fax: (65) 6210 1980) for all matters and queries relating to this report. South Africa: In South Africa, BNP Paribas Securities South Africa (Pty) Ltd is a licensed member of the Johannesburg Stock Exchange and an authorised Financial Services Providers and subject to regulation by the Financial Services Board. BNP Paribas Securities South Africa (Pty) Ltd does not expressly or by implication represent, recommend or propose that the financial products referred to in this report are appropriate to the particular investment objectives, financial situation or particular needs of the recipient. This document does not constitute advice as contemplated in the Financial Advisory and Intermediary Services Act, 2002. South Korea: BNP Paribas Securities Korea is registered as a Licensed Financial Investment Business Entity under the FINANCIAL INVESTMENT SERVICES AND CAPITAL MARKETS ACT and regulated by the Financial Supervisory Service and Financial Services Commission. This document does not constitute an offer to sell to or the solicitation of an offer to buy from any person any financial products where it is unlawful to make the offer or solicitation in South Korea.
BNP PARIBAS 2 DECEMBER 2016 129
ASIA OIL & GAS/CHEMICALS Yong Liang Por
Switzerland: This report is intended solely for customers who are “Qualified Investors” as defined in article 10 paragraphs 3 and 4 of the Swiss Federal Act on Collective Investment Schemes of 23 June 2006 (CISA) and the relevant provisions of the Swiss Federal Ordinance on Collective Investment Schemes of 22 November 2006 (CISO). “Qualified Investors” includes, among others, regulated financial intermediaries such as banks, securities dealers, fund management companies and asset managers of collective investment schemes, regulated insurance companies as well as pension funds and companies with professional treasury operations. This document may not be suitable for customers who are not Qualified Investors and should only be used and passed on to Qualified Investors. For specification purposes, a “Swiss Corporate Customer” is a Client which is a corporate entity, incorporated and existing under the laws of Switzerland and which qualifies as “Qualified Investor” as defined above." BNP Paribas (Suisse) SA is authorised as bank and as securities dealer by the Swiss Federal Market Supervisory Authority FINMA. BNP Paribas (Suisse) SA is registered at the Geneva commercial register under No. CH-270-3000542-1. BNP Paribas (Suisse) SA is incorporated in Switzerland with limited liability. Registered Office: 2 place de Hollande, CH-1204 Geneva. Taiwan: This report is being distributed to Taiwan based clients by BNP Paribas Securities (Taiwan) Co., Ltd or by a subsidiary or affiliate of BNP Paribas. Such information is for your reference only. The reader should independently evaluate the investment risks and is solely responsible for their investment decision. Information on securities that do not trade in Taiwan is for informational purposes only and is not to be construed as a recommendation or a solicitation to trade in such securities. BNP Paribas Securities (Taiwan) Co., Ltd. may not execute transactions for clients in these securities. This publication may not be distributed to the public media or quoted or used by the public media without the express written consent of BNP Paribas.
Thailand: Research relating to Thailand and Thailand based issuers is produced pursuant to an arrangement between BNP PARIBAS (“BNPP”) and Finansia Syrus Securities Public Company Limited (“FSS”). FSS International Investment Advisory Securities Co Ltd (“FSSIA”) prepares and distributes research under the brand name “BNP PARIBAS/FSS”. BNPP is not an affiliate of FSSIA or FSS. FSS also publishes a different research product under the brand name “FINANSIA SYRUS,” which is prepared by research analysts who are not part of FSSIA and who may cover the same securities, issuers, or industries that are the subject of this report. The ratings, recommendations, and views expressed in this report may differ from the ratings, recommendations, and views expressed by other research analysts or research teams employed by FSS. This report is being distributed outside Thailand by members of BNP Paribas. Turkey: This report is being distributed in Turkey by TEB Investment (TEB YATIRIM MENKUL DEGERLER A.S., Teb Kampus D Blok Saray Mah. Kucuksu Cad. Sokullu Sok., No:7 34768 Umraniye, Istanbul, Turkey, Trade register number: 358354, www.tebyatirim.com.tr) and outside Turkey jointly by TEB Investment and BNP Paribas. Information, comments and suggestions on investment given in this material are not within the scope of investment consulting. The investment consulting services are rendered tailor made for individuals by competent authorities considering the individuals’ risk and return preferences. However the comments and recommendations herein are based on general principles. These opinions may not be consistent with your financial status as well as your risk and return preferences. Therefore, making an investment decision only based on the information provided herein may not bear consequences in parallel with your expectations. This material issued by TEB Yatırım Menkul Değerler A.Ş. for information purposes only and may be changed without any prior notification. All rights reserved. No part of this material may be copied or reproduced in any manner without the written consent of TEB Yatırım Menkul Değerler A.Ş. Although TEB Yatırım Menkul Değerler A.Ş. gathers the presented material that is current as possible, it does not undertake that all the information is accurate or complete, nor should it be relied upon as such. TEB Yatırım Menkul Değerler A.Ş. assumes no responsibility whatsoever in respect of or arising out or in connection with the content of this material to third parties. If any third party chooses to use the content of this material as reference, he/she accepts and approves to do so entirely at his/her own risk.
United States: This report may be distributed in the United States only to U.S. Persons who are “major U.S. institutional investors” (as such term is defined in Rule 15a-6 under the Securities Exchange Act of 1934, as amended) and is not intended for the use of any person or entity that is not a “major U.S. institutional investor”. U.S persons who wish to effect transactions in securities discussed herein must do so through BNP Paribas Securities Corp., a US-registered broker dealer and member of FINRA, SIPC, NFA, NYSE and other principal exchanges. Certain countries within the European Economic Area: This document may only be distributed in the United Kingdom to eligible counterparties and professional clients and is not intended for, and should not be circulated to, retail clients (as such terms are defined in the Markets in Financial Instruments Directive 2004/39/EC (“MiFID”)). This document will have been approved for publication and distribution in the United Kingdom by BNP Paribas London Branch, a branch of BNP Paribas SA whose head office is in Paris, France. BNP Paribas SA is incorporated in France with limited liability with its registered office at 16 boulevard des Italiens, 75009 Paris. BNP Paribas London Branch (registered office: 10 Harewood Avenue, London NW1 6AA; tel: [44 20] 7595 2000; fax: [44 20] 7595 2555) is lead supervised by the European Central Bank (ECB) and the Autorité de Contrôle Prudentiel et de Résolution (ACPR). BNP Paribas London Branch is authorised by the ACPR and the Prudential Regulation Authority (PRA) and subject to limited regulation by the Financial Conduct Authority and PRA. Details about the extent of our authorisation and regulation by the PRA, and regulation by the Financial Conduct Authority are available from us on request. This report has been approved for publication in France by BNP Paribas, a credit institution licensed as an investment services provider by the ACPR whose head office is 16, Boulevard des Italiens 75009 Paris, France. This report is being distributed in Germany either by BNP Paribas London Branch or by BNP Paribas Niederlassung Frankfurt am Main, regulated by the Bundesanstalt für Finanzdienstleistungsaufsicht (BaFin). Other Jurisdictions: The distribution of this report in other jurisdictions or to residents of other jurisdictions may also be restricted by law, and persons into whose possession this report comes should inform themselves about, and observe, any such restrictions. By accepting this report you agree to be bound by the foregoing instructions. This report is not directed to, or intended for distribution to or use by, any person or entity that is a citizen or resident of or located in any locality, state, country, or other jurisdiction where such distribution, publication, availability or use would be contrary to law or regulation. All research reports are disseminated and available to all clients simultaneously through our internal client websites. For all research available on a particular stock, please contact the relevant BNP Paribas research team or the author(s) of this report.
Additional Disclosures Target price history, stock price charts, valuation and risk details, and equity rating histories applicable to each company rated in this report is available in our most recently published reports available on our website: http://eqresearch.bnpparibas.com, or you can contact the analyst named on the front of this note or your BNP Paribas representative. All share prices are as at market close on 30 November 2016 unless otherwise stated.
BNP PARIBAS 2 DECEMBER 2016 130
ASIA OIL & GAS/CHEMICALS Yong Liang Por
RECOMMENDATION STRUCTURE
Stock Ratings Stock ratings are based on absolute upside or downside, which we define as (target price* - current price) / current price. BUY (B). The upside is 10% or more. HOLD (H). The upside or downside is less than 10%. REDUCE (R). The downside is 10% or more. Unless otherwise specified, these recommendations are set with a 12-month horizon. Thus, it is possible that future price volatility may cause a temporary mismatch between upside/downside for a stock based on market price and the formal recommendation. * In most cases, the target price will equal the analyst's assessment of the current fair value of the stock. However, if the analyst doesn't think the market will reassess the stock over the specified time horizon due to a lack of events or catalysts, then the target price may differ from fair value. In most cases, therefore, our recommendation is an assessment of the mismatch between current market price and our assessment of current fair value. Industry Recommendations Improving (): The analyst expects the fundamental conditions of the sector to be positive over the next 12 months. Stable (previously known as Neutral) (): The analyst expects the fundamental conditions of the sector to be maintained over the next 12 months. Deteriorating (): The analyst expects the fundamental conditions of the sector to be negative over the next 12 months. Country (Strategy) Recommendations Overweight (O). Over the next 12 months, the analyst expects the market to score positively on two or more of the criteria used to determine market recommendations: index returns relative to the regional benchmark, index sharpe ratio relative to the regional benchmark and index returns relative to the market cost of equity. Neutral (N). Over the next 12 months, the analyst expects the market to score positively on one of the criteria used to determine market recommendations: index returns relative to the regional benchmark, index sharpe ratio relative to the regional benchmark and index returns relative to the market cost of equity. Underweight (U). Over the next 12 months, the analyst does not expect the market to score positively on any of the criteria used to determine market recommendations: index returns relative to the regional benchmark, index sharpe ratio relative to the regional benchmark and index returns relative to the market cost of equity.
Total BNP Paribas coverage universe 460 Investment Banking Relationship (%)
Buy 268 (58.3%) Buy 35.82
Hold 133 (28.9%) Hold 39.10
Reduce 59 (12.8%) Reduce 27.12
BNP PARIBAS 2 DECEMBER 2016 131
.
.
HONG KONG BNP Paribas Securities (Asia) Ltd 63/F, Two International Finance Centre 8 Finance Street, Central Hong Kong SAR China Tel (852) 2825 1888 Fax (852) 2845 9411
SHANGHAI
KUALA LUMPUR
Malaysia
NEW YORK BNP Paribas The Equitable Tower 787 Seventh Avenue New York NY 10019, USA Tel (1 212) 841 3800 Fax (1 212) 841 3810
MANAMA BNP Paribas Bahrain PO Box 5253 Manama Bahrain Tel (973) 53 3978 Fax (973) 53 1237
TOKYO BNP Paribas Securities (Japan) Ltd GranTokyo North Tower 1-9-1 Marunouchi, Chiyoda-Ku Tokyo 100-6740 Japan Tel (81 3) 6377 2000 Fax (81 3) 5218 5970
MUMBAI
BNP Paribas Equities (Asia) Ltd Shanghai Representative Office Room 2630, 26/F Shanghai World Financial Center 100 Century Avenue Shanghai 200120, China Tel (86 21) 6096 9000 Fax (86 21) 6096 9018
JAKARTA PT BNP Paribas Securities Indonesia Grand Indonesia, Menara BCA, JI. M.H. Thamrin No. 1Jakarta 10 0 Indonesia Tel (62 21) 2358 6586 Fax (62 21) 2358 7587
35/F
31
TAIPEI BNP Paribas Securities (Taiwan) Co Ltd 72 F, Taipei 101 No. 7 Xin Yi Road, Sec. 5 Taipei, Taiwan
(886 2) 8729 7000 Fax (886 2) 8101 2168
Tel
/Vista Tower, Level 48CThe Intermark, 182 Jalan Tun Razak50400 Kuala Lumpur
Tel (60 3) 2179 6222Fax (60 3) 2179 6226
BNP Paribas Capital (Malaysia) Sdn Bhd BNP Paribas Securities India Pvt Ltd BNP Paribas House1 North Avenue, Maker MaxityBandra Kurla ComplexBandra EastMumbai 400 051Tel (91 22) 3370 4000Fax (91 22) 3370 4386
https://eqresearch.bnpparibas.com
TEB Investment (A JV between TEB Bank and BNP Paribas) TEB Kampus D7 Saray Mahallesi Sokullu Sok No 7 Umraniye 34768 Istanbul Turkey Tel: (90 216) 636 44 44 Fax: (90 216) 631 44 00
ISTANBUL CAPE TOWN Ground floor, Fernwood House The Oval, 1 Oakdale Road, Newlands Cape Town South Africa 7700 Tel (27 21) 657 8300 Fax (27 21) 657 8301
BEIJING BNP Paribas (China) Ltd Beijing Branch Room 2001, 20/F China World Tower 1 Jianguomenwai Avenue Beijing, China Tel: +86-10-6535 0888 Fax: +86-10-6535 0883
BANGKOK(In cooperation with BNP Paribas) FSS International Investment Advisory Securities Co., Ltd 990 Abdulrahim Place, 12/F, Room 1210 Rama IV Road, Bangrak Bangkok 10500 Thailand Tel (66 2) 611 3500 Fax (66 2) 611 3551
SEOULBNP Paribas Securities Korea Co Ltd 25/F, State Tower Namsan 100 Toegye-Ro Jung-Gu, Seoul 100-052 Tel (82 2) 2125 0500 Fax (82 2) 2125 0593