110
Equity, Excellence and Inclusiveness in Education POLICY LESSONS FROM AROUND THE WORLD By Andreas Schleicher Background report for the 2014 International Summit on the Teaching Profession

Equity, Excellence and Inclusiveness in Education PolIcy lEssons from Around thE World
By Andreas schleicher
Background report for the 2014 International Summit on the Teaching Profession

Equity, Excellence and Inclusiveness
in Education
Policy lessons from Around the World
note by turkey: the information in this document with reference to “cyprus” relates to the southern part of the island. there is no single authority representing both turkish and Greek cypriot people on the island. turkey recognises the turkish republic of northern cyprus (trnc). until a lasting and equitable solution is found within the context of the united nations, turkey shall preserve its position concerning the “cyprus issue”.
note by all the european union member states of the oecd and the european union: the republic of cyprus is recognised by all members of the united nations with the exception of turkey. the information in this document relates to the area under the effective control of the Government of the republic of cyprus.
the statistical data for israel are supplied by and under the responsibility of the relevant israeli authorities. the use of such data by the oecd is without prejudice to the status of the Golan heights, east Jerusalem and israeli settlements in the West Bank under the terms of international law.
Photo credits:
© AsiaPix / inmagine
© Jose luis Pelaez, inc./Blend images/corbis
© oecd 2014
you can copy, download or print oecd content for your own use, and you can include excerpts from oecd publications, databases
and multimedia products in your own documents, presentations, blogs, websites and teaching materials, provided that suitable
acknowledgement of oecd as source and copyright owner is given. All requests for public or commercial use and translation rights
should be submitted to [email protected]. requests for permission to photocopy portions of this material for public or commercial use
shall be addressed directly to the copyright clearance center (ccc) at [email protected] or the centre français d’exploitation du droit
de copie (cfc) at [email protected].
this work is published on the responsibility of the secretary-General of the oecd. the opinions
expressed and arguments employed herein do not necessarily reflect the official views of
the organisation or of the governments of its member countries.
this document and any map included herein are without prejudice to the status of or
sovereignty over any territory, to the delimitation of international frontiers and boundaries
and to the name of any territory, city or area.

3
Foreword
Equity, ExcEllEncE and inclusivEnEss in Education: Policy lEssons from around thE World © OECD 2014
T n koutou katoa – greetings!
It is my great privilege, as New Zealand’s Minister of Education, to write a foreword to this report.
As education leaders, we want our young people to succeed. The challenge we face is how to ensure our education systems give every child the quality learning experiences they need to develop and realise their individual potential, and to do so in ways that value who they are, their language, identity, and culture.
How do we harness diversity, create fairness, and ensure our learning environments engage and achieve the best outcomes for all individuals, not just a few? This report tackles those issues squarely.
Teachers, with their training and expertise, with all their experience and insight, with their care and commitment are critical to the learning journey of every child.
The OECD PISA 2012 study shows that high-quality teaching and leadership, effective student evaluation, the professional development of education leaders and the retention of great teachers, are all crucial to raising educational achievement. These attributes are even more important to raising achievement for the most disadvantaged students.
This report shows how some countries are raising the quality of teaching and the status of the profession through keeping, attracting, growing talented teachers and school leaders. It also shows how some are strengthening equity in their education systems in order to raise achievement levels. I wish to thank all those who have put it together, and commend its content to you all.
The report precedes the fourth International Summit on the Teaching Profession to be held in Wellington, New Zealand. The Summit’s theme is Excellence, equity and inclusiveness – high quality teaching for all.
While in New Zealand, I hope you can look at those aspects of our education system that interest you. We are proud of much of our education system. But we know we also have much to learn. We look forward to sharing our experiences and insights with you, and to you sharing yours with us.
Heoi an r .
Hon Hekia ParataMinister of EducationNew Zealand


5
Acknowledgements
Equity, ExcEllEncE and inclusivEnEss in Education: Policy lEssons from around thE World © OECD 2014
This report was prepared by Andreas Schleicher, in consultation with the Summit co-sponsors – the New Zealand Ministry of Education and Education International. It is mainly based on data and comparative analysis from several OECD publications: PISA 2012 Results (Francesco Avvisati, Francesca Borgonovi, Miyako Ikeda, Guillermo Montt, Sophie Vayssettes and Pablo Zoido, authors; Simone Bloem and Giannina Rech, statistical support); Equity and Quality in Education: Supporting Disadvantaged Students and Schools (Francisco Benavides, Pauline Musset, Anna Pons Vilaseca and Beatriz Pont, authors); and Teachers Matter: Attracting, Developing and Retaining Effective Teachers (Phillip McKenzie and Paulo Santiago, authors). Marilyn Achiron edited the text, and Celia Braga-Schich and Elizabeth Del Bourgo co-ordinated production of the report, with the assistance of Meredith Lunsford.

7Equity, ExcEllEncE and inclusivEnEss in Education: Policy lEssons from around thE World © OECD 2014
Table of Contents
Chapter 1 Charting a way towards equity and exCellenCe .................................................................................................11
• The 2014 International Summit on the Teaching Profession ..............................................................................................................12
• Defining equity, excellence and inclusiveness ...........................................................................................................................................15
Excellence .......................................................................................................................................................................................................................16
Equity .................................................................................................................................................................................................................................17
Inclusion ..........................................................................................................................................................................................................................19
• The benefits of investing in equity .......................................................................................................................................................................19
Chapter 2 developing high-quality teaChers for the sChools with the greatest need ............................21
• What the results from PISA 2012 show ............................................................................................................................................................22
Financial resources ...................................................................................................................................................................................................22 Teachers............................................................................................................................................................................................................................24
• Pointers for policy and practice.............................................................................................................................................................................27 Provide adequate resources to address disadvantage .......................................................................................................................27 Create a teaching force that reflects student demography and secure high-quality teaching
in disadvantaged schools ......................................................................................................................................................................................30 Prepare teachers for work in disadvantaged schools .........................................................................................................................30 Provide mentoring to teachers in disadvantaged schools ...............................................................................................................30 Improve working conditions in disadvantaged schools ...................................................................................................................32 Provide career and financial incentives to attract and retain teachers in disadvantaged schools .......................32 Establish effective employment conditions ..............................................................................................................................................36 Make teaching an attractive career ................................................................................................................................................................38 Provide professional development activities that address student diversity .......................................................................40 Educate the teacher educators ..........................................................................................................................................................................42
Chapter 3 aChieving equity in inCreasingly devolved eduCation systems ........................................................47 • What the results from PISA 2012 show ............................................................................................................................................................48
School autonomy .......................................................................................................................................................................................................48 School choice and competition .......................................................................................................................................................................53 Public and private schools ...................................................................................................................................................................................58
Early education ............................................................................................................................................................................................................61
• Pointers for policy and practice.............................................................................................................................................................................61 Avoid socio-economic segregation ................................................................................................................................................................61 Inform all parents of the choices available to them ............................................................................................................................64 Foster collaboration among all schools ......................................................................................................................................................65 Use student and school assessments to support improvements in equity ...........................................................................67 Invest in early childhood education ..............................................................................................................................................................69
Chapter 4 Creating learning environments that address the needs of all Children ...........................75
• What the results from PISA 2012 show ............................................................................................................................................................76
Vertical stratification ................................................................................................................................................................................................76 Horizontal stratification .........................................................................................................................................................................................79
• Pointers for policy and practice.............................................................................................................................................................................79 Reduce grade repetition ........................................................................................................................................................................................80 Reduce early tracking .............................................................................................................................................................................................82 Improve disadvantaged schools .......................................................................................................................................................................85
Strengthen and support school leadership ................................................................................................................................................85
8 © OECD 2014 Equity, ExcEllEncE and inclusivEnEss in Education: Policy lEssons from around thE World
Table of Contents
Provide systemic support for restructuring schools .............................................................................................................................86 Create a supportive school climate ...............................................................................................................................................................88 Use data to identify at-risk students – and intervene early ............................................................................................................88 Provide a continuum of support for struggling students ..................................................................................................................89 Explore different ways of organising school learning time ............................................................................................................90 Hold high expectations for all students and use effective teaching practices...................................................................91 Create effective links among the school, parents and the community ..................................................................................92
Chapter 5 Building an equitaBle, exCellent and inClusive eduCation system............................................. 101
• Attract, nurture and retain qualified teachers ........................................................................................................................................... 102
• Allocate resources equitably ................................................................................................................................................................................ 102
• Make pre-primary education accessible to all ......................................................................................................................................... 103
• Encourage autonomy in the context of accountability ....................................................................................................................... 103
• Avoid segregation and stratification ................................................................................................................................................................ 103
• Use assessments and evaluations to identify struggling students and schools ................................................................... 104
Table of Contents
9Equity, ExcEllEncE and inclusivEnEss in Education: Policy lEssons from around thE World © OECD 2014
BoxesBox 1.1 OECD Programme for International Student Assessment .......................................................................................................................................... 12
Box 2.1 Weighted student funding schemes in the Netherlands and Chile......................................................................................................................... 28
Box 2.2 Special education areas in France .................................................................................................................................................................................... 29
Box 2.3 Funding disadvantaged students and their schools in Chile ..................................................................................................................................... 29
Box 2.4 Teach For All – A global network for expanding education opportunities ........................................................................................................... 31
Box 2.5 Selected mentoring and induction programmes .......................................................................................................................................................... 31
Box 2.6 Investing in educational success: New career pathways for teachers and school leaders in New Zealand ............................................. 34
Box 2.7 In Sweden, pay is now negotiated between the principal and the teacher ......................................................................................................... 35
Box 2.8 Multiple incentives to attract excellent teachers to disadvantaged schools in Korea and in North Carolina............................................ 36
Box 2.9 Providing greater career diversity in Australia, England and Wales, Ireland and Quebec (Canada) ........................................................... 39
Box 2.10 Tailoring professional development in New Zealand ................................................................................................................................................. 41
Box 3.1 Improving equity in Belgium’s (French Community) enrolment system ............................................................................................................... 62
Box 3.2 Controlled-choice programmes in the United States, the Netherlands and Spain ............................................................................................ 63
Box 3.3 School vouchers in Sweden ................................................................................................................................................................................................ 64
Box 3.4 School autonomy and collaboration among schools.................................................................................................................................................. 65
Box 3.5 Giving teachers their voice ................................................................................................................................................................................................. 65
Box 3.6 National Board for Professional Teaching Standards (United States) ..................................................................................................................... 66
Box 4.1 The Finnish comprehensive school and modular approach to grade repetition ................................................................................................ 80
Box 4.2 Multi-level study in New Zealand .................................................................................................................................................................................... 81
Box 4.3 Reducing the rate of grade repetition in France ........................................................................................................................................................... 82
Box 4.4 Selected examples of delaying tracking .......................................................................................................................................................................... 83
Box 4.5 Reducing early tracking in Austria .................................................................................................................................................................................... 83
Box 4.6 Components of effective school leadership training programmes .......................................................................................................................... 86
Box 4.7 Systemic support for sustainable improvement ............................................................................................................................................................ 87
Box 4.8 Using data for school and student improvement in the Netherlands .................................................................................................................... 89
Box 4.9 The OECD-Tohoku School Project: Student- and teacher-led change management in education ............................................................... 90
Box 4.10 Principles of effective learning ........................................................................................................................................................................................... 91
Box 4.11 Direct and student-oriented instruction practices ........................................................................................................................................................ 92
Box 4.12 Reaching parents and communities in the Netherlands, Ireland and France ...................................................................................................... 94
FiguresFigure 1.1 Student performance in mathematics among countries and regions in PISA 2012 .......................................................................................... 13
Figure 1.2 Student performance, excellence and inclusion ............................................................................................................................................................ 15
Figure 1.3 Achieving excellence: Where students go to class matters more than their social class .................................................................................... 16
Figure 1.4 Student performance and equity ........................................................................................................................................................................................ 17
Figure 1.5 Percentage of resilient students ........................................................................................................................................................................................... 18
Figure 2.1 Spending per student from the age of 6 to 15 and mathematics performance in PISA 2012 ........................................................................ 22
Figure 2.2 Systems’ allocation of educational resources and mathematics performance ....................................................................................................... 23
Figure 2.3 Impact of teacher shortage on instruction, school principals’ views ........................................................................................................................ 26
Figure 2.4 Teachers’ salaries in lower secondary education (2011).............................................................................................................................................. 32
Figure 2.5 Criteria determining base salary and additional payments for teachers in public institutions (2011) ......................................................... 33
Figure 3.1 School autonomy over resource allocation ................................................................................................................................................................... 49
Figure 3.2 School autonomy over curricula and assessments ........................................................................................................................................................ 50
Figure 3.3 School autonomy over curriculum and assessment and mathematics performance ........................................................................................... 51
10 © OECD 2014 Equity, ExcEllEncE and inclusivEnEss in Education: Policy lEssons from around thE World
Table of Contents
Figure 3.4 School autonomy and mathematics performance, by system-level accountability features .............................................................................. 52
Figure 3.5 School autonomy and mathematics performance, by system-level teacher participation in school management ..................................... 53
Figure 3.6 School competition and school policy on catchment area ......................................................................................................................................... 55
Figure 3.7 Parents’ reports on criteria used to choose schools for their child, by students’ socio-economic status ........................................................ 56
Figure 3.8 School competition and mathematics performance ..................................................................................................................................................... 59
Figure 3.9 School type and mathematics performance .................................................................................................................................................................... 60
Figure 3.10 Written feedback from students and equity ................................................................................................................................................................... 68
Figure 4.1 Probability of students having repeated a grade, by students’ socio-economic status (OECD average) ..................................................... 77
Figure 4.2 Cost of grade repetition ......................................................................................................................................................................................................... 78
TaBlesTable 2.1 Teachers’ and schools’ average socio-economic background ................................................................................................................................. 25
Table 2.2 Disadvantaged schools have difficulties attracting and retaining teachers .......................................................................................................... 25

11
Chapter 1
Charting a way towards equity and exCellenCe
EQUITy, ExCELLENCE AND INCLUSIVENESS IN EDUCATION: POLICy LESSONS FROM AROUND THE WORLD © OECD 2014
This chapter explains the raison d’être of the International Summit on the
Teaching Profession and defines the three key themes of the 2014 Summit:
excellence, equity and inclusiveness in education. It also makes the case for
investing in equity in education.
C h a r t i n g a way t owa r d s e q u i t y a n d e x c e l l e n c e
12
Chapter 1
© OECD 2014 Equity, ExcEllEncE and inclusivEnEss in Education: Policy lEssons from around thE World
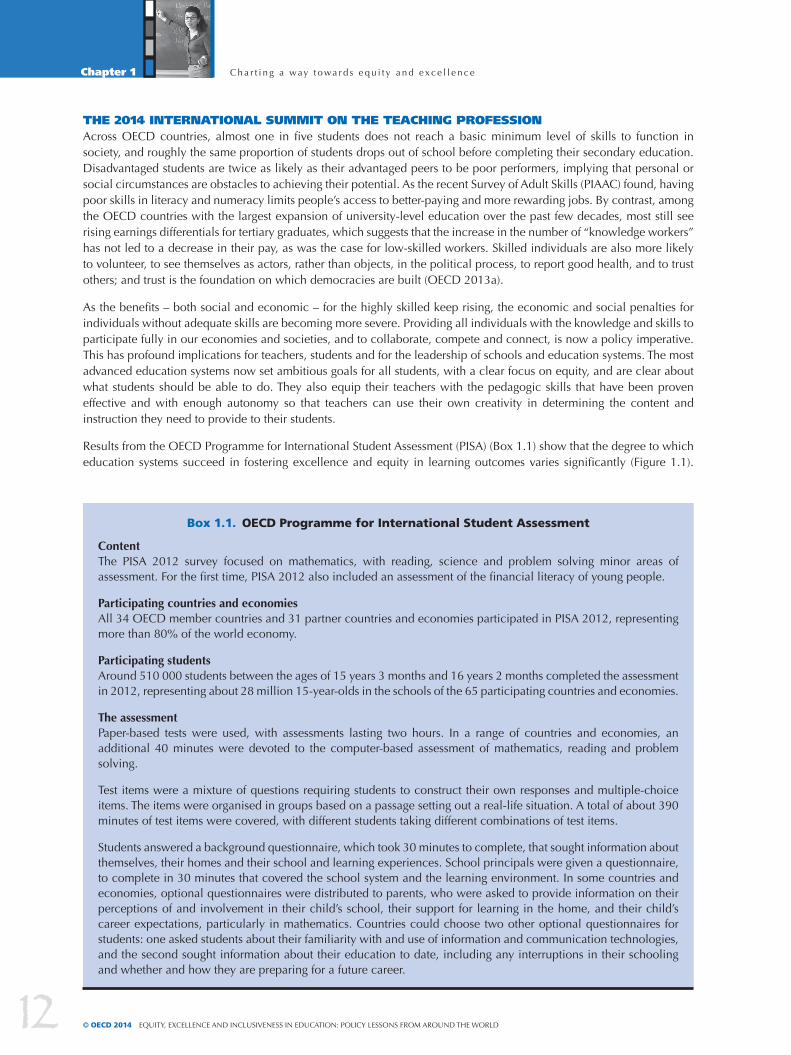
The 2014 InTernaTIonal SummIT on The TeaChIng ProfeSSIonAcross OECD countries, almost one in five students does not reach a basic minimum level of skills to function in society, and roughly the same proportion of students drops out of school before completing their secondary education. Disadvantaged students are twice as likely as their advantaged peers to be poor performers, implying that personal or social circumstances are obstacles to achieving their potential. As the recent Survey of Adult Skills (PIAAC) found, having poor skills in literacy and numeracy limits people’s access to better-paying and more rewarding jobs. By contrast, among the OECD countries with the largest expansion of university-level education over the past few decades, most still see rising earnings differentials for tertiary graduates, which suggests that the increase in the number of “knowledge workers” has not led to a decrease in their pay, as was the case for low-skilled workers. Skilled individuals are also more likely to volunteer, to see themselves as actors, rather than objects, in the political process, to report good health, and to trust others; and trust is the foundation on which democracies are built (OECD 2013a).
As the benefits – both social and economic – for the highly skilled keep rising, the economic and social penalties for individuals without adequate skills are becoming more severe. Providing all individuals with the knowledge and skills to participate fully in our economies and societies, and to collaborate, compete and connect, is now a policy imperative. This has profound implications for teachers, students and for the leadership of schools and education systems. The most advanced education systems now set ambitious goals for all students, with a clear focus on equity, and are clear about what students should be able to do. They also equip their teachers with the pedagogic skills that have been proven effective and with enough autonomy so that teachers can use their own creativity in determining the content and instruction they need to provide to their students.
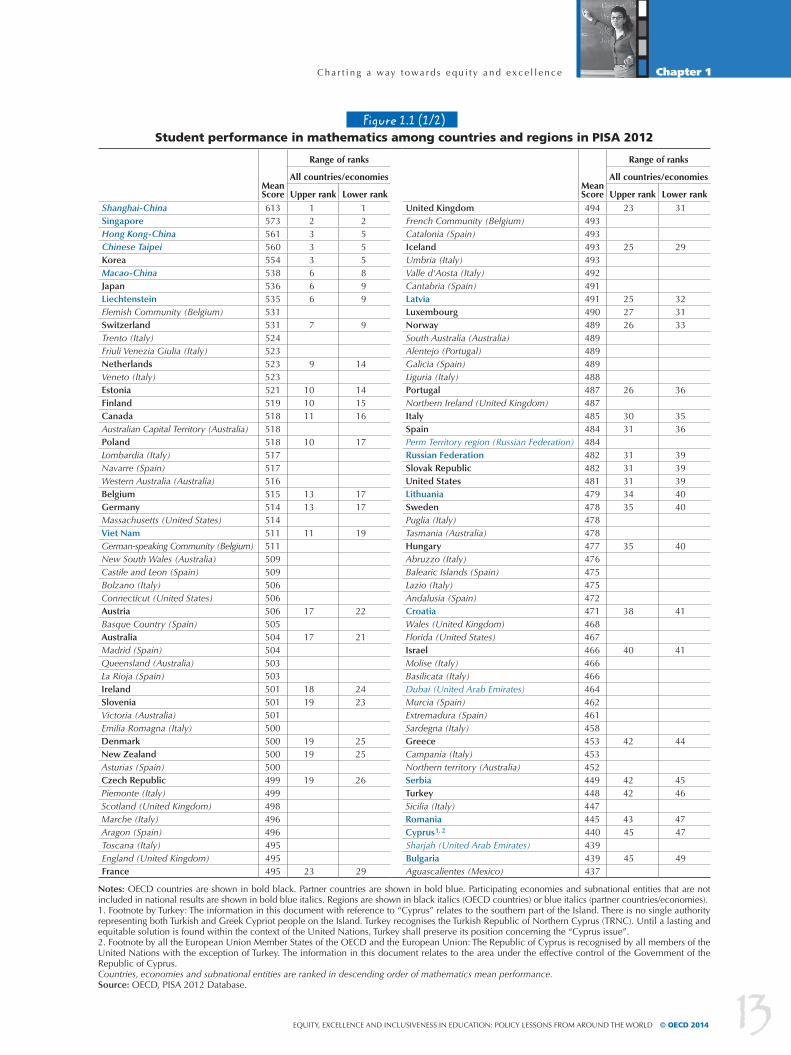
Results from the OECD Programme for International Student Assessment (PISA) (Box 1.1) show that the degree to which education systems succeed in fostering excellence and equity in learning outcomes varies significantly (Figure 1.1).
Box 1.1. OECD Programme for International Student Assessment
ContentThe PISA 2012 survey focused on mathematics, with reading, science and problem solving minor areas of assessment. For the first time, PISA 2012 also included an assessment of the financial literacy of young people.
participating countries and economiesAll 34 OECD member countries and 31 partner countries and economies participated in PISA 2012, representing more than 80% of the world economy.
participating studentsAround 510 000 students between the ages of 15 years 3 months and 16 years 2 months completed the assessment in 2012, representing about 28 million 15-year-olds in the schools of the 65 participating countries and economies.
the assessmentPaper-based tests were used, with assessments lasting two hours. In a range of countries and economies, an additional 40 minutes were devoted to the computer-based assessment of mathematics, reading and problem solving.
Test items were a mixture of questions requiring students to construct their own responses and multiple-choice items. The items were organised in groups based on a passage setting out a real-life situation. A total of about 390 minutes of test items were covered, with different students taking different combinations of test items.
Students answered a background questionnaire, which took 30 minutes to complete, that sought information about themselves, their homes and their school and learning experiences. School principals were given a questionnaire, to complete in 30 minutes that covered the school system and the learning environment. In some countries and economies, optional questionnaires were distributed to parents, who were asked to provide information on their perceptions of and involvement in their child’s school, their support for learning in the home, and their child’s career expectations, particularly in mathematics. Countries could choose two other optional questionnaires for students: one asked students about their familiarity with and use of information and communication technologies, and the second sought information about their education to date, including any interruptions in their schooling and whether and how they are preparing for a future career.
C h a r t i n g a way t owa r d s e q u i t y a n d e x c e l l e n c e
13
Chapter 1
Equity, ExcEllEncE and inclusivEnEss in Education: Policy lEssons from around thE World © OECD 2014
Figure 1.1 (1/2)Student performance in mathematics among countries and regions in PISA 2012
mean score
range of ranks
mean score
range of ranks
all countries/economies all countries/economies
upper rank lower rank upper rank lower rankShanghai-China 613 1 1 United Kingdom 494 23 31Singapore 573 2 2 French Community (Belgium) 493Hong Kong-China 561 3 5 Catalonia (Spain) 493Chinese Taipei 560 3 5 Iceland 493 25 29Korea 554 3 5 Umbria (Italy) 493Macao-China 538 6 8 Valle d'Aosta (Italy) 492Japan 536 6 9 Cantabria (Spain) 491Liechtenstein 535 6 9 Latvia 491 25 32Flemish Community (Belgium) 531 Luxembourg 490 27 31Switzerland 531 7 9 Norway 489 26 33Trento (Italy) 524 South Australia (Australia) 489Friuli Venezia Giulia (Italy) 523 Alentejo (Portugal) 489Netherlands 523 9 14 Galicia (Spain) 489Veneto (Italy) 523 Liguria (Italy) 488Estonia 521 10 14 Portugal 487 26 36Finland 519 10 15 Northern Ireland (United Kingdom) 487Canada 518 11 16 Italy 485 30 35Australian Capital Territory (Australia) 518 Spain 484 31 36Poland 518 10 17 Perm Territory region (Russian Federation) 484Lombardia (Italy) 517 Russian Federation 482 31 39Navarre (Spain) 517 Slovak Republic 482 31 39Western Australia (Australia) 516 United States 481 31 39Belgium 515 13 17 Lithuania 479 34 40Germany 514 13 17 Sweden 478 35 40Massachusetts (United States) 514 Puglia (Italy) 478Viet Nam 511 11 19 Tasmania (Australia) 478German-speaking Community (Belgium) 511 Hungary 477 35 40New South Wales (Australia) 509 Abruzzo (Italy) 476Castile and Leon (Spain) 509 Balearic Islands (Spain) 475Bolzano (Italy) 506 Lazio (Italy) 475Connecticut (United States) 506 Andalusia (Spain) 472Austria 506 17 22 Croatia 471 38 41Basque Country (Spain) 505 Wales (United Kingdom) 468Australia 504 17 21 Florida (United States) 467Madrid (Spain) 504 Israel 466 40 41Queensland (Australia) 503 Molise (Italy) 466La Rioja (Spain) 503 Basilicata (Italy) 466Ireland 501 18 24 Dubai (United Arab Emirates) 464Slovenia 501 19 23 Murcia (Spain) 462Victoria (Australia) 501 Extremadura (Spain) 461Emilia Romagna (Italy) 500 Sardegna (Italy) 458Denmark 500 19 25 Greece 453 42 44New Zealand 500 19 25 Campania (Italy) 453Asturias (Spain) 500 Northern territory (Australia) 452Czech Republic 499 19 26 Serbia 449 42 45Piemonte (Italy) 499 Turkey 448 42 46Scotland (United Kingdom) 498 Sicilia (Italy) 447Marche (Italy) 496 Romania 445 43 47Aragon (Spain) 496 Cyprus1, 2 440 45 47Toscana (Italy) 495 Sharjah (United Arab Emirates) 439England (United Kingdom) 495 Bulgaria 439 45 49France 495 23 29 Aguascalientes (Mexico) 437
Notes: OECD countries are shown in bold black. Partner countries are shown in bold blue. Participating economies and subnational entities that are not included in national results are shown in bold blue italics. Regions are shown in black italics (OECD countries) or blue italics (partner countries/economies).1. Footnote by Turkey: The information in this document with reference to “Cyprus” relates to the southern part of the Island. There is no single authority representing both Turkish and Greek Cypriot people on the Island. Turkey recognises the Turkish Republic of Northern Cyprus (TRNC). Until a lasting and equitable solution is found within the context of the United Nations, Turkey shall preserve its position concerning the “Cyprus issue”.2. Footnote by all the European Union Member States of the OECD and the European Union: The Republic of Cyprus is recognised by all members of the United Nations with the exception of Turkey. The information in this document relates to the area under the effective control of the Government of the Republic of Cyprus.Countries, economies and subnational entities are ranked in descending order of mathematics mean performance.Source: OECD, PISA 2012 Database.
C h a r t i n g a way t owa r d s e q u i t y a n d e x c e l l e n c e
14
Chapter 1
© OECD 2014 Equity, ExcEllEncE and inclusivEnEss in Education: Policy lEssons from around thE World
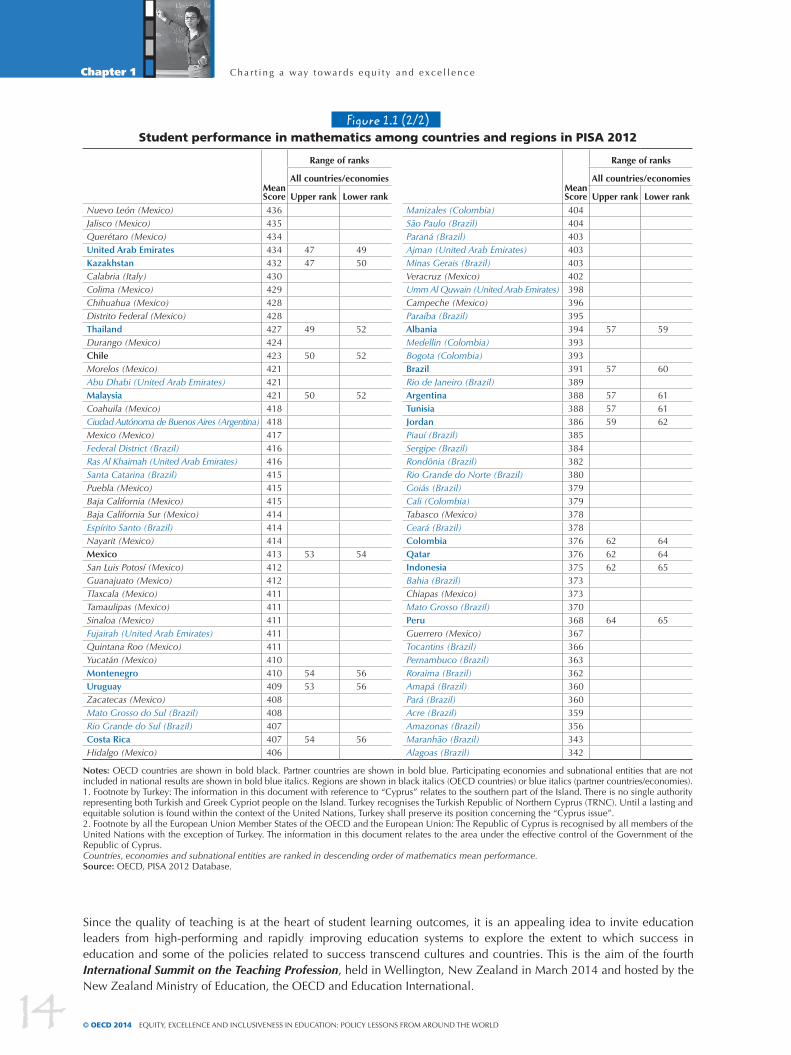
Figure 1.1 (2/2)Student performance in mathematics among countries and regions in PISA 2012
mean score
range of ranks
mean score
range of ranks
all countries/economies all countries/economies
upper rank lower rank upper rank lower rankNuevo León (Mexico) 436 Manizales (Colombia) 404Jalisco (Mexico) 435 São Paulo (Brazil) 404Querétaro (Mexico) 434 Paraná (Brazil) 403United Arab Emirates 434 47 49 Ajman (United Arab Emirates) 403Kazakhstan 432 47 50 Minas Gerais (Brazil) 403Calabria (Italy) 430 Veracruz (Mexico) 402Colima (Mexico) 429 Umm Al Quwain (United Arab Emirates) 398Chihuahua (Mexico) 428 Campeche (Mexico) 396Distrito Federal (Mexico) 428 Paraíba (Brazil) 395Thailand 427 49 52 Albania 394 57 59Durango (Mexico) 424 Medellin (Colombia) 393Chile 423 50 52 Bogota (Colombia) 393Morelos (Mexico) 421 Brazil 391 57 60Abu Dhabi (United Arab Emirates) 421 Rio de Janeiro (Brazil) 389Malaysia 421 50 52 Argentina 388 57 61Coahuila (Mexico) 418 Tunisia 388 57 61Ciudad Autónoma de Buenos Aires (Argentina) 418 Jordan 386 59 62Mexico (Mexico) 417 Piauí (Brazil) 385Federal District (Brazil) 416 Sergipe (Brazil) 384Ras Al Khaimah (United Arab Emirates) 416 Rondônia (Brazil) 382Santa Catarina (Brazil) 415 Rio Grande do Norte (Brazil) 380Puebla (Mexico) 415 Goiás (Brazil) 379Baja California (Mexico) 415 Cali (Colombia) 379Baja California Sur (Mexico) 414 Tabasco (Mexico) 378Espírito Santo (Brazil) 414 Ceará (Brazil) 378Nayarit (Mexico) 414 Colombia 376 62 64Mexico 413 53 54 Qatar 376 62 64San Luis Potosí (Mexico) 412 Indonesia 375 62 65Guanajuato (Mexico) 412 Bahia (Brazil) 373Tlaxcala (Mexico) 411 Chiapas (Mexico) 373Tamaulipas (Mexico) 411 Mato Grosso (Brazil) 370Sinaloa (Mexico) 411 Peru 368 64 65Fujairah (United Arab Emirates) 411 Guerrero (Mexico) 367Quintana Roo (Mexico) 411 Tocantins (Brazil) 366Yucatán (Mexico) 410 Pernambuco (Brazil) 363Montenegro 410 54 56 Roraima (Brazil) 362Uruguay 409 53 56 Amapá (Brazil) 360Zacatecas (Mexico) 408 Pará (Brazil) 360Mato Grosso do Sul (Brazil) 408 Acre (Brazil) 359Rio Grande do Sul (Brazil) 407 Amazonas (Brazil) 356Costa Rica 407 54 56 Maranhão (Brazil) 343Hidalgo (Mexico) 406 Alagoas (Brazil) 342
Notes: OECD countries are shown in bold black. Partner countries are shown in bold blue. Participating economies and subnational entities that are not included in national results are shown in bold blue italics. Regions are shown in black italics (OECD countries) or blue italics (partner countries/economies).1. Footnote by Turkey: The information in this document with reference to “Cyprus” relates to the southern part of the Island. There is no single authority representing both Turkish and Greek Cypriot people on the Island. Turkey recognises the Turkish Republic of Northern Cyprus (TRNC). Until a lasting and equitable solution is found within the context of the United Nations, Turkey shall preserve its position concerning the “Cyprus issue”.2. Footnote by all the European Union Member States of the OECD and the European Union: The Republic of Cyprus is recognised by all members of the United Nations with the exception of Turkey. The information in this document relates to the area under the effective control of the Government of the Republic of Cyprus.Countries, economies and subnational entities are ranked in descending order of mathematics mean performance.Source: OECD, PISA 2012 Database.
Since the quality of teaching is at the heart of student learning outcomes, it is an appealing idea to invite education leaders from high-performing and rapidly improving education systems to explore the extent to which success in education and some of the policies related to success transcend cultures and countries. This is the aim of the fourth International Summit on the Teaching Profession, held in Wellington, New Zealand in March 2014 and hosted by the New Zealand Ministry of Education, the OECD and Education International.

C h a r t i n g a way t owa r d s e q u i t y a n d e x c e l l e n c e
15
Chapter 1
Equity, ExcEllEncE and inclusivEnEss in Education: Policy lEssons from around thE World © OECD 2014
The Summit brings together education ministers, union leaders and other teacher leaders from high-performing and rapidly improving education systems, as measured by PISA, to discuss equity, excellence and inclusiveness in education by exploring three questions:
• How are high-quality teachers developed, and how do schools with the greatest need attract and retain them?
• How can equity be ensured in increasingly devolved education systems? and
• What kinds of learning environments address the needs of all students?
This report was drafted by Andreas Schleicher and is based on internationally comparative studies conducted by the OECD, including the PISA 2012 assessment, the policy review Equity and Quality in Education (OECD, 2012) and the policy review Teachers Matter (OECD, 2005). The analysis is complemented with examples that illustrate proven or promising practices in specific countries. Naturally, these examples are taken from specific contexts, so the extent to which they can be applied in different contexts will vary. Figures and tables that are cited, but not included, in this report are taken from the PISA 2012 Results (OECD, 2013b, 2013c, 2013d, 2013e), unless otherwise indicated.
DefInIng equITy, exCellenCe anD InCluSIveneSSThe overarching theme of the 2014 Summit is equity, excellence and inclusiveness, which recognises the close interrelationships between these three policy goals. Excellence without equity risks leading to large economic and social disparities; equity at the expense of quality is a meaningless aspiration.
Figure 1.2Student performance, excellence and inclusion
Percentage of low-performing students and top performers in mathematics in 2003 and 2012
Perc
enta
ge o
f stu
dent
s
Ho
ng K
ong
-Chi
na
Ko
rea
Liec
hten
stei
n
Mac
ao-C
hina
Jap
an
Swit
zerl
and
Bel
gium
Net
herl
and
s
Ger
man
y
Pola
nd
Can
ada
Finl
and
New
Zea
land
Aus
tral
ia
Aus
tria
OEC
D a
vera
ge 2
003
Fran
ce
Cze
ch R
epub
lic
Luxe
mb
our
g
Icel
and
Slov
ak R
epub
lic
Irel
and
Port
ugal
Den
mar
k
Ital
y
No
rway
Hun
gary
Uni
ted
Sta
tes
Swed
en
Spai
n
Latv
ia
Rus
sian
Fed
erat
ion
Turk
ey
Gre
ece
Thai
land
Uru
guay
Tuni
sia
Bra
zil
Mex
ico
Ind
one
sia
6.1
5.7
-6.9
-6.3 6.7
-3.9
-8.1
-5.7
-5.0
-1.6
-5.4
-4.3 5.3
-5.9 2.9
-2.0
-7.8
-1.4
50
40
30
20
10
0
Perc
enta
ge o
f stu
dent
s
0
10
20
30
40
50
60
70
80
Notes: The chart shows only countries/economies that participated in both PISA 2003 and PISA 2012 assessments.The change between PISA 2003 and PISA 2012 in the share of students performing below Level 2 in mathematics is shown below the country/economy name. The change between PISA 2003 and PISA 2012 in the share of students performing at or above Level 5 in mathematics is shown above the country/economy name. Only statistically signi�cant changes are shown (see Annex A3 in OECD, 2013b).OECD average 2003 compares only OECD countries with comparable mathematics scores since 2003. Countries and economies are ranked in descending order of the percentage of students at or above pro�ciency Level 5 in mathematics in 2012.Source: OECD, PISA 2012 Database, Table I.2.1b.
2012 2003
2.5
3.9
-3.9
-7.7 3.7
5.5
7.6
5.3
0.7
5.7
4.4
2.6
6.5
7.5
-5.2
-7.3 5.1
9.8
-6.3
-10.
2
7.7
-10.
2
-8.1
-11.
2
Students at or above pro�ciency Level 5
Students below pro�ciency Level 2

C h a r t i n g a way t owa r d s e q u i t y a n d e x c e l l e n c e
16
Chapter 1
© OECD 2014 Equity, ExcEllEncE and inclusivEnEss in Education: Policy lEssons from around thE World
Excellence
On average across OECD countries, 3.3% of students demonstrate excellence in mathematics performance in PISA, meaning that they attain proficiency Level 6. At this level, students can conceptualise, generalise and use information based on their investigations and modelling of complex problem situations, and can use their knowledge in relatively unfamiliar contexts. They are capable of advanced mathematical thinking and reasoning, they can reflect on their actions, and can formulate and precisely communicate those actions. Shanghai-China has by far the largest proportion of students (30.8%) who demonstrate excellence at this level in mathematics. Between 10% and 20% of students in four other Asian countries and economies – Singapore (19.0%), Chinese Taipei (18.0%), Hong Kong-China (12.3%) and Korea (12.1%) – score at this level. Between 5% and 10% of students in Japan (7.6%), Macao (7.6%), Liechtenstein (7.4%), Switzerland (6.8%) and Belgium (6.1%) attain Level 6 in mathematics. In 33 participating countries and economies, between 1% and 5% of students attain this level, while in 22 others, including the OECD countries Chile, Greece and Mexico, fewer than 1% of students score at the highest level. On average across OECD countries, 12.6% of students reach at least the next-highest performance level in PISA, Level 5.
Figure 1.3Achieving excellence: Where students go to class matters more than their social class
Mathematics performance by decile of socio-economic status
Source: OECD, PISA 2012 Database.
Bottom 10% (1st decile) 2nd decile 3rd decile 4th decile 5th decile
6th decile 7th decile 8th decile 9th decile Top 10% (10th decile)
PISA score points
MexicoChile
GreeceNorwaySwedenIceland
IsraelItaly
United StatesSpain
DenmarkLuxembourg
AustraliaIreland
United KingdomHungaryCanadaFinlandAustriaTurkey
LiechtensteinCzech Republic
EstoniaPortugalSlovenia
Slovak RepublicNew Zealand
GermanyNetherlands
FranceSwitzerland
PolandBelgium
JapanMacao-China
Hong Kong-ChinaKorea
SingaporeChinese Taipei
Shanghai-China
MexicoChileGreeceNorwaySwedenIcelandIsraelItalyUnited StatesSpainDenmarkLuxembourgAustraliaIrelandUnited KingdomHungaryCanadaFinlandAustriaTurkeyLiechtensteinCzech RepublicEstoniaPortugalSloveniaSlovak RepublicNew ZealandGermanyNetherlandsFranceSwitzerlandPolandBelgiumJapanMacao-ChinaHong Kong-ChinaKoreaSingaporeChinese TaipeiShanghai-China
300 325 350 375 400 425 450 475 500 525 550 575 600 625 650 675
677

C h a r t i n g a way t owa r d s e q u i t y a n d e x c e l l e n c e
17
Chapter 1
Equity, ExcEllEncE and inclusivEnEss in Education: Policy lEssons from around thE World © OECD 2014
Between 2003 and 2012, Korea and Macao-China were able to achieve a six percentage-point increase in the share of students performing at this level. Other increases in the proportion of students scoring at or above Level 5 were observed in Hong Kong-China, Japan, Serbia, Chinese Taipei and Thailand (between 2006 and 2012) and in Estonia, Latvia, Shanghai-China and Singapore (between 2009 and 2012) (Figure 1.2).
Some countries, such as Australia, Canada, Estonia, Finland, Hong Kong-China, Japan, Korea and Macao-China, have been able to combine high levels of student performance with an equitable distribution of learning opportunities, as measured by PISA (Figure 1.4). And, of the 39 countries and economies that participated in both PISA 2003 and PISA 2012, Germany, Mexico and Turkey improved both their mathematics performance and their levels of equity in education during the period.
Equity
The significant differences in the performance of students from disadvantaged backgrounds – both within and across countries – suggest that there is much room for raising their performance (Figure 1.3).
Equity in education can be seen through two dimensions: fairness and inclusion. Equity as fairness implies that personal or socio-economic circumstances, such as gender, ethnic origin or family background, are not obstacles to success in education. Equity as inclusion means ensuring that all students reach at least a basic minimum level of skills. Equitable education systems are fair and inclusive, and support their students in reaching their learning potential without either formally or informally erecting barriers or lowering expectations.
Figure 1.4Student performance and equity
Meanmathematics
score
30 20 10 025 15 5
Source: OECD, PISA 2012 Database, Table II.2.1.
650
600
550
500
450
400
350
300
Percentage of variation in performance explained bythe PISA index of economic, social and cultural status
GREATER EQUITY
Above-average mathematics performance Below-average equity in education outcomes
Above-average mathematics performance Above-average equity in education outcomes
Below-average mathematics performance Below-average equity in education outcomes
Below-average mathematics performance Above-average equity in education outcomes
Strength of the relationship between performance and socio-economic status is above the OECD average
Strength of the relationship between performance and socio-economic status is not statistically signi�cantly different from the OECD average
Strength of the relationship between performance and socio-economic status is below the OECD average
Japan
Iceland
Ireland
Switzerland
Norway
Poland
Greece
Germany
Thailand
Turkey
Australia
Sweden
Canada
Tunisia Jordan
Korea
Italy
Israel
Portugal
Peru
United States
Latvia
Serbia
Croatia
Estonia
Hungary
Chile
SpainSlovak Republic
Luxembourg
NetherlandsNew ZealandFrance
Indonesia
Mexico
Finland
Qatar
Belgium Macao-China
Uruguay
Bulgaria
Costa Rica
ArgentinaColombia
Brazil
Romania
Liechtenstein
Kazakhstan
Lithuania
MalaysiaUnited Arab Emirates
Russian FederationUnited Kingdom
Montenegro
Hong Kong-China
Shanghai-China
Chinese Taipei Viet Nam
Singapore
OECD average
OEC
D a
vera
ge
1. Denmark2. Czech Republic3. Austria4. Slovenia
41 23

C h a r t i n g a way t owa r d s e q u i t y a n d e x c e l l e n c e
18
Chapter 1
© OECD 2014 Equity, ExcEllEncE and inclusivEnEss in Education: Policy lEssons from around thE World
Figure 1.5Percentage of resilient students
Percentage of resilient studentsamong disadvantaged students
Note: A student is classi�ed as resilient if he or she is in the bottom quarter of the PISA index of economic, social and cultural status (ESCS) in the country of assessment and performs in the top quarter of students among all countries, after accounting for socio-economic status. Countries and economies are ranked in descending order of the percentage of resilient students.Source: OECD, PISA 2012 Database, Table II.2.7a.
0 10 20 30 40 50 60 70 80
Shanghai-ChinaHong Kong-China
Macao-ChinaViet Nam
SingaporeKorea
Chinese TaipeiJapan
LiechtensteinSwitzerland
EstoniaNetherlands
PolandCanadaFinland
BelgiumPortugal
GermanyTurkey
OECD averageItaly
SpainLatvia
IrelandAustraliaThailand
AustriaLuxembourg
Czech RepublicSlovenia
United KingdomLithuania
FranceNorwayIceland
New ZealandRussian Federation
United StatesCroatia
DenmarkSweden
HungarySlovak Republic
MexicoSerbia
GreeceIsrael
TunisiaRomaniaMalaysia
IndonesiaBulgaria
KazakhstanUruguay
BrazilCosta Rica
ChileColombia
MontenegroUnited Arab Emirates
ArgentinaJordan
PeruQatar

C h a r t i n g a way t owa r d s e q u i t y a n d e x c e l l e n c e
19
Chapter 1
Equity, ExcEllEncE and inclusivEnEss in Education: Policy lEssons from around thE World © OECD 2014
In terms of fairness, PISA shows that socio-economic disadvantage is closely related to many of the student and school characteristics that are associated with performance. Although poor performance in school does not automatically stem from disadvantage, the socio-economic status of students and schools does appear to exert a powerful influence on learning outcomes. Across OECD countries, a more socio-economically advantaged student scores 39 points higher in mathematics – the equivalent of nearly one year of schooling – than a less-advantaged student. Because advantaged families are better able to reinforce and enhance the effects of schools, because students from advantaged families may attend higher-quality schools, or because schools are simply better-equipped to nurture and develop young people from advantaged backgrounds, in many countries, schools tend to reproduce existing patterns of socio-economic advantage, rather than create a more equitable distribution of learning opportunities and outcomes. However, differences across countries in the extent to which student-level factors (such as family structure, parents’ job status and immigrant background) and school-level factors (such as how resources are allocated across schools) are associated with performance and socio-economic status show that policies and practices have an impact on both equity and performance (Figure 1.4).
Some 6.5% of students across OECD countries – nearly one million students – are “resilient”, meaning that they beat the socio-economic odds against them and exceed expectations, when compared with students in other countries (Figure 1.5). In Hong Kong-China, Korea, Macao-China, Shanghai-China, Singapore, Chinese Taipei and Viet Nam, more than half of all disadvantaged students, or 12.5% of the overall student population, are resilient and perform among the top 25% of students across all participating countries and economies.
Inclusion
Some 23% of students in OECD countries, and 32% of students in all countries and economies participating in PISA 2012, did not reach the baseline Level 2 in the PISA mathematics assessment, a level at which students can just extract relevant information from a single source and can use basic algorithms, formulae, procedures or conventions to solve problems involving whole numbers (Figure 1.2). It is very likely that students who lack basic skills at this age will either drop out of the education system, not finish upper secondary school and will be unprepared to enter the workforce, or will continue studying but struggle more than their peers and need additional – and more expensive – support.
Fairness and inclusion often overlap, such as when socio-economic disadvantage and poor performance converge in specific population groups. For instance, evidence from PISA indicates that a 15-year-old student from a relatively disadvantaged home is more than twice as likely as a student from an affluent family to score below Level 2 in the reading assessment.
The benefITS of InveSTIng In equITyInvesting in equity in education and in reducing dropout pays off. According to one estimate, if all 15-year-olds in the OECD area attained at least Level 2 in the PISA mathematics assessment, they would contribute over USD 200 trillion in additional economic output over their working lives (OECD, 2010a). While such estimates are never wholly certain, they do suggest that the benefits of improving individuals’ cognitive skills dwarf any conceivable cost of improvement.
Improving students’ performance in school can also encourage healthier lifestyles and participation in democratic institutions and other civil society initiatives and organisations – all of which reduces the cost to society. The Survey of Adult Skills, conducted by the OECD in 2012, shows that skills are positively associated with self-reported good health, political interest and interpersonal trust (OECD, 2013a). Crime and other illegal activities may decrease, since better-educated people tend to be less involved in criminality (OECD, 2010b). Indeed many economic and social problems, such as teenage pregnancy and unhealthy habits, are linked to low levels of educational attainment and skills (Cunha and Heckman, 2007; Heckman, 2008).
Strengthening equity in education, and investing in the early years, also yield high returns. Starting strong in education makes it easier to acquire skills and knowledge later on. For children from disadvantaged backgrounds, access to early education not only contributes to equity, but is, in the long run, economically efficient as well.

C h a r t i n g a way t owa r d s e q u i t y a n d e x c e l l e n c e
20
Chapter 1
© OECD 2014 Equity, ExcEllEncE and inclusivEnEss in Education: Policy lEssons from around thE World
references
Cunha, F. and J. Heckman (2007), “The Evolution of Inequality, Heterogeneity and Uncertainty in Labor Earnings in the U.S. Economy”, NBER Working Paper, No. 13526, National Bureau of Economic Research, Cambridge, www.nber.org/papers/w13526.
Heckman, J. (2008), “The case for investing in disadvantaged young children”, Big Ideas for Children: Investing in Our Nation’s Future, First Focus, Washington, D.C., www.heckmanequation.org/content/resource/case-investing-disadvantaged-young-children.
OECD (2013a), OECD Skills Outlook 2013: First Results from the Survey of Adult Skills, OECD Publishing, http://dx.doi.org/ 10.1787/9789264204256-en.
OECD (2013b), PISA 2012 Results: What Students Know and Can Do: Student Performance in Mathematics, Reading and Science (Volume I), PISA, OECD Publishing, http://dx.doi.org/10.1787/9789264201118-en.
OECD (2013c), PISA 2012 Results: Excellence through Equity: Giving Every Student the Chance to Succeed (Volume II), PISA, OECD Publishing, http://dx.doi.org/10.1787/9789264201132-en.
OECD (2013d), PISA 2012 Results: Ready to Learn: Students’ Engagement, Drive and Self-Beliefs (Volume III), PISA, OECD Publishing, http://dx.doi.org/10.1787/9789264201170-en.
OECD (2013e), PISA 2012 Results: What Makes Schools Successful? Resources, Policies and Practices (Volume IV), PISA, OECD Publishing, http://dx.doi.org/10.1787/9789264201156-en.
OECD (2012), Equity and Quality in Education: Supporting Disadvantaged Students and Schools, OECD Publishing, http://dx.doi.org/ 10.1787/9789264130852-en.
OECD (2010a), The High Cost of Low Educational Performance: The Long-run Economic Impact of Improving PISA Outcomes, PISA, OECD Publishing, http://dx.doi.org/10.1787/9789264077485-en.
OECD (2010b), Improving Health and Social Cohesion through Education, Educational Research and Innovation, OECD Publishing, http://dx.doi.org/10.1787/9789264086319-en.
OECD (2005), Teachers Matter: Attracting, Developing and Retaining Effective Teachers, Education and Training Policy, OECD Publishing, http://dx.doi.org/10.1787/9789264018044-en.
The statistical data for Israel are supplied by and under the responsibility of the relevant Israeli authorities. The use of such data by the OECD is without prejudice to the status of the Golan Heights, East Jerusalem and Israeli settlements in the West Bank under the terms of international law.

21
Chapter 2
Developing high-quality teachers for the schools with the greatest neeD
Equity, ExcEllEncE and inclusivEnEss in Education: Policy lEssons from around thE World © OECD 2014
This chapter focuses on the key resource in education: teachers. Based on
PISA 2012 results, it discusses how the quality of financial and teaching resources
is associated with student performance – particularly in disadvantaged
schools. The chapter examines how some countries manage to recruit the best
candidates to become teachers, how these teachers are trained to provide
quality education in difficult circumstances, and how some countries attract
and retain high-quality teachers in disadvantaged schools.

D e ve l o p i n g h i g h - q u a l i t y t e a ch e r s f o r t h e s ch o o l s w i t h t h e g r e a t e s t n e e d
22
Chapter 2
© OECD 2014 Equity, ExcEllEncE and inclusivEnEss in Education: Policy lEssons from around thE World
School systems in the countries and economies that participated in PISA 2012 vary widely in the amount of resources – financial, human and material – that they invest in education. While research is inconclusive, the relationship between the quantity of educational resources and student performance is usually weak, and this is also what the results from PISA show. In fact, most of the variation in student performance is explained by the quality of educational resources and by how those resources are used. Teachers are the key resource in education; and how they are developed and supported throughout their careers necessarily has a strong impact on the performance of students and schools – particularly those with the greatest need.
WhaT The reSulTS from PISa 2012 ShoW
Financial resources
The relationship among a country’s/economy’s income per capita, its level of expenditure on education per student, and the level and distribution of learning outcomes is complex. While among countries and economies whose cumulative expenditure per student is below USD 50 000 (the level of spending in the Czech Republic, Hungary and the Slovak Republic), higher expenditure on education predicts higher scores in the PISA mathematics assessment. However, this is not the case among high-income countries and economies, including most OECD countries. Among this latter group of countries, factors other than wealth are better predictors of student performance. For example, the Slovak Republic and the United States both score at 481 points in mathematics, but the United States’ cumulative expenditure per student is more than double that of the Slovak Republic (Figure 2.1).
Figure 2.1Spending per student from the age of 6 to 15 and mathematics performance in PISA 2012
Mat
hem
atic
s pe
rfor
man
ce (s
core
poi
nts)
0 80 160 20040 12020 10060 140 180
Note: Only countries and economies with available data are shown.1. A signi�cant relationship (p < 0.10) is shown by the solid line.2. A non-signi�cant relationship (p > 0.10) is shown by the dotted line.Source: OECD, PISA 2012 Database, Tables I.2.3a and IV.3.1.
650
600
550
500
450
400
350
300
Average spending per studentfrom the age of 6 to 15 (in thousand USD, PPPs)
R² = 0.01
R² = 0.37
Countries/economies whose cumulative expenditure per student in 2012 was less than USD 50 000Fitted line for these countries1
Countries/economies whose cumulative expenditure per student in 2012 was USD 50 000 or moreFitted line for these countries2
Ireland
Norway
Germany Canada
Tunisia
Korea
Italy
Portugal
Peru
United StatesNew
Zealand
Latvia
Croatia
Estonia
Hungary
Spain
Slovak Republic
Luxembourg
Netherlands
Australia
France
Mexico
Finland
Belgium
Uruguay
Bulgaria
Turkey
Colombia
Thailand
Jordan Brazil
LithuaniaMalaysia
United Kingdom
Montenegro
Shanghai-China
SwitzerlandViet Nam
Singapore
Slovenia
Austria
JapanPoland
Israel
Chile
DenmarkSweden
Iceland
Czech Republic
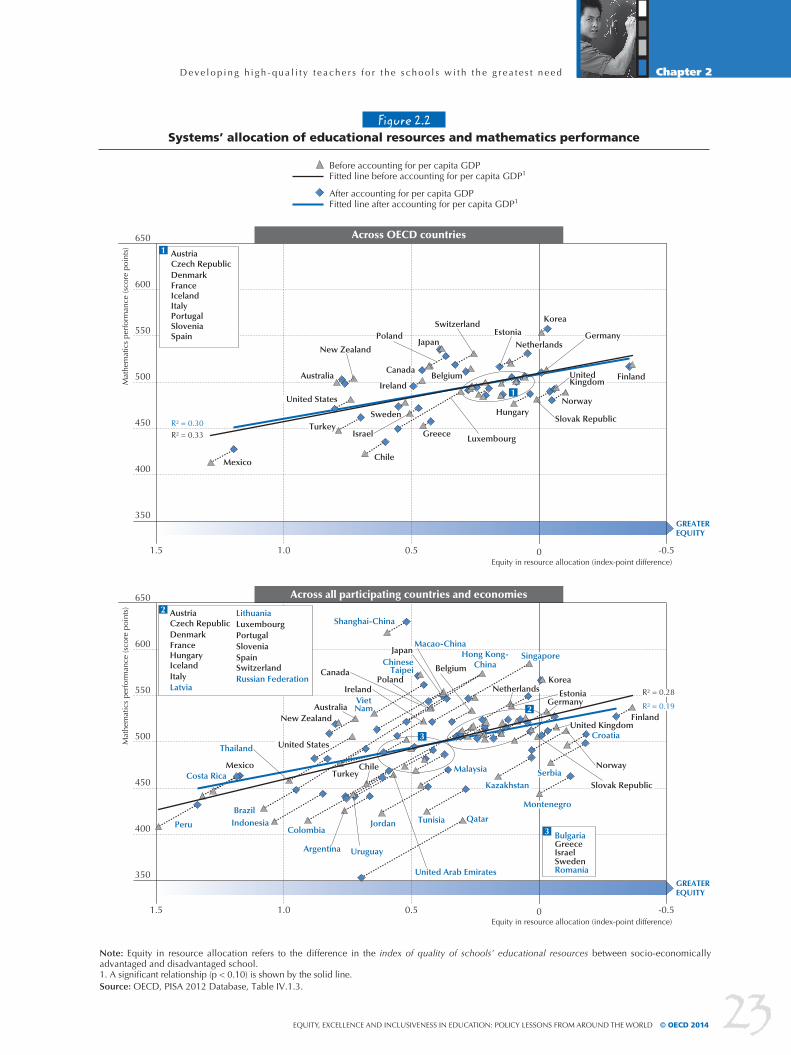
Allocating resources to where they can make the greatest difference is key. PISA finds that the degree of equity with which resources are allocated to socio-economically disadvantaged and advantaged schools is closely related to the performance of education systems. In higher-performing systems, principals in advantaged and disadvantaged schools reported similar levels of the quality of their schools’ physical infrastructure and educational resources (OECD, 2013a, Table IV.1.3). As shown in Figure 2.2, even after accounting for per capita GDP, 40% of the variation in mathematics performance across OECD countries can be explained by the degree of equity in schools’ educational resources between socio-economically advantaged and disadvantaged schools.
D e ve l o p i n g h i g h - q u a l i t y t e a ch e r s f o r t h e s ch o o l s w i t h t h e g r e a t e s t n e e d
23
Chapter 2
Equity, ExcEllEncE and inclusivEnEss in Education: Policy lEssons from around thE World © OECD 2014
Figure 2.2Systems’ allocation of educational resources and mathematics performance
GREATER EQUITY
GREATER EQUITY
Across OECD countries
Mat
hem
atic
s pe
rfor
man
ce (s
core
poi
nts)
Equity in resource allocation (index-point difference)
Note: Equity in resource allocation refers to the difference in the index of quality of schools’ educational resources between socio-economically advantaged and disadvantaged school.1. A signi�cant relationship (p < 0.10) is shown by the solid line. Source: OECD, PISA 2012 Database, Table IV.1.3.
650
600
550
500
450
400
350
1.5 1.0 00.5 -0.5
Across all participating countries and economies
Mat
hem
atic
s pe
rfor
man
ce (s
core
poi
nts)
Equity in resource allocation (index-point difference)
650
600
550
500
450
400
350
1.5 1.0 00.5 -0.5
Before accounting for per capita GDPFitted line before accounting for per capita GDP1
After accounting for per capita GDPFitted line after accounting for per capita GDP1
R² = 0.33R² = 0.30
R² = 0.28
R² = 0.19
United States
Estonia
NorwayHungary
Chile
Slovak Republic
Luxembourg
GermanyNetherlandsNew Zealand
Mexico
Turkey
FinlandCanada
Sweden
Ireland
Japan
Korea
Belgium United Kingdom
Switzerland
Australia
GreeceIsrael
Poland
Portugal
IcelandFrance
Italy
Slovenia
Denmark
AustriaCzech Republic
Spain
Norway
United States
Chile
Slovak Republic
Germany
Netherlands
New Zealand
MexicoTurkey
United Kingdom
Ireland
Peru Indonesia TunisiaJordan
Japan
Qatar
Macao-China
Uruguay
Costa Rica
Argentina
Colombia
Brazil
Kazakhstan
Malaysia
United Arab Emirates
Hong Kong-China
Shanghai-China
Chinese Taipei
Viet Nam
Singapore
Estonia
Finland
Korea
Serbia
Croatia
Thailand
Montenegro
BelgiumCanadaPoland
Australia 2
Italy
HungaryIceland
FranceDenmark
AustriaCzech Republic
Latvia
Portugal
Spain
Luxembourg
Switzerland
Slovenia
Lithuania
Russian Federation
2
3
GreeceIsrael
Bulgaria
RomaniaSweden
3
1
1
D e ve l o p i n g h i g h - q u a l i t y t e a ch e r s f o r t h e s ch o o l s w i t h t h e g r e a t e s t n e e d
24
Chapter 2
© OECD 2014 Equity, ExcEllEncE and inclusivEnEss in Education: Policy lEssons from around thE World
How resources are allocated is just as important as the amount of resources available. High-performing systems tend to prioritise higher salaries for teachers over other expenditures, such as supporting smaller classes (see OECD, 2013a, Figure IV.1.10). Among countries whose per capita GDP is more than USD 20 000, including most OECD countries, systems that pay teachers more (i.e. higher teachers’ salaries relative to national income) tend to perform better in mathematics. The correlation between these two factors among 33 high-income countries is high (0.30).1 By contrast, among countries whose per capita GDP is under USD 20 000, a system’s overall academic performance is unrelated to its teachers’ salaries, possibly signalling that other resources (material infrastructure, instructional materials, transportation, etc.) also need to be available to a certain threshold, after which improvements in material resources no longer benefit student performance, but improvements in human resources, through higher teachers’ salaries, for example, do.2
Teachers
Many education systems have trouble recruiting high-quality graduates as teachers, particularly in shortage areas, and retaining them once they are hired.
A shortage of teachers often implies that teachers are overloaded with work, both instructional and administrative, are unable to meet students’ needs, and are sometimes required to teach subjects outside their expertise. School systems respond to teacher shortages in the short term by lowering the qualification requirements for entry to the profession, assigning teachers to teach in subject areas in which they are not fully qualified, increasing the number of classes that teachers are required to teach, increasing class size, or some combination of these (OECD, 2005). Such responses, even if they ensure that every classroom has a teacher, raise concerns about the quality of teaching and learning.
Research into teacher preferences for schools finds that the least-favoured schools tend to be those in rural and remote settings, together with schools with higher proportions of disadvantaged children and children from ethnic and minority-language backgrounds (OECD, 2005). Schools in these settings are more likely to have staff shortages (Ingvarson and Rowe, 2007), and their students tend to find themselves in classes with the least-experienced and least-qualified teachers (OECD, 2005).
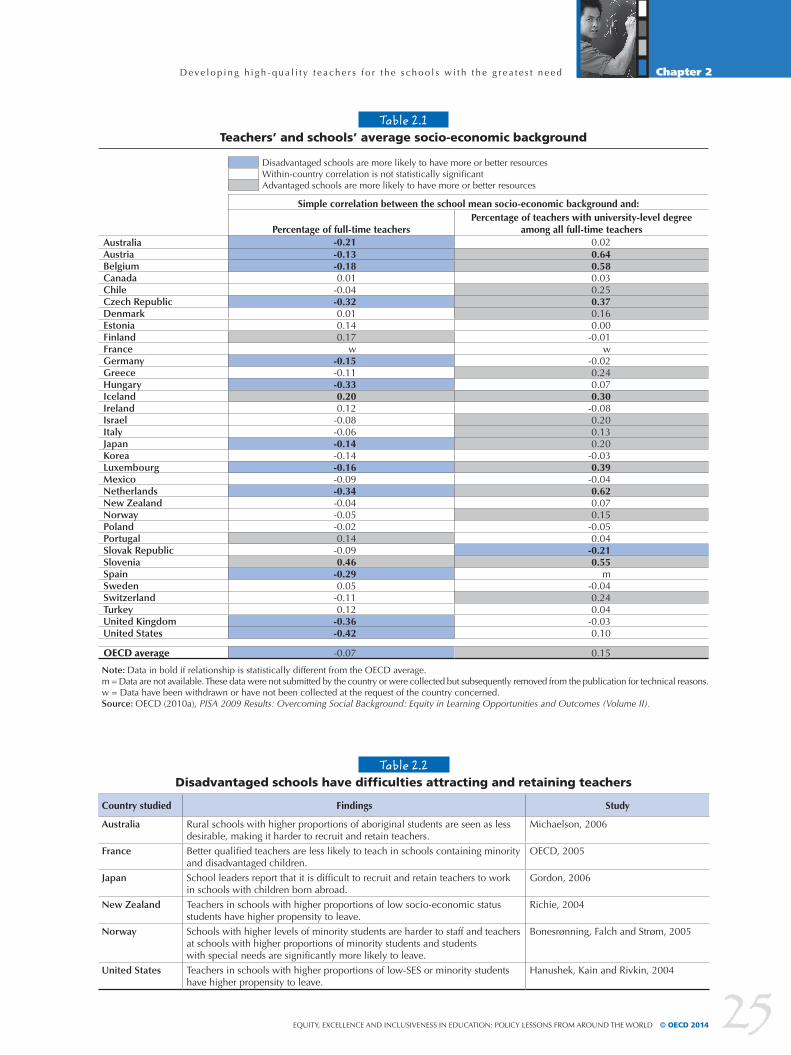
Results from PISA confirm this. Although in the majority of OECD countries, students in disadvantaged schools have access to more full-time teachers,3 in Austria, Belgium, Chile, the Czech Republic, Iceland, Luxembourg, the Netherlands and Slovenia, disadvantaged schools tend to have smaller proportions of highly qualified teachers – defined as teachers with advanced university qualifications – than advantaged schools (Table 2.1).
This higher concentration of underqualified or novice teachers in schools serving disadvantaged students tends to have a negative impact on student performance (Darling-Hammond, 2010), further diminishing students’ chances of success. Depending on how teachers’ careers are managed and on financial incentives, more able teachers often avoid teaching in those schools or leave once they have gained enough experience, resulting in very high turnover rates in many cases4 (Table 2.2) and in concerns about the continuity of education programmes in such schools (OECD, 2005).
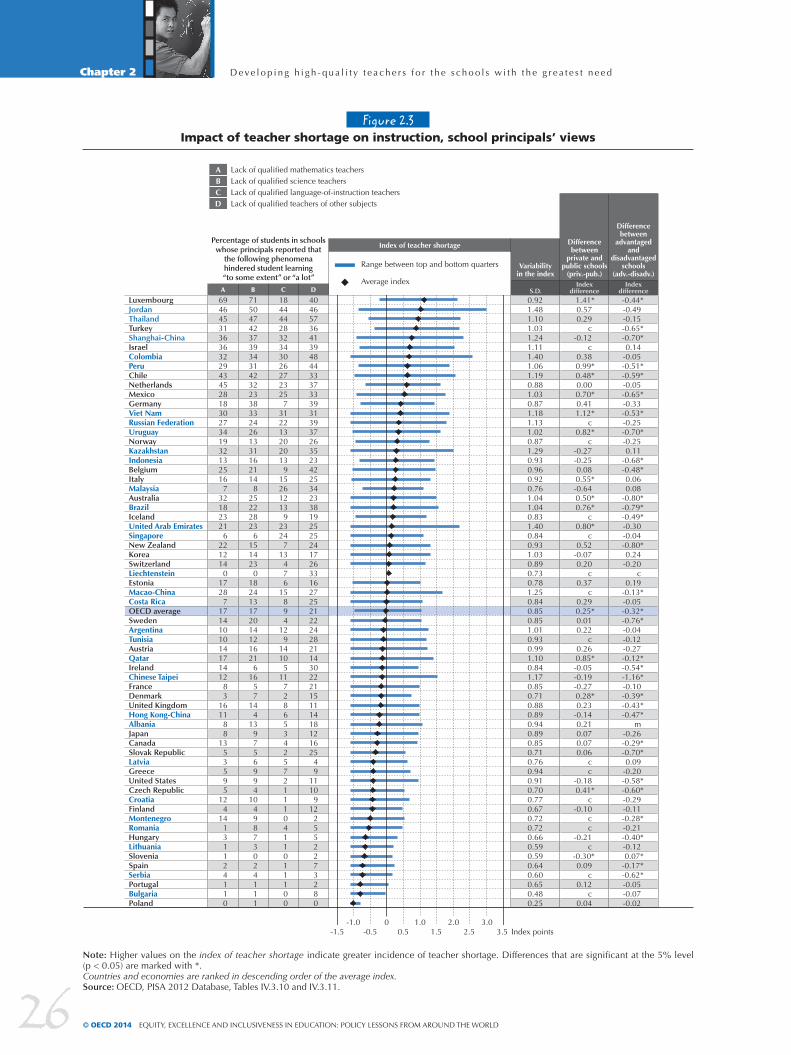
In order to assess how school principals perceive the adequacy of the supply of teachers in their schools, PISA asked them to report on the extent to which they think instruction in their school is hindered by a lack of qualified teachers and staff in key areas. A composite index of teacher shortage was created, based on related questions, such that the index has an average of 0 and a standard deviation of 1 for OECD countries. Higher values on the index indicate that principals feel that there are more problems with instruction because of teacher shortages.5
Teacher shortages vary within countries, as measured by the standard deviation of the index of teacher shortage (Figure 2.3). Differences in teacher shortage between advantaged and disadvantaged schools are particularly large (greater than 0.5 index point, or half the standard deviation of this index) in Australia, Brazil, Chile, the Czech Republic, Indonesia, Ireland, Mexico, New Zealand, Peru, Serbia, Shanghai-China, the Slovak Republic, Sweden, Turkey, the United States, Uruguay and Viet Nam (OECD, 2013a, Table IV.3.11). In 14 countries and economies, principals of public schools tended to report more teacher shortage than principals of private schools did. In all of these countries and economies, except Italy and the United Arab Emirates, principals of disadvantaged schools reported more teacher shortage than principals of advantaged schools (OECD, 2013a, Table IV.3.11).
D e ve l o p i n g h i g h - q u a l i t y t e a ch e r s f o r t h e s ch o o l s w i t h t h e g r e a t e s t n e e d
25
Chapter 2
Equity, ExcEllEncE and inclusivEnEss in Education: Policy lEssons from around thE World © OECD 2014
Table 2.1Teachers’ and schools’ average socio-economic background
Disadvantaged schools are more likely to have more or better resourcesWithin-country correlation is not statistically significantAdvantaged schools are more likely to have more or better resources
simple correlation between the school mean socio-economic background and:
percentage of full-time teacherspercentage of teachers with university-level degree
among all full-time teachersAustralia -0.21 0.02Austria -0.13 0.64Belgium -0.18 0.58Canada 0.01 0.03Chile -0.04 0.25Czech Republic -0.32 0.37Denmark 0.01 0.16Estonia 0.14 0.00Finland 0.17 -0.01France w wGermany -0.15 -0.02Greece -0.11 0.24Hungary -0.33 0.07Iceland 0.20 0.30Ireland 0.12 -0.08Israel -0.08 0.20Italy -0.06 0.13Japan -0.14 0.20Korea -0.14 -0.03Luxembourg -0.16 0.39Mexico -0.09 -0.04Netherlands -0.34 0.62New Zealand -0.04 0.07Norway -0.05 0.15Poland -0.02 -0.05Portugal 0.14 0.04Slovak Republic -0.09 -0.21Slovenia 0.46 0.55Spain -0.29 mSweden 0.05 -0.04Switzerland -0.11 0.24Turkey 0.12 0.04United Kingdom -0.36 -0.03United States -0.42 0.10
OECD average -0.07 0.15
Note: Data in bold if relationship is statistically different from the OECD average. m = Data are not available. These data were not submitted by the country or were collected but subsequently removed from the publication for technical reasons. w = Data have been withdrawn or have not been collected at the request of the country concerned.Source: OECD (2010a), PISA 2009 Results: Overcoming Social Background: Equity in Learning Opportunities and Outcomes (Volume II).
Table 2.2Disadvantaged schools have difficulties attracting and retaining teachers
Country studied findings study
Australia Rural schools with higher proportions of aboriginal students are seen as less desirable, making it harder to recruit and retain teachers.
Michaelson, 2006
France Better qualified teachers are less likely to teach in schools containing minority and disadvantaged children.
OECD, 2005
Japan School leaders report that it is difficult to recruit and retain teachers to work in schools with children born abroad.
Gordon, 2006
New Zealand Teachers in schools with higher proportions of low socio-economic status students have higher propensity to leave.
Richie, 2004
Norway Schools with higher levels of minority students are harder to staff and teachers at schools with higher proportions of minority students and students with special needs are significantly more likely to leave.
Bonesrønning, Falch and Strøm, 2005
United States Teachers in schools with higher proportions of low-SES or minority students have higher propensity to leave.
Hanushek, Kain and Rivkin, 2004
D e ve l o p i n g h i g h - q u a l i t y t e a ch e r s f o r t h e s ch o o l s w i t h t h e g r e a t e s t n e e d
26
Chapter 2
© OECD 2014 Equity, ExcEllEncE and inclusivEnEss in Education: Policy lEssons from around thE World
Figure 2.3Impact of teacher shortage on instruction, school principals’ views
Note: Higher values on the index of teacher shortage indicate greater incidence of teacher shortage. Differences that are significant at the 5% level (p < 0.05) are marked with *.Countries and economies are ranked in descending order of the average index.Source: OECD, PISA 2012 Database, Tables IV.3.10 and IV.3.11.
D
4046573641394844333733393139372635234225342338192525241726331627252122242821143022211511141812162549
11109
122552273280
C
18444428323430262723257
3122132020139
152612139
23247
13476
15894
129
14105
11728653425721110411011100
B
71504742373934314232233833242613311621148
252228236
1514230
1824131720141216216
1657
144
139756994
1049873024111
A
69464531363632294345281830273419321325167
321823216
2212140
17287
171410101417141283
161188
1353595
124
14131124110
LuxembourgJordanThailandTurkeyShanghai-ChinaIsraelColombiaPeruChileNetherlandsMexicoGermanyViet NamRussian FederationUruguayNorwayKazakhstanIndonesiaBelgiumItalyMalaysiaAustraliaBrazilIcelandUnited Arab EmiratesSingaporeNew ZealandKoreaSwitzerlandLiechtensteinEstoniaMacao-ChinaCosta RicaOECD averageSwedenArgentinaTunisiaAustriaQatarIrelandChinese TaipeiFranceDenmarkUnited KingdomHong Kong-ChinaAlbaniaJapanCanadaSlovak RepublicLatviaGreeceUnited StatesCzech RepublicCroatiaFinlandMontenegroRomaniaHungaryLithuaniaSloveniaSpainSerbiaPortugalBulgariaPoland
a Lack of qualified mathematics teachersB Lack of qualified science teachersC Lack of qualified language-of-instruction teachersd Lack of qualified teachers of other subjects
Percentage of students in schools whose principals reported that
the following phenomena hindered student learning “to some extent” or “a lot”
difference between
advantaged and
disadvantaged schools
(adv.-disadv.) Index
difference-0.44*-0.49-0.15-0.65*-0.70*0.14
-0.05-0.51*-0.59*-0.05-0.65*-0.33-0.53*-0.25-0.70*-0.250.11
-0.68*-0.48*0.060.08
-0.80*-0.79*-0.49*-0.30-0.04-0.80*0.24
-0.20c
0.19-0.13*-0.05-0.32*-0.76*-0.04-0.12-0.27-0.12*-0.54*-1.16*-0.10-0.39*-0.43*-0.47*
m-0.26-0.29*-0.70*0.09
-0.20-0.58*-0.60*-0.29-0.11-0.28*-0.21-0.40*-0.120.07*
-0.17*-0.62*-0.05-0.07-0.02
difference between
private and public schools
(priv.-pub.)Index
difference1.41*0.570.29
c-0.12
c0.380.99*0.48*0.000.70*0.411.12*
c0.82*
c-0.27-0.250.080.55*-0.640.50*0.76*
c0.80*
c0.52
-0.070.20
c0.37
c0.290.25*0.010.22
c0.260.85*-0.05-0.19-0.270.28*0.23
-0.140.210.070.070.06
cc
-0.180.41*
c-0.10
cc
-0.21c
-0.30*0.09
c0.12
c0.04
variability in the index
S.D.0.921.481.101.031.241.111.401.061.190.881.030.871.181.131.020.871.290.930.960.920.761.041.040.831.400.840.931.030.890.730.781.250.840.850.851.010.930.991.100.841.170.850.710.880.890.940.890.850.710.760.940.910.700.770.670.720.720.660.590.590.640.600.650.480.25
index of teacher shortage
Range between top and bottom quarters
Average index
Index points-1.5 -0.5 1.5 2.5 3.50.5-1.0 0 1.0 2.0 3.0
D e ve l o p i n g h i g h - q u a l i t y t e a ch e r s f o r t h e s ch o o l s w i t h t h e g r e a t e s t n e e d
27
Chapter 2
Equity, ExcEllEncE and inclusivEnEss in Education: Policy lEssons from around thE World © OECD 2014
On average across OECD countries, principals of schools located in rural areas reported more teacher shortage than principals of schools in towns, and they, in turn, reported more teacher shortage than principals of schools in cities. This is observed in Iceland, Mexico and Qatar. However, in Chile, the Czech Republic, Hungary, Romania and the Slovak Republic, principals of schools located in towns and cities reported similar levels of teacher shortage, while principals of schools located in rural areas reported more teacher shortage than principals of schools in towns did. In contrast, in Australia, Brazil, Canada, Columbia, Finland, Indonesia, Ireland, Montenegro, New Zealand, Norway, Peru, Chinese Taipei, the United Arab Emirates, Uruguay and Viet Nam, principals of schools located in rural areas and in towns reported similar levels of teacher shortage, while principals of schools located in cities reported less teacher shortage than principals of schools in towns. In 34 countries and economies, the level of teacher shortage reported by principals does not vary by where school is located (OECD, 2013a, Table IV.3.11).
PoInTerS for PolICy anD PraCTICe
Developing high-quality teachers and matching teacher supply with demand are fraught with challenges: how to expand the pool of qualified teachers, how to address shortages in specific subjects, how to recruit teachers to the places where they are most needed, how to allocate teachers to schools equitably and efficiently, and how to retain qualified teachers over time. Common to most education systems that demonstrate high performance and low between-school variation in performance in PISA is that they attract teachers equitably across the school system, including to hard-to-staff schools.
Provide adequate resources to address disadvantage
As discussed above, after a certain threshold of expenditure, the way resources are spent is more important than the total amount spent. Even in the case of disadvantaged students, quasi-experimental studies in the Netherlands showed that extra resources alone, for personnel and for computers, have not shown substantial positive effects (Oosterbeek et al., 2007).
Resourcing schools is technically complex and politically sensitive. Students and schools have different socio-economic profiles and varying needs, and funding schemes need to reflect these. While it is generally agreed that differences in instructional costs need to be taken into consideration in funding allocations, there are debates about the amount of additional funding that schools in which disadvantaged students are concentrated should receive. As noted above, according to principals’ reports in PISA, disadvantaged schools in OECD countries have lower student-teacher ratios but less experienced and qualified teachers. Since the literature on resourcing education indicates that high-quality teaching has a greater impact than some resource-intensive practices, such as having smaller classes (Rivkin, Hanushek and Kain, 2005), it is likely that current funding arrangements are not optimal for disadvantaged students.
There are different methods to determine the allocation of resources that schools receive:
• Administrative discretion is based on an individual assessment of each school. Although it can serve schools’ needs more accurately, it requires extensive knowledge of each school and measures to prevent misuse of resources. For example, bidding by submitting budget estimates encourages schools to submit inflated demands, which can lead to arbitrary cuts by funding agencies.
• Incremental costs is another type of school funding scheme that takes into consideration the historical expenditure to calculate the allocation for the following year; but this offers no incentive for schools to reduce their expenditure or increase their efficiency. Administrative discretion and incremental costs are often combined, and usually these are used in centralised systems.
• Formula funding relies on a mathematical formula that contains a number of variables, each of which has a cash amount attached to it to determine school budgets (Levacic, 2008). In such formulae, there are four main groups of variables used across OECD countries: student number and grade level-based; needs-based; curriculum or education programme-based; and school characteristics-based. In general, formula funding is better at ensuring equity and can be more efficient than administrative discretion because it avoids anomalies related to differences in bargaining power.
A well-designed funding formula can be an efficient, stable and transparent method of funding schools (Levacic, 2008). Formula funding combines both horizontal equity – schools with similar characteristics are funded at the same level –

D e ve l o p i n g h i g h - q u a l i t y t e a ch e r s f o r t h e s ch o o l s w i t h t h e g r e a t e s t n e e d
28
Chapter 2
© OECD 2014 Equity, ExcEllEncE and inclusivEnEss in Education: Policy lEssons from around thE World
and vertical equity – schools with greater need receive higher resources. However, this type of funding may be difficult to implement and may not cover all schools’ costs (infrastructure, staff, etc.). For example, funding formulae require transparency and must be sufficiently detailed and include reliable data (Levacic, 2008). Progressive voucher schemes can also raise extra resources for the students and schools that need them most (Box 2.1).
Box 2.1. Weighted student funding schemes in the Netherlands and Chile
Since 1985, primary schools in the netherlands with substantial numbers of disadvantaged students receive more funds. Although the level of funding for each school is determined by the needs of individual students, there is no requirement that schools use these extra resources directly on these students. Schools can, for example, choose to reduce the number of students per class. The “weight” of each student is determined by the parents’ education level. Empirical research conducted by Ladd and Fiske (2009) studying the Dutch funding system shows that these mechanisms have succeeded in distributing differentiated resources to schools according to their various needs. Primary schools with a high proportion of weighted students have, on average, about 58% more teachers per student, and also more support staff.
In Chile, a voucher system was initially introduced with equal weights for all students. Research indicates that the system significantly increased segregation between schools and also resulted in rising levels of student debt (Elacqua, 2009; Hsieh and Urquiola, 2006). In 2008, a weighted voucher scheme was adopted to provide more resources for students from disadvantaged backgrounds and to schools with high concentrations of disadvantaged students. The value of the voucher is 50% higher for students from disadvantaged backgrounds and for indigenous children; in 2011, the value of the voucher was increased 21% for the most disadvantaged students (approximately 40% of the recipients). In addition, there is a quality-assurance system that includes improvement plans for schools that accept this voucher. Top-up payments by parents of students who are not considered disadvantaged are allowed in publicly subsidised private schools. Preliminary evidence (Elacqua, 2009) finds that the weighted voucher can mitigate the segregation effects introduced by universal vouchers. The problems with Chile’s voucher system (Treviño et al., 2013) have been so great that student and teacher mobilisations throughout the country have led the incoming government to pledge to reverse the system and increase subsidies for public universities.
Sources: Elacqua (2009); Hsieh and Urquiola (2006); Ladd, Fiske and Ruijs (2009); Treviño (2013).
Sometimes, an insufficient amount of funding leads to misallocations. A study in the United Kingdom found that local governments divert school funding intended for disadvantaged students to other purposes (Sibieta, Chowdry and Muriel, 2008).6 And those education authorities with greater fiscal capacity can supplement expenditures on education from their own tax revenues, increasing economic inequalities between jurisdictions (Chetty and Friedman, 2011). For example, in Austria and the Czech Republic there are significant differences in education expenditures across regions (Steiner and the Styrian Association for Education and Economics, 2011; Strakova, Simonova and Polechova, 2011).
In systems with large between-school variation and a concentration of low-performing schools, locally based support structures can be created (Boxes 2.2 and 2.3).
In some countries, targeted programmes like these already represent a significant share of education budgets. In the United Kingdom, for example, since April 2011, schools receive an additional GBP 430 a year for every student who is entitled to a free school meal (a measure of disadvantage), and the schools decide how the money is spent. Targeted programmes separate from the funding formula, together with strong accountability measures, help to ensure that schools spend the additional resources on disadvantaged students (Kendall et al., 2005; DfES and H.M. Treasury, 2005; Simkins, 2004).
D e ve l o p i n g h i g h - q u a l i t y t e a ch e r s f o r t h e s ch o o l s w i t h t h e g r e a t e s t n e e d
29
Chapter 2
Equity, ExcEllEncE and inclusivEnEss in Education: Policy lEssons from around thE World © OECD 2014
Box 2.2. Special education areas in France
France’s special education areas were introduced in 1981 and were initially conceived to promote education projects and partnerships with local stakeholders in an effort to improve academic performance (Bénabou, Kramarz and Prost, 2009). A hallmark of area-based support was the Zones d’Éducation Prioritaire (ZEP, “Priority Education Zones”), which involved 15% of students in primary and lower secondary schools in more than 800 areas. The additional resources were mainly aimed at reducing class size and giving incentives to teachers and extra funding to the schools to enable them to provide supplementary hours of instruction. Schools had discretion on resource allocation. The additional resources had a very limited impact on academic performance, however. The quality of teachers diminished as salary bonuses were insufficient to attract more experienced teachers, and the socio-economic composition of ZEP schools worsened.
These results showed the need to concentrate more resources on fewer schools. In the school year 2006/07, the existing networks were replaced by two networks, differentiated by levels of need: Réseaux de Réussite Scolaire (RRS, “Networks of School Success”), which include around 14% of students in compulsory schooling, and Réseaux d’Ambition Réussite (RAR, “Networks of Ambition Success”), which are confined to the most disadvantaged schools. The RAR provides 16% higher expenditure per student than the average. RAR schools receive additional funding mainly for supplementary teachers (90%) and bonuses (8%). In the school year 2010/11 a new programme was implemented aimed at spreading innovations in pedagogy, school life and human resources, and providing a safer environment (Moisan, 2011).
Sources: Bénabou, Kramarz and Prost (2009); Greek Ministry of Education (2011); Moisan (2011); O’Brien (2007).
Box 2.3. Funding disadvantaged students and their schools in Chile
In Chile, a funding programme targeting disadvantaged students and their schools, the Subvención Escolar Preferencial (SEP), was introduced in 2008. The larger share of educational expenditure is distributed per student, topping-up a flat-rate voucher. In addition, there is an allocation for schools that enrol a significant number of disadvantaged students. Acceptance of these supplementary funds is voluntary but leads to mandatory technical support and accountability to ensure value for money.
Schools choosing to receive the supplement are required to elaborate a plan for educational improvement, setting objectives for improvement in education outcomes and defining measures to support students with learning difficulties. In addition, participating schools are not permitted to select students by ability or socio-economic background, and cannot charge top-up fees for vulnerable students.
SEP schools are classified into three categories: autonomous, emerging or recovering schools, based on the results of a national standardised test (SIMCE) and, to a lesser extent, other performance criteria. Autonomous schools are allowed to design their own improvement plan and are accountable for the results. Emerging and recovering schools are supported by the Education Ministry in drafting their progression plans, and recommendations may be prescriptive in some cases. Improvement plans should contain strategies and actions on curricula, leadership, climate and funding for the subsequent four years. Schools have access to technical assistance for school improvement, including through certified private providers, and an quality-assessment system. Information is provided to parents on the progress of their children and their school.
The additional funding that schools can receive is significant. An autonomous school where fewer than 15% of the students are disadvantaged receives an approximately 50% increase in the school subsidy for each vulnerable child. If the concentration of disadvantaged students is at least 60%, schools can receive an extra 10% of the base voucher for every student, including those who are not classified as vulnerable.
Source: Brandt (2010).

D e ve l o p i n g h i g h - q u a l i t y t e a ch e r s f o r t h e s ch o o l s w i t h t h e g r e a t e s t n e e d
30
Chapter 2
© OECD 2014 Equity, ExcEllEncE and inclusivEnEss in Education: Policy lEssons from around thE World
Create a teaching force that reflects student demography and secure high-quality teaching in disadvantaged schools
While student populations in OECD countries have become more diverse, the teaching force has remained relatively homogeneous. In all OECD countries, teachers tend to be female, middle class, and from the majority population. Although neither race nor ethnicity determines the quality of a teacher, there is evidence to suggest that teachers from minority backgrounds can serve as powerful role models for their diverse students (OECD, 2010b; Sleeter and Thao, 2007). It has been argued that the self-perception of being a minority can lead to a better understanding of other peoples’ cultures and of diversity itself (Kohl, 2009; OECD, 2010b). A number of programmes have been created to attract and retain minority teachers. In the United Kingdom, for example, the “Aspiring to Lead” programme is aimed at black and minority ethnic teachers in their second to fifth years of teaching who are interested in developing their leadership skills and knowledge (Burns, 2010). Similar programmes can be found in Canada, the United States and other OECD countries. These aim to build on the strengths of diverse teachers as well as provide role models to attract students from minority populations to enter the teaching profession.
Prepare teachers for work in disadvantaged schools
Both initial teacher education and continuous professional development are critical to ensure that teachers acquire the skills and knowledge that enable them to respond to every classroom situation. This is particularly important for teachers in disadvantaged schools, as they are routinely confronted with heterogeneous groups of students (OECD, 2010b).
Teacher education programmes must be context-specific (Musset, 2010) and should prepare competent teachers for disadvantaged schools. This can mean:
• reinforcing initial teacher preparation programmes, and including content in the curricula for teachers specialising in disadvantaged schools and students (OECD, 2010b);7
• designing programmes that develop teachers’ capacity to diagnose student problems and to understand the context of the schools in which they teach; and
• including practical field experience in disadvantaged schools as part of their teacher education, as evidence shows that teachers then perform better (Musset, 2010; OECD, 2010b).
For example, in Finland, all teachers are trained in diagnosing students with learning difficulties and in adapting their teaching to their students’ varying learning needs and styles (OECD, 2011b).8 Teacher education in Sweden includes specific preparation for teachers to teach students from diverse backgrounds. Where teachers don’t receive this specific training, student outcomes may suffer. In Germany, for example, one of the weaknesses that may explain the country’s relatively poor results on the PISA 2000 test was that the teachers were ill-equipped to teach students from an immigrant background (OECD, 2011b).
Another solution can be the availability of alternative pathways into the teaching profession. Some programmes specifically target disadvantaged schools, and aim to attract high academic achievers to teach in these schools by providing a direct route into them (Box 2.4).
Teachers working in disadvantaged schools also need training in communicating with parents and maintaining class environments that are conducive to learning. For example, the benefits of reducing class size may be undermined if teachers do not receive adequate training in effective pedagogical practices for smaller classes (Paul and Troncin, 2004).
Provide mentoring to teachers in disadvantaged schools
Many countries offer induction programmes with mentoring schemes, as research shows that both new teachers and experienced teachers profit from them.9 Induction and mentoring are particularly important in disadvantaged schools and may improve teacher effectiveness and increase retention of novice teachers. More experienced teachers can help new teachers to understand more quickly the main challenges of a particular school and its students, and help these teachers develop adequate pedagogical and relational strategies to respond to students’ needs. Effective mentoring and induction programmes can also lower the attrition rate (Johnson and Birkeland, 2003) of new teachers and help them integrate better into the school staff. Mentors, themselves, also need good preparation programmes (Hobson et al., 2009) to assume their role effectively. Box 2.5 summarises promising examples of mentoring and induction programmes.
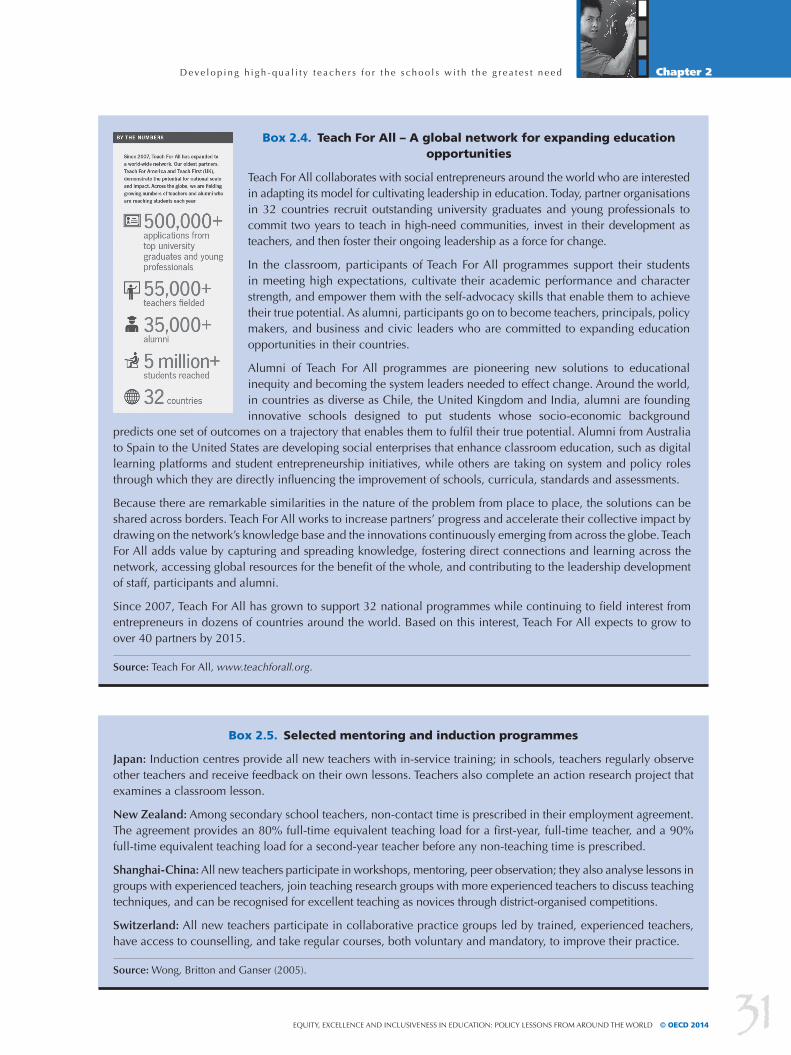
D e ve l o p i n g h i g h - q u a l i t y t e a ch e r s f o r t h e s ch o o l s w i t h t h e g r e a t e s t n e e d
31
Chapter 2
Equity, ExcEllEncE and inclusivEnEss in Education: Policy lEssons from around thE World © OECD 2014
Box 2.4. Teach For All – A global network for expanding education opportunities
Teach For All collaborates with social entrepreneurs around the world who are interested in adapting its model for cultivating leadership in education. Today, partner organisations in 32 countries recruit outstanding university graduates and young professionals to commit two years to teach in high-need communities, invest in their development as teachers, and then foster their ongoing leadership as a force for change.
In the classroom, participants of Teach For All programmes support their students in meeting high expectations, cultivate their academic performance and character strength, and empower them with the self-advocacy skills that enable them to achieve their true potential. As alumni, participants go on to become teachers, principals, policy makers, and business and civic leaders who are committed to expanding education opportunities in their countries.
Alumni of Teach For All programmes are pioneering new solutions to educational inequity and becoming the system leaders needed to effect change. Around the world, in countries as diverse as Chile, the United Kingdom and India, alumni are founding innovative schools designed to put students whose socio-economic background
predicts one set of outcomes on a trajectory that enables them to fulfil their true potential. Alumni from Australia to Spain to the United States are developing social enterprises that enhance classroom education, such as digital learning platforms and student entrepreneurship initiatives, while others are taking on system and policy roles through which they are directly influencing the improvement of schools, curricula, standards and assessments.
Because there are remarkable similarities in the nature of the problem from place to place, the solutions can be shared across borders. Teach For All works to increase partners’ progress and accelerate their collective impact by drawing on the network’s knowledge base and the innovations continuously emerging from across the globe. Teach For All adds value by capturing and spreading knowledge, fostering direct connections and learning across the network, accessing global resources for the benefit of the whole, and contributing to the leadership development of staff, participants and alumni.
Since 2007, Teach For All has grown to support 32 national programmes while continuing to field interest from entrepreneurs in dozens of countries around the world. Based on this interest, Teach For All expects to grow to over 40 partners by 2015.
Source: Teach For All, www.teachforall.org.
Box 2.5. Selected mentoring and induction programmes
Japan: Induction centres provide all new teachers with in-service training; in schools, teachers regularly observe other teachers and receive feedback on their own lessons. Teachers also complete an action research project that examines a classroom lesson.
New Zealand: Among secondary school teachers, non-contact time is prescribed in their employment agreement. The agreement provides an 80% full-time equivalent teaching load for a first-year, full-time teacher, and a 90% full-time equivalent teaching load for a second-year teacher before any non-teaching time is prescribed.
Shanghai-China: All new teachers participate in workshops, mentoring, peer observation; they also analyse lessons in groups with experienced teachers, join teaching research groups with more experienced teachers to discuss teaching techniques, and can be recognised for excellent teaching as novices through district-organised competitions.
Switzerland: All new teachers participate in collaborative practice groups led by trained, experienced teachers, have access to counselling, and take regular courses, both voluntary and mandatory, to improve their practice.
Source: Wong, Britton and Ganser (2005).
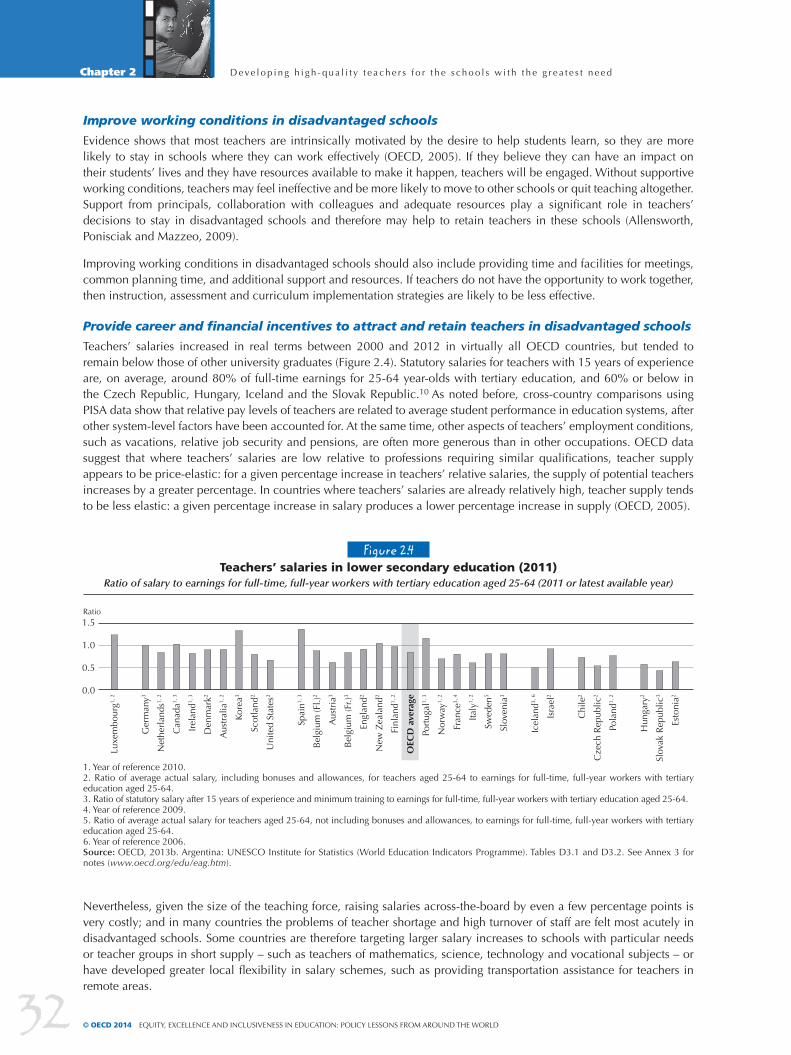
D e ve l o p i n g h i g h - q u a l i t y t e a ch e r s f o r t h e s ch o o l s w i t h t h e g r e a t e s t n e e d
32
Chapter 2
© OECD 2014 Equity, ExcEllEncE and inclusivEnEss in Education: Policy lEssons from around thE World
Improve working conditions in disadvantaged schools
Evidence shows that most teachers are intrinsically motivated by the desire to help students learn, so they are more likely to stay in schools where they can work effectively (OECD, 2005). If they believe they can have an impact on their students’ lives and they have resources available to make it happen, teachers will be engaged. Without supportive working conditions, teachers may feel ineffective and be more likely to move to other schools or quit teaching altogether. Support from principals, collaboration with colleagues and adequate resources play a significant role in teachers’ decisions to stay in disadvantaged schools and therefore may help to retain teachers in these schools (Allensworth, Ponisciak and Mazzeo, 2009).
Improving working conditions in disadvantaged schools should also include providing time and facilities for meetings, common planning time, and additional support and resources. If teachers do not have the opportunity to work together, then instruction, assessment and curriculum implementation strategies are likely to be less effective.
Provide career and financial incentives to attract and retain teachers in disadvantaged schools
Teachers’ salaries increased in real terms between 2000 and 2012 in virtually all OECD countries, but tended to remain below those of other university graduates (Figure 2.4). Statutory salaries for teachers with 15 years of experience are, on average, around 80% of full-time earnings for 25-64 year-olds with tertiary education, and 60% or below in the Czech Republic, Hungary, Iceland and the Slovak Republic.10 As noted before, cross-country comparisons using PISA data show that relative pay levels of teachers are related to average student performance in education systems, after other system-level factors have been accounted for. At the same time, other aspects of teachers’ employment conditions, such as vacations, relative job security and pensions, are often more generous than in other occupations. OECD data suggest that where teachers’ salaries are low relative to professions requiring similar qualifications, teacher supply appears to be price-elastic: for a given percentage increase in teachers’ relative salaries, the supply of potential teachers increases by a greater percentage. In countries where teachers’ salaries are already relatively high, teacher supply tends to be less elastic: a given percentage increase in salary produces a lower percentage increase in supply (OECD, 2005).
Figure 2.4Teachers’ salaries in lower secondary education (2011)
Ratio of salary to earnings for full-time, full-year workers with tertiary education aged 25-64 (2011 or latest available year)
1. Year of reference 2010.2. Ratio of average actual salary, including bonuses and allowances, for teachers aged 25-64 to earnings for full-time, full-year workers with tertiary education aged 25-64.3. Ratio of statutory salary after 15 years of experience and minimum training to earnings for full-time, full-year workers with tertiary education aged 25-64.4. Year of reference 2009.5. Ratio of average actual salary for teachers aged 25-64, not including bonuses and allowances, to earnings for full-time, full-year workers with tertiary education aged 25-64.6. Year of reference 2006.Source: OECD, 2013b. Argentina: UNESCO Institute for Statistics (World Education Indicators Programme). Tables D3.1 and D3.2. See Annex 3 for notes (www.oecd.org/edu/eag.htm).
1.5
1.0
0.5
0.0
Ratio
Luxe
mbo
urg1,
2
Ger
man
y3
Net
herl
ands
1, 2
Can
ada1,
3
Irel
and1,
3
Den
mar
k2
Aus
tral
ia1,
2
Kore
a3
Scot
land
2
Uni
ted
Stat
es2
Spai
n1, 3
Bel
gium
(Fl.)
2
Aus
tria
3
Bel
gium
(Fr.)
3
Engl
and2
New
Zea
land
2
Finl
and1,
2
OEC
D a
vera
ge
Port
ugal
1, 3
Nor
way
1, 2
Fran
ce3,
4
Italy
1, 2
Swed
en5
Slov
enia
3
Icel
and3,
6
Isra
el2
Chi
le2
Cze
ch R
epub
lic2
Pola
nd1,
2
Hun
gary
2
Slov
ak R
epub
lic3
Esto
nia2
Nevertheless, given the size of the teaching force, raising salaries across-the-board by even a few percentage points is very costly; and in many countries the problems of teacher shortage and high turnover of staff are felt most acutely in disadvantaged schools. Some countries are therefore targeting larger salary increases to schools with particular needs or teacher groups in short supply – such as teachers of mathematics, science, technology and vocational subjects – or have developed greater local flexibility in salary schemes, such as providing transportation assistance for teachers in remote areas.

D e ve l o p i n g h i g h - q u a l i t y t e a ch e r s f o r t h e s ch o o l s w i t h t h e g r e a t e s t n e e d
33
Chapter 2
Equity, ExcEllEncE and inclusivEnEss in Education: Policy lEssons from around thE World © OECD 2014
Figure 2.5Criteria determining base salary and additional payments for teachers in public institutions (2011)
experience Criteria based on teaching conditions/responsibilities
year
s of
exp
erie
nce
as
a t
each
er
man
agem
ent
resp
onsi
bilit
ies
in
addi
tion
to
teac
hing
du
ties
teac
hing
mor
e cl
asse
s or
hou
rs t
han
requ
ired
by
full-
tim
e co
ntra
ct
spec
ial t
asks
(c
aree
r gu
idan
ce
or c
ouns
ellin
g)
teac
hing
in a
di
sadv
anta
ged,
rem
ote
or h
igh-
cost
are
a (l
ocat
ion
allo
wan
ce)
spec
ial a
ctiv
itie
s
(e.g
. spo
rts
and
dram
a cl
ubs,
hom
ewor
k cl
ubs,
su
mm
er s
choo
l, et
c.)
teac
hing
stu
dent
s w
ith
spec
ial e
duca
tiona
l nee
ds
(in r
egul
ar s
choo
ls)
teac
hing
cou
rses
in
a p
arti
cula
r fi
eld
(1) (2) (3) (4) (5) (6) (7) (8) (9) (10) (11) (12) (13) (14) (15) (16) (17) (18) (19) (20) (21) (22) (23) (24)
OEC
D Australia _ _ _ s
Austria _
Belgium (Fl.) _
Belgium (Fr.) _
Canada _
Chile _
Czech Republic _ _ _
Denmark _ _ _
England _ _ _ _ _
Estonia _ _ _
Finland _ _ _ _
France _ _ _
Germany _ _
Greece _
Hungary
Iceland _ _ _ _
Ireland _ _ _
Israel _ _ _ _ _ _ _
Italy _
Japan _
Korea _
Luxembourg _ _
Mexico _ _ _ _ _ _
Netherlands _ _ _ _ _ _ _ _
New Zealand _
Norway _ _
Poland _
Portugal _ _
Scotland _
Slovak Republic _ _
Slovenia _ _
Spain _
Sweden _ _ _ _
Switzerland _ _ _
Turkey _ _
United States _ _
Oth
er G
20 Argentina m m m m m m m m m m m m m m m m m m m m m m m mBrazil m m m m m m m m m m m m m m m m m m m m m m m mChina m m m m m m m m m m m m m m m m m m m m m m m mIndia m m m m m m m m m m m m m m m m m m m m m m m mIndonesia _ _ _ _ _ _ _ _ Russian Federation _ _ _ _ _ _ _ _ Saudi Arabia m m m m m m m m m m m m m m m m m m m m m m m mSouth Africa m m m m m m m m m m m m m m m m m m m m m m m m
Criteria for:– : Decisions on position in base salary scales : Decisions on supplemental payments which are paid every year
: Decisions on supplemental incidental paymentsm : Data are not availableSource: OECD, 2013b (www.oecd.org/edu/eag.htm).

D e ve l o p i n g h i g h - q u a l i t y t e a ch e r s f o r t h e s ch o o l s w i t h t h e g r e a t e s t n e e d
34
Chapter 2
© OECD 2014 Equity, ExcEllEncE and inclusivEnEss in Education: Policy lEssons from around thE World
Teachers’ views of disadvantaged schools as more difficult places to teach seem to have a major influence on their decisions to remain in or change schools (Hanushek, Kain and Rivkin, 2004). Competent and/or experienced teachers are an important resource for disadvantaged schools. In an effort to attract and recruit teachers to disadvantaged areas, specific subjects or geographic areas, many OECD countries have experience with financial incentive packages. Indeed, targeted financial incentives for teachers – salary increases and other types of additional financial payments – are often cited as important for addressing the unattractive working conditions in particular sets of schools. They can also be perceived as rewards for the more challenging work teachers undertake in these schools or offset changes in demands in competing occupations by making the teaching profession more attractive. Many countries provide substantial salary allowances for teaching in difficult areas, transportation assistance for teachers in remote areas, or additional payments for teachers with skills in short supply to help ensure that all schools are staffed with teachers of similar quality (Figure 2.5). This type of mechanism can be more cost efficient than across-the-board salary incentives, and can serve better the purpose, if they are well designed.
Another way of retaining teachers, particularly those who want to continue teaching, is to offer them a chance to progress in their careers without having to assume more administrative tasks. In Singapore, the “Education Service Professional Development and Career Plan” includes a career path for teachers who want to remain teachers. The Teaching Track allows teachers to remain in the classroom and advance to a new level of Master Teacher (OECD, 2013c). New Zealand is introducing differentiated career paths for teachers and school principals that are mirrored in pay structures (Box 2.6). The bottom line is that education authorities should promote the notion that it is a smart career move for teachers to remain working in these schools – and they can support that notion with tangible rewards.
Box 2.6. Investing in educational success: New career pathways for teachers and school leaders in New Zealand
To improve achievement for all students, New Zealand is introducing, from 2015, four new roles within schools: Executive Principal, Expert Teacher, Lead Teacher and Change Principal. The roles will provide teachers with opportunities for advancement within the classroom and embed a system-wide means of sharing expertise across schools. Each role will attract significant additional remuneration for a fixed term (apart from Lead Teachers, which are permanent roles) and help recognise the most effective teachers and principals. The roles are to be underpinned by professional standards.
Based on a new model of collaboration, communities of schools will work together to identify and strive to achieve specific achievement objectives. Each community of schools will have an Executive Principal and an allocation of Expert and Lead Teachers.
Executive Principals will be highly effective school leaders, appointed to provide leadership across a community of schools. They will support and mentor the other principals in these schools with responsibilities linked to specific objectives for student achievement.
Expert Teachers will be highly effective teachers, capable of providing professional practice leadership. They will work with teachers inside classrooms across their community of schools to help improve practice and student achievement.
Lead Teachers will be highly capable teachers, with a proven track record of accelerating achievement, who will act as a role model for teachers within their own schools and the other schools in their community of schools. Their classrooms will be open for other teachers, including beginning teachers, to observe and learn from their practice.
Change Principals will be exceptional school principals with proven capability in improving student and school performance in challenging situations. They will be employed to lift achievement in specific schools that are struggling. An additional allowance will be available to encourage highly effective principals to select schools based on the size of the challenge rather than the size of the school.
In addition to these new roles, all schools will be given additional funding to provide classroom release time for teachers to work with the expert and lead teachers on professional practice.
Source: New Zealand Ministry of Education.

D e ve l o p i n g h i g h - q u a l i t y t e a ch e r s f o r t h e s ch o o l s w i t h t h e g r e a t e s t n e e d
35
Chapter 2
Equity, ExcEllEncE and inclusivEnEss in Education: Policy lEssons from around thE World © OECD 2014
In Chile, Denmark, England, Estonia, Finland, France, Ireland, Israel, Mexico, the Netherlands, Sweden, Turkey and the United States, additional payments typically have an impact on the teacher’s base salary (in Sweden, the government only sets a minimum starting salary and pay is negotiated between the principal and the teacher; see Box 2.7). In Australia, Denmark, England, Estonia, Finland, France, Greece, Hungary, Ireland, Israel, Italy, Japan, the Netherlands, Portugal, Slovak Republic and Switzerland, they tend to take the form of extra payments offered yearly or a single time. Denmark, England, Finland, Korea, Mexico, the Netherlands, Sweden and the United States offer additional payments, usually on an annual basis, for teachers who teach in certain fields in which there are teacher shortages. In some cases, teachers receive additional payments to offset the high cost of living in certain areas.11
Box 2.7. In Sweden, pay is now negotiated between the principal and the teacher
One of the most radical approaches to compensation systems has been implemented in Sweden, where the federal government establishes minimum starting salaries and leaves the decisions about individual teachers’ salaries to be negotiated annually by the principal and the teacher. If the teacher requests assistance, the teachers’ union can participate in the negotiation. In Sweden, the centrally bargained fixed-pay scheme for teachers was abolished in 1995 as part of a package designed to enhance local autonomy and flexibility in the school system. The government committed itself to raising teachers’ salaries substantially over a five-year period, but on the condition that not all teachers received the same raise. This means that there is no fixed upper limit and only a minimum basic salary is centrally negotiated, along with the aggregate rise in the teacher-salary bill. Salaries are negotiated when a teacher is hired, and teacher and employer agree on the salary to be paid at the beginning of the term of employment. The individual negotiation involves: (1) teachers’ qualification areas: teachers in upper secondary schools have higher salaries than teachers in compulsory schools or teachers in pre-schools; (2) the labour market situation: in regions where teacher shortages are more acute, teachers get higher salaries; the same occurs for certain subjects like mathematics or science; (3) the performance of the teacher: the collective central agreement requires that pay raises be linked to improved performance, allowing schools to differentiate the pay of teachers with similar tasks; and (4) the range of responsibilities of teachers: principals can reward teachers if they work harder and take up more tasks than generally expected.
There is now much greater variety in teachers’ pay in Sweden, with those teachers in areas of shortage and with higher demonstrated performance able to negotiate a higher salary. The scheme is underpinned by a system of central government grants to ensure that low-income municipalities are able to compete effectively for teachers and other staff in the service sectors of the municipality. Sweden, with its individual teacher pay system introduced in 1995, provides an interesting example of a country that has attempted to combine a strong tradition of teacher unionism and consultative processes with opportunities for flexible responses and non-standardised working conditions at the school level. The system was at first strongly contested by unions and teacher organisations, but now enjoys an over 70% approval rate among unionised teachers.
Source: National Advisory Committee for the Ministry of Education and Science (2003).
The incentives need to be large enough to make a difference; their effectiveness depends partly on the level of teachers’ salaries relative to other professions (Chevalier, Dolton and McIntosh, 2007). For instance Hanushek, Kain and Rivkin (2004) estimate that schools in the United States with disadvantaged, black or Hispanic students may need to pay 20% or even 50% more in salary than more advantaged schools to prevent teachers from leaving. At the same time, such mechanisms need to be well-designed in order to avoid labelling certain schools as “difficult” which may discourage students, teachers and parents (Field, Kuczera and Pont, 2007).12
In addition, financial incentives are only effective when teachers can be successful in disadvantaged schools, which implies providing appropriate support and development. Combining incentives and support for new teacher candidates may be most effective for improving teacher quality and student achievement in disadvantaged schools. For example, Korea offers an additional stipend and smaller classes to teachers who work in disadvantaged schools (Darling-Hammond, 2010; Sclafani and Tucker, 2006).
D e ve l o p i n g h i g h - q u a l i t y t e a ch e r s f o r t h e s ch o o l s w i t h t h e g r e a t e s t n e e d
36
Chapter 2
© OECD 2014 Equity, ExcEllEncE and inclusivEnEss in Education: Policy lEssons from around thE World
To ensure that teachers remain in disadvantaged schools, working there can be valued formally in the teacher career path (Box 2.8). Also, if certain schools are far less appealing for teachers, to attract and retain teachers, incentives can be integrated in the salary scale rather than be awarded as a one-time additional payment.
Box 2.8. Multiple incentives to attract excellent teachers to disadvantaged schools in Korea and in North Carolina
In Korea, all teachers are held to high standards, which contributes to the country’s high levels of performance and equitable distribution of teachers. Teachers are also highly respected, and they enjoy job stability, high pay, and positive working conditions, including high levels of teacher collaboration. Disadvantaged students in Korea are actually more likely than advantaged students to be taught by high-quality mathematics teachers, as measured by characteristics such as full certification, a mathematics or mathematic education major, and with at least three years of experience. Multiple incentives are offered to candidates who work in high-need schools. Incentives include additional pay, smaller classes, less instructional time, additional credit towards future promotion to administrative positions, and the ability to choose the next school where the teacher works.
In the United States, North Carolina enacted teaching quality improvement plans with five key features: increased initial certification requirements for teachers, higher salaries tied to meeting performance standards, new teacher mentoring, ongoing professional development for all teachers, and scholarships and loan “forgiveness” programmes targeted to recruit high-quality candidates to teach in disadvantaged schools. The state also offers incentives to attract higher-quality candidates and improve the effectiveness of new and continuing teachers, through rigorous initial training, mentoring and ongoing development. North Carolina offered a retention bonus (USD 1 800) for certified mathematics, science and special education teachers in high-poverty and low-performing schools. Overall, the bonus programme reduced teacher turnover by 17%, a savings of approximately USD 36 000 for each teacher who chooses not to or delays leaving or moving schools. Before the bonus was implemented, a third of teachers in these subjects were uncertified and many were concentrated in disadvantaged schools.
Source: OECD (2012).
Non-salary strategies, such as less class-contact time or smaller classes, are also worth considering for schools in difficult areas or that have particular education needs.
Last but not least, working conditions, including class-contact time and class size, and teacher satisfaction and retention are closely related (OECD, 2009). The lack of a positive work environment contributes to the high attrition rates in certain schools, especially disadvantaged schools. School leader support, collaboration with colleagues, and adequate resources play a significant role in teachers’ decisions to stay in disadvantaged schools.
All this said, policies to encourage more people to enter teaching are unlikely to pay off if high-quality candidates find it hard to gain teaching posts. The best candidates, who are likely to have good job prospects outside teaching, may not be willing to wait in a lengthy queue or endure a succession of short-term teaching assignments in difficult schools. Well-structured and -resourced selection processes and induction programmes that ensure that the best candidates get the available jobs are therefore critical. Reducing the weight given to seniority in ranking applicants for teaching vacancies can also help to reduce the risk that new teachers will be disproportionately assigned to difficult schools.
Establish effective employment conditions
The predominant model for teacher employment in OECD countries is “career-based” public service, in which entry is competitive, career development is extensively regulated and lifetime employment is largely guaranteed.13 Where teachers are not commonly removed for unsatisfactory performance, the quality of teachers depends mainly on setting high standards of entering teacher-preparation programmes, on the quality of their initial preparation, and on the attention given to the quality of their preparation following their initial induction. Under career-based systems, the risk is that the quality of the teaching force depends excessively on getting initial recruitment and teacher education right, and that any improvement over time will take many years to affect most serving teachers. Moreover, career

D e ve l o p i n g h i g h - q u a l i t y t e a ch e r s f o r t h e s ch o o l s w i t h t h e g r e a t e s t n e e d
37
Chapter 2
Equity, ExcEllEncE and inclusivEnEss in Education: Policy lEssons from around thE World © OECD 2014
advancement can become heavily dependent on adhering to organisational norms, which helps to ensure uniformity and predictability of service and a strong group ethos, but can make systems inflexible to change and ill-equipped to serve diverse needs in different settings.
In some countries, public servants are required to apply for specific positions by showing that their competencies match specific job requirements, rather than having a guaranteed career. However, this can increase recruitment and management costs, and make it harder to develop shared values and provide consistent service. Another approach has been to introduce more contract or temporary employment positions in parallel with career-based systems. This opens up possibilities for external recruitment, provides local managers with more scope for personnel decisions, and institutes management by objectives. However, the general experience in OECD countries is that it is not easy to graft features from a markedly different system onto a well-established employment model. Those in career-based systems who have met demanding entrance criteria and accepted relatively low starting salaries can feel threatened by a less-predictable future. Those accustomed to professional status and autonomy derived from their specialist skills may feel threatened by moves to institute system-wide standards. It is also difficult to align these employment models with the needs of specific schools. However, the OECD Teachers Matter study, PISA and the annual data collection conducted for Education at a Glance identify a number of trends in country reforms that are highlighted below.
Recruit the best candidates
Successful enterprises often report that personnel selection is the most important set of decisions that they make. In the case of teaching, the evidence suggests that all too often the selection process follows rules about qualifications and seniority that bear little relationship to the qualities needed to be an effective teacher. The sheer size of school systems in many countries means that the process of teacher selection is often highly impersonal, and it is hard for teachers to build a sense of commitment to the schools to which they are appointed – or for the schools to build a sense of commitment to them. Data from PISA suggest that many of the high-performing education systems have responded by giving schools more responsibility – and accountability – for teacher selection, working conditions and development.
The OECD Teachers Matter study describes how school leaders in many of the best-performing education systems actively seek out and develop the best possible teachers and, with personal interviews and visits to schools by candidates, seek to optimise the match between applicants and school needs. The study suggests that such approaches work best where parallel steps are taken to ensure that accountability, efficiency and equity are not jeopardised, for example by developing school leaders’ skills in personnel management, providing disadvantaged schools with greater resources with which to recruit effective teachers, making information more accessible in the teacher labour market, and monitoring the outcomes of a more decentralised approach and adjusting accordingly. However, successful decentralisation of personnel management, and of school decision-making more generally, require that central and regional authorities help to ensure that teachers are adequately and equitably distributed throughout the country. It is also important to have independent appeals procedures to ensure fairness and protect teachers’ rights.
Offer flexibility…
A desire for increased flexibility in the labour market, including to accommodate maternity and paternity leave, has led to increased part-time employment across many sectors of the economy, teaching among them. On average across OECD countries, about one in six teachers works on a part-time basis in public institutions at primary and lower secondary levels of education.14 In some countries, part-time work is common among teachers: between one in five and one in three teachers in Australia, the Flemish Community of Belgium, Iceland and New Zealand work part time, as do more than one-third of teachers in Norway and Sweden, and nearly half the teachers in Germany (primary education) and the Netherlands.
In the majority of OECD countries, part-time employment opportunities depend upon a decision taken at the school level or by local authorities/government; in five of the countries with the largest proportions of part-time employment, the decision is taken at the school level. Schools recognise that their teaching and school organisation requirements change; and these countries have some flexibility in their teacher workforce that reflects these changing requirements.
There is considerable evidence that some beginning teachers, no matter how well prepared and supported, struggle to perform well on the job, or find that the job does not meet their expectations. This could be due to several factors at the teacher, classroom and school levels. On average for all countries that participated in the 2008 OECD Teaching and Learning International Survey (TALIS), new teachers reported spending 5% more time (13% for experienced teachers

D e ve l o p i n g h i g h - q u a l i t y t e a ch e r s f o r t h e s ch o o l s w i t h t h e g r e a t e s t n e e d
38
Chapter 2
© OECD 2014 Equity, ExcEllEncE and inclusivEnEss in Education: Policy lEssons from around thE World
compared with 18% for new teachers) on keeping order in the classroom. In one-third of the countries, new teachers said that they spend up to 20% of their time on classroom management and discipline. Obviously, this reduces the time spent on actual teaching and learning. New teachers spend 73% of their time on teaching, while experienced teachers said they spend 79% of their time on this core task. In addition, new teachers surveyed in TALIS 2008 reported significantly lower levels of self-efficacy than more experienced teachers. On average, this difference was statistically significant both across TALIS 2008 countries and in the Flemish Community of Belgium, Denmark, Estonia, Iceland, Ireland, Korea, Malaysia, Malta, Norway, Poland, the Slovak Republic and Turkey. Often, these differences were not quantitatively large, but they are important, given that they highlight differences in teachers’ beliefs about their effectiveness in the classroom (Jensen et al., 2012).
…and mobility
Limited mobility of teachers between schools, and between teaching and other occupations, can restrict the spread of new ideas and approaches, and result in teachers having few opportunities for diverse career experiences. It can also lead to an inequitable distribution of teachers, where teachers do not move from the most favoured schools. In some cases, the lack of mobility means that some regions of the country might have teacher shortages while others have an oversupply of teachers. In some countries, providing incentives for greater mobility and removing barriers are important policy responses. In countries with different education jurisdictions, such as federal systems, the mutual recognition of teaching qualifications is crucial, as it ensures that entitlements to leave and retirement benefits move with the teacher. Recognising the skills and experience gained outside education is also an important means of encouraging greater career mobility among teachers, as is providing flexible re-entry pathways to the profession. International mobility of teachers is also a growing phenomenon, raising issues of recognition of qualifications, certifications and procedures for recruitment and induction.15
Provide adequate information
Given the large number of teachers and applicants involved in most school systems, it is often difficult and costly for employers to use extensive information when selecting candidates. It can be just as difficult for candidates for teaching positions to have precise information about the schools to which they apply, or even about broad trends in the labour market and the available vacancies. Such information gaps and limitations mean that many application and selection decisions are sub-optimal. The development of transparent and prompt systems to close the information gaps between teachers and schools is essential for an effectively functioning teacher labour market, especially where schools are more directly involved in teacher recruitment and selection. Some countries require all teaching vacancies to be posted, and create websites where the information is centralised or establish a network of agencies to co-ordinate and foster recruitment activities. Since imbalances in the teacher labour market can take a long time to be rectified, tools for monitoring and projecting teacher demand and supply under different scenarios can also help.
Make teaching an attractive career
Matching teacher demand and supply also relies on an environment that facilitates success and that encourages effective teachers to continue in teaching, particularly when the objective is to attract talented teachers to disadvantaged schools. There is concern in a number of countries that the rates at which teachers are leaving the profession are compounding school staffing problems and leading to a loss of teaching expertise. As alluded to earlier, teacher attrition rates tend to be higher in the first few years of teaching, while they decline the longer that teachers are in the profession, before they increase again as teachers approach retirement (OECD, 2005). This implies that large private and social costs are incurred in preparing some people for a profession that they soon find does not meet their expectations. It underlines the importance for beginning teachers to participate in structured induction programmes involving a reduced teaching load, trained mentor teachers in schools, and close partnerships with teacher-education institutions, and for school systems to ensure that the criteria and processes used to allocate teachers to schools are designed such that new teachers are not concentrated in the more difficult and unpopular locations.
Although attractive salaries are clearly important for making teaching more appealing and retaining effective teachers, the OECD Teachers Matter study concludes that policy needs to address more than pay:
• Teachers place considerable emphasis on the quality of their relations with students and colleagues, on feeling supported by school leaders, on good working conditions, and on opportunities to develop their skills. Some countries are therefore placing greater emphasis on teacher evaluations to support improvements in teaching practice. While these evaluations are designed mainly to enhance classroom practice, they provide opportunities for teachers’ work to be recognised and celebrated, and help both teachers and schools to identify professional development priorities. They can also provide a basis for rewarding teachers for exemplary performance.
D e ve l o p i n g h i g h - q u a l i t y t e a ch e r s f o r t h e s ch o o l s w i t h t h e g r e a t e s t n e e d
39
Chapter 2
Equity, ExcEllEncE and inclusivEnEss in Education: Policy lEssons from around thE World © OECD 2014
• Teaching careers can benefit from greater diversification, which can help meet school needs and also provide more opportunities and recognition for teachers. In most countries, opportunities for promotion and new responsibilities are generally limited for teachers who want to stay in the classroom. Promotions generally involve teachers spending less time in classrooms, and thus reduce one of the major sources of job satisfaction. Even for those who would like to take on more roles outside the classroom, in many countries those opportunities are limited. Some countries are moving to open more career opportunities for teachers, spurred, in part, by the greater variety of school roles that have been delegated significant decision-making responsibilities. Examples from OECD countries (Box 2.9) suggest that greater career diversity can be achieved by creating new positions associated with specific tasks and roles in addition to classroom teaching, which leads to greater horizontal differentiation; and through a competency-based teaching career ladder that recognises extra responsibilities, and that leads to greater vertical differentiation. In the latter, each stage is more demanding than the prior stage, involving more responsibilities, and is open to fewer people; however, it is accompanied by a significant rise in status and, often, compensation. The recognition that schools and teachers need to perform a greater range of tasks and assume more responsibility also calls for the creation of new roles, such as mentor of beginning and trainee teachers, co-ordinator of in-service education, and school project co-ordinator.
• Greater emphasis on school leadership can help address the need for teachers to feel valued and supported in their work. In addition, well-trained professional and administrative staff can help reduce the burden on teachers, better facilities for staff preparation and planning would help build collegiality, and more flexible working conditions, especially for more experienced teachers, would prevent career burnout and retain important skills in schools.
Box 2.9. Providing greater career diversity in Australia, England and Wales, Ireland and Quebec (Canada)
In Australia, teachers typically have access to a career structure that involves two to four stages, with annual salary increments within each stage. The stages normally range from beginning teacher to experienced teacher, to experienced teacher with responsibility (leading teacher) or learning area or grade-level co-coordinator, assistant principal, principal, and regional/district office positions. Advancement from one stage to the next, especially at the higher levels, usually requires applying for widely advertised vacancies. As they move up the scale, teachers are expected to have deeper levels of knowledge, demonstrate more sophisticated and effective teaching, take on responsibility for co-curricular aspects of the school, assist colleagues and so on. By “leading teacher” stage, they are expected to demonstrate exemplary teaching, educational leadership, and the ability to initiate and manage change.
Ireland has introduced four categories of promotion posts: principal, deputy principal, assistant principal, and special duties teacher. Each has special management duties and receives both salary and time allowances. In addition to classroom teaching, assistant principals and special duties teachers have special responsibility for academic, administrative and pastoral matters, including timetabling arrangements, liaison with parents’ associations, supervising the maintenance and availability of school equipment, and so on. They are selected by a panel that consists of a principal, chair of the management board, and an independent external assessor. Over the course of their careers, about 50% of teachers can expect to receive one of these positions.
In Quebec, experienced teachers can work as mentors for student teachers. Experienced teachers coach and guide the student teachers and undertake specific training. They receive either additional pay or a reduction in classroom teaching responsibilities. About 12 000 teachers participate in the mentor programme. Some of these experienced teachers also have an opportunity to become co-researchers with university staff and to participate in collaborative studies on subjects such as teaching, learning, classroom management and student success or failure. In addition, experienced teachers may be released from some of their normal duties to provide support for less-experienced colleagues.
Source: OECD (2005).
As noted before, teachers are largely employed as public servants, and in a number of countries this is associated with tenured employment. While some may consider security of employment as an incentive to become a teacher, there may not be sufficient incentives or support systems for all teachers to continuously review their skills and improve
D e ve l o p i n g h i g h - q u a l i t y t e a ch e r s f o r t h e s ch o o l s w i t h t h e g r e a t e s t n e e d
40
Chapter 2
© OECD 2014 Equity, ExcEllEncE and inclusivEnEss in Education: Policy lEssons from around thE World
their practice, especially where there are only limited mechanisms for teacher appraisal and accountability. Tenured employment can also make it difficult to adjust teacher numbers when enrolments decline or curricula change; that may mean that the burden of adjustment falls on those who lack tenure, commonly those near the beginning of their careers. To avoid this, the licensing aspect of teaching should be emphasised and high-quality evaluation systems and professional development are in place to ensure that all teachers are engaged in professional practice that promotes student learning.
In some countries teachers need to renew their teaching certificates after a period of time, and often have to demonstrate that they have participated in on-going professional development and coursework to increase, deepen, and strengthen their knowledge. The basis for renewal can be as simple as an attestation that the teacher is continuing to meet standards of performance that are agreed throughout the teaching profession. Such systems must ensure an open, fair and transparent system of teacher appraisal, involving teaching peers, school leaders and external experts who are properly trained and resourced for these tasks – and who are themselves evaluated on a regular basis.
Underpinning these models is the view that the interests of students will be better served where teachers achieve employment security by continuing to do a good job, rather than by regulation that effectively guarantees their employment. Periodic reviews also provide the opportunity to recognise and acknowledge quality teaching. Some countries also have fair but speedy mechanisms to address ineffective teaching. Teachers in these countries have the opportunity and support to improve but, if they do not, they can be moved either into other roles or out of the school system.
Provide professional development activities that address student diversity
In many countries, the role and functioning of schools are changing – as is what is expected of teachers. They are asked to teach in increasingly multicultural classrooms. They must place greater emphasis on integrating students with special learning needs, both special difficulties and special talents, in their classes. They need to make more effective use of information and communication technologies for teaching. They are required to engage more in planning within evaluative and accountability frameworks. And they are asked to do more to involve parents in schools. No matter how good the pre-service education for teachers is, it cannot be expected to prepare teachers for all the challenges they will face throughout their careers.
Given the complexity of teaching and learning, high-quality professional development is necessary to ensure that all teachers are able to meet the needs of diverse student populations, effectively use data to guide reform, engage parents, and become active agents of their own professional growth. The development of teachers beyond their initial education can serve a range of purposes, including to:
• update individuals’ knowledge of a subject in light of recent advances in the area;
• update individuals’ skills and approaches in light of the development of new teaching techniques and objectives, new circumstances, and new educational research;
• enable individuals to apply changes made to curricula or other aspects of teaching practice;
• enable schools to develop and apply new strategies concerning the curriculum and other aspects of teaching practice;
• exchange information and expertise among teachers and others, e.g. academics and industrialists; and/or
• help weaker teachers become more effective.
Issues of professional development are not just relevant to the overall supply of quality teachers, but also to address specific issues of teacher shortages. This can be especially challenging in the case of disadvantaged schools, as students in these schools often have a wider range of abilities and needs. One in five teachers across countries – and more than one in three in Austria, Hungary, Korea and Slovenia – indicated that he or she needs professional development to address student discipline and behavioural issues. Again, this is particularly relevant for teachers in disadvantaged schools, as PISA shows that these schools typically have a poorer disciplinary climate. In addition, 13% of teachers – 25 % in Italy and in Ireland – reported that they do not feel prepared to teach in a multicultural setting. New Zealand offers tailored professional development activities to meet the needs of teachers who teach in multicultural classrooms (Box 2.10).
In seeking to meet teachers’ professional development requirements, policy makers and practitioners need to consider both how to support and encourage participation and how to ensure that opportunities match teachers’ needs. This needs

D e ve l o p i n g h i g h - q u a l i t y t e a ch e r s f o r t h e s ch o o l s w i t h t h e g r e a t e s t n e e d
41
Chapter 2
Equity, ExcEllEncE and inclusivEnEss in Education: Policy lEssons from around thE World © OECD 2014
to be balanced with the financial costs and the cost in teachers’ time. OECD research identifies several aspects as key to bridging the gap between the ideal learning environment and day-to-day practice (OECD, 2005):
• Well-structured and -resourced induction programmes can support new teachers in their transition to full teaching responsibilities before they obtain all the rights and responsibilities of full-time professional teachers. In some countries, once teachers have completed their pre-service education and begun their teaching, they begin one or two years of heavily supervised teaching. During this period, the beginning teacher typically receives a reduced workload, mentoring by master teachers, and continued formal instruction.
• Effective professional development needs to be ongoing, include training, practice and feedback, and provide adequate time and follow-up support. Successful programmes involve teachers in learning activities that are similar to those they will use with their students, and encourage the development of teachers’ learning communities.
• Teacher development needs to be linked with wider goals of school and system development, and with appraisal and feedback practices and school evaluation.
• There is often a need to re-examine structures and practices that inhibit inter-disciplinary practice and to provide more room for teachers to take time to learn deeply, and employ inquiry- and group-based approaches, especially in the core areas of curriculum and assessment.
Box 2.10. Tailoring professional development in New Zealand
The Building on Success initiative combines a number of programmes, including Te Kotahitanga, He Kākano (a strategic school-based professional development programme with an explicit focus on improving culturally responsive leadership and teacher practices), Starpath (which aims to address New Zealand’s comparatively high rate of educational inequality with Māori and Pacific students), and secondary literacy and numeracy projects. The key components of all these programmes will continue under the Building on Success initiative to deliver a targeted, tailored and flexible professional development approach that responds to the needs of individual schools.
The key components cover:
• Developing and embedding relationships, practices and learning environments that respond to and are respectful of Māori students’ diverse identities, culture and language;
• Making effective use of evidence and data, including whānau voice, to develop a school change and improvement plan;
• Strategically identifying goals and targets that will contribute to achieving national goals and targets, especially for Māori students; and
• Developing subject and programme pathways that ensure that Māori students plan for and progress towards their goals and aspirations through learning qualifications and career pathways.
Source: New Zealand Ministry of Education.
In some countries, ongoing professional development already plays an important role. In the Chinese province of Shanghai, each teacher is expected to engage in 240 hours of professional development within five years of being hired. Singapore provides teachers with an entitlement of 100 hours of professional development per year to keep up with the rapid changes occurring in the world and to be able to improve their practice. More generally, results from TALIS show that, across countries, almost 90% of teachers participated in some form of professional development over an 18-month period and, on average, spent just under one day per month in professional development.16 However, there is considerable variation in the incidence and intensity of teacher participation in professional development both across and within countries;17 older teachers tend to engage in less professional development than younger ones. The types of development undertaken by teachers explain some of these variations. Countries in which a high percentage of teachers take part in “qualification programmes” or “individual and collaborative research” tend to have a higher average number of days of development, but only a small minority of teachers tends to participate in these activities.
Teachers consider better and more targeted professional development as important for improvement. TALIS data show that teachers’ participation in professional development goes hand-in-hand with their mastery of a wider array of

D e ve l o p i n g h i g h - q u a l i t y t e a ch e r s f o r t h e s ch o o l s w i t h t h e g r e a t e s t n e e d
42
Chapter 2
© OECD 2014 Equity, ExcEllEncE and inclusivEnEss in Education: Policy lEssons from around thE World
methods to use in the classroom, even if it is not clear to what extent professional development triggers or responds to the adoption of new techniques. TALIS data also identify close associations between professional development and a positive school climate, teaching beliefs, co-operation among teachers and teachers’ job satisfaction.
Educate the teacher educators Teacher educators are entrusted with the crucial task of preparing student teachers and teachers to face their classrooms. yet there is surprisingly little knowledge of how teacher educators are, themselves, prepared. In many OECD countries, universities enjoy complete autonomy in developing teacher education programmes, from curriculum to practicum requirements and professional qualification standards. This makes it difficult to obtain comprehensive system-wide information, particularly assessment and evaluation data. Even in systems where teacher education programmes are centrally created and monitored, however, there is often a lack of data collection on how teacher educators are prepared for their roles. Within a given system, preparation can vary depending on the location of the programme (university, college, or other), the focus of the training (enhancing subject knowledge or building pedagogical and didactic competencies), and the elements required (a practicum phase during student teaching versus being placed directly into the classroom without prior practical experience in teaching).
yet across these different elements one thing remains relatively constant: very few teacher educators receive formal training in how to teach their student teachers. In fact, many teacher educators “have never received education and training in methodologies of teaching, co-operation and learning appropriate for adult learners (student teachers and professional teachers)” (Buchburger et al., 2000, p. 56). Even in university departments where professional advancement is dependent on published research, the study of teacher educator effectiveness and preparation is rare. There is thus often little in the way of materials to research.
When evaluating the role of teacher educators, it is also important to consider new and emerging trends in education. In an increasingly diverse world, teacher education programmes must focus on equipping teachers with the strategies they need to handle diverse student populations. Many believe this to be one of the most challenging tasks facing educators today (Milner and Smithey, 2003; Robinson and McMillan, 2006; OECD, 2010b). But scholars and experts know very little about teacher educators’ ability to prepare teachers for multicultural education (Merryfield, 2000). Again, both the failure to acknowledge teacher educators’ critical contribution to the education system and the lack of research on teacher educator preparation constitute a significant threat to the quality and sustainability of education systems.
A recent study on teacher educator programmes (Pollock et al., 2010) identifies three specific tensions experienced by teachers during both their training programmes and their classroom teaching time:
• The tension between theoretical and practice-based knowledge. When discussing difficult concepts, such as racism and diversity, teachers often struggle with how to put theory into practice. Instead of simply engaging multicultural issues in abstract and broad terms, Pollock et al. (2010) argue that teacher educator programmes should also focus on providing concrete suggestions and activities for classroom use.
• The tension between individual efficacy and the overwhelming scope of the issue. Teacher education programmes that focus primarily on broad structural patterns, like the “achievement gap”, and “dropout rates”, often overwhelm educators and make them feel that, as individuals, they play no role in counteracting social problems. Training should challenge teacher educators to question their own beliefs and attitudes about students, society and schools; and, more importantly, programmes should provide concrete skills to be used in the classroom, to help teachers feel individually efficacious in serving diverse populations.
• The tension between the pursuit of personal development and professional development. Many teacher educators argue that they must undergo personal development work to rid themselves of “worldviews” and “mindsets” that develop through personal experience before they can develop professional tactics for classroom use. Because personal development is an ongoing process of indefinite duration, teacher educator training programmes should begin with this focus explicitly and gradually integrate professional development skills training.
Although the study does not claim that teachers most committed to ongoing inquiry serve their students best, it does suggest that these teachers would serve their students better than teachers uninspired about their work’s potential. When it comes to addressing diversity issues, teacher educator training programmes should explicitly target the three tensions mentioned above as a means of initiating self-analysis and ongoing growth.

D e ve l o p i n g h i g h - q u a l i t y t e a ch e r s f o r t h e s ch o o l s w i t h t h e g r e a t e s t n e e d
43
Chapter 2
Equity, ExcEllEncE and inclusivEnEss in Education: Policy lEssons from around thE World © OECD 2014
notes1. Among OECD countries, the correlation is 0.32.
2. The correlation is -0.22 among 17 countries and economies whose per capita GDP is less than USD 20 000.
3. In 16 OECD countries, more teachers are allocated to disadvantaged schools to reduce the student-teacher ratio, with the objective of moderating disadvantage (OECD, 2010b). This is particularly the case in Belgium, Estonia, Iceland, Ireland, Italy, Japan, Korea, the Netherlands, Portugal and Spain. Only in Israel, Slovenia, Turkey and the United States are disadvantaged schools characterised by a higher student-teacher ratio.
4. High turnover can have a negative effect on student achievement since teachers may leave before they gain the experience they need to be more effective with students (Rivkin, Hanushek and Kain, 2005).
5. Caution is required in interpreting these results. School principals across countries and economies, and even within countries and economies, may have different expectations and benchmarks in determining whether there is a lack of qualified teachers. Nonetheless, their responses provide valuable information that can be used to assess whether schools or school systems are providing their students with adequate numbers and quality of teachers.
6. This is one of the reasons an explicit “pupil premium” for disadvantaged students was introduced (OECD, 2011a). However, the additional funds are considered to be relatively low compared to other countries (the Netherlands and Chile), and it is unclear whether they would be sufficient to cover the additional costs of enrolling disadvantaged students.
7. Examples of diversity content in new teacher education curricula at four Spanish universities are included in Chapter 10 in the report Educating Teachers for Diversity (OECD, 2010b).
8. In Québec and in Manitoba, all teachers are required to take six credit hours in special education for students with exceptional needs during their pre-service training.
9. Induction is normally understood as a programme designed to support new teachers. Mentoring is usually part of the induction programme. Mentoring can be defined as the one-to-one support of a novice or less-experienced practitioner (mentee) by a more experienced practitioner (mentor), designed primarily to assist in developing the mentee’s expertise and facilitating their induction into the culture of the profession (in this case, teaching) and into the specific local context (here, disadvantaged school) (Hobson et al., 2009).
10. In 2009, primary teachers’ salaries amounted to, on average, 77% of full-time, full-year earnings for 25-64 year-olds with tertiary education, lower secondary teachers’ salaries amounted to 81% of those earnings, and upper secondary teachers’ salaries amounted to 85% of those earnings. The lowest relative teachers’ salaries, compared to the salaries of other professionals with comparable education, are found in the Slovak Republic at all levels of education, and in Hungary and Iceland for primary and lower secondary school teachers, where statutory salaries for teachers with 15 years of experience are 50% or less of what a full-time, full-year worker with a tertiary education earns, on average. Relative salaries for teachers in primary and lower secondary education are highest in Korea, Portugal and Spain, where teachers earn more than the average salary of a worker with a tertiary education. In upper secondary education, teachers’ salaries are at least 10% higher than those of comparably educated workers in Belgium, Luxembourg and Portugal, and up to 32% higher in Spain (for data, see OECD, 2011c, Table D3.2).
11. Salaries in London, for example, exceed those in the rest of England by about 12% (Ladd, 2007).
12. In North Carolina, for example, labelling schools as “low-performing” made it harder to recruit and retain qualified teachers. Both experienced and novice teachers were about 25% more likely to leave schools labelled low-performing compared to teachers in schools with similar student performance that were not so labelled. There is evidence of the same phenomenon in France.
13. For data, see Figure IV.3.3a in OECD (2010c), PISA 2009 Results: What Makes a School Successful? Resources, Policies and Practices (Volume IV), PISA, OECD Publishing.
14. For data, see Indicator D3 in the 2007 edition of the OECD publication Education at a Glance.
15. See, for example, the Commonwealth Teachers Recruitment Protocol of 2004, developed at the request of the 15th Conference of Commonwealth Education Ministers, Edinburgh, United Kingdom, 2003.
16. TALIS asked teachers about their professional development activities during the 18 months prior to the survey. This period of time was chosen in order to cover activities over almost two school years in order to give a more representative picture and reduce possible distortions due to unusually busy or lean periods of development, and to ensure a manageable period for teachers’ recall. Teachers were first asked to indicate whether or not they had participated in each of the following activities: (1) courses/workshops (e.g. on subject matter or methods and/or other education-related topics); (2) education conferences or seminars (at which teachers and/or researchers present their research results and discuss education problems); (3) qualification programme (e.g. a degree programme); (4) observation visits to other schools; (5) participation in a network of teachers formed specifically for the professional development of teachers; (6) individual or collaborative research on a topic of professional interest; and (7) mentoring and/or peer observation and coaching,

D e ve l o p i n g h i g h - q u a l i t y t e a ch e r s f o r t h e s ch o o l s w i t h t h e g r e a t e s t n e e d
44
Chapter 2
© OECD 2014 Equity, ExcEllEncE and inclusivEnEss in Education: Policy lEssons from around thE World
as part of a formal school arrangement. Teachers were able to indicate participation in multiple activities. TALIS then asked teachers how many days of professional development they had attended in the 18 months prior to the survey and how many of these days were compulsory (for details, see OECD [2009]).
17. The intensity of teacher participation in professional development varies considerably across countries, with Korea and Mexico seeing teachers participating, on average, over 30 days in 18 months, twice the average rate. Within-country variation in the intensity of professional development can also be high, most notably in Italy, Mexico, Korea, Poland and Spain (for data see OECD [2009]).
referencesAllensworth, E., S. Ponisciak, and C. Mazzeo (2009), The Schools Teachers Leave: Teacher Mobility in Chicago Public Schools, Consortium on Chicago School Research, University of Chicago, Chicago.
Bénabou, R., F. Kramarz and C. Prost (2009), “The French Zones d’Education Prioritaires: Much Ado about Nothing?”, Economics of Education Review, Vol. 28, No. 3, pp. 345-356.
Bonesrønning, H., T. Falch and B. Strøm (2005), “Teacher Sorting, Teacher Quality, and Student Composition: Evidence from Norway”, European Economic Review, Vol. 49, No. 2, pp. 457-483.
Brandt, N. (2010), “Chile: Climbing on Giants’ Shoulders: Better Schools for all Chilean Children”, OECD Economics Department Working Papers, No. 784, OECD Publishing, http://dx.doi.org/10.1787/5kmd41g7x9g0-en.
Burns, T. (2010), “Attracting and Retaining Diverse Student Teachers and Teachers”, Background Paper prepared for the OECD International Seminar on Teacher Education for Diversity, Brussels, Belgium.
Chetty, R. and J. Friedman (2011), “Does Local Tax Financing of Public Schools Perpetuate Inequality?”, National Tax Association Proceedings, 103rd Annual Conference on Taxation 2011.
Chevalier, A., P. Dolton, and S. McIntosh (2007), “Recruiting and Retaining Teachers in the U.K.: An Analysis of Graduate Occupation Choice from the 1960s to the 1990s,” Economica.
Darling-Hammond, L. (2010), “Organizing for Success: From Inequality to Quality”, The Flat World and Education: How America’s Commitment to Equity will Determine our Future, Teachers College Press, New york, pp. 234-277.
Department for Education and Skills and H.M. Treasury (2005), “Child Poverty: Fair Funding for Schools”, Department for Education and Skills and Department for Treasury.
Elacqua, G. (2009), “The impact of school choice and public policy on segregation: Evidence from Chile”, Centro de Politicas Comparadas de Educacion, Universidad Diego Portales, Santiago.
Field, S., M. Kuczera and B. Pont (2007), No More Failures: Ten Steps to Equity in Education, Education and Training Policy, OECD Publishing, http://dx.doi.org/10.1787/9789264032606-en.
Gordon, J. (2006), “Assigned to the margins: Teachers for minority and immigrant communities in Japan”, Teaching and Teacher Education, Vol. 22, No. 7.
Greek Ministry of Education (2011), Overcoming School Failure: Policies that Work, National Report Greece, http://www.oecd.org/education/school/49528233.pdf.
Hanushek E., J. Kain and S. Rivkin (2004), “Why Public Schools Lose Teachers,” Journal of Human Resources, Vol. 39, No. 2.
Hobson, A. et al. (2009), “Mentoring Beginning Teachers: What We Know and What We Don’t”, Teaching and Teacher Education: An International Journal of Research and Studies, Vol. 25, No. 1, pp. 207-216.
Hsieh C. and M. Urquiola (2006), “The effects of generalized school choice on achievement and stratification: Evidence from Chile’s voucher program”, Journal of Public Economics, Elsevier, Vol. 90.
Ingvarson, L. and K. Rowe (2007), “Conceptualising and evaluating teacher quality: Substantive and methodological issues”, Australian Journal of Education, Vol. 52, No. 1, pp. 5-35.
Jensen, B. et al. (2012), The Experience of New Teachers: Results from TALIS 2008, OECD Publishing, http://dx.doi.org/ 10.1787/9789264120952-en.
D e ve l o p i n g h i g h - q u a l i t y t e a ch e r s f o r t h e s ch o o l s w i t h t h e g r e a t e s t n e e d
45
Chapter 2
Equity, ExcEllEncE and inclusivEnEss in Education: Policy lEssons from around thE World © OECD 2014
Johnson, S.M. and S.E. Birkeland (2003), “Pursuing a ‘sense of success’: New teachers explain their career decisions”, American Educational Research Journal, Vol. 40, No. 3, pp. 581-617.
Kendall, L. et al. (2005), “Excellence in Cities: The National Evaluation of a Policy to Raise Standards in Urban Schools 2000-2003”, Department for Education and Skills, Research Report, No. 675a.
Kohl, R. (2009), “Critical race reflections: Valuing the experiences of teachers of color in teacher education”, Ethnicity and Education, Vol. 12, No. 2, pp. 235-251.
Ladd, H. (2007), “Teacher Labor Markets in Developed Countries”, The Future of Children, Vol. 17, No. 1.
Ladd, H., E. Fiske and N. Ruijs (2009), “Parental Choice in the Netherlands: Growing Concerns about Segregation”, Prepared for School Choice and School Improvement: Research in State, District and Community Contexts, Vanderbilt University, October 2009.
Levacic, R. (2008), “Financing schools: evolving patterns of autonomy and control”, Educational Management Administration and Leadership, Vol. 36, pp. 221-34.
Merryfield, M.M. (2000), “Why aren’t teachers being prepared to teach for diversity, equity, and global interconnectedness? A study of lived experiences in the making of multicultural and global educators”, Teaching and Teacher Education, Vol. 16, No. 4, pp. 429-443.
Michaelson, M. (2006), “A Measure of the Strength of the Relationship between the Indigenity and Desirability of Queensland State Schools”, Australian Journal of Indigenous Education, Vol. 3.
Milner H.R. and M. Smithey (2003), “How teacher educators created a course curriculum to challenge and enhance pre-service teachers’ thinking and experience with diversity”, Teaching Education, Vol. 14, No. 3, pp. 293-305.
Moisan, C. (2011), “Comment en finir avec l’échec scolaire: les mesures efficaces“, Projet de rapport national de base de la France, www.oecd.org/fr/education/scolaire/49528429.pdf.
Musset, P. (2010), “Initial Teacher Education and Continuing Training Policies in a Comparative Perspective: Current Practices in OECD Countries and a Literature Review on Potential Effects”, OECD Education Working Papers, No. 48, OECD Publishing, http://dx.doi.org/ 10.1787/5kmbphh7s47h-en.
National Advisory Committee for the Ministry of Education and Science (2003), “Attracting, Developing and Retaining Effective Teachers”, Country Background Report for Sweden, Ministry of Education and Science, Stockholm, www.oecd.org/education/school/ 49528267.pdf.
O’Brien, P. (2007), “Enhancing Incentives to Improve Performance in the Education System in France”, OECD Economics Department Working Papers, No. 570, http://dx.doi.org/10.1787/127375127310.
OECD (2013a), PISA 2012 Results: What Makes Schools Successful? Resources, Policies and Practices (Volume IV), PISA, OECD Publishing, http://dx.doi.org/10.1787/9789264201156-en.
OECD (2013b), Education at a Glance 2013: OECD Indicators, OECD Publishing, http://dx.doi.org/10.1787/eag-2013-en.
OECD (2013c), Teachers for the 21st Century: Using Evaluation to Improve Teaching, OECD Publishing, http://dx.doi.org/ 10.1787/9789264193864-en.
OECD (2012), Equity and Quality in Education: Supporting Disadvantaged Schools and Students, OECD Publishing, http://dx.doi.org/ 10.1787/9789264130852-en.
OECD (2011a), OECD Economic Surveys: United Kingdom 2011, OECD Publishing, http://dx.doi.org/10.1787/eco_surveys-gbr-2011-en.
OECD (2011b), Lessons from PISA for the United States, Strong Performers and Successful Reformers in Education, OECD Publishing, http://dx.doi.org/10.1787/9789264096660-en.
OECD (2011c), Education at a Glance 2011: OECD Indicators, OECD Publishing, http://dx.doi.org/10.1787/eag-2011-en.
OECD (2010a), PISA 2009 Results: Overcoming Social Background: Equity in Learning Opportunities and Outcomes (Volume II), PISA, OECD Publishing, http://dx.doi.org/10.1787/9789264091504-en.
OECD (2010b), Educating Teachers for Diversity: Meeting the Challenge, Educational Research and Innovation, OECD Publishing, http://dx.doi.org/10.1787/9789264079731-en.
OECD (2010c), PISA 2009 Results: What Makes a School Successful?: Resources, Policies and Practices (Volume IV), PISA, OECD Publishing, http://dx.doi.org/10.1787/9789264091559-en.
D e ve l o p i n g h i g h - q u a l i t y t e a ch e r s f o r t h e s ch o o l s w i t h t h e g r e a t e s t n e e d
46
Chapter 2
© OECD 2014 Equity, ExcEllEncE and inclusivEnEss in Education: Policy lEssons from around thE World
OECD (2009), Creating Effective Teaching and Learning Environments: First Results from TALIS, OECD Publishing, http://dx.doi.org/ 10.1787/9789264072992-en.
OECD (2005), Teachers Matter: Attracting, Developing and Retaining Effective Teachers, Education and Training Policy, OECD Publishing,http://dx.doi.org/10.1787/9789264018044-en.
Oosterbeek, H. et al. (2007), “The effect of extra funding for disadvantaged students on achievement”, Review of Economics and Statistics, Vol. 89, No. 4, pp. 721-736.
Paul, J.J. and T. Troncin (2004), “Les apports de la recherche sur l’impact du redoublement comme moyen de traiter les difficultés scolaires au cours de la scolarité obligatoire”, Haut Conseil de l’Evaluation de l’Ecole, No. 1.
Pollock, M. et al. (2010), “’But what can I do’: Three necessary tensions in teaching teachers about race”, Journal of Teacher Education, Vol. 6, No. 3, pp. 211-224.
Ritchie, G. (2004), “Quantifying the effects of teacher movements between schools in New Zealand: to schools that hath, shall be given”, Journal of Education Policy, Vol. 19, No. 1, pp. 57-79.
Rivkin, S., E. Hanushek and J. Kain (2005), “Teachers, Schools and Academic Achievement”, Econometrica, Vol. 73, No. 2, pp. 417-458.
Robinson, M. and W. McMillan (2006), “Who teaches the teachers? Identity, discourse and policy in teacher education”, Teaching and Teacher Education, Vol. 22, No. 3, pp. 327-336.
Sclafani, S. and M. Tucker (2006), Teacher and Principal Compensation: An International Review, Center for American Progress, Washington D.C.
Sibieta, L., H. Chowdry and A. Muriel (2008), “Level playing field? The implications of school funding”, Institute for Fiscal Studies.
Simkins, T. (2004), “School Finance and Equity in England”, Educational Management Administration and Leadership, Vol. 32, No. 4, pp. 369-386.
Sleeter, C. and Y. Thao (2007), “Diversifying the teaching force”, Teacher Education Quarterly, 34(4), 3-8.
Steiner, M. and the Styrian Association for Education and Economics (2011), OECD Country Report Austria, Overcoming School Failure: Policies that Work, Federal Ministry for Education, Arts and Culture, Austria, www.oecd.org/education/school/49528170.pdf.
Strakova, J., J. Simonova and P. Polechova (2011), Overcoming School Failure, Background Report for the Czech Republic, Institute for Information on Education, Czech Republic, www.oecd.org/education/school/48631810.pdf.
Treviño, E. et al. (2013), “Markets and high-stakes accountability: Synergy for good schools? The case of the USA and Chile”, paper presented at the European Association for Research on Learning and Instruction, Munich.
Wong H., T. Britton and T. Ganser (2005), “What the World Can Teach Us About New Teacher Induction,” Phi Delta Kappan, Vol. 86, No. 5, pp. 379-384.
The statistical data for Israel are supplied by and under the responsibility of the relevant Israeli authorities. The use of such data by the OECD is without prejudice to the status of the Golan Heights, East Jerusalem and Israeli settlements in the West Bank under the terms of international law.

47
Chapter 3
Achieving equity in increAsingly devolved educAtion systems
Equity, ExcEllEncE and inclusivEnEss in Education: Policy lEssons from around thE World © OECD 2014
This chapter focuses on equity in the context of more devolved education
systems. Based on PISA 2012 results, it shows the association between
school autonomy over curricula and assessments and students’ mathematics
performance, the relationship between performance and accountability
arrangements, and what parents look for in choosing a school for their
child. The chapter discusses the importance of avoiding socio-economic
segregation among schools, of informing all parents of the choices available
to them, and of investing in early childhood education.
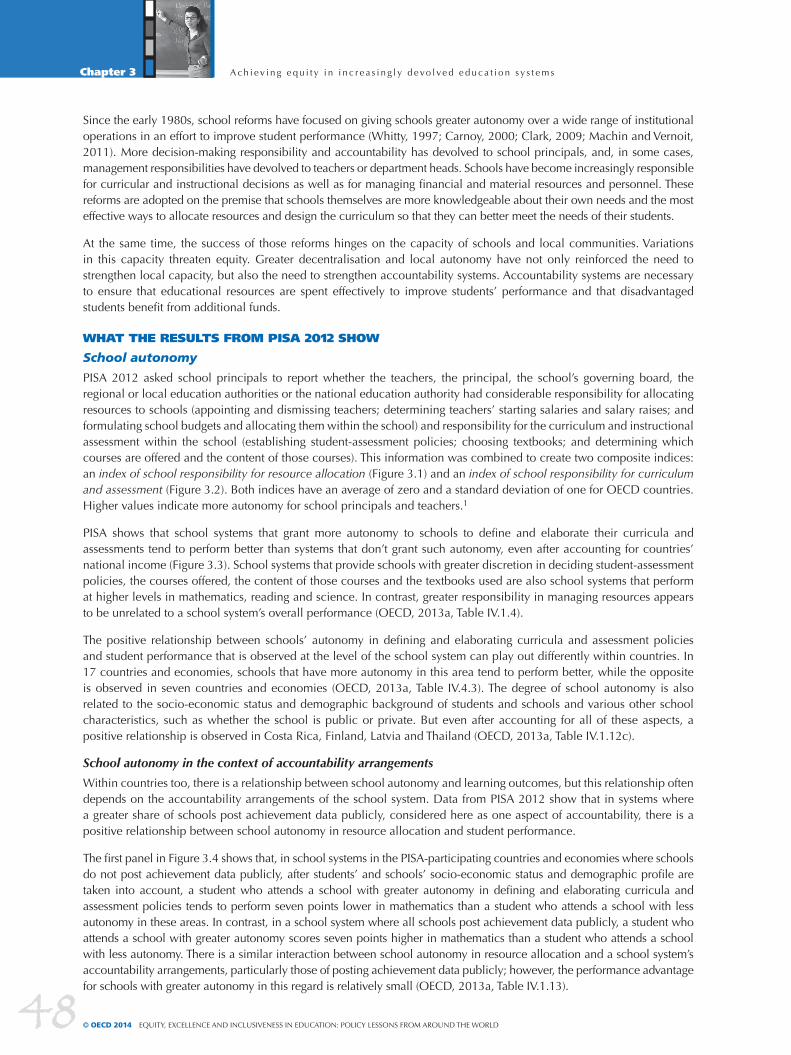
A ch i e v i n g e q u i t y i n i n c r e a s i n g l y d e vo l ve d e d u c a t i o n s y s t e m s
48
Chapter 3
© OECD 2014 Equity, ExcEllEncE and inclusivEnEss in Education: Policy lEssons from around thE World
Since the early 1980s, school reforms have focused on giving schools greater autonomy over a wide range of institutional operations in an effort to improve student performance (Whitty, 1997; Carnoy, 2000; Clark, 2009; Machin and Vernoit, 2011). More decision-making responsibility and accountability has devolved to school principals, and, in some cases, management responsibilities have devolved to teachers or department heads. Schools have become increasingly responsible for curricular and instructional decisions as well as for managing financial and material resources and personnel. These reforms are adopted on the premise that schools themselves are more knowledgeable about their own needs and the most effective ways to allocate resources and design the curriculum so that they can better meet the needs of their students.
At the same time, the success of those reforms hinges on the capacity of schools and local communities. Variations in this capacity threaten equity. Greater decentralisation and local autonomy have not only reinforced the need to strengthen local capacity, but also the need to strengthen accountability systems. Accountability systems are necessary to ensure that educational resources are spent effectively to improve students’ performance and that disadvantaged students benefit from additional funds.
WhaT The reSulTS from PISa 2012 ShoW
School autonomy
PISA 2012 asked school principals to report whether the teachers, the principal, the school’s governing board, the regional or local education authorities or the national education authority had considerable responsibility for allocating resources to schools (appointing and dismissing teachers; determining teachers’ starting salaries and salary raises; and formulating school budgets and allocating them within the school) and responsibility for the curriculum and instructional assessment within the school (establishing student-assessment policies; choosing textbooks; and determining which courses are offered and the content of those courses). This information was combined to create two composite indices: an index of school responsibility for resource allocation (Figure 3.1) and an index of school responsibility for curriculum and assessment (Figure 3.2). Both indices have an average of zero and a standard deviation of one for OECD countries. Higher values indicate more autonomy for school principals and teachers.1
PISA shows that school systems that grant more autonomy to schools to define and elaborate their curricula and assessments tend to perform better than systems that don’t grant such autonomy, even after accounting for countries’ national income (Figure 3.3). School systems that provide schools with greater discretion in deciding student-assessment policies, the courses offered, the content of those courses and the textbooks used are also school systems that perform at higher levels in mathematics, reading and science. In contrast, greater responsibility in managing resources appears to be unrelated to a school system’s overall performance (OECD, 2013a, Table IV.1.4).
The positive relationship between schools’ autonomy in defining and elaborating curricula and assessment policies and student performance that is observed at the level of the school system can play out differently within countries. In 17 countries and economies, schools that have more autonomy in this area tend to perform better, while the opposite is observed in seven countries and economies (OECD, 2013a, Table IV.4.3). The degree of school autonomy is also related to the socio-economic status and demographic background of students and schools and various other school characteristics, such as whether the school is public or private. But even after accounting for all of these aspects, a positive relationship is observed in Costa Rica, Finland, Latvia and Thailand (OECD, 2013a, Table IV.1.12c).
School autonomy in the context of accountability arrangements
Within countries too, there is a relationship between school autonomy and learning outcomes, but this relationship often depends on the accountability arrangements of the school system. Data from PISA 2012 show that in systems where a greater share of schools post achievement data publicly, considered here as one aspect of accountability, there is a positive relationship between school autonomy in resource allocation and student performance.
The first panel in Figure 3.4 shows that, in school systems in the PISA-participating countries and economies where schools do not post achievement data publicly, after students’ and schools’ socio-economic status and demographic profile are taken into account, a student who attends a school with greater autonomy in defining and elaborating curricula and assessment policies tends to perform seven points lower in mathematics than a student who attends a school with less autonomy in these areas. In contrast, in a school system where all schools post achievement data publicly, a student who attends a school with greater autonomy scores seven points higher in mathematics than a student who attends a school with less autonomy. There is a similar interaction between school autonomy in resource allocation and a school system’s accountability arrangements, particularly those of posting achievement data publicly; however, the performance advantage for schools with greater autonomy in this regard is relatively small (OECD, 2013a, Table IV.1.13).
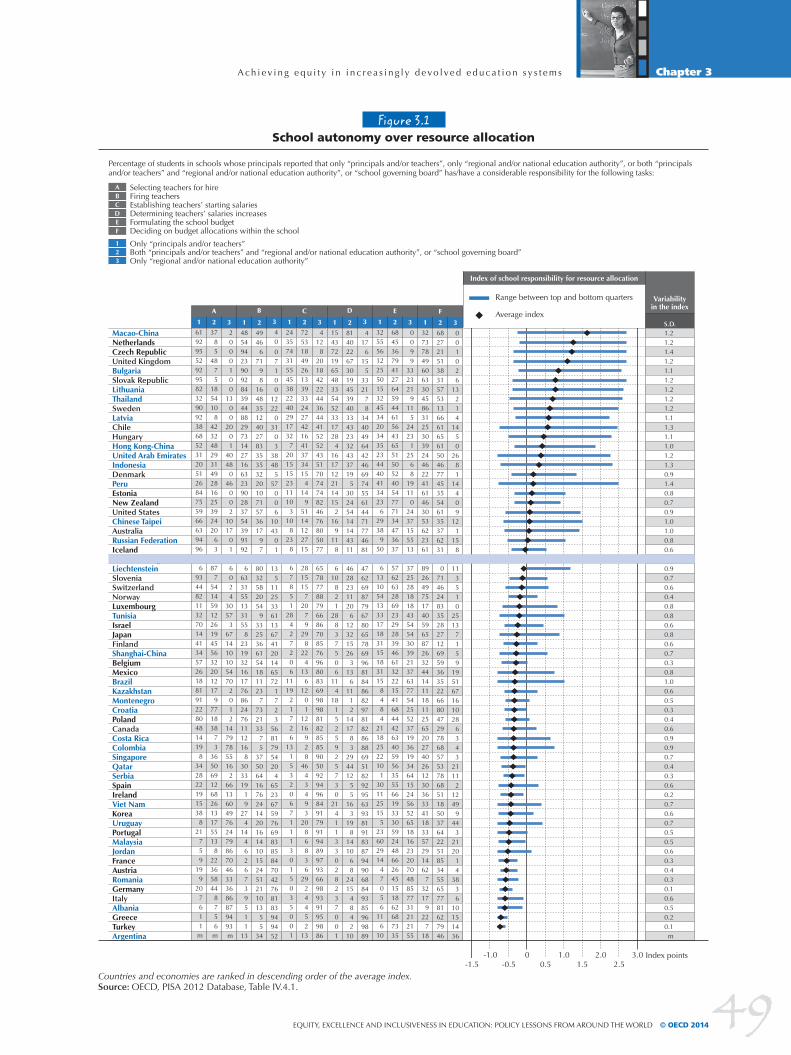
A ch i e v i n g e q u i t y i n i n c r e a s i n g l y d e vo l ve d e d u c a t i o n s y s t e m s
49
Chapter 3
Equity, ExcEllEncE and inclusivEnEss in Education: Policy lEssons from around thE World © OECD 2014
Figure 3.1School autonomy over resource allocation
Countries and economies are ranked in descending order of the average index.Source: OECD, PISA 2012 Database, Table IV.4.1.
F
3
001026
13214
1450
2681
14409
121
1586
113510
25137159
1951671610286343
21112
12499
443
212014
3836
10151436
2
682721513831575313666165615046774535546135376231490
714624833528271269593635226680472978685753786851185037642251853455657781627946
1
327378496063304586312530392446224161463053622361458926497517405965872632441411181125652027402612303633411833572914627
32179
227
18
E
3
0099
3323219
115
24231
2568
19110
24371555132837252818184354543039213763775425523719361934641524565265181623207048857731212155
2
6845367941276459446156436551505240547771344736374857626328692329283946613222154168444263405956355566193330592448662645151862687335
1
325556122550153245342034352344404134236
29389
50246
1310541333171831151831158484
21182522101
301125155
2360291447056
116
10
D
3
4176
155
332178
3440496442466974556144717746816947626987796780657869968184868297818286886951829295639381918387949068849385969889
2
814022673019453940334323324337195
302454141443111946282311206
123215263
136
1112
141783
29441255
163
198
141068
24154842
10
1
1543721965483354523317284
1617122114152
169
118
126
10821
28837506
114
181525925730
2141133028237001
C
3
4128
2018422244364441525243517074748246768050777365787788796686708576968083699898818285859050929496849179919489979366989391959886
2
725318492613393324274216413734154
149
5114122715152815157
2079
298
224
136
1201
1216928
4643493
2086836
2924452
13
1
2435743155453822402917327
2015152311103
108
238
1167851
28427206
111921726
1315320671113015035001
B
3
40
07100
12220
3103
38485
57006
104301
34135
11253361136741201465721723
56817954204
6523675976698385847042768183949452
2
49466
7198
1648351240278335353220107157361797
3080325820549
33253661541811237
73213375
375064167624142016141015245121101355
34
1
485494239092843944882973142716632390283754399192366
6331551331558
2319321617768624761112168
30331919
274
144626739511
13
A
3
2000100
1300
2001
40480
46002
101701
246024
30573
6714101054702012
14797855162
66136049762479867046333686879493m
2
3785
4875
1854108
42324829314928162539242063
27877
5414591226194556322012179
77183873
365069126826131755138
223658448756m
1
619295529295823290923868523120512684755966639496496
934482113270144134572618819122804814198
3428221915388
21759
199
207611m
Macao-ChinaNetherlandsCzech RepublicUnited KingdomBulgariaSlovak RepublicLithuaniaThailandSwedenLatviaChileHungaryHong Kong-ChinaUnited Arab EmiratesIndonesiaDenmarkPeruEstoniaNew ZealandUnited StatesChinese TaipeiAustraliaRussian FederationIcelandOECD averageLiechtensteinSloveniaSwitzerlandNorwayLuxembourgTunisiaIsraelJapanFinlandShanghai-ChinaBelgiumMexicoBrazilKazakhstanMontenegroCroatiaPolandCanadaCosta RicaColombiaSingaporeQatarSerbiaSpainIrelandViet NamKoreaUruguayPortugalMalaysiaJordanFranceAustriaRomaniaGermanyItalyAlbaniaGreeceTurkeyArgentina
variability in the index
S.D.1.21.21.41.21.11.21.21.21.21.11.31.11.01.21.30.91.40.80.70.91.01.00.80.60.70.90.70.60.40.80.80.60.80.60.70.30.81.00.60.50.30.40.60.90.90.70.40.30.60.20.70.60.70.50.50.60.30.40.30.10.60.50.20.1
m
Index points
index of school responsibility for resource allocation
Range between top and bottom quarters
Average index
Percentage of students in schools whose principals reported that only “principals and/or teachers”, only “regional and/or national education authority”, or both “principals and/or teachers” and “regional and/or national education authority”, or “school governing board” has/have a considerable responsibility for the following tasks:
a Selecting teachers for hireB Firing teachersC Establishing teachers’ starting salariesd Determining teachers’ salaries increasese Formulating the school budgetf Deciding on budget allocations within the school
1 Only “principals and/or teachers”2 Both “principals and/or teachers” and “regional and/or national education authority”, or “school governing board”3 Only “regional and/or national education authority”
-1.5 -0.5 1.5 2.50.5-1.0 0 1.0 2.0 3.0

A ch i e v i n g e q u i t y i n i n c r e a s i n g l y d e vo l ve d e d u c a t i o n s y s t e m s
50
Chapter 3
© OECD 2014 Equity, ExcEllEncE and inclusivEnEss in Education: Policy lEssons from around thE World
Figure 3.2School autonomy over curricula and assessments
Countries and economies are ranked in descending order of the average index.Source: OECD, PISA 2012 Database, Table IV.4.3.
D
3
400002051
16030
311579291
255
18101022391813143
10335
32181388
5448423
69265129622875181953681840738585284565815293
2
6372537306122365122524229335563523660756564464170382637625445614275357278736233273451245735531061127265429
715823151128401713443
1
9063756370367860486248567136293039633124103036492040354525335230242033109
2030132523466
16151829111310165
23112404
451418644
C
3
41203203
10112310
123
11162728144
24248
23191725382817201534262012263550434241313432583769665559753060456175844577898995
2
7247
24143326203616623528172743374835405949364247342838454051644866303974635835243139364343481546112839332
65324534129
4415473
1
8976917683667476547335617183605451363732264740344543534530222119332035356
25153026261924262320281720678
2458
105
127
108742
B
3
40000000040500000070058006
3602123024061
152
451
131
201
396325170
5234781417
1231733661875889
2
7537
160
191050461630274
181033231836184350271143291625153858526
72154078446025261943184214409
38142133412
69554554189
46186
386
1
89479384
100819050548070689682906777815782574565895765477583614045942681601655257328804481388521293769791625201745493451181720645
A
3
0400000212124009033211
13101199
15452
1030
322304
16223224178
24296
451139191743334426387
35524765588761
2
2545
13383442296516612238432165364051516442414051733250405258735383223846556858333758335535692842206349452
4956454232234823271110
1
9842958762665869348239765857792763564647355747503818593556444017431746385441162035392559223525274741183413656
18175133255
12142
29
JapanThailandNetherlandsHong Kong-ChinaUnited KingdomMacao-ChinaCzech RepublicKoreaLithuaniaIndonesiaEstoniaSlovak RepublicNew ZealandPolandItalyChinese TaipeiIcelandAustraliaChileIrelandHungaryIsraelOECD averageFinlandDenmarkColombiaPeruFranceBelgiumLatviaGermanyRussian FederationSwedenSingaporeAlbaniaAustriaLiechtensteinSloveniaUnited StatesBrazilUnited Arab EmiratesSpainCanadaArgentinaRomaniaNorwayShanghai-ChinaTunisiaSwitzerlandCosta RicaPortugalKazakhstanUruguayMontenegroLuxembourgBulgariaCroatiaSerbiaMexicoMalaysiaQatarViet NamJordanTurkeyGreece
variability in the index
S.D.0.70.70.80.80.80.91.00.90.91.00.91.00.90.80.90.91.00.91.00.80.90.90.80.90.90.91.00.90.80.80.80.80.80.80.90.80.90.70.90.81.00.70.70.70.70.70.81.00.60.80.50.60.60.60.40.40.40.20.50.60.50.50.60.30.3
Index points
index of school responsibility for curriculumand assessment
Range between top and bottom quarters
Average index
Percentage of students in schools whose principals reported that only “principals and/or teachers”, only “regional and/or national education authority”, or both “principals and/or teachers” and “regional and/or national education authority”, or “school governing board” has/have a considerable responsibility for the following tasks:
a Establishing student assessment policiesB Choosing which textbooks are usedC Determining course contentd Deciding which courses are offered
1 Only “principals and/or teachers”2 Both “principals and/or teachers” and “regional and/or national education authority”, or “school governing board”3 Only “regional and/or national education authority”
-1.5 -0.5 1.5 2.50.5-1.0 0 1.0 2.0 3.0
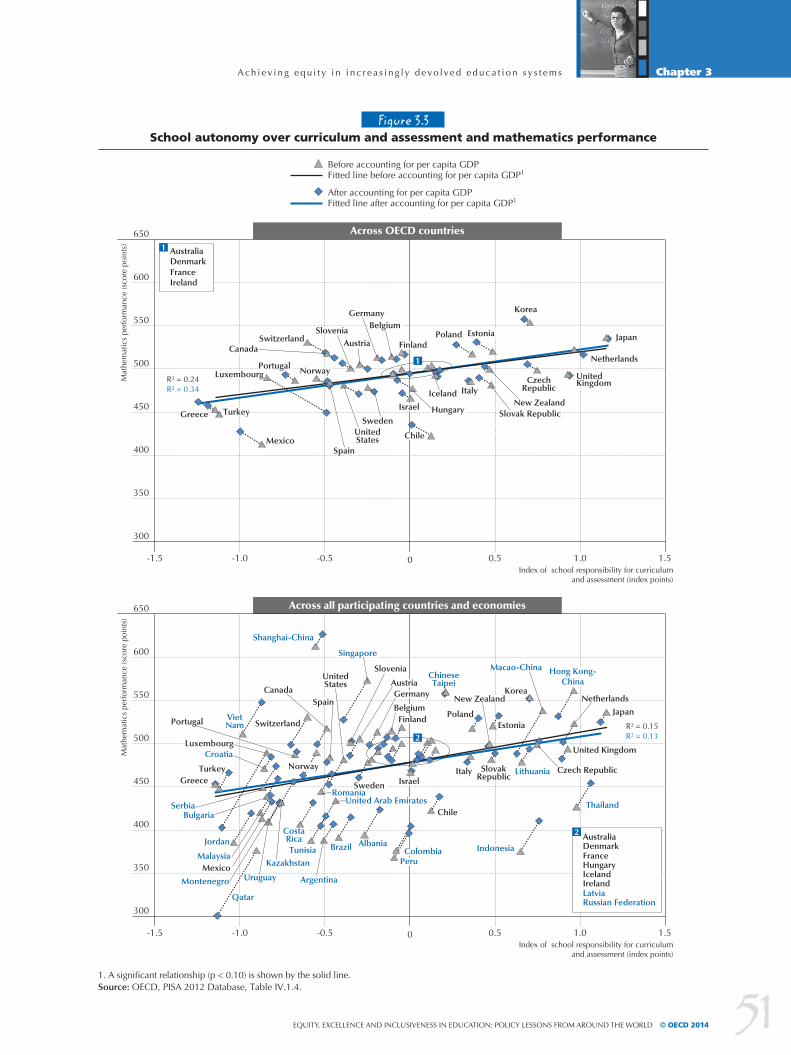
A ch i e v i n g e q u i t y i n i n c r e a s i n g l y d e vo l ve d e d u c a t i o n s y s t e m s
51
Chapter 3
Equity, ExcEllEncE and inclusivEnEss in Education: Policy lEssons from around thE World © OECD 2014
Figure 3.3School autonomy over curriculum and assessment and mathematics performance
Across OECD countries
Mat
hem
atic
s pe
rfor
man
ce (s
core
poi
nts)
1. A signi�cant relationship (p < 0.10) is shown by the solid line. Source: OECD, PISA 2012 Database, Table IV.1.4.
650
600
550
500
450
400
350
300
Before accounting for per capita GDPFitted line before accounting for per capita GDP1
After accounting for per capita GDPFitted line after accounting for per capita GDP1
R² = 0.24R² = 0.34
R² = 0.15R² = 0.13
Index of school responsibility for curriculumand assessment (index points)
-1.5 -1.0 0 1.00.5-0.5 1.5
Across all participating countries and economies
Mat
hem
atic
s pe
rfor
man
ce (s
core
poi
nts)
650
600
550
500
450
400
350
300
Index of school responsibility for curriculumand assessment (index points)
-1.5 -1.0 0 1.00.5-0.5 1.5
United States
Estonia
Norway
Hungary
Chile
Spain
Slovak Republic
Luxembourg
Germany
Netherlands
New Zealand
Mexico
Turkey
FinlandCanada
Sweden
Japan
Korea
Belgium
United Kingdom
Switzerland
GreeceIsrael
Poland
Portugal
Iceland Italy
SloveniaAustria
Czech Republic
Ireland
Australia
FranceDenmark
United States
Chile
Slovak Republic
Germany NetherlandsNew Zealand
Mexico
Turkey
United Kingdom
Greece Israel
Peru
IndonesiaTunisiaJordan
Japan
Qatar
Macao-China
Uruguay
Costa Rica
Argentina
ColombiaBrazil Albania
KazakhstanMalaysia
RomaniaUnited Arab Emirates
Hong Kong-China
Shanghai-China
Chinese Taipei
Viet Nam
Singapore
EstoniaFinland
Korea
Serbia
Croatia
Thailand
Montenegro
Belgium
Canada
Poland
Sweden
Italy
Austria
Czech Republic
Portugal
Spain
Luxembourg
Slovenia
Lithuania
Switzerland
Bulgaria
Ireland
Australia
HungaryIceland
FranceDenmark
LatviaRussian Federation
2
Norway
2
1
1
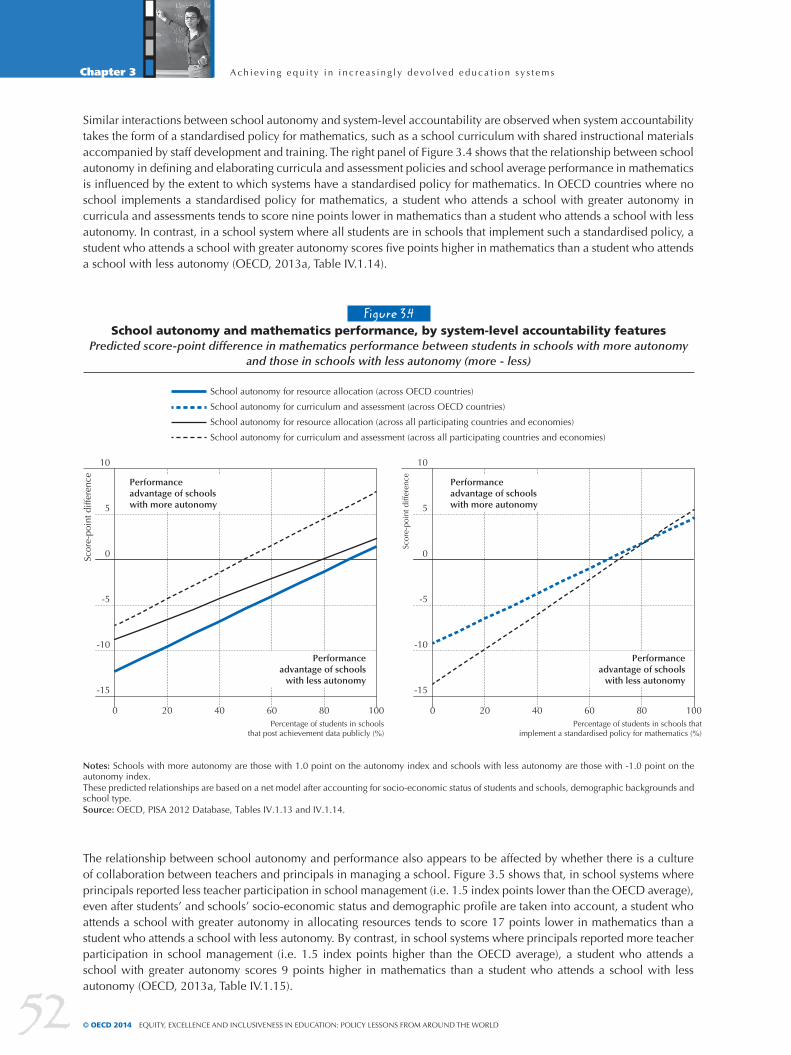
A ch i e v i n g e q u i t y i n i n c r e a s i n g l y d e vo l ve d e d u c a t i o n s y s t e m s
52
Chapter 3
© OECD 2014 Equity, ExcEllEncE and inclusivEnEss in Education: Policy lEssons from around thE World
Similar interactions between school autonomy and system-level accountability are observed when system accountability takes the form of a standardised policy for mathematics, such as a school curriculum with shared instructional materials accompanied by staff development and training. The right panel of Figure 3.4 shows that the relationship between school autonomy in defining and elaborating curricula and assessment policies and school average performance in mathematics is influenced by the extent to which systems have a standardised policy for mathematics. In OECD countries where no school implements a standardised policy for mathematics, a student who attends a school with greater autonomy in curricula and assessments tends to score nine points lower in mathematics than a student who attends a school with less autonomy. In contrast, in a school system where all students are in schools that implement such a standardised policy, a student who attends a school with greater autonomy scores five points higher in mathematics than a student who attends a school with less autonomy (OECD, 2013a, Table IV.1.14).
Figure 3.4School autonomy and mathematics performance, by system-level accountability features
Predicted score-point difference in mathematics performance between students in schools with more autonomyand those in schools with less autonomy (more - less)
Scor
e-po
int d
iffer
ence
10
5
0
-5
-10
-15
Notes: Schools with more autonomy are those with 1.0 point on the autonomy index and schools with less autonomy are those with -1.0 point on the autonomy index. These predicted relationships are based on a net model after accounting for socio-economic status of students and schools, demographic backgrounds and school type.Source: OECD, PISA 2012 Database, Tables IV.1.13 and IV.1.14.
Percentage of students in schoolsthat post achievement data publicly (%)
Percentage of students in schools thatimplement a standardised policy for mathematics (%)
School autonomy for resource allocation (across OECD countries)
School autonomy for curriculum and assessment (across OECD countries)
School autonomy for resource allocation (across all participating countries and economies)
School autonomy for curriculum and assessment (across all participating countries and economies)
0 20 40 60 80 100
Scor
e-po
int d
iffer
ence
10
5
0
-5
-10
-15
0 20 40 60 80 100
Performance advantage of schools with more autonomy
Performance advantage of schools
with less autonomy
Performance advantage of schools
with less autonomy
Performance advantage of schools with more autonomy
The relationship between school autonomy and performance also appears to be affected by whether there is a culture of collaboration between teachers and principals in managing a school. Figure 3.5 shows that, in school systems where principals reported less teacher participation in school management (i.e. 1.5 index points lower than the OECD average), even after students’ and schools’ socio-economic status and demographic profile are taken into account, a student who attends a school with greater autonomy in allocating resources tends to score 17 points lower in mathematics than a student who attends a school with less autonomy. By contrast, in school systems where principals reported more teacher participation in school management (i.e. 1.5 index points higher than the OECD average), a student who attends a school with greater autonomy scores 9 points higher in mathematics than a student who attends a school with less autonomy (OECD, 2013a, Table IV.1.15).

A ch i e v i n g e q u i t y i n i n c r e a s i n g l y d e vo l ve d e d u c a t i o n s y s t e m s
53
Chapter 3
Equity, ExcEllEncE and inclusivEnEss in Education: Policy lEssons from around thE World © OECD 2014
School choice and competition
Since the early 1980s, reforms in many countries have granted parents and students greater choice in the school the students will attend. Students and their families are given the freedom to seek and attend the school that best serves students’ education needs; that, in turn, introduces a level of competition among schools to attract students. Assuming that students and parents have all the required information about schools and choose schools based on academic criteria, the competition creates incentives for institutions to organise programmes and teach in ways that better meet diverse student requirements and interests, reducing the costs of failure and mismatches.
yet some of the assumptions underlying such reforms have been called into question (Schneider, Teske and Marshall, 2002; Hess and Loveless, 2005; Berends and Zottola, 2009). It is unclear, for example, whether parents have the necessary information to choose the best schools for their children. It is also unclear whether parents always give sufficient priority to high achievement, at the school level, when making these choices. School choice may also lead to unintended racial / ethnic or socio-economic segregation among schools (Gewirtz, Ball and Rowe, 1995; Whitty, Power and Halpin, 1998; Karsten, 1999; Viteritti, 1999; Plank and Sykes, 2003; Hsieh and Urquiola, 2006; Heyneman, 2009; Bunar, 2010a; Bunar, 2010b; Söderström and Uusitalo, 2010; Schneider and Buckley, 2002).
The degree of competition among schools is one way to measure school choice. According to PISA, on average across OECD countries, 41% of students are in schools where residence in a particular area is always considered for admission, while 59% are in schools where residence in a particular area is never or sometimes considered for admission to school. In fact, in 27 countries and economies, 70% of students or more are in schools where residence in a particular area is never or only sometimes considered for admission to school. Over 90% of students in Belgium, Croatia, Japan, Macao-China, Mexico, Montenegro, Peru, Romania, Serbia, Singapore and Slovenia attend such schools. By contrast, in Canada, Greece, Poland and the United States, 30% of students or fewer attend such schools (OECD, 2013a, Table IV.4.6).
Figure 3.5School autonomy and mathematics performance, by system-level teacher participation
in school managementPredicted score-point difference in mathematics performance between students in schools with more autonomy
and those in schools with less autonomy (more - less)
Scor
e-po
int d
iffer
ence
15
10
5
0
-5
-10
-15
-20
Notes: Schools with more autonomy are those with 1.0 point on the autonomy index and schools with less autonomy are those with -1.0 point on the autonomy index. These predicted relationships are based on a net model after accounting for socio-economic status of students and schools, demographic backgrounds and school type.Source: OECD, PISA 2012 Database, Table IV.1.15.
Average index of school management:Teacher participation (index points)
School autonomy for resource allocation (across OECD countries)
School autonomy for resource allocation (across all participating countries and economies)
-2 -1.5 -1.0 -0.5 0 0.5 1.0 1.5 2.0
Performance advantage of schools with more autonomy
Performance advantage of schools
with less autonomy

A ch i e v i n g e q u i t y i n i n c r e a s i n g l y d e vo l ve d e d u c a t i o n s y s t e m s
54
Chapter 3
© OECD 2014 Equity, ExcEllEncE and inclusivEnEss in Education: Policy lEssons from around thE World
Naturally, school systems in which more schools use admissions criteria other than the school catchment area tend to have more competition among schools. On average across OECD countries, 24% of students are in schools whose principals reported that there are no other schools in the areas that compete for students; 16% are in schools that compete with one other school; and 61% are in schools that compete with two or more other schools. Fewer than 50% of students in Finland, Iceland, Liechtenstein, Montenegro, Norway and Switzerland are in schools that compete with at least one other school for students, while over 90% of students in Australia, Belgium, Hong Kong-China, Indonesia, Japan, Korea, Latvia, Macao-China, the Netherlands, New Zealand, Singapore, Chinese Taipei, the United Arab Emirates and the United Kingdom attend such schools (OECD, 2013a, Table IV.4.4).
School competition is more common at the upper secondary level of education, where there is generally greater differentiation of education programmes than at lower levels of education. For example, in Viet Nam, 38% of lower secondary students attend schools that compete with at least one other school, while 83% of upper secondary students attend such schools – a 45 percentage-point difference. In Bulgaria, the Czech Republic, Greece, the Slovak Republic and Sweden, the difference between the two groups is between 21 and 39 percentage points. In contrast, in a few school systems, there is more competition at the lower secondary than at the upper secondary level. For example, in Austria, 80% of lower secondary students attend schools that compete for students with at least one other school, while 59% of upper secondary students attend such schools (OECD, 2013a, Table IV.4.5).
However, as Figure 3.6 shows, even when admission to schools is not based on catchment area, individual schools are not always competing with other schools for enrolment. Some schools use residential area as the criterion for selecting students, but there may be several schools within the area, so that schools still have to compete for enrolment with other schools. In contrast, not all schools that do not use the school catchment area as a criterion for admission compete with other schools for enrolment; there may, for example, be no other school in the area.
Even if there are other schools in the same area, if these schools have different levels of academic achievement, different instructional or religious philosophies, or offer different programmes, school principals may not perceive that there are schools in the same area competing for enrolment. In Belgium, Canada, Finland, Japan, Mexico, Qatar and Singapore, schools that always consider residence in a particular area for admission to school are more likely to compete with other schools for enrolment than schools that never or sometimes use residence as a criterion for admission (the percentage-point difference in the prevalence of school competition between the two groups is between 0.7 and 16.4). In contrast, in Iceland, Ireland, Luxembourg, Montenegro, Peru, Shanghai-China and the United Kingdom, schools that never or sometimes consider residence in a particular area for admission to school are more likely to compete with other schools for enrolment than schools that always consider residence as a criterion for admission. The difference in the prevalence of school competition between the two groups is between 7.8 and 28.6 percentage points (OECD, 2013a,Table IV.4.6).
Principals’ perceptions of school competition are not necessarily the same as those of the parents of students in their schools. In 11 countries and economies, PISA asked parents of students who participated in PISA 2012 to report whether there are one or more schools in the same area that compete with the school their child attends.2 As expected, in all of these countries and economies, parents in schools whose principals reported that the school competes with other schools for students were more likely to report that there is at least one other school competing with the school their child attends, than parents in schools whose principals reported that the school does not compete with any other school. However, even among parents whose children attend schools that compete with one or more other schools, according to principals, the parents of between 20% and 45% of these students reported that no other school competes for enrolment with their child’s school. There are various reasons for this discrepancy. For example, these parents might not have enough information about other schools in the area. Even if they are aware that there are other schools in the vicinity, those schools may already be full, parents might think that those schools are too far, the schools’ level of academic achievement does not meet the parents’ standards, or school fees are too high, so that parents do not consider these schools as competitors with their children’s school (OECD, 2013a, Table IV.4.9).
What parents look for when choosing a school for their child
These results show that school competition is a multi-faceted concept, affected by such factors as local school markets, school performance, affordability, capacity and enrolment patterns. To understand differences in how parents choose schools for their children, parents in the 11 countries that distributed the parent questionnaire were asked a series of questions regarding school choice. As shown in Figure 3.7, in nine of these countries and economies, over 50% of parents reported that a safe school environment is a very important criterion when choosing a school for their child.
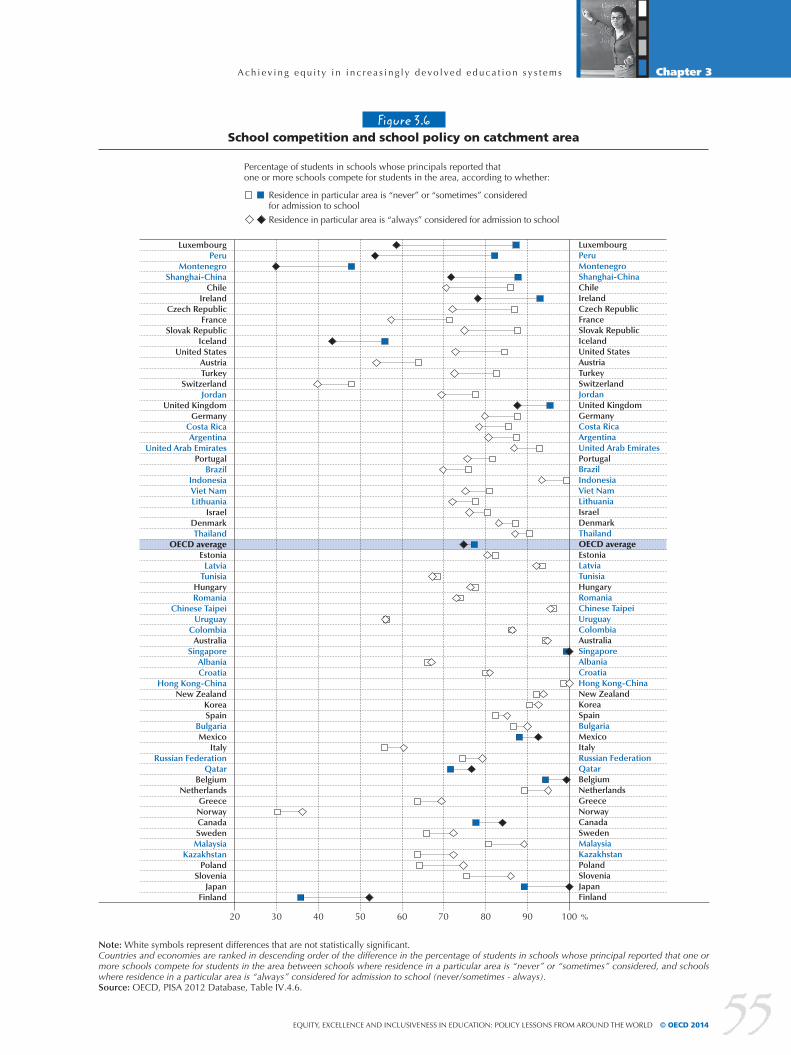
A ch i e v i n g e q u i t y i n i n c r e a s i n g l y d e vo l ve d e d u c a t i o n s y s t e m s
55
Chapter 3
Equity, ExcEllEncE and inclusivEnEss in Education: Policy lEssons from around thE World © OECD 2014
Figure 3.6School competition and school policy on catchment area
Note: White symbols represent differences that are not statistically signi�cant.Countries and economies are ranked in descending order of the difference in the percentage of students in schools whose principal reported that one or more schools compete for students in the area between schools where residence in a particular area is “never” or “sometimes” considered, and schools where residence in a particular area is “always” considered for admission to school (never/sometimes - always). Source: OECD, PISA 2012 Database, Table IV.4.6.
%706050403020 80 90 100
Residence in particular area is “never” or “sometimes” considered for admission to school
Percentage of students in schools whose principals reported that one or more schools compete for students in the area, according to whether:
Residence in particular area is “always” considered for admission to school
LuxembourgPeru
MontenegroShanghai-China
ChileIreland
Czech RepublicFrance
Slovak RepublicIceland
United StatesAustriaTurkey
SwitzerlandJordan
United KingdomGermany
Costa RicaArgentina
United Arab EmiratesPortugal
BrazilIndonesiaViet NamLithuania
IsraelDenmarkThailand
OECD averageEstonia
LatviaTunisia
HungaryRomania
Chinese TaipeiUruguay
ColombiaAustralia
SingaporeAlbaniaCroatia
Hong Kong-ChinaNew Zealand
KoreaSpain
BulgariaMexico
ItalyRussian Federation
QatarBelgium
NetherlandsGreeceNorwayCanadaSwedenMalaysia
KazakhstanPoland
SloveniaJapan
Finland
LuxembourgPeruMontenegroShanghai-ChinaChileIrelandCzech RepublicFranceSlovak RepublicIcelandUnited StatesAustriaTurkeySwitzerlandJordanUnited KingdomGermanyCosta RicaArgentinaUnited Arab EmiratesPortugalBrazilIndonesiaViet NamLithuaniaIsraelDenmarkThailandOECD averageEstoniaLatviaTunisiaHungaryRomaniaChinese TaipeiUruguayColombiaAustraliaSingaporeAlbaniaCroatiaHong Kong-ChinaNew ZealandKoreaSpainBulgariaMexicoItalyRussian FederationQatarBelgiumNetherlandsGreeceNorwayCanadaSwedenMalaysiaKazakhstanPolandSloveniaJapanFinland

A ch i e v i n g e q u i t y i n i n c r e a s i n g l y d e vo l ve d e d u c a t i o n s y s t e m s
56
Chapter 3
© OECD 2014 Equity, ExcEllEncE and inclusivEnEss in Education: Policy lEssons from around thE World
Figure 3.7 (1/2)Parents’ reports on criteria used to choose schools for their child,
by students’ socio-economic statusPercentage of parents who reported that the following criteria are very important in choosing a school for their child
Notes: White symbols represent differences between top quarter and bottom quarter of ESCS (top - bottom) that are not statistically signi�cant.ESCS refers to the PISA index of economic, social and cultural status.Countries and economies are ranked in descending order of the percentage of parents (all parents) who reported that each criterion is very important. Source: OECD, PISA 2012 Database, Tables IV.4.10 and IV.4.11.
All parents
Parents at the top quarter of ESCSParents at the bottom quarter of ESCS
%
80
60
40
20
0
Port
ugal
Mex
ico
Chi
le
Kor
ea
Ger
man
y
Hun
gary
Cro
atia
Belg
ium
(Fl.
Com
m.)
Mac
ao-C
hina
Hon
g K
ong-
Chi
na
Ital
y
The school is a short distance from home %
80
60
40
20
0
Chi
le
Cro
atia
Hon
g K
ong-
Chi
na
Kor
ea
Port
ugal
Mex
ico
Ital
y
Hun
gary
Ger
man
y
Belg
ium
(Fl.
Com
m.)
Mac
ao-C
hina
The school adheres to a particular religious philosophy
%
80
60
40
20
0
Port
ugal
Chi
le
Mex
ico
Hon
g K
ong-
Chi
na
Belg
ium
(Fl.
Com
m.)
Ger
man
y
Kor
ea
Ital
y
Mac
ao-C
hina
Hun
gary
Cro
atia
The school has a good reputation %
80
60
40
20
0
Mex
ico
Mac
ao-C
hina
Chi
le
Kor
ea
Hon
g K
ong-
Chi
na
Port
ugal
Ital
y
Ger
man
y
Belg
ium
(Fl.
Com
m.)
Hun
gary
The school has a particular approach to pedagogy
%
80
60
40
20
0
Port
ugal
Belg
ium
(Fl.
Com
m.)
Chi
le
Mex
ico
Cro
atia
Hun
gary
Ger
man
y
Kor
ea
Ital
y
Mac
ao-C
hina
Hon
g K
ong-
Chi
na
The school offers particular courses or subjects %
80
60
40
20
0
Chi
le
Mex
ico
Port
ugal
Ital
y
Mac
ao-C
hina
Hun
gary
Belg
ium
(Fl.
Com
m.)
Ger
man
y
Hon
g K
ong-
Chi
na
Cro
atia
Kor
ea
Other family members attend the school
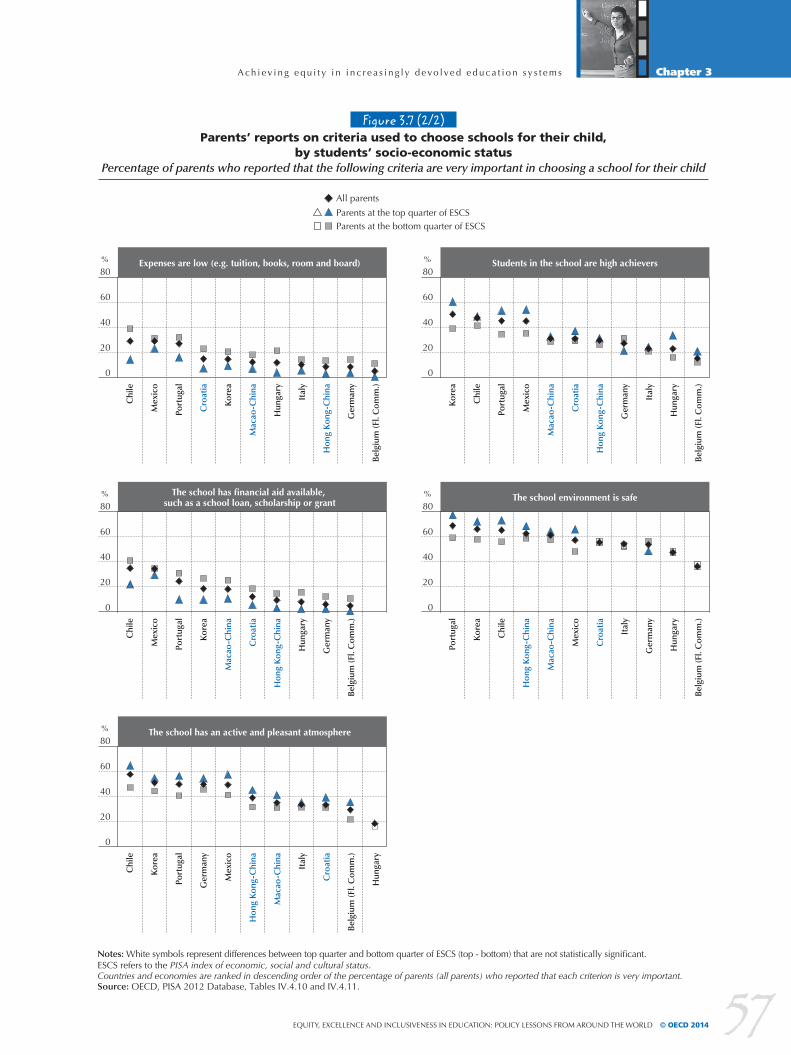
A ch i e v i n g e q u i t y i n i n c r e a s i n g l y d e vo l ve d e d u c a t i o n s y s t e m s
57
Chapter 3
Equity, ExcEllEncE and inclusivEnEss in Education: Policy lEssons from around thE World © OECD 2014
Figure 3.7 (2/2)Parents’ reports on criteria used to choose schools for their child,
by students’ socio-economic statusPercentage of parents who reported that the following criteria are very important in choosing a school for their child
Notes: White symbols represent differences between top quarter and bottom quarter of ESCS (top - bottom) that are not statistically signi�cant.ESCS refers to the PISA index of economic, social and cultural status.Countries and economies are ranked in descending order of the percentage of parents (all parents) who reported that each criterion is very important. Source: OECD, PISA 2012 Database, Tables IV.4.10 and IV.4.11.
All parents
Parents at the top quarter of ESCSParents at the bottom quarter of ESCS
%
80
60
40
20
0
Chi
le
Mex
ico
Port
ugal
Cro
atia
Kor
ea
Mac
ao-C
hina
Hun
gary
Ital
y
Hon
g K
ong-
Chi
na
Ger
man
y
Belg
ium
(Fl.
Com
m.)
Expenses are low (e.g. tuition, books, room and board) %
80
60
40
20
0
Kor
ea
Chi
le
Port
ugal
Mex
ico
Mac
ao-C
hina
Cro
atia
Hon
g K
ong-
Chi
na
Ger
man
y
Ital
y
Hun
gary
Belg
ium
(Fl.
Com
m.)
Students in the school are high achievers
%
80
60
40
20
0
Chi
le
Mex
ico
Port
ugal
Kor
ea
Mac
ao-C
hina
Cro
atia
Hon
g K
ong-
Chi
na
Hun
gary
Ger
man
y
Belg
ium
(Fl.
Com
m.)
The school has �nancial aid available, such as a school loan, scholarship or grant
%
80
60
40
20
0
Port
ugal
Kor
ea
Chi
le
Hon
g K
ong-
Chi
na
Mac
ao-C
hina
Mex
ico
Cro
atia
Ital
y
Ger
man
y
Hun
gary
Belg
ium
(Fl.
Com
m.)
The school environment is safe
%
80
60
40
20
0
Chi
le
Kor
ea
Port
ugal
Ger
man
y
Mex
ico
Hon
g K
ong-
Chi
na
Mac
ao-C
hina
Ital
y
Cro
atia
Belg
ium
(Fl.
Com
m.)
Hun
gary
The school has an active and pleasant atmosphere
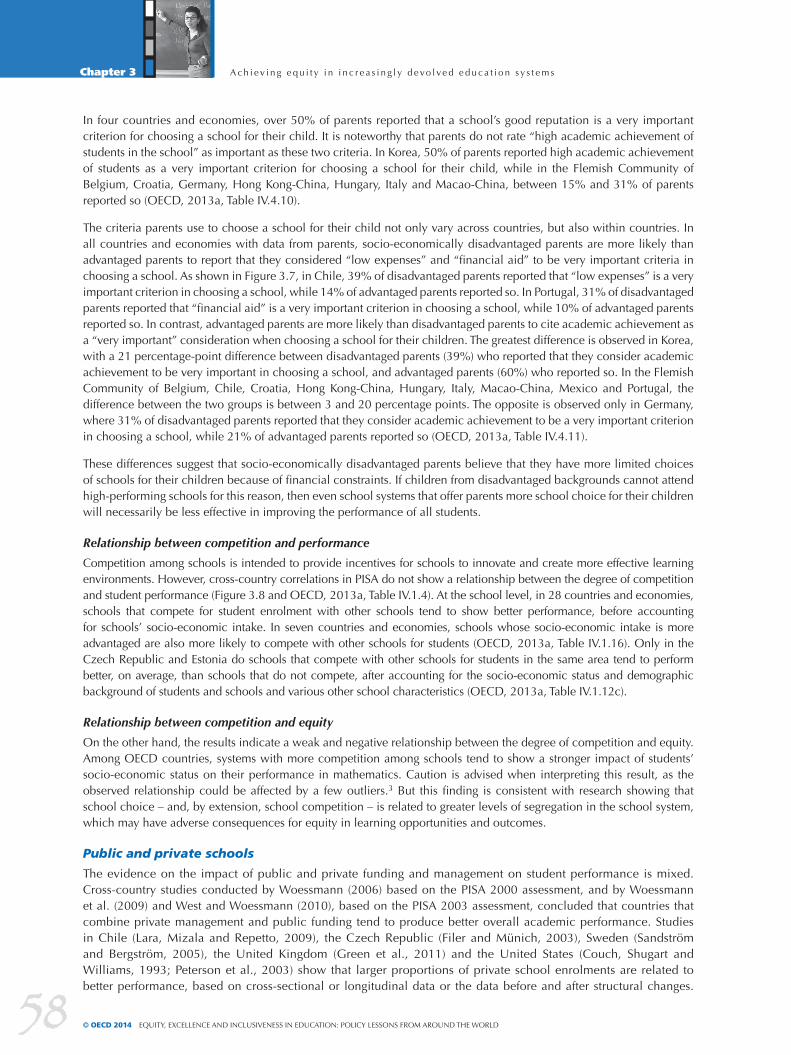
A ch i e v i n g e q u i t y i n i n c r e a s i n g l y d e vo l ve d e d u c a t i o n s y s t e m s
58
Chapter 3
© OECD 2014 Equity, ExcEllEncE and inclusivEnEss in Education: Policy lEssons from around thE World
In four countries and economies, over 50% of parents reported that a school’s good reputation is a very important criterion for choosing a school for their child. It is noteworthy that parents do not rate “high academic achievement of students in the school” as important as these two criteria. In Korea, 50% of parents reported high academic achievement of students as a very important criterion for choosing a school for their child, while in the Flemish Community of Belgium, Croatia, Germany, Hong Kong-China, Hungary, Italy and Macao-China, between 15% and 31% of parents reported so (OECD, 2013a, Table IV.4.10).
The criteria parents use to choose a school for their child not only vary across countries, but also within countries. In all countries and economies with data from parents, socio-economically disadvantaged parents are more likely than advantaged parents to report that they considered “low expenses” and “financial aid” to be very important criteria in choosing a school. As shown in Figure 3.7, in Chile, 39% of disadvantaged parents reported that “low expenses” is a very important criterion in choosing a school, while 14% of advantaged parents reported so. In Portugal, 31% of disadvantaged parents reported that “financial aid” is a very important criterion in choosing a school, while 10% of advantaged parents reported so. In contrast, advantaged parents are more likely than disadvantaged parents to cite academic achievement as a “very important” consideration when choosing a school for their children. The greatest difference is observed in Korea, with a 21 percentage-point difference between disadvantaged parents (39%) who reported that they consider academic achievement to be very important in choosing a school, and advantaged parents (60%) who reported so. In the Flemish Community of Belgium, Chile, Croatia, Hong Kong-China, Hungary, Italy, Macao-China, Mexico and Portugal, the difference between the two groups is between 3 and 20 percentage points. The opposite is observed only in Germany, where 31% of disadvantaged parents reported that they consider academic achievement to be a very important criterion in choosing a school, while 21% of advantaged parents reported so (OECD, 2013a, Table IV.4.11).
These differences suggest that socio-economically disadvantaged parents believe that they have more limited choices of schools for their children because of financial constraints. If children from disadvantaged backgrounds cannot attend high-performing schools for this reason, then even school systems that offer parents more school choice for their children will necessarily be less effective in improving the performance of all students.
Relationship between competition and performance
Competition among schools is intended to provide incentives for schools to innovate and create more effective learning environments. However, cross-country correlations in PISA do not show a relationship between the degree of competition and student performance (Figure 3.8 and OECD, 2013a, Table IV.1.4). At the school level, in 28 countries and economies, schools that compete for student enrolment with other schools tend to show better performance, before accounting for schools’ socio-economic intake. In seven countries and economies, schools whose socio-economic intake is more advantaged are also more likely to compete with other schools for students (OECD, 2013a, Table IV.1.16). Only in the Czech Republic and Estonia do schools that compete with other schools for students in the same area tend to perform better, on average, than schools that do not compete, after accounting for the socio-economic status and demographic background of students and schools and various other school characteristics (OECD, 2013a, Table IV.1.12c).
Relationship between competition and equity
On the other hand, the results indicate a weak and negative relationship between the degree of competition and equity. Among OECD countries, systems with more competition among schools tend to show a stronger impact of students’ socio-economic status on their performance in mathematics. Caution is advised when interpreting this result, as the observed relationship could be affected by a few outliers.3 But this finding is consistent with research showing that school choice – and, by extension, school competition – is related to greater levels of segregation in the school system, which may have adverse consequences for equity in learning opportunities and outcomes.
Public and private schools
The evidence on the impact of public and private funding and management on student performance is mixed. Cross-country studies conducted by Woessmann (2006) based on the PISA 2000 assessment, and by Woessmann et al. (2009) and West and Woessmann (2010), based on the PISA 2003 assessment, concluded that countries that combine private management and public funding tend to produce better overall academic performance. Studies in Chile (Lara, Mizala and Repetto, 2009), the Czech Republic (Filer and Münich, 2003), Sweden (Sandström and Bergström, 2005), the United Kingdom (Green et al., 2011) and the United States (Couch, Shugart and Williams, 1993; Peterson et al., 2003) show that larger proportions of private school enrolments are related to better performance, based on cross-sectional or longitudinal data or the data before and after structural changes.
A ch i e v i n g e q u i t y i n i n c r e a s i n g l y d e vo l ve d e d u c a t i o n s y s t e m s
59
Chapter 3
Equity, ExcEllEncE and inclusivEnEss in Education: Policy lEssons from around thE World © OECD 2014
Figure 3.8School competition and mathematics performance
Across OECD countries
Mat
hem
atic
s pe
rfor
man
ce (s
core
poi
nts)
650
600
550
500
450
400
350
300
Before accounting for per capita GDPFitted line before accounting for per capita GDP1
After accounting for per capita GDPFitted line after accounting for per capita GDP1
R² = 0.000
R² = 0.004
R² = 0.025R² = 0.030
School competition (%)30 40 60 9070 8050 100
Across all participating countries and economies
Mat
hem
atic
s pe
rfor
man
ce (s
core
poi
nts)
650
600
550
500
450
400
350
300
School competition (%)30 40 60 9070 8050 100
Note: School competition refers to the percentage of students in schools whose principal reported that one or more schools compete for students in the same area.1. A non-signi�cant relationship (p > 0.10) is shown by the dotted line. Source: OECD, PISA 2012 Database, Table IV.1.4.
United States
Chile
Netherlands
New Zealand
MexicoTurkey
United Kingdom
GreeceIsrael
PeruIndonesia
Tunisia Jordan
Japan
Qatar
Uruguay
Costa Rica
ArgentinaColombia
BrazilAlbania
Kazakhstan
Malaysia
Romania United Arab Emirates
Hong Kong-China
Shanghai-China
Chinese Taipei
Viet Nam
Singapore
EstoniaFinland
Korea
Serbia Thailand
Montenegro
BelgiumPoland
SwedenItaly
Austria
Luxembourg
Slovenia
Lithuania
Switzerland
Bulgaria
Norway
Macao-China
1
Slovak Republic
Germany
CroatiaCanada
Czech RepublicPortugal
Spain
Ireland
Hungary
DenmarkRussian Federation
United States
Estonia
Norway
Hungary Chile
Spain
Slovak Republic
Luxembourg Germany
Netherlands
New Zealand
Mexico
Turkey
Finland
Canada
Sweden
Japan
Korea
Belgium
United Kingdom
Switzerland
Greece
Israel
Poland
Portugal
IcelandItaly
Slovenia
Austria
Czech Republic
Ireland
AustraliaFrance
Denmark
AustraliaIcelandFrance
Latvia
1

A ch i e v i n g e q u i t y i n i n c r e a s i n g l y d e vo l ve d e d u c a t i o n s y s t e m s
60
Chapter 3
© OECD 2014 Equity, ExcEllEncE and inclusivEnEss in Education: Policy lEssons from around thE World
Figure 3.9School type and mathematics performance
Government-independent
private schools3
Note: White symbols represent differences that are not statistically signi�cant.1. Schools that are directly controlled or managed by: a public education authority or agency; or a government agency directly or a governing body, most of whose members are either appointed by a public authority or elected by public franchise.2. Schools that receive 50% or more of their core funding (i.e. funding that supports the basic educational services of the institution) from government agencies.3. Schools that receive less than 50% of their core funding (i.e. funding that supports the basic educational services of the institution) from government agencies. Countries and economies are ranked in descending order of the score-point difference in mathematics performance between public and private schools (government-dependent and government-independent schools combined). Source: OECD, PISA 2012 Database, Table IV.4.7.
Score-point difference-125 -100 -75 -50 50 75250-25 100
Observed performance difference
Government or public schools1
Government-dependent
private schools2
Performance difference after accounting for the PISA index of economic, social and cultural status of students
Performance difference after accounting for the PISA index of economic, social and cultural status of students and schools
Score-point difference in mathematics performance between public and private schools (government-dependent and government-independent schools combined)
Percentage of students attending:
Chinese TaipeiHong Kong-China
ThailandViet Nam
LuxembourgSwitzerland
IndonesiaItaly
KazakhstanJapan
Czech RepublicNetherlands
EstoniaAlbaniaIreland
United StatesHungarySweden
KoreaUnited Kingdom
FinlandDenmark
OECD averageFrance
Shanghai-ChinaAustralia
SpainSlovak Republic
MexicoGermany
AustriaColombia
ChileCanadaPolandJordan
ArgentinaUnited Arab Emirates
PortugalPeru
Costa RicaBrazil
New ZealandMalaysiaSloveniaUruguay
Qatar
687
839385945995977092349892449584865356977782839161689191959186379297836855908587879597988362
592120
131
172107
6620
540
161431363
1914170
262490584
48421
261604100201
2815725
2432
3010182500
16804409
1370901
101431
167
454
151013530
1737
Performance advantage
of private schools
Performance advantage
of public schools
A ch i e v i n g e q u i t y i n i n c r e a s i n g l y d e vo l ve d e d u c a t i o n s y s t e m s
61
Chapter 3
Equity, ExcEllEncE and inclusivEnEss in Education: Policy lEssons from around thE World © OECD 2014
But the debate on performance is far from conclusive, as other studies report little, negative or insignificant effects, and the results often depend on methodological choices. For example, other studies based on state-level data from the United States concluded that higher private school enrolment is not significantly related to performance (Wrinkle et al., 1999; Geller, Sjoquist and Walker, 2006; Sander, 1999). A few studies show small negative effects (Smith and Meier, 1995), negative effects for low-income districts (Maranto, Milliman and Scott, 2000), or that the relationship depends on the education outcome that is measured (Greene and Kang, 2004).
PISA 2012 found that, across OECD countries and all countries and economies that participated in the assessment, the percentage of students enrolled in private schools is not related to a system’s overall performance (OECD, 2013a, Table IV.1.4).
At the school level, when average performance is compared simply between public and private schools, without accounting for background aspects, private schools tend to show better mathematics performance than public schools in 28 countries and economies (Figure 3.9 and OECD, 2013a, Table IV.4.7). The score-point difference ranges from 12 points in Ireland to 108 points – or the equivalent of nearly three years of schooling – in Qatar. By contrast, in Hong Kong-China, Luxembourg, Chinese Taipei and Thailand, the average score among public schools is higher than that among private schools by 13 to 60 points. The proportion of students in private schools is unrelated to the magnitude of the difference in performance between students who attend private and public schools.4
Students who attend private schools tend to be more socio-economically advantaged than students who attend public schools. Thus, after accounting for the socio-economic status of students and schools, private schools outperform public schools in only 13 countries and economies, and public schools outperform private schools in eight countries and economies (OECD, 2013a, Table IV.4.7). In addition, after accounting for the demographic background of students and schools and various other school characteristics, private schools outperform public schools in 10 countries and economies, while public schools show better average mathematics performance than private schools in five countries and economies (OECD, 2013a, Table IV.1.12c).
Early education
Students who attended pre-primary education tend to perform better at the age of 15 than those who did not attend pre-primary education, as shown in PISA results. This relationship is also apparent at the school level. In 17 countries and economies, schools with more students who had attended pre-primary education for more than one year tend to show better average mathematics performance (OECD, 2013a, Table IV.1.12c). At the system level, across all PISA-participating countries and economies, there is also a relationship between the proportion of students who had attended pre-primary education for more than one year and systems’ overall performance in mathematics. Some 32% of the variation in mathematics performance across all countries and economies can be explained by the difference in the percentage of students who attended pre-primary education for more than one year, after accounting for per capita GDP (OECD, 2013a, Table IV.1.2).
PoInTerS for PolICy anD PraCTICeDesigning education systems that combine excellence, equity and inclusiveness is possible, as PISA shows. The highest-performing OECD education systems develop comprehensive education systems that provide high-quality learning opportunities to the vast majority of students, compensating for disadvantages caused by students’ family backgrounds and personal circumstances. Top performers set high expectations for every child and invest resources strategically to enable them to overcome disadvantage. In recent years, a number of countries have reformed their education systems so that both excellence and equity have improved. For example, recent reforms in Germany and Poland have both raised academic achievement and narrowed the gap between students (OECD, 2011). In these and a number of other OECD countries, there remains significant room for enhancing equity and bolstering students’ success simultaneously.
Avoid socio-economic segregation
Socio-economic segregation among schools is partially explained by residential segregation. Although urban policies can play an important role in redressing inequalities, school-choice schemes can either narrow or widen socio-economic differences in student populations among schools. School-choice schemes that do not take equity considerations into account can lead to greater sorting and segregation of students by ability, income and ethnic background (Musset, 2012).
Research has shown that oversubscribed schools tend to be selective in their admissions and to select students who are easier to teach and more able to learn, crowding out low-achieving students (Lubienski, 2006). In addition, better-off

A ch i e v i n g e q u i t y i n i n c r e a s i n g l y d e vo l ve d e d u c a t i o n s y s t e m s
62
Chapter 3
© OECD 2014 Equity, ExcEllEncE and inclusivEnEss in Education: Policy lEssons from around thE World
parents are more likely to exercise school choice, as they have more information and resources, and usually enrol their children in high-quality schools. In contrast, more disadvantaged parents tend to exercise choice less and send their children to their local neighbourhood schools. Less-educated families may not be able to assess the information required to make informed school-choice decisions, or have different preferences in school characteristics (Hastings, Kane and Staiger, 2005).
Although parents may be concerned about equity and integration and may support their neighbourhood school, at the same time, they seek the “best” education for their children (Crozier et al., 2008; Raveaud and Van Zanten, 2007). More advantaged parents tend to avoid schools with a significant number of disadvantaged students, and research suggests that parents prefer schools with student populations that are ethnically similar to their own family (Schneider and Buckley, 2002; Hastings, Kane and Staiger, 2005).5 All these elements contribute to socio-economic segregation between schools.
If parents are to exercise choice equitably, there must not only be alternatives to choose from, but these should be available to all families and should not widen inequities nor exacerbate segregation. In some countries, private schools can receive public funding, which may explain why the most disadvantaged students enrol in them. In some of these countries, like Finland and Korea, there is little or no difference in the socio-economic profile of students attending public and private schools. But in other countries, such as Chile and Spain, advantaged and disadvantaged families make very different decisions about the schools their children attend, contributing to further segregation.
Controlled-choice programmes
Controlled-choice programmes, also called flexible-enrolment plans, combine choice with equity. They introduce mechanisms that ensure that children are allocated to schools more equitably, in relation to their socio-economic status and ethnic origin, for example, and that in the event of oversubscription, disadvantaged students are not crowded out. In some school systems, the education authority has been given greater responsibility for assigning students to schools (Boxes 3.1 and 3.2).
Box 3.1. Improving equity in Belgium’s (French Community) enrolment system
The French Community of Belgium, which offers parents and students a high degree of school choice, recently adopted a scheme to regulate enrolments in the first year of secondary education. This was done to ensure that all families have equal access to the lower secondary school of their choice, to prevent dropout, and to maintain a good social, cultural and academic mix of students in every school.
Through the scheme, parents are given a pre-printed form on which they indicate their preferred school and any other choice of schools, in order of preference. Parents are also asked to report on the proximity of their home to the primary school their child attended, the proximity of their home to their preferred secondary school, the proximity of the preferred secondary school to the primary school the child attended, and other schools located in the municipality of their child’s primary school. Parents are also asked whether the child aims to continue immersion learning begun in primary school and whether there is a partnership between the primary and preferred secondary schools. Each child is then given a ranking based on a composite index of these criteria.
If the number of applications received by the preferred lower secondary school does not exceed the number of places available, all enrolment applications are accepted. In all other cases, the school ranks the applications on the basis of objective, weighted geographical and educational criteria, and awards 80% of the places in accordance with the ranking, while ensuring that the remaining places are awarded to pupils from disadvantaged primary schools.
An Inter-Network Enrolment Commission manages the cases of those students who could not be enrolled in their first-choice school. These students are allocated places in the schools where there are still some available or are allocated one of the reserved places in the schools that are already 80% “full”.
After this process is completed, enrolments may be resumed on a first-come, first-served basis.
For more information, see Eurypedia (https://webgate.ec.europa.eu).
A ch i e v i n g e q u i t y i n i n c r e a s i n g l y d e vo l ve d e d u c a t i o n s y s t e m s
63
Chapter 3
Equity, ExcEllEncE and inclusivEnEss in Education: Policy lEssons from around thE World © OECD 2014
Financial incentives for schools
In addition to controlled-choice programmes, countries can consider a number of incentives for schools to enrol disadvantaged students and to encourage disadvantaged parents to exercise choice. Financial incentives can be offered to make low-performing or disadvantaged students more attractive to schools. Some countries have experimented with providing more funding for low-performing students to offset the additional costs to educate them and to make them more attractive to popular schools. This is done through progressive voucher schemes or weighted student funding (“virtual vouchers”). In these schemes, funding follows the students on a per-student basis, and the amount offered depends on the educational needs of the children (Ladd and Fiske, 2009). Since the amount of the voucher is higher for children with the greatest needs, schools will have more of an incentive to attract such students and provide them with the appropriate resources (Levin and Belfield, 2004), thus helping to reduce segregation.
“Cream skimming”, when schools select advantaged students over disadvantaged students, may occur if schools have discretion over admissions criteria, time of registration or tuition fees. For example, better-informed parents tend to enrol their children in the school of their choice very early on, in order to obtain a slot in the highest-quality schools. This can be avoided by setting a similar admission time in all schools. If admissions policies are established by a central independent authority, schools have fewer opportunities to select students using particular criteria that benefit better-off children. In many OECD countries, the criteria that can be applied by schools are generally restricted. In Sweden, independent schools received 85% of average per-student spending in each local authority and, when this measure was introduced, were allowed to charge a small fee. However, since 1997 independent schools receive the same funding as public schools and additional fees are forbidden (Box 3.3).
Box 3.2. Controlled-choice programmes in the United States, the Netherlands and Spain
In Cambridge, massachusetts (united states) a controlled-choice programme ranks the preferred schools and reviews and allocates students centrally, taking capacity and diversity criteria into consideration. This controlled-choice plan, first implemented in 1981, has evolved into a system where new families visit a central registration area, choose four schools, and rank them in order of preference. The district reviews the lists and tries to assign students to their school of choice, but it also tries to ensure that no school exceeds its capacity and that all schools reflect the district’s racial and ethnic composition.
nijmegen (the netherlands) also uses a central subscription system to assign students to primary schools, in order to reach a share of 30% of disadvantaged students in each school. In the event of oversubscription, priority is given to siblings and children who live nearby. Subsequent priority is given to either advantaged or disadvantaged students, in order to reach the required balance, by a lottery system. This policy was introduced in April 2009 and has not yet been evaluated. rotterdam uses double waiting lists, which allow oversubscribed schools to give preference to children who would enrich their ethnic and socio-economic mix.
In spain, parents have free choice as long as there are places available in the schools they prefer. In the event of oversubscription, the first criterion considered is prior attendance at the institution. If additional selection criteria are needed, applications are weighted according to whether there are siblings enrolled in the school, proximity to the family’s home, parents or legal tutors working at the school, annual family income and disabilities. Regional education authorities can establish quotas to preserve a balanced distribution of students. In addition, latecomers are also accommodated equitably, since the number of pupils per class in public and publicly-funded private schools in the same area can be increased by 10% in order to allow them to attend oversubscribed schools. Despite regulations to avoid selecting advantaged over disadvantaged students, advantaged students are over-represented in publicly subsidised private schools because these are located in high-income neighbourhoods, and the proximity criterion plays a key role in the allocation procedure. Charging complementary fees and irregularities in the admissions process have repeatedly been observed (Calero, 2005).
Sources: Calero (2005); Kahlenberg (2006); Ladd, Fiske and Ruijs (2009).
A ch i e v i n g e q u i t y i n i n c r e a s i n g l y d e vo l ve d e d u c a t i o n s y s t e m s
64
Chapter 3
© OECD 2014 Equity, ExcEllEncE and inclusivEnEss in Education: Policy lEssons from around thE World
Financial assistance for disadvantaged parents
The costs of attending the desired school, including enrolment fees, may deter parents from disadvantaged backgrounds from choosing that option for their children. In some countries, the choices that parents can actually consider depend on their ability to pay. Vouchers or tax credits can be offered to reduce the financial burden of tuition fees on low-income families. Other costs, such as transport costs and related expenses incurred in looking after the child before or after school, additional lessons, uniforms, classroom materials, textbooks, school trips and voluntary contributions, should also be considered, as research shows that these can influence choice. Vouchers may not fully cover all tuition fees and, even when they do, schools may be able to charge top-up fees that, essentially, exclude students from disadvantaged backgrounds. Elacqua (2009) suggests that, in Chile, tuition fees are one of the main determinants of stratification between public and private voucher schools.
Box 3.3. School vouchers in Sweden
In the early 1990s, sweden introduced major reforms to decentralise primary and secondary education to municipalities. In 1992 the government introduced a voucher programme enabling families to choose among public and private schools, known as independent schools.
Independent schools can receive public funding, on certain conditions, if they are approved by the schools inspectorate. Grant-aided independent providers are required to follow the national curriculum and are forbidden to establish admissions policies based on academic ability, socio-economic status or ethnicity. Independent schools were allowed to charge top-up fees until 1997. The grant per pupil allocated to the independent school (grundbelopp, basic grant) is the same amount the pupil would have cost the municipality if the pupil had attended a school run by the municipality, and is calculated in the same way as the municipality calculates the costs for its own public schools. On top of the basic grant, the municipality must pay a supplementary grant (tilläggsbelopp) for pupils with disabilities who qualify for extraordinary support.
The number of students enrolled in grant-aided independent schools has risen considerably in primary and lower secondary school, from 2% in the school year 1994/95 to more than 10% in the year 2009/10, and the expansion is even greater at the upper secondary level. Evidence of the impact on academic performance shows slight positive effects, although these are insignificant for students with low-educated parents or those from an immigrant background. The programme has also resulted in more segregation between schools (Nicaise et al., 2005).
Sources: Björklund et al. (2005); Böhlmark and Lindahl (2007); Nicaise et al. (2005).
Inform all parents of the choices available to them
One of the main reasons why disadvantaged parents exercise choice less is because they have more difficulty obtaining and assessing information on alternative schools and on the quality of the education those schools provide. To redress this imbalance, education systems can:
• Raise awareness about the importance of exercising choice, particularly among those who exercise choice the least. For example, a district in Milwaukee (United States) set up an extensive programme, including sending volunteers door-to-door in low-income and non-English speaking communities, setting up information booths in shopping malls, organising a fair, and establishing telephone hotlines, to inform parents about school choice. As a result of these actions, 95% of families filled in their school-choice forms (Godwin et al., 2006).
• Provide parents with more and more relevant information about schools. Parents should be aware of the strengths and weaknesses of alternative schools as well as the dates and procedures for school enrolment. Information should also be available in selected foreign languages and should be accessible to parents with limited literacy. Since local authorities have first-hand knowledge about schools and also have a general interest in student allocations, they may be better suited to provide quality information to parents. Indeed, in three out of four countries where information is provided, local authorities are involved in disseminating this information.

A ch i e v i n g e q u i t y i n i n c r e a s i n g l y d e vo l ve d e d u c a t i o n s y s t e m s
65
Chapter 3
Equity, ExcEllEncE and inclusivEnEss in Education: Policy lEssons from around thE World © OECD 2014
In some countries, performance data are published to foster competition, while in others this information is not published to avoid segregation and stigmatisation. Whatever the rules on publication, information may not be easy to access or to understand. Information that includes performance data can lead to further segregation unless it is accompanied by other measures to support school choice. Value-added information, which measures the actual contribution of the school, should be preferred to raw performance data (OECD, 2008).
Foster collaboration among all schools
Some argue that greater school autonomy and more choice will inevitably work against collaboration among schools. However, greater school autonomy does not necessarily lead to less collaboration among schools and school leaders; in fact, collaboration can complement school autonomy, and networks of schools can bolster innovation (see Boxes 3.4 and 3.5).
Professional standards that transcend individual schools can both strengthen collaboration and help to reduce school segregation. In the United States, the National Board for Professional Teaching Standards tries to ensure that all schools are equipped with qualified teachers (Box 3.6).
Box 3.4. School autonomy and collaboration among schools
In england (united Kingdom), for example, the government has been supporting a variety of approaches to co-operation among schools and school leaders since the early 2000s. Funding for school-innovation projects often required schools to partner together and apply as school clusters, rather than as individual schools. More recently, when schools were invited to assume greater autonomy by applying for “academy” status, the government also encouraged strong academies to work with weaker schools to raise standards. Several academies have joined a “chain”, which acts as a common trust for all of them. School-led partnerships among independent academies have also developed, such as the “Challenge Partners” network, which uses peer inspection as a way of fostering continuous improvement.
In scotland (united Kingdom), “Heads Together” is a nationwide online community used by school leaders to share experiences, policies and ideas. It was launched after a successful pilot phase in 2003, and has since become part of the national intranet for schools, “Glow”.
In shanghai (China), policies support collaboration between better- and lower-performing schools with the aim of transferring leadership capacity from the former to the latter. One aspect is called empowered administration, a school-custody programme in which the government asks higher-performing public schools to administer weaker schools. Under this scheme, the high-performing school appoints its experienced leader, such as the deputy principal, to be the principal of the weaker school and sends a team of experienced teachers to lead in teaching. In this way, the ethos, management style and teaching methods of the good schools are transferred to the poorer-performing school. In addition, a consortium of schools is established, where strong and weak schools, old and new, public and private, are grouped into a consortium or cluster, with one strong school at the core.
Sources: OECD (2011); Pont, Nusche and Moorman (2003); Sliwka (2003).
Box 3.5. Giving teachers their voice
Coinciding with a growing body of research on teacher leadership, one recent study found positive links between collaborative forms of school leadership and improved student outcomes; and PISA 2012 results show that school management should be a collaborative activity between teachers and principals if the benefits of school autonomy in decision making are to be realised.
A study commissioned by Education International from Cambridge University, “Teacher Self-Efficacy, Voice and Leadership: Towards a Policy Framework for Education International”, seeks to link the importance of teacher self-efficacy, as identified in the OECD Teaching and Learning International Survey, with teachers’ ability to influence practice and policy. ...
A ch i e v i n g e q u i t y i n i n c r e a s i n g l y d e vo l ve d e d u c a t i o n s y s t e m s
66
Chapter 3
© OECD 2014 Equity, ExcEllEncE and inclusivEnEss in Education: Policy lEssons from around thE World
The study surveyed teachers and officials of teacher unions in a number of countries. Complementing these surveys were semi-structured interviews with teachers in England who were recipients of Steve Sinnott Fellowships and alumni of the Teach First teacher training scheme.
The study identifies seven recommendations for policy:
• Provide opportunities and support for teachers to exercise leadership in developing and improving professional practice;
• Establish the right of teachers to be heard and to influence all levels of policy making, including on the content and structure of the curriculum;
• Protect and enhance teachers’ right to determine how to teach within the context of collegial accountability;
• Support teachers in setting the direction of their own professional development and in contributing to the professional development of their colleagues;
• Recognise the key role teachers play in building collaborative relationships with parents and the wider community;
• Promote the role of teachers in pupil assessment, teacher appraisal and school evaluation; and
• Enable teachers to participate in activities that lead to the creation and transfer of professional knowledge.
Also highlighted in the study is the work of the “Teacher Leadership Exploratory Consortium” in the United States, involving representatives of universities, schools, teacher unions, and state education departments, which includes a set of model standards for teacher leaders.
The study emphasises that teacher unions can foster the conditions conducive to promoting teachers’ professional autonomy and leadership.
Source: Education International.
Box 3.6. National Board for Professional Teaching Standards (United States)
The Constitution of the United States makes education primarily the responsibility of the states. On the surface, this presents a challenge involving 50 different “systems”. Other professions are in a similar situation, but in each of them – medicine, engineering and architecture, for example – the professions have found a way to transcend state boundaries and oversight, in part because the basic definition of a true profession is that its members share a set of common skills, knowledge and habits of mind.
The U.S.-based National Board for Professional Teaching Standards, established in 1987 with support from the National Education Association and the American Federation of Teachers, is committed to helping the teaching profession achieve the same status. The model for the National Board, borrowed from the medical profession, started with the creation of a document “What Teachers Should Know and Be Able To Do”, and the establishment of the Five Core Propositions of accomplished teachers:
Proposition 1: Teachers are committed to students and their learning.
Proposition 2: Teachers know the subjects they teach and how to teach those subjects to students.
Proposition 3: Teachers are responsible for managing and monitoring student learning.
Proposition 4: Teachers think systematically about their practice and learn from experience.
Proposition 5: Teachers are members of learning communities....
A ch i e v i n g e q u i t y i n i n c r e a s i n g l y d e vo l ve d e d u c a t i o n s y s t e m s
67
Chapter 3
Equity, ExcEllEncE and inclusivEnEss in Education: Policy lEssons from around thE World © OECD 2014
Today, there are standards associated with 25 different certifications covering 16 different content areas across four levels of child development. There is also a carefully designed and well-studied process that certifies when a teacher has met those standards.
National Board Certification is peer-reviewed and performance-based, and meets all of the standards that are common to other professions in the United States that issue similar certificates. The process of certification was created by teachers and is overseen by teachers. As of 2013, more than 106 000 teachers have achieved Board certification, which must be renewed every ten years. These teachers are in every state, and nearly 50% work in high-need schools. Recent studies, including two by the Strategic Data Project at Harvard University conducted in Los Angeles and in Gwinnett County, Georgia, show that students in classes with Board-certified teachers achieve at a higher level than students in other classes.
While 106 000 seems to be a large number, it represents fewer than 3% of teachers in the United States. The challenge for the Board’s second quarter century – which is also the challenge for the profession as a whole – is to take certification to scale so that it is the norm, not the exception, as is the case in every other profession. To do that, the profession must create a coherent trajectory of experience that begins in pre-service and continues to accomplished practice. Ideally, that trajectory will be defined by a careful backward mapping from National Board Standards. Just as in medicine, where physicians begin preparing to sit for their Boards on the first day of medical school, aspiring teachers should know what the profession expects of them, and the “system” should support this rational progression.
Source: National Board for Professional Teaching Standards.
Use student and school assessments to support improvements in equity
At the school level, student achievement data can be used to determine how resources and additional support are allocated and/or may trigger intervention by higher authorities. Achievement data can also be used to inform policies to create more efficient learning environments and to prompt schools, teachers and the students themselves to work towards centrally established education outcomes.
Critics argue that standardised tests may reinforce the advantages of schools that serve students from socio-economically advantaged backgrounds (Ladd and Walsh, 2002; Downey, Von Hippel and Hughes, 2008), or that teachers may respond to accountability measures by sorting out or retaining disadvantaged students (Jacob, 2005; Jennings, 2005). Standardised tests might have the adverse effect of limiting school goals to passing or proficiency on particular tests and focusing instruction on those students who are close to average proficiency and ignoring those who are far below or above the average (Neal and Schanzenback, 2010).
In an attempt to avoid the negative impact of “teaching to the test”, evaluations are becoming more diverse in most OECD countries. As participants in the 2013 International Teachers Summit discussed, countries now evaluate schools, teachers and school leaders, as well as students (OECD, 2013c).
PISA shows that the degree to which systems seek feedback from students regarding lessons, teachers or resources tends to be related to the overall level of equity in those systems. PISA 2012 asked school principals to report whether such written feedback from students is sought for quality-assurance and improvement. Systems where more students attend schools with such practices tend to show less impact of student socio-economic status on performance. This is observed across OECD countries and across all participating countries and economies. As shown in Figure 3.10, across OECD countries, some 10% of the variation in the impact of students’ socio-economic status on their mathematics performance can be accounted for by differences in the degree to which systems use this approach, after accounting for per capita GDP (OECD, 2013a, Table IV.1.4). Across OECD countries, school systems that seek written feedback from students also tend to perform better.6
At the school level, on average across OECD countries, schools seeking written feedback from students tend to perform better in PISA, even after accounting for the socio-economic status of students and schools (OECD, 2013a, Table IV.1.18). However, this relationship also varies by country/economy.

A ch i e v i n g e q u i t y i n i n c r e a s i n g l y d e vo l ve d e d u c a t i o n s y s t e m s
68
Chapter 3
© OECD 2014 Equity, ExcEllEncE and inclusivEnEss in Education: Policy lEssons from around thE World
Figure 3.10Written feedback from students and equity
GREATER EQUITY
GREATER EQUITY
Across OECD countries
Var
iatio
n in
mat
hem
atic
s pe
rfor
man
ce e
xpla
ined
by
soci
o-ec
onom
ic s
tatu
s (%
)
Seeking written feedback from students (%)
Note: Seeking written feedback from students refers to the percentage of students in school whose principal reported that written feedback from students regarding lessons, teachers or resources is sought for quality assurance and improvement of schools.1. A signi�cant relationship (p < 0.10) is shown by the solid line.2. A non-signi�cant relationship (p > 0.10) is shown by the dotted line. Source: OECD, PISA 2012 Database, Table IV.1.4.
0
5
10
15
20
25
30
0 20 40 8060 100
Across all participating countries and economies
Var
iatio
n in
mat
hem
atic
s pe
rfor
man
ce e
xpla
ined
by
soci
o-ec
onom
ic s
tatu
s (%
)
Seeking written feedback from students (%)
0
5
10
15
20
25
30
0 20 40 8060 100
Before accounting for per capita GDPFitted line before accounting for per capita GDP1
Fitted line before accounting for per capita GDP2
After accounting for per capita GDPFitted line after accounting for per capita GDP1
R² = 0.07
R² = 0.12
R² = 0.07R² = 0.10
United States
EstoniaNorway
HungaryChile
Spain
Slovak Republic
Luxembourg
Germany
Netherlands
New Zealand
Mexico
Turkey
Finland
Canada
Sweden
JapanKorea
Belgium
United Kingdom
Switzerland
Greece
Israel
Poland
Portugal
Iceland
Italy
Slovenia
Austria
Czech Republic
Ireland
Australia
France
Denmark
PortugalUnited States
HungaryChile
Slovak Republic
Luxembourg
Germany
Netherlands
New Zealand
France
MexicoItaly
Turkey
Belgium
Greece
DenmarkIsrael
Austria
Czech Republic
Peru
Indonesia
Tunisia
Jordan
Canada
Qatar
Macao-China
UruguayBulgaria
Costa Rica
Argentina
Romania
Kazakhstan
Hong Kong-China
Shanghai-China
Chinese Taipei
Viet Nam
Singapore
Estonia
Korea
Serbia
Croatia
2
Japan
United Arab Emirates
Finland
SwedenThailand
Russian Federation
Montenegro
Norway
Ireland
Iceland
Spain
1
United KingdomSwitzerland
Australia
SloveniaPoland
LatviaColombiaBrazil
LithuaniaMalaysia
1
2

A ch i e v i n g e q u i t y i n i n c r e a s i n g l y d e vo l ve d e d u c a t i o n s y s t e m s
69
Chapter 3
Equity, ExcEllEncE and inclusivEnEss in Education: Policy lEssons from around thE World © OECD 2014
Invest in early childhood education
The benefits of investing in early childhood education and care are seen in the performance of 15-year-olds in PISA. Students who had attended pre-primary education for more than one year outperformed the rest; in many countries, the difference is equivalent to more than one school year, even when taking into account the students’ socio-economic background. There is, however, considerable cross-country variation on the impact, which may be explained by the quality of the education provided. Insufficient investment in early childhood education and care can lead to childcare shortages, low-quality education, unequal access, and the segregation of children according to their family income – which, in turn, leads to inequities in schooling outcomes later (OECD, 2006).
In recent years, several OECD countries – including Australia, Austria, Poland and Spain – have made significant efforts to increase access to early childhood education and care by adding to the number of years of compulsory schooling years or increasing the number of places available for children. However, education for 0-6 year-olds is underfunded in OECD countries, and is usually provided by private – and often unregulated – institutions or individuals (OECD, 2006). Some countries specifically target disadvantaged families for early childhood education programmes. There are risks to this approach however: targeted programmes segregate, may stigmatise and may fail to provide early childhood education and care for many of the children eligible or for a large group of more moderate-income families that are also unable to afford the cost of private pre-school education (OECD, 2006).

A ch i e v i n g e q u i t y i n i n c r e a s i n g l y d e vo l ve d e d u c a t i o n s y s t e m s
70
Chapter 3
© OECD 2014 Equity, ExcEllEncE and inclusivEnEss in Education: Policy lEssons from around thE World
notes1. The ratio of the number of responsibility that “principals” and/or “teachers” have for these items to the number of responsibility that “regional or local education authority” and/or “national education authority” have for these items was computed. “School governing board” was not.
2. The parent questionnaire was distributed in the Flemish Community of Belgium, Chile, Croatia, Germany, Hungary, Hong Kong-China, Italy, Korea, Macao-China, Mexico and Portugal (OECD, 2013b). Table III.6.14 shows that in most countries and economies that distributed the parental questionnaire, participation was high, and the parents of virtually all students who participated in PISA responded to the questionnaire. Response rates were as high as 90% or more in Chile, Croatia, Hong Kong-China, Hungary, Italy, Korea, Macao-China and Mexico. The response rate in Portugal was 83%, while it was comparatively low in Germany (57%) and the Flemish Community of Belgium (48%). Response rates for individual items vary as some parents responded to several questions but not to others. However, the extent of non-response to items in the parental questionnaire is similar to that of non-response to items in the student background questionnaire. Table III.6.14 illustrates how, in the Flemish Community of Belgium and Germany, where response rates are low, and in Portugal, students whose parents responded to the parental questionnaire tended to score higher in PISA and were more socio-economically advantaged.
3. Across OECD countries, the correlation between the degree of competition and equity is 0.33 (significant at the 10% level).
4. Across all participating countries and economies with available data, the correlation between the percentage of students in private schools and the difference in mathematics performance between public and private schools is 0.14 (Table IV.4.7).
5. Some researchers have estimated that the proportion of migrants that would push non-immigrant parents to opt out of local schools is between 35% and 40% in Denmark (Rangvid, 2007) and between 50% and 60% in the Netherlands (Karsten, 1994).
6. After accounting for per capita GDP, the correlation is 0.34 among OECD countries and 0.20 among all participating countries and economies.
referencesBerends, M. and G. Zottola (2009), “International Perspectives on School Choice”, in M. Berends et al. (eds.), Handbook of School Choice, Routledge, London.
Björklund, A. et al. (2005), The Market Comes to Education in Sweden: An Evaluation of Sweden’s Surprising School Reforms, New york: Russell Sage Foundation.
Böhlmark, A. and M. Lindahl (2007), “The Impact of School Choice on Pupil Achievement, Segregation and Costs: Swedish Evidence”, IZA Discussion Paper, No. 2786.
Bunar, N. (2010a), “The Controlled School Market and Urban Schools in Sweden”, Journal of School Choice, Vol. 4, pp. 47-73.
Bunar, N. (2010b), “Choosing for Quality or Inequality”, Journal of Education Policy, Vol. 25, pp. 1-18.
Calero, J. (2005), “Spain: Country Analytical Report”, Equity in Education Thematic Review. www.oecd.org/spain/38693078.pdf.
Carnoy, M. (2000), “Globalization and Educational Reform”, in N. Stromquist and K. Monkman (eds.), Globalization and Education: Integration and Contestation across Cultures, Rowman and Littlefield Publishers, Oxford.
Clark, D. (2009), “The performance and competitive effects of school autonomy”, Journal of Political Economy, Vol. 117, No. 4, pp. 745-783.
Couch, J., W. Shugart and A. Williams (1993), “Private school enrolment and public school performance”, Public Choice, Vol. 76, pp. 301-312.
Crozier, G. et al. (2008), “White middle-class parents, identities, educational choice and the urban comprehensive school: dilemmas, ambivalence and moral ambiguity”, British Journal of Sociology of Education, Vol. 29, No. 3, pp. 261-272.
Downey, D., P. Von Hippel and M. Hughes (2008), “Are ‘Failing’ Schools Really Failing? Using Seasonal Comparison to Evaluate School Effectiveness”, Sociology of Education, Vol. 81, No. 3, pp. 242-270.
Elacqua, G. (2009), “The impact of school choice and public policy on segregation: Evidence from Chile”, Centro de Politicas Comparadas de Educacion, Universidad Diego Portales, Santiago, Chile.

A ch i e v i n g e q u i t y i n i n c r e a s i n g l y d e vo l ve d e d u c a t i o n s y s t e m s
71
Chapter 3
Equity, ExcEllEncE and inclusivEnEss in Education: Policy lEssons from around thE World © OECD 2014
Filer, R.K. and D. Munich (2003), “Public Support for Private Schools in Post-Communist Europe: Czech and Hungarian Experiences” in D.N. Plank and G. Sykes (eds.), Choosing Choice: School Choice in International Perspective, Teachers College Press, New york.
Geller, C.R., D.L. Sjoquist and M.B. Walker (2006), “The Effect of Private School Competition on Public School Performance in Georgia”, Public Finance Review, Vol. 34, No. 1, pp. 4-32.
Gewirtz, S., S. Ball and R. Bowe (1995), Markets, Choice and Equity in Education, Open University Press, Buckingham.
Godwin, R.K. et al. (2006), “Sinking Swann: Public School Choice and the Resegregation of Charlotte’s Public Schools”, Review of Policy Research, Vol. 23, No. 5, pp. 983-997.
Green, F. et al. (2011), “The Changing Economic Advantage from Private Schools”, Economica, Vol. 79, No. 316, pp. 658-678.
Greene, K.V. and B.G. Kang (2004), “The Effect of Public and Private Competition on High School Outputs in New york State”, Economics of Education Review, No. 23, pp. 497-506.
Hastings J., T. Kane and D. Staiger (2005), “Parental Preferences and School Competition: Evidence from a Public School Choice Program”, NBER Working Paper, No. 11805.
Hess, F. and T. Loveless (2005), “How School Choice Affects Student Achievement”, in J. Bettsand and T. Loveless (eds.), Getting Choice Right: Ensuring Equity and Efficiency in Education Policy, Brookings Institution Press, Washington, D.C.
Heynemann, S. (2009), “International Perspectives on School Choice”, in M. Berends et al. (eds.), Handbook of School Choice, Routledge, London.
Hsieh, H. and M. Urquiola (2006), “The Effects of Generalized School Choice on Achievement and Stratification: Evidence from Chile’s Voucher Program”, Journal of Public Economics, Vol. 90, No. 8-9, pp. 1477-1503.
Jacob, B. (2005), “Accountability, Incentives and Behavior: The Impact of High-Stakes Testing in Chicago Public Schools”, Journal of Public Economics, Vol. 89, No. 5-6, pp. 761-796.
Jennings, J. (2005), “Below the Bubble: ‘Educational Triage’ and the Texas Accountability System”, American Educational Research Journal, Vol. 42, No. 2, pp. 231-268.
Kahlenberg, R. (2006), “Helping Children Move From Bad Schools to Good Ones”, Education Week, the Century Foundation.
Karsten, S. (1994), “Policy on Ethnic Segregation in a System of Choice: the Case of the Netherlands”, Journal of Education Policy, Vol. 9, No. 3, p. 211-225.
Karsten, S. (1999), “Neoliberal Education Reform in the Netherlands”, Comparative Education, Vol. 35, No. 3, pp. 303-317.
Ladd, H. and E. Fiske (2009), “The Dutch Experience with Weighted Student Funding: Some Lessons for the U.S.”, Working Papers Series, http://files.eric.ed.gov/fulltext/ED507402.pdf.
Ladd H., E. Fiske and N. Ruijs (2009), “Parental Choice in the Netherlands: Growing Concerns about Segregation”, Prepared for School Choice and School Improvement: Research in State, District and Community Contexts, Vanderbilt University.
Ladd, H. and R. Walsh (2002), “Implementing Value-Added Measures of School Effectiveness: Getting the Incentives Right”, Economics of Education Review, Vol. 21, No. 1, pp. 1-17.
Lara, B., A. Mizala and A. Repetto (2009), “The Effectiveness of Private Voucher Education: Evidence from Structural School Switches”, Working Paper No. 263, CEA, Universidad de Chile.
Levin, H. and C. Belfield (2004), “Vouchers and Public Policy: When Ideology Trumps Evidence”, National Center for the Study of Privatization in Education, Teachers College, Columbia University.
Lubienski, C. (2006), “School Diversification in Second-Best Education Markets. International Evidence and Conflicting Theories of Change”, Educational Policy, Vol. 20, No. 2, pp. 323-344.
Machin, S. and J. Vernoit (2011), “Changing school autonomy: Academy schools and their introduction to England’s education”, Paper No. CEE DP 123, Centre for the Economics of Education, London.
Maranto, R., S. Milliman and S. Scott (2000), “Does Private School Competition Harm Public Schools? Revisiting Smith and Meier’s “The Case Against School Choice’”, Political Research Quarterly, Vol. 53, No. 1, pp. 177-192.
A ch i e v i n g e q u i t y i n i n c r e a s i n g l y d e vo l ve d e d u c a t i o n s y s t e m s
72
Chapter 3
© OECD 2014 Equity, ExcEllEncE and inclusivEnEss in Education: Policy lEssons from around thE World
Musset, P. (2012), “School Choice and Equity: Current Policies in OECD Countries and a Literature Review”, OECD Education Working Papers, OECD Publishing, http://dx.doi.org/10.1787/5k9fq23507vc-en.
Neal, D. and D.W. Schanzenback (2010), “Left Behind by Design: Proficiency Counts and Test-Based Accountability”, The Review of Economics and Statistics, Vol. 92, No. 2, pp. 263-283.
Nicaise, I. et al. (2005), “Sweden: Country Note”, Equity in Education Thematic Review, www.oecd.org/education/innovation-education/35892546.pdf.
OECD (2013a), PISA 2012 Results: What Makes Schools Successful? Resources, Policies and Practices (Volume IV), PISA, OECD Publishing,http://dx.doi.org/10.1787/9789264201156-en.
OECD (2013b), PISA 2012 Results: Ready to Learn: Students’ Engagement, Drive and Self-Beliefs (Volume III), PISA, OECD Publishing, http://dx.doi.org/10.1787/9789264201170-en.
OECD (2013c), Teachers for the 21st Century: Using Evaluation to Improve Teaching, OECD Publishing, http://dx.doi.org/ 10.1787/9789264193864-en.
OECD (2011), Lessons from PISA for the United States, Strong Performers and Successful Reformers in Education, OECD Publishing, http://dx.doi.org/10.1787/9789264096660-en.
OECD (2008), Measuring Improvements in Learning Outcomes: Best Practices to Assess the Value-Added of Schools, OECD Publishing, http://dx.doi.org/10.1787/9789264050259-en.
OECD (2006), Starting Strong II: Early Childhood Education and Care, OECD Publishing, http://dx.doi.org/10.1787/9789264035461-en.
Peterson, P. et al. (2003), “School Vouchers: Results from Randomized Experiments”, in C. Hoxby (ed.), The Economics of School Choice, University of Chicago Press, Chicago, pp. 107-144, http://dx.doi.org/10.7208/chicago/9780226355344.003.0005.
Plank, D. and G. Sykes (eds.) (2003), Choosing Choice: School Choice in International Perspective, Teachers College Press, New york.
Pont, B., D. Nusche and H. Moorman (2003), Improving School Leadership: Volume 1, Policy and Practice, OECD Publishing, http://dx.doi.org/10.1787/9789264044715-en.
Rangvid, B. (2010), “School Choice, Universal Vouchers and Native Flight from Local Schools”, European Sociological Review, Vol. 26, No. 3, pp. 319-335.
Raveaud, M. and A. Van Zanten (2007), “Choosing the local school: middle class parents’ values and social and ethnic mix in London and Paris”, Journal of Education Policy, Vol. 22, No. 1, pp. 107-124.
Sander, W. (1999), “Private Schools and Public School Achievement”, Journal of Human Resources, Vol. 34, No. 4, pp. 697-709.
Sandström, M. and F. Bergström (2005), “School Vouchers in Practice: Competition will Not Hurt you”, Journal of Public Economics, Vol. 89, No. 2-3, pp. 351-380.
Schneider, M. and J. Buckley (2002), “What Do Parents Want From Schools? Evidence from the Internet”, Educational Evaluation and Policy Analysis, Vol. 24, No. 2, pp. 133-144.
Schneider, M., P. Teske and M. Marshall (2002), Choosing Schools: Consumer Choice and the Quality of American Schools, Princeton University Press, Princeton, New Jersey.
Sliwka, A. (2003), “Networking for Educational Innovation: A Comparative Analysis”, OECD Networks of Innovation: Towards New Models for Managing Schools and Systems, OECD Publishing, http://dx.doi.org/10.1787/9789264100350-en.
Smith, K. and K. Meier (1995), “Public Choice in Education: Markets and the Demand for Quality Education”, Political Research Quarterly, Vol. 48, pp. 461-478.
Söderström, M. and R. Uusitalo (2010), “School Choice and Segregation: Evidence from an Admission Reform”, The Scandinavian Journal of Economics, Vol. 112, No. 1, pp. 55-76.
Viteritti, J. (1999), Choosing Equality, Brookings Institution Press, Washington, D.C.
West, M.R. and L. Woessmann (2010), “Every Catholic Child in a Catholic School: Historical Resistance to State Schooling, Contemporary School Competition, and Student Achievement across Countries”, Economic Journal, Vol. 120, No. 546, pp. 229-255.

A ch i e v i n g e q u i t y i n i n c r e a s i n g l y d e vo l ve d e d u c a t i o n s y s t e m s
73
Chapter 3
Equity, ExcEllEncE and inclusivEnEss in Education: Policy lEssons from around thE World © OECD 2014
Whitty, G. (1997), “Creating Quasi-Markets in Education: A Review of Recent Research on Parental Choice and School Autonomy in Three Countries”, Review of Research in Education, Vol. 22, pp. 3-47.
Whitty, G., S. Power and D. Halpin (1998), Devolution and Choice in Education, Open University Press, Buckingham.
Woessmann, L. (2006), “Public-Private Partnerships and Schooling Outcomes Across Countries”, CESifo Working Paper Series, No. 1662, Center for Economic Studies, Institute for Economic Research, Munich.
Woessmann, L. et al. (2009), School Accountability, Autonomy, and Choice around the World, Edward Elgar, Cheltenham.
Wrinkle, R. et al. (1999), “Public School Quality, Private Schools, and Race”, American Journal of Political Science, Vol. 43, No. 4, pp. 1248-1253.
The statistical data for Israel are supplied by and under the responsibility of the relevant Israeli authorities. The use of such data by the OECD is without prejudice to the status of the Golan Heights, East Jerusalem and Israeli settlements in the West Bank under the terms of international law.


75
Chapter 4
Creating learning environments that address the needs of all Children
Equity, ExcEllEncE and inclusivEnEss in Education: Policy lEssons from around thE World © OECD 2014
Using results from PISA 2012, this chapter shows how certain practices
that select and sort students, like tracking and grade repetition, are often
associated with students’ socio-economic status and with their performance
in mathematics. The chapter makes the case for reducing the use of grade
repetition and early tracking, identifying at-risk students and intervening
early on, providing a continuum of support for struggling students, and
holding high expectations for all students.

C r e a t i n g l e a r n i n g e nv i r o n m e n t s t h a t a d d r e s s t h e n e e d s o f a l l ch i l d r e n
76
Chapter 4
© OECD 2014 Equity, ExcEllEncE and inclusivEnEss in Education: Policy lEssons from around thE World
To meet the needs of diverse student populations, some countries have adopted non-selective and comprehensive school systems that seek to provide all students with similar opportunities, leaving it to each teacher and school to cater to the full range of student abilities, interests and backgrounds. Other countries respond to diversity by grouping students, whether between schools or between classes within schools, with the aim of serving students according to their academic potential and/or interests in specific programmes. Teaching in these schools or classes is adapted to students with different needs; class size and teacher assignments are determined accordingly. Often, the assumption underlying these policies is that students’ talents will develop best when students reinforce each other’s interest in learning, and create an environment that is more conducive to effective teaching.
Policies that regulate the selection and sorting of students into schools and classrooms can be related to performance in various ways. On the one hand, creating homogeneous student populations may allow teachers to direct classroom instruction to the specific needs of each group, maximising the learning potential of each group. On the other hand, selecting and sorting students may end up segregating students according to socio-economic status and result in differences in learning opportunities. Grouping higher-achieving students together limits the opportunity for under-achieving students to benefit by learning from their higher-achieving peers. In addition, if student sorting is related to teacher sorting, such that high-achieving students are matched to the most talented teachers, under-achieving students may be relegated to lower-quality instruction. Student selection and sorting may also create stereotypes and stigmas that could eventually affect student engagement and learning.
WhaT The reSulTS from PISa 2012 ShoWPISA examines curricular differentiation (i.e. tracking or streaming), school selectivity and other forms of stratification. vertical stratification refers to the ways in which students progress through school as they become older; horizontal stratification refers to differences in instruction within a grade or education level. School systems determine which specific programmes to offer (vocational or academic, for example), the age at which students are admitted into these programmes, and the extent to which students’ academic records are used to select students for their schools. Individual schools determine whether to transfer students out of the school because of poor performance, behavioural problems or special needs, and whether to group students in classes according to ability.
Vertical stratification
PISA shows that the degree of school systems’ vertical stratification tends to be negatively related to the equity of education outcomes, while there is no clear relationship with excellence. In systems where 15-year-old students are found in different grade levels, the impact of students’ socio-economic status on their academic performance is stronger than in systems with less vertical stratification. Across OECD countries, 32% of the variation in the impact of students’ socio-economic status on their mathematics performance can be explained by differences in the degree of vertical stratification within the system, after accounting for per capita GDP (OECD, 2013a, Table IV.1.1).1
One of the primary examples of vertical stratification is grade repetition. Grade repetition occurs when students, after a formal or informal assessment, are held back in the same grade for an additional year, rather than being promoted to the next stage along with their peers. This practice is usually perceived as an extra opportunity to fully acquire the required knowledge in order to move forward. However, research has consistently shown that grade repetition does not provide greater benefits than promotion to the next grade (Brophy, 2006).
Across OECD countries, an average of 12% of students reported that they had repeated a grade at least once. In Japan, Malaysia and Norway, no 15-year-old student had repeated a grade, while in Colombia and Macao-China over 40% of students had repeated a grade at least once. Among the 13 countries and economies with grade repetition rates of more than 20% in 2003, these rates dropped by an average of 3.5 percentage points by 2012, and fell sharply in France, Luxembourg, Macao-China, Mexico and Tunisia.
PISA 2012 shows that in 35 out of 61 countries and economies examined, disadvantaged students are more likely to have repeated a grade than advantaged students, even after accounting for student performance in mathematics (OECD, 2013a, Table IV.2.3). This means that when comparing two students with similar mathematics performance, the student who is more socio-economically disadvantaged than the other is more likely to have repeated a grade. As shown in Figure 4.1, on average across OECD countries, if a student scoring 300 points in mathematics is advantaged, the likelihood that he or she had repeated a grade is 35 out of 100, while the likelihood of repeating a grade is 45 out of 100 if this student is socio-economically disadvantaged. In general, the higher a student’s score, the less likely it is

C r e a t i n g l e a r n i n g e nv i r o n m e n t s t h a t a d d r e s s t h e n e e d s o f a l l ch i l d r e n
77
Chapter 4
Equity, ExcEllEncE and inclusivEnEss in Education: Policy lEssons from around thE World © OECD 2014
that the student had repeated a grade. But disadvantaged students are still at higher risk of repeating a grade than their advantaged counterparts. For example, if a student who scores 400 points is advantaged, the likelihood that he or she had repeated a grade is 14 out of 100, while the likelihood is 19 out of 100 if this student is disadvantaged.
Some 13% of 15-year-olds are reported to have repeated at least one year either in primary or secondary school. This proportion is particularly high in Belgium, France, Luxembourg, Portugal and Spain, where it affects over 30% of students. In these countries, repetition has been one of the main tools to respond to individual weak performance and preserve an even level of attainment within each classroom.
This finding is consistent with the results of other studies showing that the incidence of grade repetition is highest among students from socio-economically disadvantaged backgrounds. A study based on PISA 2009 data found that, in about half of the countries examined, students’ socio-economic status is related to the likelihood of repeating a grade, even after accounting for student academic performance (Monseur and Lafontaine, 2012). In fact, data from PISA 2009 revealed, among OECD countries, 53% of the variation in the likelihood of a student repeating a primary grade is observed at the student level, 28% at the school level, and 19% at the system level (Goos et al., 2013).
Figure 4.1Probability of students having repeated a grade, by students’ socio-economic status
(OECD average)
Prob
abili
ty o
f hav
ing
repe
ated
a g
rade
300 350 400 450 500
Notes: ESCS is the PISA index of economic, social and cultural status.Students having repeated a grade refers to students who have repeated a grade in primary, lower secondary or upper secondary school.Source: OECD, PISA 2012 Database, Table IV.2.3.
Mathematics score (score points)
0.50
0.45
0.40
0.35
0.30
0.25
0.20
0.15
0.10
0.05
0.00
Socio-economically disadvantaged student (ESCS = -1)
Socio-economically average student (ESCS = 0)Socio-economically advantaged student (ESCS = 1)
School systems that use grade repetition extensively are associated with poorer performance (OECD, 2010a), while those that use strategies to support each individual student tend to show higher performance. Teachers widely support grade repetition, as they can see the immediate gains in going over the same curriculum a second time (Jimerson, Anderson and Whipple, 2002). In addition, when weaker students are promoted, classes are composed of students with widely varying levels of achievement and some teachers may not be prepared to teach such a heterogeneous group. Schools may also lack the resources to support these students and teachers.
However, teachers may not always see the long-term negative impact on students and the additional burden on education budgets associated with grade repetition. Requiring that students repeat grades implies significant costs that are often not apparent in education budgets. These include not only the expenses of providing an additional year of education

C r e a t i n g l e a r n i n g e nv i r o n m e n t s t h a t a d d r e s s t h e n e e d s o f a l l ch i l d r e n
78
Chapter 4
© OECD 2014 Equity, ExcEllEncE and inclusivEnEss in Education: Policy lEssons from around thE World
(i.e. direct costs), but also the cost to society in delaying that student’s entry into the labour market by at least one year (i.e. opportunity costs) (OECD, 2011a). Among the countries that practice grade repetition and that have relevant data available, in Estonia, Iceland, Ireland and Israel, the direct and opportunity costs of using grade repetition for one age group can be as low as 0.5% or less of the annual national expenditure on primary- and secondary-school education – or between USD 9 300 and USD 35 100 per repeater (Figure 4.2 and OECD, 2013a, Table IV.1.6). In Belgium and the Netherlands, the cost is equivalent to 10% or more of the annual national expenditure on primary and secondary education – or as high as USD 48 900 or more per repeater. These estimates are based on the assumption that students who repeat grades attain lower secondary education, at most. If they were to attain higher levels of education, the costs would be even greater.2
Figure 4.2Cost of grade repetition
USD
, PPP
s
%
0.0
0.0
3.5
1.2
1.9
2.7
3.4
4.2
4.9
3.6
4.0
3.8
4.7
5.4
7.6
7.5
8.0
8.6
13.3
11.9
17.1
34.3
20.3
32.9
28.4
27.6
36.1
60 000
50 000
40 000
30 000
20 000
10 000
0
14
12
10
8
6
4
2
0
Note: Only countries and economies with available data are shown.Countries and economies are ranked in ascending order of the total annual cost, relative to total expenditure on primary and secondary education.Source: OECD, PISA 2012 Database, Tables IV.1.6 and IV.2.2.
Total annual costs, relative to total expenditure on primary and secondary education (%)
Assuming that repeaters attain lower secondary education, at most…
Total annual cost per repeater (USD, PPPs)
Percentage of students reporting that they had repeated a grade in primary, lower secondary or upper secondary school
Jap
an
No
rway
Esto
nia
Icel
and
Isra
el
Uni
ted
Kin
gdo
m
Slov
enia
Pola
nd
Cze
ch R
epub
lic
Ko
rea
Swed
en
Finl
and
Den
mar
k
New
Zea
land
Slov
ak R
epub
lic
Aus
tral
ia
Can
ada
Irel
and
Uni
ted
Sta
tes
Aus
tria
Ital
y
Port
ugal
Ger
man
y
Spai
n
Fran
ce
Net
herl
and
s
Bel
gium
However, in many countries, schools have few incentives to take into account the high cost of grade repetition. As individual schools receive their funding in relation to the number of students enrolled, they do not have to absorb those increased costs or bear the opportunity costs of lost output (Field, Kuczera and Pont, 2007). By contrast, practices that can reduce the use of grade repetition, such as personalised and intensive intervention, very often have direct costs for schools.
In addition to the financial costs, grade repetition widens inequities because the proportion of students from disadvantaged backgrounds who repeat a grade is higher than the proportion of advantaged students who repeat a grade. Students with low socio-economic status, low-educated parents or immigrant backgrounds, and boys, are significantly more likely to repeat a grade than other students (OECD, 2011b). Grade repetition tends to widen the achievement gap between those who are held behind and their peers.
The academic benefits of grade retention are minimal and short-lived. Although some studies report that there may be slight gains in the retained year (Allen et al., 2009), this is partly because students are working on the same curriculum again. These gains tend to fade away in later years. However, grade repetition has a clear long-term social and academic negative impact: it increases the likelihood of earning no or only a lower secondary qualification (Jacob and Lefgren, 2009).3

C r e a t i n g l e a r n i n g e nv i r o n m e n t s t h a t a d d r e s s t h e n e e d s o f a l l ch i l d r e n
79
Chapter 4
Equity, ExcEllEncE and inclusivEnEss in Education: Policy lEssons from around thE World © OECD 2014
Indeed, students usually perceive repetition not as an enabling opportunity but as a personal punishment and social stigma, and may be further discouraged from education. Grade repetition is a source of stress, ridicule and bullying by others, negatively affects self-esteem, and increases the likelihood of high-risk behaviours, school failure and dropout.
Horizontal stratification
In general, between-school horizontal stratification is unrelated to a system’s average performance and unrelated to excellence in education systems, as measured by the share of students performing at the highest levels. The exception is that, across all PISA-participating countries and economies, systems that group students, within schools, for all classes based on their ability tend to show lower performance, after accounting for per capita GDP.
But horizontal stratification is negatively related to equity in education opportunities. The impact of the socio-economic status of students and/or schools on performance is stronger in school systems that sort students into different tracks, where students are grouped into different tracks at an early age, where more students attend vocational programmes, where more students attend academically selective schools, and where more students attend schools that transfer low-performing students or students with behaviour problems to another school. Across OECD countries, 47% of the variation in the impact of socio-economic status of students and schools on students’ mathematics performance can be explained by differences in the ages at which students are selected into different programmes, even after accounting for per capita GDP (OECD, 2013a, Table IV.1.1).
The age at which stratification begins may be closely associated with the impact of socio-economic status on performance because the frequency and the nature of student selections/transitions differ between early- and late-stratified systems. In systems that stratify students early, students may be selected more than once before the age of 15. When students are older, more information on individual students is available and decisions on selecting and sorting students into certain tracks are thus better informed. In addition, students are more dependent upon their parents and their parents’ resources when they are younger. In systems that track students early, parents who are more socio-economically advantaged may be in a better position to promote their child’s abilities than disadvantaged parents. In systems where these decisions are taken at a later age, students play a larger role in deciding their own education pathways, and teachers and parents have enough information to make more objective decisions.
There are significant differences among OECD countries in how and when students are selected into different education programmes. While the median age of first formal selection is 15 years in OECD countries (OECD, 2010a), in Finland and Spain, students are not separated into different tracks until the end of lower secondary education. However, in a few countries, such as Austria and Germany, selection takes place very early, when students are just 10 years old.
The earlier the time of selection and the lower the permeability between different tracks, the wider the learning differences between students. Among the various academic selection systems, tracking is the most rigid because students are taught substantially different curricula. Grouping by ability in one or a few subjects is the most flexible form of selection.
As expected, schools that select students for admittance based on students’ academic performance tend to show better average performance, across OECD countries, even after accounting for the socio-economic status and demographic background of students and schools and various other school characteristics (OECD, 2013a, Table IV.1.12c).
However, a school system’s overall performance is not better if it has a greater proportion of academically selective schools. In fact, in systems with more academically selective schools, the impact of the socio-economic status of students and schools on student performance is stronger (OECD, 2013a, Table IV.1.1).
PoInTerS for PolICy anD PraCTICe Considering the negative relationship between stratification and equity, various policies can help either to reduce stratification or to mediate its effects. Results from PISA also show that in most OECD countries, students’ attainment is significantly lower in schools where most of the students come from disadvantaged backgrounds. This is primarily because students’ socio-economic status has a strong impact on their performance and many disadvantaged schools are unable to counteract the negative impact of socio-economic status, and may indeed accentuate it (OECD, 2010b; Bjorklund and Salvanes, 2011). Lack of systemic support and flexibility, and limited or ineffective use of resources, including teaching staff, make it difficult to meet the challenges facing disadvantaged schools.
C r e a t i n g l e a r n i n g e nv i r o n m e n t s t h a t a d d r e s s t h e n e e d s o f a l l ch i l d r e n
80
Chapter 4
© OECD 2014 Equity, ExcEllEncE and inclusivEnEss in Education: Policy lEssons from around thE World
Designing strategies to strengthen these schools’ capacity to improve is a challenge – but also an opportunity to improve the school system as a whole. An overview of country practices shows that there are many different types of initiatives that target disadvantaged schools, ranging from intensive support and financial assistance to closure.4
Reduce grade repetition
The most effective strategy to avoid repetition is to tackle learning problems during the school year, by providing early and continuous support to struggling students (Boxes 4.1 and 4.2). Evidence shows that students at risk of failing the school year would benefit from additional instruction designed to accelerate the pace of learning (Gamoran, 2011). This support should supplement, rather than repeat, the course work using different methods and building on teacher-student relations.
Box 4.1. The Finnish comprehensive school and modular approach to grade repetition
Grade repetition was widely used in Finland until the 1970s, when a policy of autonomic promotion combined with early intervention was adopted. Today, fewer than 2% of students who leave Finland’s compulsory nine-grade comprehensive school at the age of 16 have repeated a grade. In upper secondary school, there is no grade repetition because modules are used instead of grades. The curriculum in comprehensive schools was unified in 1985. Individualised learning and differential instruction became the basic principles in schooling; students are neither tracked nor streamed by ability. Students’ characteristics, including personality, abilities and orientations, are taken into account in crafting learning environments and choosing pedagogical methods in order to enable all students to enhance their learning. Every child has the right to individualised support provided by trained professionals as part of normal schooling. As a consequence of the interventions to create nurturing learning environments for all students, grade repetition steadily decreased and today the rates of grade repetition are negligible.
Indeed, repetition is only an option after the nine-year comprehensive school, when students can opt for a “tenth grade”, an additional year to consolidate their learning or make up their minds about future steps. This additional year after compulsory school, which is chosen by around 3% of the age cohort annually, aims to strengthen the knowledge and skills that students need in upper secondary school. For some young people, taking an additional year is simply a time-out to decide the best way forward after compulsory education. Well-informed decisions about further studies or career prospects can save students from unpleasant surprises and prevent dropout or repetition of grades or courses.
In upper secondary schools, students build their own learning schedules from a menu of courses offered in their school or by other educational institutions. Therefore, the programme is flexible and the courses selected can be completed at a different pace, depending on students’ abilities and life situations. Rather than repeating an entire grade, a student may repeat only those courses that he or she did not pass. As a result of this modular structure and intensified counseling in schools, only 4% of students drop out during general upper secondary school, half of whom move to vocational educational institutions.
Source: Välijärvi and Sahlberg (2008).
Strategies to eliminate the use of grade repetition and encourage automatic promotion rely on:
• Improving teachers’ skills to teach classes where the levels of student achievement are diverse. This demands flexible instruction and high-quality teacher preparation. School leaders and teachers should develop strategies together to support promoted students who are struggling with certain subjects and give teachers access to staff with expertise to help those students.
• Extending learning opportunities and diversifying learning strategies. The greater the variety of opportunities to learn, the higher the probability that all students will benefit. Under certain circumstances, the school year can be reorganised to extend learning time by introducing remedial classes before or after school, at Saturday school or at summer school.5 Spending more time at school is positive for students with unfavourable after-school learning environments (OECD, 2010c).
C r e a t i n g l e a r n i n g e nv i r o n m e n t s t h a t a d d r e s s t h e n e e d s o f a l l ch i l d r e n
81
Chapter 4
Equity, ExcEllEncE and inclusivEnEss in Education: Policy lEssons from around thE World © OECD 2014
• Strengthening meta-cognitive skills. A growing body of research emphasises the influence of meta-cognitive skills – those related to motivation, discipline, tenacity, self-esteem, confidence and patience – on children’s development. In Portugal, a programme aimed at improving socio-emotional skills targeted at potential grade repeaters has resulted in a significant reduction in grade repetition (Martins, 2010).
Box 4.2. Multi-level study in New Zealand
In order to avoid the need for students to repeat a year, teachers in some countries group students in ways that allow them to achieve at the appropriate level of the curriculum, while promoting the student along with his or her peer group to a new level each year.
In primary school, teachers divide their classroom into groups of students working at the same curriculum level. The groups work concurrently on similarly themed curriculum activities, but are given tasks and resources that reflect different curriculum levels. In New Zealand, group work is aided by a curriculum that has only eight levels over 12 or 13 years of schooling. There is an explicit understanding that students are promoted from one year to another automatically, but any individual student could be achieving at a number of different curriculum levels, depending on the learning area or subject.
In secondary school, multi-level study can be facilitated by carefully timetabling subject options concurrently. Classes are offered at different grade levels at the same time, allowing students to study in the class that best suits their achievement level. In this way, a student nominally at a particular year level may be taking classes from a year below or a year above their nominal year level. This provides for both remedial and accelerated learning for all students in any subject area.
Source: New Zealand Ministry of Education.
Repetition rates can also be reduced by limiting the criteria that determine whether a student is to be held back and by establishing more opportunities to move forward. In recent years, several OECD countries, including Austria, the Czech Republic, France and Luxembourg, have narrowed the circumstances in which grade repetition is applied. The strategies they have used include:
• Using comprehensive and flexible criteria to determine which students are held back. Academic progress, alone, may provide too narrow a set of information on students’ improvement. Holistic assessments, adapted to students’ abilities, can be conducted to decide whether a student should repeat a grade. In Finland, for example, assessments range from written tests to oral discussions (Eurydice, 2011); Spain also encourages using different assessment tools.
• Limiting repetition to the subjects or modules failed instead of repeating an entire year. For example, in Canada, New Zealand and the United States, retention is usually restricted to the specific classes that the student failed. A student can be promoted in a mathematics class but retained in a language class. This is usually complemented with additional opportunities to learn and be assessed.
• Limiting the number of times that students may repeat a grade and which grades can be repeated. In many countries, repetition cannot be applied in transition grades, when students’ poor performance may be due to a short-term failure to adjust. Repetition may be limited to grades considered as fundamental for consolidating basic skills.
• Offering transition programmes that enable students to attend both new and failed classes. Another possibility is to grant conditional promotion to the next grade, subject to performance in the subjects in question.
• Allowing students to change to other equivalent education programmes to ensure completion, when there are different education pathways available in the year to be repeated. In the Netherlands, for example, the large differences in repetition rates between primary (20%) and secondary (5%) education is partly explained by students changing tracks. In Spain, students who are to repeat a grade in secondary school can enrol in a programme aimed at keeping students in school (IFIIE, 2011). However, changing to different education programmes should not affect students’ education opportunities, as may happen in some education systems with early tracking or in systems where students with learning difficulties are diverted to special schools.

C r e a t i n g l e a r n i n g e nv i r o n m e n t s t h a t a d d r e s s t h e n e e d s o f a l l ch i l d r e n
82
Chapter 4
© OECD 2014 Equity, ExcEllEncE and inclusivEnEss in Education: Policy lEssons from around thE World
All this said, repetition is often deeply embedded in the culture of school systems, so additional strategies may be needed:
• Education authorities can raise teacher awareness of the consequences of grade repetition and also include teachers and school leaders in searching for alternatives to support struggling students.
• Financial incentives can be used to encourage schools to reduce the use of grade repetition. In some cases, this would mean adjusting school finance arrangements to allow schools to take into account the real costs of repetition. One option could be for schools to retain any savings realised from reducing grade repetition, which could then be used for other purposes, such as financing alternatives to grade repetition.
• Schools could be made accountable for the number of students held back, so that the schools are encouraged to support students who are falling behind.
Box 4.3. Reducing the rate of grade repetition in France
Although there is a strong consensus in France that grade repetition is ineffective, incentives for teachers and schools may encourage this practice (O’Brien, 2007). To tackle this, the French Ministry of Education defined ambitious national objectives, at both the academies (regional educational authorities) and school level. They have established specific targets to hold schools accountable for grade repetition rates. In addition, a 2008 reform provides two hours of weekly individualised support and catch-up opportunities during the last two years of primary school.
Results in recent years are promising. While in 1960, 52% of students had repeated a year before starting secondary education, and in 1980 this proportion remained as high as 37%, in 2009, only 14% of students were held back. The government resolved to halve this figure by 2013.
Sources: Moisan (2011); O’Brien (2007).
Reduce early tracking
There is a range of policies to limit or eliminate the negative effect of early tracking, streaming and grouping by ability. In Germany, different states have adopted one or more of the following strategies (OECD, 2011a):
• Introduce comprehensive secondary schools, in which students are not tracked but kept together until a later stage. These schools offer the whole range of qualifications. However, this option is not offered throughout the country.
• Postpone tracking from the age of 10 to 12. Although 12 years is still early for tracking, it is a step forward on which further improvements can be built.
• Merge the two lower-level tracks – the Realschule and the Hauptschule – into one school, and improve the quality of education provided in these tracks. Austria also does this (see Box 4.4).
• Make tracks more equivalent in order to allow students from all tracks to access any type of upper secondary education.6
The optimal time to track students is difficult to estimate, but children as young as 10 or 11 years old may not be in a position to make the best choices about their future in education. Studies from Germany (Woessmann, 2010), the Netherlands (Van Elk, van der Steeg and Webbink, 2009) and Switzerland (Bauer and Riphahn, 2006) examining geographic differences in the age of tracking find that tracking at a later age decreases the probability of leaving the education system without completing secondary education.
Many OECD countries have introduced comprehensive education, and raised the age of first tracking or postponed it to a later stage in the education process, most commonly to the end of lower secondary school. This is true in the Nordic countries, which were among the first to make the change in the 1970s. One of the most recent reforms was undertaken in Poland, where early tracking was postponed one year, until the age of 15. The reform raised students’ performance substantially, particularly for those students who would have been assigned into vocational tracks, without undermining the performance of top achievers (Wisniewski, 2007).

C r e a t i n g l e a r n i n g e nv i r o n m e n t s t h a t a d d r e s s t h e n e e d s o f a l l ch i l d r e n
83
Chapter 4
Equity, ExcEllEncE and inclusivEnEss in Education: Policy lEssons from around thE World © OECD 2014
Teachers and parents of students enrolled in tracks for high performers are likely to be the main stakeholders opposing this reform. This is one of the reasons why reforms have been gradually implemented in some countries and have coincided with an extension of compulsory school years. The implementation of reforms to reduce tracking in Sweden, Finland, Spain and Poland are discussed in Box 4.4.
In contexts where key stakeholders may be reluctant to end early tracking, suppressing low-level tracks or groups, or making these alternatives equivalent to other pathways can mitigate some of the negative effects of early tracking. This recommendation is especially relevant in systems in which there is little or no permeability among tracks in a rigid hierarchy. In recent years, Austria (Box 4.5), Luxembourg, the Slovak Republic and some German states have taken steps in this direction.
Box 4.4. Selected examples of delaying tracking
In sweden, a nine-year comprehensive school system was introduced in the 1960s (Meghir and Palme, 2005; Holmlund, 2006). Before then, compulsory schooling lasted six years (seven years in large cities). The reform aimed to keep all students together until the 10th year. However, because of resistance to the reform, an agreement was reached to track students at the 9th year into a vocational track, a theoretical track to prepare them for upper secondary school, or a third general track, although students remained in the same establishment. The reform resulted in mixed-ability classrooms, although there is some evidence that today streaming is increasingly used within the unified compulsory school (Båvner et al., 2011).
Comprehensive schooling was introduced gradually in finland (Pekkarinen, Uusitalo and Pekkala, 2006). The reform aimed to introduce new curricula with higher proportions of mathematics and sciences, and have all students follow the same curriculum in the same establishment until the age of 16. The reform was envisaged in the late 1940s but the first experiments began in 1967. In 1968, the Parliament approved the introduction of a nine-year comprehensive school. The adoption of the new school system was introduced gradually between 1972 and 1977 on the basis of regional implementation plans, from the less-populated areas in the north of the country to the capital. Because of some resistance, some ability tracking was retained, dividing students into ability groups in foreign language and mathematics classes, but students were grouped together in other subjects. This form of ability grouping was eventually abolished in 1985.
In 1999, poland reformed the structure of its education system, deferring tracking in secondary education, embracing a deep curriculum reform, and giving more autonomy to schools. Prior to the reform, primary school lasted eight years and was followed by four-year secondary or three-year vocational school. The 1999 reform replaced this system with a shortened primary school programme of six years, followed by three years of academic school and two years vocational education, which implied that all children were kept together for one extra year, until the age of 15. Research has shown that the deferral of tracking accounts for the country’s substantial improvement in international assessments (OECD, 2011c).
Sources: Båvner et al. (2011); Holmlund (2007); Meghir and Palme (2005); Merino (2006); OECD (2011c); Pekkarinen, Pekkala and Uusitalo (2006).
Box 4.5. Reducing early tracking in Austria
Students in Austria are tracked into different pathways at an early age. When students are 10 years old, they are sorted into the Hauptschule (general lower secondary school) or the Allgemeinbildende Höhere Schule (AHS, academic secondary school). Later on, at age 14, students are sorted again into four parallel routes with differentiated instruction and a hierarchy among them. Although the placement is not rigid, most transfers are to
...

C r e a t i n g l e a r n i n g e nv i r o n m e n t s t h a t a d d r e s s t h e n e e d s o f a l l ch i l d r e n
84
Chapter 4
© OECD 2014 Equity, ExcEllEncE and inclusivEnEss in Education: Policy lEssons from around thE World
In countries where students are tracked, streamed or grouped by ability at a young age, a variety of policies and practices can limit the negative effects of the practice and encourage differentiated instruction in mixed-ability settings:
• Limit ability grouping to specific subjects or replace it with short-term, flexible grouping for specific purposes, to allow classes to remain heterogeneous. For instance, Nordic countries use temporary groupings with the possibility of changing groups during the school year. Ability grouping can be limited to subjects that are sequential in nature, such as mathematics or language.
• Increase flexibility in changing tracks or classrooms, and improve the selection methods for the different tracks or groups. Some researchers have found biases in tracking practices, in particular towards disadvantaged students. These can be avoided by establishing clear criteria and offering guidance to ensure that the more appropriate choices and placements are made.7 In the Netherlands, for example, despite the existence of tracking at age 12, there are several ways to correct for wrong choices, and there is relatively high mobility between tracks (OECD, 2010c; Akkerman et al., 2011).8
• Ensure that all tracks give students a challenging curriculum and high-quality instruction. A challenging curriculum is more effective in improving students’ learning than a low-level remedial curriculum. In Scotland (United Kingdom), a secondary curriculum reform that raised standards for low-achieving students gradually reduced the achievement gap (Gamoran, 1996). Another possibility is to ensure more similar curricula among tracks, making it easier for students to change tracks and pursue further studies.
lower rather than upper tracks. Austria has one of the largest disparities in student performance and education opportunities related to socio-economic status (OECD, 2010b). Tracking also reinforces regional inequities, as 70% of students from the capital region enter academic schools, while only 30% of students in the other regions do so.
In 2007, the government merged the general and academic lower secondary education tracks by creating a new comprehensive school category called the New Secondary School (Neue Mittelschule). Teaching in new secondary school classes is based on the curriculum of academic secondary schools’ lower stage. Neue Mittelschulen are established on the basis of voluntary applications by existing academic and general schools. Sixty-seven Neue Mittelschulen were created in the 2008/09 pilot, rising to 244 pilot schools in 2009/10 and to 320 in 2010/11; 114 additional schools started in 2011/12. This plan has attracted enthusiastic support from a large number of general schools, including both teachers and school leaders. Although a formal evaluation has not yet been conducted, a recent survey revealed that nine out of ten parents are satisfied with this new school (IFES, 2010). Other stakeholders, such as municipalities and social partners, employers and unions, have actively supported the Neue Mittelschule initiative.
In contrast, few academic secondary schools are participating in the pilot. Only 11 academic secondary schools have become part of the project so far. Teachers, school leaders and parents may perceive becoming a Neue Mittelschule as a threat to their academic rank, the quality of their students, and the professional status of their teachers. Academic school teachers are federal employees while both Hauptschule and Neue Mittelschule school teachers are employed by Länder, under different contractual provisions. This is partly why the academic schools’ labour union has opposed this initiative. The parliament has authorised the project only as a pilot experiment, re-emphasising the need for a two-thirds majority for any future legislation on comprehensive schooling and limiting the experiment to a maximum of 10% of all lower secondary schools.
In June 2011, the government reached a compromise on further implementation of the model and on related financial provisions. According to current plans, by 2015/16 all former Hauptschulen will be converted into Neue Mittelschule. Academic secondary schools have been excluded from the reform, but they may be allowed to participate on a voluntary basis. Therefore, a dual tracking system has been preserved. Although this is a positive step in the short term, the exclusion of academic secondary schools continues to undermine equity.
Sources: IFES (2010); OECD (2010a); OECD (2009); Steiner and the Styrian Association for Education and Economics (2011).

C r e a t i n g l e a r n i n g e nv i r o n m e n t s t h a t a d d r e s s t h e n e e d s o f a l l ch i l d r e n
85
Chapter 4
Equity, ExcEllEncE and inclusivEnEss in Education: Policy lEssons from around thE World © OECD 2014
Improve disadvantaged schools
While all countries show large differences in performance within schools, in most countries, the differences between schools are also wide and largely explained by the social mix of students across schools. A student’s achievement is influenced by the average socio-economic background of his/her peers. In countries such as Germany, Hungary, Italy, Luxembourg and Turkey, there are large differences between schools, linked to the schools’ and students’ socio-economic backgrounds.
By contrast, there is little association between individual performance and the schools that children attend in the Nordic countries (Denmark, Finland, Iceland, Norway and Sweden), Canada, Estonia, Poland and Spain.
Disadvantaged schools tend to reinforce students’ socio-economic inequalities. The magnitude of the differences in performance associated with the socio-economic composition of the school is striking, especially in Austria, Belgium, the Czech Republic, Germany, Israel, Japan9 and the Netherlands.
To put these numbers in more concrete terms, consider the hypothetical case of two students from a socio-economically average family in any of these countries. One student attends an advantaged school, where most of this student’s peers come from families that are more affluent;10 the other student attends a more disadvantaged school.11 The analysis indicates that, on average across OECD countries, the first student would be expected to perform 32 points higher in reading than the second student, and this difference would be expected to exceed 50 score points in several countries.
These figures confirm that disadvantaged schools tend to reinforce the socio-economic inequities in the student population. This represents a double handicap for disadvantaged students, since disadvantaged schools do not mitigate the negative impact of the students’ disadvantaged background; indeed, they amplify its negative effect on their performance. Evidence also shows that in countries where schools tend to be more segregated, the impact of the students’ socio-economic status is stronger.
The students themselves are a key resource of any school: a disadvantaged student has a better chance of success if he or she is in a school with students who have high expectations and are intellectually engaged.
These findings point to the need to understand the factors that contribute to between-school socio-economic segregation12 and to mitigate their effects – and even compensate for them – and ensure that all students, whether advantaged or not, are highly engaged and supported.
Strengthen and support school leadership
Disadvantaged schools often lack the ability to attract and retain competent staff and to provide staff with adequate professional development opportunities. Suitable systemic support for schools is, in many cases, insufficient, and schools find themselves alone, trapped between demanding learning environments and inadequate support systems. School leadership is an important starting point for improving the quality of low-performing disadvantaged schools. However, school leaders are often not appropriately selected, trained and supported to respond to the needs of these schools and their students. Policies should thus:
• Ensure that school leadership preparation programmes both strengthen school leaders’ general expertise to improve learning and teaching, and also provide specialised knowledge to handle the challenges of disadvantaged schools.
• Reinforce coaching and mentoring programmes for school leaders, to support them in the search for solutions, and create networks of schools to achieve durable change in practices and sustainable improvement.
• Develop strategies to attract and retain competent leaders in low-performing disadvantaged schools, by providing good working conditions, systemic support and incentives to encourage the appointment of high-quality school leaders in these schools (Box 4.6).
To develop capacity to lead low-performing disadvantaged schools, school leadership training programmes should also offer specialised training in understanding these schools’ specific circumstances, and how to respond to them. These programmes need to ensure that school leaders are prepared to focus on issues that are more characteristic of disadvantaged schools, such as: student behaviour, motivation and engagement; teaching and learning for disadvantaged and/or low-performing students; improvement of the physical environment of the school; and cultures of care and achievement (Day et al., 2009). In the same way, they also need to be prepared to engage parents and the wider community as active allies for school improvement.

C r e a t i n g l e a r n i n g e nv i r o n m e n t s t h a t a d d r e s s t h e n e e d s o f a l l ch i l d r e n
86
Chapter 4
© OECD 2014 Equity, ExcEllEncE and inclusivEnEss in Education: Policy lEssons from around thE World
School leaders – especially novice leaders – in low-performing disadvantaged schools are likely to need extra support. Novice leaders can be paired with experienced school leaders, for example. This strategy has had positive results in Shanghai-China and in England (OECD, 2011a). With coaches, leaders can acquire new skills and learn how to respond to their own school challenges, rather than being prescribed “ready-made” solutions, and take different but appropriate approaches in their jobs. Ideally coaches should have experience and demonstrated success in schools with the same characteristics as those in which the new school leader is operating. This support then can be removed progressively as the novice leader’s acquires skills and confidence. In the case of very challenging school environments, support for school leaders may need to be sustained over time.
Schools in challenging contexts can benefit from networks too. Networking is a positive and non-punitive way of achieving durable change in practices, sustainable improvement and culture change by disseminating good practice. Networks can take different forms, from relatively formal and mandated groups (such as Education Action Zones in the United Kingdom and Reseaux Ambition Réussite in France), to more voluntary networks of school leaders or the promotion of system leaders. The different words used to describe these groupings – networks, clusters, partnerships – reflect the variety of collaboration; but the main message is that schools facing exceptionally challenging circumstances can learn directly from one another. In order to achieve the desired results, collaborative work needs to be aligned with external support and interventions.
Countries can also link salaries to school context, while ensuring that principals perceive the process as fair (Pont, Nusche and Moorman, 2008). If performance-related pay is introduced, it is important to develop reliable indicators and clear assessment criteria, prepare and train evaluators, and ensure that assessment procedures take into account the context in which principals are working. In Korea, for example, becoming a school leader in a low-performing disadvantaged school is well-regarded by the profession, and well-rewarded financially. Often, leaders for these schools are recognised as among the best performers.
Provide systemic support for restructuring schools
Sometimes, schools need deep organisational restructuring to improve what is not working. This restructuring may require extra support and external intervention and/or additional resources. Evidence shows that successful strategies should take into account the following key elements (see also Box 4.7):
• Context-specific strategies. Tailor-made improvement strategies should be designed, preferably within the school, for each school or group of schools to fit their specific circumstances. Schools benefit more from systemic support when it builds on the capacity of existing staff, who then own the improvement process. In the Netherlands, for example, persistently low-performing schools are identified by the inspectorate. After defining an action plan, the school and the inspectorate work as a team to implement it (Akkerman et al., 2011).
Box 4.6. Components of effective school leadership training programmes
The OECD Improving School Leadership review looks into several school leader preparation programmes across OECD countries. It finds that the more effective programmes are those that:
• prepare and develop school leaders, focusing on instructional leadership and on the broader roles and responsibilities of leaders, the purposes of schooling, and the operation of core school technologies to achieve intended outcomes;
• are designed to produce leaders who work with teachers to build student-centred schools with capacity for high performance and continuous learning and improvement; and
• take a system-wide perspective to align with the broader goals and processes of the system for school improvement, student performance, and enhanced efficiency and effectiveness.
Source: Pont, Nusche and Hopkins (2008).
C r e a t i n g l e a r n i n g e nv i r o n m e n t s t h a t a d d r e s s t h e n e e d s o f a l l ch i l d r e n
87
Chapter 4
Equity, ExcEllEncE and inclusivEnEss in Education: Policy lEssons from around thE World © OECD 2014
• Resources. While general increases in school funding do not necessarily improve student outcomes (Woessman, 2008; Faubert, 2012), some targeted increases in specific school resources can improve student outcomes. Core funding can be increased on a short-term, case-by-case basis, and incentives can also be provided for schools based on student improvement. Systemic support can also be provided in giving teachers more time to participate in networks, for common planning, and for improving expertise (Reynolds et al., 2002).
• Formal common planning time at school. Reorganising the timetable to allow for learning teams to meet to plan strategies for improvement can lead to both greater collaboration among staff and tangible results.
• Merit recognition for schools. Disadvantaged schools that improve should be rewarded for their success and not stigmatised for contextual factors over which they have no influence. External support and being part of a national strategy for improvement, with examples of success, can give schools the confidence to improve. Other schools can learn from those whose policies and practices have proved successful.
• Firm action for persistently low-performing schools. In many countries, efforts to improve consistently low-performing schools have failed. Splitting low-performing disadvantaged schools, merging small ones, or closing recurrently failing ones can be policy options in certain contexts. These actions benefit from a “fresh start”, when new practices can be introduced and relations with teacher unions, the school board and central authorities can be improved. School closure is neither popular nor frequent in OECD countries. While this initiative should be considered only in extreme circumstances, the main priority should be to avoid situations where students receive consistently low-quality education.
Box 4.7. Systemic support for sustainable improvement
In québec, the Ministry of Education’s intervention Agir autrement (Act differently) aims to foster large-scale transformation in the province’s most disadvantaged schools, to improve both student success and equity. The ministry gives these schools access to a large database of effective practices for intervention so they can develop their expertise. School boards support the school leadership team in implementing practices that are adapted to their students’ socio-economic status.
In Ontario, the Focused Intervention Programme provides targeted support to primary schools that have “experienced particular difficulties in achieving continuous improvement”, measured through results on provincial assessments of reading, writing and mathematics (Grades 3 and 6). OFIP funds are used for professional development, additional student and professional learning resources, literacy and numeracy coaches, and teacher release time for collaboration and additional training.
Since 2009/10, resources from the OFIP programme were extended to over 1 100 schools in which fewer than 75% of students met provincial standard in the Grades 3 and 6 assessments (Schools in the Middle [SIM]). OFIP and SIM aim to pool and enhance professional resources within a school so that under-achievement becomes a shared issue. It is tackled, for example, by a school-improvement team supported by literacy and numeracy coaches. Schools selected for participation in OFIP tend to be those serving disadvantaged communities, with a relatively high percentage of students with special education needs or an above-average range of educational challenges. From 2002/03 to 2010 /11, the number of schools with fewer than 34% of students achieving at provincial standard in Grade 3 reading was reduced by two-thirds (from 19% to 6%), showing significant success in reducing the number of primary schools in which students fail.
In spain, beginning in 2011, contracts for low-performing schools (Contratos-programa con Centros Educativos para el Incremento del Éxito Escolar) can be signed between the regional departments of education and schools that wish to improve. The schools commit themselves to increasing students’ school and personal success. In turn, education authorities commit themselves to providing the necessary resources.
In ireland, the DEIS (Delivering Equality of opportunity In Schools), launched in 2005, focuses on addressing the needs of schools with a concentrated level of disadvantage. It has developed a standardised system for identifying levels of disadvantage in schools and provides a range of support to 670 primary and 195 post-primary schools, including: lower pupil-teacher ratios (for urban primary schools in communities with the highest concentrations
...
C r e a t i n g l e a r n i n g e nv i r o n m e n t s t h a t a d d r e s s t h e n e e d s o f a l l ch i l d r e n
88
Chapter 4
© OECD 2014 Equity, ExcEllEncE and inclusivEnEss in Education: Policy lEssons from around thE World
Create a supportive school climate
An orderly school environment is essential for learning. Disadvantaged schools can foster such an environment by:
• Enhancing positive teacher-student and peer relations and avoiding an emphasis on discipline alone. Better teacher-student relations lead to both greater teacher satisfaction and better student outcomes. When students feel recognised and do not fear being embarrassed or compared to peers, they are more likely to identify positively with school, use cognitive strategies that contribute to academic success, and feel confident in their ability to learn. Specific school measures can include using positive feedback and reinforcement (Harrop and Swinson, 2007) and individualised attention (Levin, 2008). This is especially important for students who receive little or no support at home. Make student well-being a high priority and develop programmes that contribute to positive peer relations at school, as they foster academic performance, well-being and mental health. An increased sense of community in a school can reduce disruptive behaviour and improve students’ confidence and self-esteem. School districts in Manitoba have a number of programmes that train students to be peer mentors, role models for positive behaviour, and peer mediators for minor conflicts in their schools.
• Promoting the use of data-information systems as a school diagnosis tool to identify struggling students and behaviours that disrupt learning.
• Ensuring that disadvantaged schools provide their students with adequate and timely support, such as counselling, mentoring or smoothing transitions through the different levels of education.
• Considering alternative organisation of instruction time over the day, the week or the year. In particular cases and under certain conditions, smaller classes and smaller schools can be created to enable more effective teaching of and learning among disadvantaged students.
• Using positive management practices. Students who are continually punished and continually experience failure are at higher risk of disengagement, disruptive behaviour and dropping out. Students whose teachers use positive management practices show fewer behaviour problems than students whose teachers use more punitive approaches to discipline (Webster-Stratton and Reid, 2001; Thomas et al., 2008).
Use data to identify at-risk students – and intervene early
High absenteeism, behavioural problems and course failure are strong predictors of both student disengagement and school failure, and they can be used to identify students very early on. The creation of a positive learning environment needs to be backed up by precise diagnoses, reliable information systems and accurate data. School leaders can use this data to identify the obstacles to a positive learning environment, and then to inform strategic and day-to-day decision making.
• Schools should have both formal national-level data, such as standardised tests, and school-based data (e.g. report cards, teacher reports of annual progress, school records of behaviour, attendance, etc.).13
• Schools need strategies to analyse and use this data for decision making.
• The data should be used to support further learning, not to re-route students onto tracks with lower (or different) expectations. Similarly, at the school level, data should be used for support, not sanctions.
of disadvantage); allocation of administrative principals; additional allocation based on level of disadvantage; additional financial allocation for school books; access to numeracy/literacy support and programmes at the primary level; access to Home School Community Liaison services; access to the School Completion Programme; enhanced guidance and counselling provision at post-primary level; enhanced planning support; access to the Junior Certificate Schools Programme and the Leaving Cert Applied; and provision for school library and librarian support for the post-primary schools with the highest concentrations of disadvantage. The last report on retention in post-primary schools shows that the average leaving certificate retention rate in DEIS schools increased from 68.2% to 73.2% for students who entered post-primary school from 2001 to 2004.
Sources: IFIIE (2011); Irish Ministry of Education and Skills (2011); OECD Country Background Report: Overcoming School Failure (Equity) in Canada, Council of Ministers of Education, Canada.

C r e a t i n g l e a r n i n g e nv i r o n m e n t s t h a t a d d r e s s t h e n e e d s o f a l l ch i l d r e n
89
Chapter 4
Equity, ExcEllEncE and inclusivEnEss in Education: Policy lEssons from around thE World © OECD 2014
Data should reflect the contribution of individual schools, not the different socio-economic conditions under which teachers operate. For example, value-added modelling allows data users to separate the contribution of schools and teachers to student performance from contextual factors that are outside of the control of classrooms (OECD, 2008a). At the school level, the subjects, grades and groups of students can be identified to highlight where the school is adding most value, and where improvement is needed.
However, there are a number of challenges to data use in schools, including teachers’ attitudes, the possibility of having a negative impact on students, data saturation, and low capacity among teachers to use data effectively (Herman et al., 2008; Lachat and Smith, 2005). Public data can facilitate parents’ and students’ informed decision making; but under certain circumstances it can be detrimental to school, staff and student morale and expectations. Box 4.8 summarises a successful initiative in the Netherlands.
Box 4.8. Using data for school and student improvement in the Netherlands
An important source of data for research and monitoring is the Personal Identification Number (PGN), which has been issued to every child in the country over the age of 3 and a half. Commonly referred to as the education number, it is the same as the tax and social insurance number. Schools pass on the PGN, together with certain other data about pupils, to other schools as the child progresses through education. These data are increasingly used to monitor students’ school careers, school attendance or dropout.
The PGN is useful in the action plan against dropout because it offers complete and reliable figures on rates nationally, regionally and at municipal and district levels. All schools in secondary education are expected to register absenteeism, disengagement and dropout, and a monthly report is available to municipalities and schools to allow them to give priority to those at risk. In addition, these data are linked to socio-economic data (including immigrant background, ethnic group, employment status, eligibility for welfare) by region, city and district, which provides a wealth of information for implementing and adjusting policy.
Source: Akkerman et al. (2011).
Provide a continuum of support for struggling students
Identifying disruptions to learning and which students are struggling is only part of the strategy; providing adequate and timely support is essential to enable these students not only to stay in school but to get the most out of their learning opportunities. Learning environments that offer strong instructional and emotional support to at-risk students help to improve both achievement and teacher-student relationships (Hamre and Pianta, 2005).14 A warm and supportive environment that lets students know that help is available is especially important for disadvantaged students. In Sweden, for example, each student has the right to be supported, and school authorities have the responsibility to give all students the chance to achieve their goals.15 Evidence shows different approaches can support students in disadvantaged schools:
• Coaching and mentoring: Mentoring and coaching opens a path towards building student confidence and raising student expectations about schooling. This can be done by providing concentrated time with teachers (Levin, 2008).
• Counselling can help students navigate through the different education pathways and options and maintain their expectations and commitment. It plays an essential role when used in early stages and can compensate for the lack of early education opportunities (Tough, 2006; Heckman, 2008). In Québec, guidance and counselling are available even in primary school. In Austria, where vocational education and training is prominent, career guidance is offered in a three-pronged approach: career education lessons are provided by careers teachers; individual advice is provided by student advisors; and both of these are supplemented by a school psychology service that can offer specialised assistance. Career education lessons are carried out by the careers teachers based on a curriculum and standards, with 32 hours per year in Grades 7 and 8 (Steiner and the Styrian Association for Education and Economics, 2011).
• specific measures to support students in their transition to secondary schools: As students move from primary to secondary school, they have to leave their self-contained classrooms to be taught by many different teachers – while they are simultaneously navigating adolescence. Smoothing the transition into secondary school can prevent students from falling behind and potentially dropping out (OECD, 2011d). It can also increase their engagement with learning and sense of belonging at school (Longaretti, 2006).
C r e a t i n g l e a r n i n g e nv i r o n m e n t s t h a t a d d r e s s t h e n e e d s o f a l l ch i l d r e n
90
Chapter 4
© OECD 2014 Equity, ExcEllEncE and inclusivEnEss in Education: Policy lEssons from around thE World
Box 4.9 shows how students and teachers in North Eastern Japan are seeking to develop innovative learning environments that address the challenges arising from the 2011 tsunami.
Box 4.9. The OECD-Tohoku School Project: Student- and teacher-led change management in education
On 11 March 2011, the strongest earthquake ever recorded in Japan hit the Tohoku region, in the north, triggering the country’s worst disaster of the post-war era. In support of Japan’s recovery efforts, national, regional and local governments, together with the OECD, launched the OECD-Tohoku School project, designed to help students and teachers in the region strengthen 21st century skills, internationalisation and bottom-up innovation.
School leaders and teachers have leveraged this project to rebuild the education system and break down long-standing divisions in Japanese education, seeking synergies between schools and the private sector as well as facilitating co-operation among schools, universities and different levels and sectors of government. Two years on, the project is showing its first results. Most important, the Tohoku School project has resulted in an open “innovation framework” characterised by distributed leadership, encouragement of internal diversity in local initiatives, voluntary experimentation with new pedagogies, and a strengthened sense of ownership among the participants.
For example, in northern Fukushima, the project has begun to inspire changes involving external partners, such as business leaders and international partners, and encouraged co-operation between schools and the communities around them. Teachers are working with their students and their communities on a problem threatening the livelihood of local farmers. Rumours about pollution are damaging the sale of food grown there. Teachers have taken students to the Japan Agricultural Corporations Association to learn how such rumours damage market prices. The students have also received advice on marketing from an international perspective. The students and farmers have worked together towards a solution, finally coming up with plans to produce a fruit jelly, which has been selling well throughout Japan. For the farmers, this has meant a new future and hope, and for the students it has facilitated a shift from exam-focused academic study towards entrepreneurship, critical thinking, creativity and engaging with the community. School principals report that they can see a more positive and entrepreneurial attitude among the students in their regular schools.
The work of teachers has been affected too. One teacher said to a representative of the OECD, “Adults have experience and wisdom, but this experience often leads us to avoid taking risks. By working with the students, we have re-learned or re-gained the curiosity and courage to take risks.” Not being able to follow curricular guidelines or established practices has meant that teachers initially struggled. But they have learned to work with the students under the guidance of academic experts to experiment with new pedagogies and with the advice of community and business leaders to create new solutions. As another teacher put it, “The biggest challenge was that I did not have an answer to the issue we set out to investigate; but as I have gone out of my comfort zone, I have been able to learn many new things. I found a major difference between well-established, framed project learning and the approach we took to project-based learning.”
In some regions, an approach to first target the peripheries of school practice (such as extracurricular activities) instead of core instructional activities has made it easier to overcome initial resistance to change among teachers and the administration. In others, an approach involving organising activities totally outside of school has allowed for local industries to be more actively involved without much resistance from schools, as such activities are being closely aligned with core instructional activities. The challenges and successes the project faces in managing change towards 21st century pedagogy are being monitored. The results of the project will be shared with other OECD countries and will be fed into the OECD analytical frameworks for education policy design.
Sources: Akkerman et al. (2011); Irish Ministry of Education and Skills (2011); Moisan (2011).
Explore different ways of organising school learning time
Learning time throughout the school year can be reconfigured to address the fact that disadvantaged students may not have learning opportunities during school holidays and tend to have less supportive learning environments at home too. Evidence has shown, for example, that more hours of instruction seem to increase disadvantaged students’ achievement

C r e a t i n g l e a r n i n g e nv i r o n m e n t s t h a t a d d r e s s t h e n e e d s o f a l l ch i l d r e n
91
Chapter 4
Equity, ExcEllEncE and inclusivEnEss in Education: Policy lEssons from around thE World © OECD 2014
in science (Muskens, 2009; OECD, 2011e). While after-school and holiday programmes, study support or breakfast clubs are options, disadvantaged students are less likely to participate in these activities because of cost, access or because they have limited knowledge on how to participate (Horgan, 2009).
Schools can also consider organising learning time differently, changing the number of hours per day and/or days per week. Some promising strategies in more than 30 systems are analysed in the OECD Innovative Learning Environments project (OECD, 2013b). In Spain, for example, since 2006, some schools can offer students more instruction time, and/or modify the learning time to better serve their students (IFIIE, 2011). In Greece, all primary schools are gradually becoming all-day schools. In those schools, children may arrive as early as 7:00 and leave as late as 16:00, during which they can benefit from extra study support, both individual and group. The curriculum has also been enriched with creative activities of various kinds, such as foreign language classes and sports, and the school year has been slightly extended (Greek Ministry of Education, 2011).
Hold high expectations for all students and use effective teaching practices
PISA shows that student performance varies greatly within schools across OECD countries. This reflects the diversity of student backgrounds, their strengths and weaknesses, and their motivations and aspirations. yet across countries, many disadvantaged schools are staffed by teachers and administrators who, with the best of intentions, have low expectations for their students. These low expectations, in turn, are often translated into – or absorbed as – easier curricular content, a poorer quality of instruction, and among students, lower self-esteem and aspirations and less motivation to learn (Leithwood, 2010; Dumont, Istance and Benavides, 2010). Box 4.10 outlines some effective teaching and learning practices.
Box 4.10. Principles of effective learning
A recent review of the international evidence on learning presents a set of guiding principles that can shape the way education is planned and offered in schools and classrooms. These principles take into account equity and quality in teaching and learning.
learner-centred: The environment needs to be focused on learning as the principal activity, not as an alternative to the critical role of teachers and other learning professionals, but dependent on them.
structured and well-designed: To be “learner-centred” requires careful design and high levels of professionalism. This still leaves room for inquiry and autonomous learning.
personalised: The learning environment is sensitive to individual and group differences in background, prior knowledge, motivation and abilities, and offers tailored and detailed feedback.
inclusive: It takes into consideration individual and group differences, including the weakest learners, and defines an education agenda that excludes no one.
social: Learning is effective when it takes place in group settings, when learners collaborate as an explicit part of the learning environment, and when there is a connection to community.
Source: Dumont, Istance and Benavides (2010).
Disadvantaged students benefit in particular when instruction, assessment and curricula are systematically intertwined, although this is difficult to achieve. Both direct and student-oriented instruction methods can be used (Box 4.11). Direct instruction is built around problems with clear, correct answers that can be learned quickly. Student-centred instruction is associated with the teacher facilitating students’ own inquiry by allowing them time to find solutions to problems on their own before the teacher demonstrates how a problem is solved.16 While there is no consensus in the literature on which approach is better, an over-reliance on either approach is not recommended (OECD, 2008b; Rowe, 2007).
Research shows that the curriculum should be common and set high expectations for all, be linked to clear learning goals, and be connected to the next education (or professional) level. As much as possible, classroom activities related to the curriculum should develop student knowledge of real-world problems (Dumont, Istance and Benavides, 2010; Faubert, 2012; OECD, 2008a). Schools and teachers should be less concerned with topic coverage and more with their learning strategy.

C r e a t i n g l e a r n i n g e nv i r o n m e n t s t h a t a d d r e s s t h e n e e d s o f a l l ch i l d r e n
92
Chapter 4
© OECD 2014 Equity, ExcEllEncE and inclusivEnEss in Education: Policy lEssons from around thE World
They should learn from multiple and integrated models, modules and subjects rather than “disconnected and isolated six-week units”, which are thought to be rather typical across OECD countries (OECD, 2008a). Curriculum has to be thought of as both catering to significant individual differences and being able to stretch each learner to just beyond his or her self-defined capacity (Dumont, Istance and Benavides, 2010). However, given the cross-country variation in who has responsibility for curricula, it is difficult to provide clear policy direction on curricula at the school level.
Arranging students in particular group structures can lead to both improved student engagement in the lesson and improved student achievement. Co-operative learning methods, which involve the teacher placing students within the same class in small, temporary groups with mixed abilities focusing on tasks that require them to rely on each other’s skills, tend to work equally well for all types of students (Slavin, 2010). The research suggests that high achievers gain from co-operative learning (relative to high achievers in traditional classes) as much as do low and average achievers. This is partly because, when it works effectively, the group method pushes learners of all abilities; and partly because the high-achieving students learn by helping their lower-achieving classmates. However, there is little research on how to teach students to work effectively in heterogeneous groups.
Create effective links among the school, parents and the community
Engaged parents encourage more positive attitudes towards school, improve homework habits, reduce absenteeism, disengagement and dropout, and enhance academic achievement. Policies need to be designed to ensure that disadvantaged schools prioritise their links with parents and communities.
Box 4.11. Direct and student-oriented instruction practices
Direct instruction
Space learning over time: Students are exposed to the material on more than one occasion. Offer a worked-out problem followed by a related unsolved problem. Worked-out examples should include a problem statement and the steps needed to solve the problem.
Concrete and abstract representations of concepts: One possible approach is called concreteness fading, or using a concrete representation to introduce a concept or principles, and then systematically replacing relevant components of the concrete representation with abstract representations (e.g. introducing the concept of fractions by cutting a pie into slices and demonstrating how much of the pie would be gone if a slice were given to a friend). Another approach is concept mapping, a process by which the teacher introduces a new and abstract concept first by summarising the main points of the lesson, and then identifying and synthesising the major ideas, themes and interrelationships between the concrete and abstract parts.
Deep questions: After students have mastered the factual content of a particular topic, teachers can ask deep or higher-order questions that challenge students’ understanding of the concept, including: How did x occur? How does x compare to y? What is the evidence for x? Why is x important?
Student-oriented instruction
Culturally responsive instruction: Requires that the teacher values student concerns, needs and realities (e.g. family, community).
Structured team learning: Involves rewards to teams based on the learning progress of their members. It also features individual accountability, which means that team success depends on individual learning, not group products.
Informal group learning methods: Covers methods more focused on social dynamics, projects, and discussion than on mastery of well-specified content.
Inquiry-based learning methods: Using meaningful real-life problems, it aims to bolster the relevance of the material to be learned.
Sources: Barron and Darling-Hammond (2010); Faubert (2012); Slavin (2010).

C r e a t i n g l e a r n i n g e nv i r o n m e n t s t h a t a d d r e s s t h e n e e d s o f a l l ch i l d r e n
93
Chapter 4
Equity, ExcEllEncE and inclusivEnEss in Education: Policy lEssons from around thE World © OECD 2014
Parental engagement in education mostly happens through two channels (OECD, 2010c): the support parents give to their children at home, such as discussing school activities and helping with homework, and in-school activities, such as taking part in parent-teacher meetings and other school activities (Nusche, 2009; Dumont, Istance and Benavides, 2010).
The evidence shows that parents’ involvement – regardless of economic and social constraints – can make a difference in their children’s cognitive and social development (Schenider et al. in Dumont, Istance and Benavides, 2010). Families are instrumental in developing the values and attitudes that encourage student engagement with, motivation for and success in learning. For example, in helping their child with homework, parents not only reinforce lessons and concepts learned in school, but also demonstrate attitudes and behaviours associated with success in school (Desforges, 2003).
High-achieving students in disadvantaged schools are more likely to have parents involved in their learning at home and who actively participate in their schooling (Ingram, Wolfe and Lieberman, 2007). As low performance can result from home environments that do not encourage school engagement, schools have to reach out to parents, especially those who may require extra support to engage in their child’s learning. To be effective, efforts have to be aligned with school goals and activities (Schenider et al. in Dumont, Istance and Benavides, 2010) and be perceived as positive by all parties. For example, if parental involvement puts teachers and parents in opposition to each other, it can be difficult to establish trusting relationships that will benefit the child. Learning is adversely affected when schools lack these trusting relationships (Bryk and Schneider, 2002). Therefore, specific policies should be designed to ensure that disadvantaged schools have the capacity to engage parents in ways that are meaningful and supportive of their children’s achievement.
Good communication between parents and schools allows for better co-ordination between the learning activities carried on between school and home. Homework can be a channel of communication that aligns parents with school goals. To encourage parents to become more involved in their child’s education:
• Use diverse communication channels. Formal arrangements to link parents and schools may not work for disadvantaged groups (Field, Kuczera and Pont, 2007). Communication with heterogeneous groups of parents has to be strengthened, and in many cases diversified beyond the traditional report cards and newsletters. Schools need to identify ways to work with parents to enhance their skills and enable them to provide more informed support for their children. This can include schemes with financial, logistic and expert support, and actions such as home visits and community-based initiatives in adult and parental education (MacBeath et al., 2005).
• Ensure balanced communication. Particularly for children of parents who are less familiar with the working of schools, student behaviour and achievements need to be relayed to parents in a balanced way (Field, Kuczera and Pont, 2007). If the only information reaching home is bad news, there will be little chance of winning support from parents for the efforts being made at school. A diversified teaching force can also facilitate communication between schools and parents and present information in more relevant ways.
• Target efforts to reach out to certain parents. Esler, Godber and Christenson (2008) recommend that schools identify families who are not yet involved in their children’s schooling and extend personal invitations to become involved – whether the child is performing well or not in school. This sends the message to parents that the school values the child and his or her progress (Dumont, Istance and Benavides, 2010). Box 4.12 presents several programmes aimed at obtaining support of specific groups of parents.
• Provide clear guidelines on what is expected from parents. Schools should seek to encourage interaction between teachers and parents through explicit guidelines on how parents can contribute to their child’s schooling, particularly with homework. The guidelines can include: finding an appropriate place to study; devoting sufficient time to homework; helping their children with assignments but not completing them; and conveying messages about the value of homework, particularly its relationship to children’s educational goals and those of the school.
The surrounding community is also an indispensable partner in education (Field, Kuczera and Pont, 2007). Communities can offer a wide range of valuable resources for disadvantaged students and schools, such as volunteer tutors, adult mentors and enrichment programmes for students. Mentoring migrant students, especially by mentors with immigrant backgrounds, is often found to be an effective way of providing additional educational support and raising the self-confidence of immigrant students (OECD, 2010c).
C r e a t i n g l e a r n i n g e nv i r o n m e n t s t h a t a d d r e s s t h e n e e d s o f a l l ch i l d r e n
94
Chapter 4
© OECD 2014 Equity, ExcEllEncE and inclusivEnEss in Education: Policy lEssons from around thE World
Box 4.12. Reaching parents and communities in the Netherlands, Ireland and France
In the Netherlands, specific initiatives are devoted to parents from migrant groups who are generally more difficult to reach and less involved in their children’s education. A special Ethnic Minority Parents’ Platform was created to foster the involvement of migrant parents. Activities to reach ethnic minority parents include home visits by teachers, creating a room for parents in the school, sometimes in combination with providing courses, such as language courses, for parents, and creating parent information points in the school. Many (primary) schools with a high proportion of migrant pupils have developed a policy aimed at encouraging parents to support their children’s education. On the local level, the municipality gives support for parental initiatives and more information for parents.
Ireland has a Home/School/Community Liaison Scheme (HSCL), which is a preventive strategy targeted at students at risk of not reaching their potential in the education system because of their background. The service focuses directly on the most important adults in children’s education and seeks indirect benefits for the children themselves. There are some 400 home/school/community liaison c-oordinators deployed across all disadvantaged post-primary schools and urban primary schools that benefit from extra support. The HSCL programme aims to establish partnerships and collaboration between parents and teachers in the interests of children’s learning. The co-ordinator organises locally based activities to encourage greater contact among parents, teachers and local voluntary and statutory groups to tackle issues in the community that impinge on learning. Approximately EUR 25 million was allocated to HSCL for 2011, and 155 000 students attending 545 schools (200 post-primary and 345 primary schools) have access to the service. Some 50 000 of these pupils’ families were specifically targeted for the services of home/school/community liaison co-ordinators.
In france, after being piloted in one school district (Academie de Creteil), the “parents’ toolbox” (la mallette des parents) was introduced in 1 300 lower secondary schools in September 2011. Parents receive a DVD at the beginning of the school year with information on their children’s schooling and are invited to participate in three meetings at the school during the school year, on topics such as school organisation, helping with homework and sleeping patterns. The scheme aims to increase links between school and parents, and to ensure more continuity in the child’s learning. In its early stages, it has achieved positive outcomes for students, seen particularly in a reduction in absenteeism.
Sources: Akkerman et al. (2011); Irish Ministry of Education and Skills (2011); Moisan (2011).
In return, schools can become resource centres for community development (Field, Kuczera and Pont, 2007). They can work closely with community health, recreation, youth, police and other local institutions to address external obstacles to learning. In some education systems, schools offer on-site professionals who provide complementary services directly to students and their parents. Evidence shows that such extensions of school services attract families that would otherwise be unwilling to be involved. The initiative Century Community Learning Center Program, in the United States, is one example. It aims to transform schools into community centres by providing extracurricular activities and supplementary instruction in reading for all.

C r e a t i n g l e a r n i n g e nv i r o n m e n t s t h a t a d d r e s s t h e n e e d s o f a l l ch i l d r e n
95
Chapter 4
Equity, ExcEllEncE and inclusivEnEss in Education: Policy lEssons from around thE World © OECD 2014
notes1. The percentage is obtained by squaring the partial correlation coefficient and then multiplying it by 100.
2. These estimates do not address either the potential benefits of grade repetition or the costs if school systems do not allow for grade repetition. For example, students who have repeated a grade might be better prepared for the labour market than if they had not done so. And schools might have to spend more to offer remedial classes to struggling students if those students are not permitted to repeat a year.
3. For instance, in the Czech Republic, the compulsory education requirement is fulfilled by the number of years in education, not necessarily by completion of lower secondary up to its last grade. Grade repetition thus has consequences for enrolment in upper secondary education.
4. Existing evaluation studies on school improvement remain mostly qualitative and show mixed results. This is mainly because of the complexity of factors involved and the difficulty in disaggregating the causal effects on school performance and improvement. Studies on poor-performing, disadvantaged schools are rare, and so there is little systematic knowledge about the processes and characteristics of these schools.
5. Many countries provide learning opportunities beyond the traditional academic year, which can help students who are falling behind to catch up with their peers. Studies examining the effects of summer schools have concluded that these have modest but positive effects on academic achievement over the summer (Cooper et al., 2000). Little research has been conducted on the impact of summer programmes on later grades; but some studies have shown that the effects persist for at least a few years (Jacob and Lefgren, 2004), although their magnitude varies considerably across grades (Matsudaira, 2008). Students in primary school appear to benefit more than those in secondary school, but researchers have pointed to the difficulty in attracting older students (Cooper et al., 2000). The content of the programmes should be linked to the academic curricula; different instructional methods should be explored (Lauer et al., 2006). The duration of the programmes should depend on the specific achievement targets, as longer programmes are more costly and do not necessarily lead to higher student achievement. Programmes that offer small-group instruction, particularly one-on-one tutoring, are more effective for at-risk students.
6. This greatly reduced, though did not entirely eliminate, the tracking system, because many secondary schools had their own streaming systems to differentiate students according to ability.
7. Guidance is particularly important in education systems with differentiated structures. There is a strong need for a better concentration of guidance resources in the final two years of schooling. This should take the form of greater resources, particularly time, for student advisers to work with these students, and curriculum-based career assistance (OECD, 2003).
8. For example, students who succeed in vocational education and training can accumulate qualifications and access tertiary education after one to three additional years of study. Many students make use of this longer route: 17% of Dutch students continue into higher education after completing upper secondary vocational education, while 41% of students access this level directly from academic upper secondary education (Akkerman et al., 2011).
9. In Japan, performance disparities by schools’ socio-economic background are comparatively large, but the overall differences in the socio-economic profiles of schools are comparatively smaller than those in other countries. That explains why, overall, Japan has one of the more equitable education systems while other countries that have similar performance disparities, such as Germany, are more inequitable.
10. In that case, “affluent” is defined as a child whose background on the PISA index of economic, social and cultural status is one-quarter of a standard deviation (student-level) above the OECD average.
11. The school’s mean PISA index of economic, social and cultural status is one-quarter of a standard deviation below the OECD average.
12. In some countries, socio-economic segregation may be firmly entrenched, through residential segregation in major cities or a large urban/rural socio-economic divide. In other countries, the school system tends to stream or track students into programmes with different curricula and teaching practices, often resulting in socio-economic segregation across these tracks or streams (OECD, 2010a).
13. Examples of data relevant to the school context could be the results of state-level accountability tests, final grades on an end-of-term test, class and school size, student attendance, school climate and information about a student’s well-being and community collected in surveys.
14. Some 910 children participated in a national prospective study. Children were identified as at-risk at ages 5-6 on the basis of demographic characteristics and the display of multiple functional (behavioural, attention-related, academic, social) problems reported by their kindergarten teachers. By the end of first grade, at-risk students placed in first-grade classrooms offering strong instructional and emotional support had achievement scores and student–teacher relationships commensurate with their low-risk peers; at-risk students placed in less supportive classrooms had lower achievement and more conflict with teachers.

C r e a t i n g l e a r n i n g e nv i r o n m e n t s t h a t a d d r e s s t h e n e e d s o f a l l ch i l d r e n
96
Chapter 4
© OECD 2014 Equity, ExcEllEncE and inclusivEnEss in Education: Policy lEssons from around thE World
15. A student who has difficulty following lessons in class can receive support in several ways, such as having support from a special education teacher who assists the child in the classroom, or being part of a special remedial group outside the regular classroom. If this need is not observed by the school principal, the student can complain to the Swedish Schools Inspectorate, which can require the organiser to take action (Båvner, et al., 2011).
16. Some countries, including Australia, Austria, Canada, Finland, Iceland, Norway and the United States, prefer student-oriented approaches. Others, including Bulgaria, Italy, Poland, Portugal, the Slovak Republic and Spain, broadly endorse the two, with a moderate preference for student-oriented approaches (OECD, 2009; Rowe, 2007).
referencesAkkerman, Y. et al. (2011), “Overcoming School Failure: Policies that Work”, Background Report for the Netherlands, Ministry of Education, Culture and Science, Den Haag, www.oecd.org/education/school/49528317.pdf.
Allen, C. et al. (2009), “Quality of research design moderates effects of grade retention on achievement: A meta-analytic, multilevel analysis”, Educational Evaluation and Policy Analysis, Vol. 31, No. 4, pp. 480-499.
Barron, L. and L. Darling-Hammond (2010), “Prospects and challenges for inquiry-based approaches to learning,” in Dumont, H., D. Istance and F. Benavides (eds.) (2010), The Nature of Learning: Using Research to Inspire Practice, Educational Research and Innovation, OECD Publishing, http://dx.doi.org/10.1787/9789264086487-en.
Bauer, P. and R. Riphahn (2006), “Timing of school tracking as a determinant of intergenerational transmission of education”, Economic Letters, Vol. 91, No. 1, pp. 90-97.
Båvner, P. et al. (2011), OECD - Overcoming school failure. Country background report Sweden, Government Offices of Sweden, Ministry of Education and Research, www.oecd.org/education/school/49528267.pdf.
Bjorklund, A. and K. Salvanes (2011), “Education and Family Background: Mechanisms and Policies”, Handbook of the Economics of Education, Vol. 3.
Brophy, J. (2006), “Grade Repetition”, Education Policy Series No. 6, International Institute for Educational Planning, UNESCO, Paris.
Bryk, A.S. and B. Schneider (2002), Trust in Schools: A Core Resource for Improvement, Russell Sage Foundation, New york.
Cooper, H. et al. (2000), “Making the most of summer school: A meta-analytic and narrative review”, Monographs of the Society for Research in Child Development, Serial 260, Vol. 65, No. 1, pp. 1-118.
Day, C. et al. (2009), “The Impact of School Leadership on Pupil Outcomes”, Research Report No. DCSF-RR108, University of Nottingham.
Desforges, C. (2003), “The Impact of Parental Involvement, Parental Support and Family Education on Pupil Achievements and Adjustment: A Literature Review”, Research Report No. RR433, Department for Education and Skills.
Dumont, H., D. Istance and F. Benavides (2010), The Nature of Learning: Using Research to Inspire Practice, OECD Publishing, http://dx.doi.org/10.1787/9789264086487-en.
Esler, A.N., Y. Godber and S. L. Christenson (2008), “Best practices in supporting school-family partnerships” in A. Thomas and J. Grimes (eds.), Best Practices in School Psychology, National Association of School Psychologists, Bethesda, pp. 917-936.
Eurydice (2011), Grade Retention during Compulsory Education in Europe: Regulations and Statistics, European Commission, Eurydice Thematic Studies.
Faubert, B. (2012), “In-school policies and practices for overcoming school failure: A literature review for the OECD”, OECD Education Working Papers, No. 68, OECD Publishing, http://dx.doi.org/10.1787/5k9flcwwv9tk-en.
Field, S., M. Kuczera and B. Pont (2007), No More Failures: Ten Steps to Equity in Education, Education and Training Policy, OECD Publishing, http://dx.doi.org/10.1787/9789264032606-en.
Gamoran, A. (2011), “Designing Instruction and Grouping Students to Enhance the Learning of All: New Hope or False Promise?” in M. Hallinan (ed.) Frontiers in Sociology and Social Research, Vol. 1, Part 1, pp. 111-126.
Gamoran, A. (1996), “Curriculum standardization and equality of opportunity in Scottish secondary education 1984-1990”, Sociology of Education, Vol. 29, pp. 1-21.

C r e a t i n g l e a r n i n g e nv i r o n m e n t s t h a t a d d r e s s t h e n e e d s o f a l l ch i l d r e n
97
Chapter 4
Equity, ExcEllEncE and inclusivEnEss in Education: Policy lEssons from around thE World © OECD 2014
Goos, M. et al. (2013), “How Can Cross-Country Differences in the Practice of Grade Retention Be Explained? A Closer Look at National Educational Policy Factors”, Comparative Education Review, Vol. 57, No. 1, pp. 54-84.
Greek Ministry of Education (2011), Overcoming School Failure: Policies that Work, National Report Greece, http://www.oecd.org/education/school/49528233.pdf.
Hamre, B. and R. Pianta (2005), “Can instructional and emotional support in the first-grade classroom make a difference for children at risk of school failure?” Child Development, September/October 2005, Vol. 76, No. 5, pp. 949-967.
Harrop, A. and J. Swinson (2007), “The behavioural approach in schools: A time for caution revisited”, Educational Studies, Vol. 33, No.1, pp. 41-52.
Heckman, J. (2008), “The case of Investing in Disadvantage young Children”, Big Ideas for Children: Investing in Our Nation’s Future, First Focus, Washington, D.C.
Herman, R. et al. (2008), Turning Around Chronically Low-Performing School: A Practical Guide, National Center for Education Evaluation and Regional Assistance, Institute of Education Sciences, US Department of Education: Washington D.C.
Holmlund, H. (2007), “A Researcher’s Guide to the Swedish Compulsory School Reform”, Working paper 9/2007, Swedish Institute for Social Research, Stockholm University.
Horgan, G. (2009), “’That child is smart because he’s rich’: The impact of poverty on young children’s experiences of school”, International Journal of Inclusive Education, Vol. 13, No. 4.
Ingram M., R. Wolfe and J. Lieberman (2007), “The role of parents in high-achieving schools serving low-income, at-risk populations”, Education and Urban Society, Vol. 39 No. 4, pp. 479-497.
IFES (2010), Zufriedenheit mit der Neuen Mittelschule Elternbefragung (Satisfaction with the Neue Mittelschule: A parent survey), IFES, Wien.
IFIIE (Institute for Teacher Training and Educational Research and Innovation) (2011), Overcoming School Failure: Policies that Work, Spanish National Report, Ministerio de Educacion, Spain, www.oecd.org/education/school/48631820.pdf.
Irish Ministry of Education and Skills (2011), Overcoming School Failure: Policies that Work, National Report Ireland, www.oecd.org/education/school/49624509.pdf.
Jacob, B. and L. Lefgren (2009), “The Effect of Grade Retention on High School Completion”, American Economic Association, American Economic Journal of Applied Economics, Vol. 1, No. 3, pp. 33-58.
Jimerson, S., G. Anderson and A. Whipple (2002), “Winning the battle and losing the war: Examining the relation between grade retention and dropping out of high school”, Psychology in the Schools, Vol. 39, No. 4, pp. 441-457.
Lachat, M. and S. Smith (2005), “Practices that Support Data Use in Urban High-Schools”, Journal of Education for Students Placed at Risk, Vol. 10, No. 3.
Lauer, P. et al. (2006), “Out-of-school-time programs: A meta-analysis of effects for at-risk students”, Review of Educational Research, Vol. 76, No. 2, pp 275-313.
Levin, B. (2008), “In Canada – 20 Minutes to Change a Life?”, Phi Delta Kappan, Vol. 90, No. 5, pp. 384-385.
Leithwood, K. (2010), “Turning around Underperforming School Systems”, a paper commissioned by the College of Alberta School Superintendents, College of Alberta School Superintendents.
Longaretti, L. (2006), “School Transition: Aspirations and Inspirations”, Paper presented at the AARE Conference, Adelaide, November.
MacBeath, J. et al. (2005), Responding to Challenging Circumstances Evaluation of the Schools Facing Exceptionally Challenging Circumstances, Faculty of Education, University of Cambridge.
Martins, P. (2010), “Can Targeted, Non-Cognitive Skills Programs Improve Achievement?”, IZA Discussion Paper, No. 5266.
Matsudaira, J. (2008), “Mandatory Summer School and Student Achievement”, Journal of Econometrics, Vol. 142, No. 2, pp. 829-850.
Meghir, C. and M. Palme (2005), “Educational Reform, Ability and Family Background”, American Economic Review, Vol. 95, No. 1, pp. 414-424.
C r e a t i n g l e a r n i n g e nv i r o n m e n t s t h a t a d d r e s s t h e n e e d s o f a l l ch i l d r e n
98
Chapter 4
© OECD 2014 Equity, ExcEllEncE and inclusivEnEss in Education: Policy lEssons from around thE World
Merino, R. (2006), “Two or three vocational training pathways? An assessment and the current situation in Spain”, European journal of vocational training, No. 37.
Moisan, C. (2011), “Comment en finir avec l’échec scolaire: les mesures efficaces”, Projet de rapport national de base de la France, www.oecd.org/fr/education/scolaire/49528429.pdf.
Monseur, C. and D. Lafontaine (2012), “Structure des systèmes éducatifs et équité : Un éclairage international”, in M. Crahay (ed.), Pour une école juste et efficace, De Boeck, Brussels.
Muskens, G. (2009), Inclusion and Education in European Countries, INTMEAS.
Nusche, D. (2009), “What works in migrant education?: A review of evidence and policy options”, OECD Education Working Papers, No. 22, OECD Publishing, http://dx.doi.org/10.1787/227131784531.
O’Brien, P. (2007), “Enhancing Incentives to Improve Performance in the Education System in France”, OECD Economics Department Working Papers, No. 570. OECD Publishing, http://dx.doi.org/10.1787/127375127310.
OECD (2013a), PISA 2012 Results: What Makes Schools Successful? Resources, Policies and Practices (Volume IV), PISA, OECD Publishing, http://dx.doi.org/10.1787/9789264201156-en.
OECD (2013b), Innovative Learning Environments, Educational Research and Innovation series, OECD Publishing, http://dx.doi.org/10.1787/9789264203488-en.
OECD (2011a), Lessons from PISA for the United States, Strong Performers and Successful Reformers in Education, OECD Publishing, http://dx.doi.org/10.1787/9789264096660-en.
OECD (2011b), “When students repeat grades or are transferred out of school: What does it mean for education systems?”, PISA in Focus, No. 6, OECD Publishing, http://dx.doi.org/10.1787/5k9h362n5z45-en.
OECD (2011c), “The Impact of the 1999 Education Reform in Poland”, OECD Education Working Papers, No. 49, OECD Publishing, http://dx.doi.org/10.1787/5kmbjgkm1m9x-en.
OECD (2011d), Reviews of National Policies for Education: Improving Lower Secondary Schools in Norway in 2011, OECD Publishing, http://dx.doi.org/10.1787/9789264114579-en.
OECD (2011e), Against the Odds: Disadvantaged Students who Succeed in School, OECD Publishing, http://dx.doi.org/10.1787/ 9789264090873-en.
OECD (2010a), PISA 2009 Results: What Makes a School Successful?: Resources, Policies and Practices (Volume IV), PISA, OECD Publishing, http://dx.doi.org/10.1787/9789264091559-en.
OECD (2010b), PISA 2009 Results: Overcoming Social Background: Equity in Learning Opportunities and Outcomes (Volume II), PISA, OECD Publishing, http://dx.doi.org/10.1787/9789264091504-en.
OECD (2010c), Closing the Gap for Immigrant Students: Policies, Practice and Performance, OECD Reviews of Migrant Education, OECD Publishing, http://dx.doi.org/10.1787/9789264075788-en.
OECD (2009), OECD Economic Surveys: Austria 2009, OECD Publishing, http://dx.doi.org/10.1787/eco_surveys-aut-2009-en.
OECD (2008a), Measuring Improvements in Learning Outcomes: Best Practices to Assess the Value-Added of Schools, OECD Publishing, http://dx.doi.org/10.1787/9789264050259-en.
OECD (2008b), “Assessment for learning: Formative assessment,” OECD/CERI International Conference Learning in the 21st century: Research, Innovation and Policy, the Centre for Education Research and Innovation, Paris, France.
OECD (2003), Education Policy Analysis 2003, OECD Publishing, http://dx.doi.org/10.1787/epa-2003-en.
OECD/SSAT (2008), Improving School Leadership Vol. 2: Case Studies on System Leadership, OECD Publishing, http://dx.doi.org/ 10.1787/9789264039551-en.
Pekkarinen, T., S. Pekkala and R. Uusitalo (2006), “Education Policy and Intergenerational Income Mobility: Evidence from the Finnish Comprehensive School Reform”, IZA Discussion Paper, No. 2204.
Pont, B., D. Nusche and H. Moorman (2008), Improving School Leadership Vol. 1: Policy and Practices, OECD Publishing, http://dx.doi.org/10.1787/9789264044715-en.
Reynolds, D. et al. (2002), “School Improvement for Schools facing Challenging Circumstances: A Review of Research and Practice”, School Leadership and Management, Vol. 22, No. 3, pp. 243-256.

C r e a t i n g l e a r n i n g e nv i r o n m e n t s t h a t a d d r e s s t h e n e e d s o f a l l ch i l d r e n
99
Chapter 4
Equity, ExcEllEncE and inclusivEnEss in Education: Policy lEssons from around thE World © OECD 2014
Rowe, K. (2007), “The imperative of evidence-based instructional leadership: Building capacity within professional learning communities via a focus on effective teaching practice”, Background paper to keynote address presented at the Sixth International Conference on Educational Leadership, University of Wollongong, 15-16 February 2007.
Slavin, R. (2010), “Co-operative learning: What makes group-work work?”, in The Nature of Learning: Using Research to Inspire Practice, OECD Publishing, http://dx.doi.org/10.1787/9789264086487-9-en.
Steiner, M. and the Styrian Association for Education and Economics (2011), OECD Country Report Austria, Overcoming School Failure: Policies that Work, Federal Ministry for Education, Arts and Culture, Austria, www.oecd.org/education/school/49528170.pdf.
Thomas, D. et al. (2008), “Double Jeopardy: Child and School Characteristics That Predict Aggressive-Disruptive Behavior in First Grade”, School Psychology Review, Vol. 37, No. 4.
Tough, P. (2006), “What it Takes to Make a Student”, The New York Times Sunday Magazine, 26 November.
Välijärvi, J. and P. Sahlberg (2008), “Should ‘failing’ students repeat a grade? A retrospective response from Finland”, Journal of Educational Change, Vol. 9, No. 4, pp. 385-389.
Van Elk, R., M. van der Steeg and D. Webbink (2009), “The effect of early tracking on participation in higher education”, Centraal Planbureau, The Hague CPB Document No. 182.
Webster-Stratton C. and M.J. Reid (2001), “The Incredible years Parents, Teachers, and Children Training Series: A Multifaceted Treatment Approach for young Children with Conduct Disorders”, http://incredibleyears.com.
Wisniewski, J. (2007), “Secondary Education in Poland: 18 years of changes”, paper presented for the Fourth ECA Education Conference, Tirana, 24-26 October 2007, available at: http://siteresources.worldbank.org/EXTECAREGTOPEDUCATION/Resources/444607-1192636551820/Secondary_education_in_Poland_jwi_4r.pdf.
Woessmann, L. (2010), “Institutional determinants of school efficiency and equity: German states as a microcosm for OECD countries”, Jahrbücher für Nationalökonomie und Statistik (Journal of Economics and Statistics), Vol. 230, No. 2, pp. 234-270.
Woessmann, L. (2008), “Efficiency and equity of European education and training policies”, International Tax Public Finance, Vol. 15, No. 1, pp. 199-230.
The statistical data for Israel are supplied by and under the responsibility of the relevant Israeli authorities. The use of such data by the OECD is without prejudice to the status of the Golan Heights, East Jerusalem and Israeli settlements in the West Bank under the terms of international law.

101
Chapter 5
Building an equitaBle, excellent and inclusive education system
Equity, ExcEllEncE and inclusivEnEss in Education: Policy lEssons from around thE World © OECD 2014
Excellence and equity in student performance are less related to a country’s
income or expenditure on education than to how those educational resources
are allocated, and to the policies, practices and learning environments that
determine the conditions in which students work. This chapter identifies
some of the steps policy makers can take to build school systems that are
both equitable and excellent: attract, nurture and retain qualified teachers;
allocate resources equitably; make pre-primary education accessible to all;
and avoid socio-economic segregation within school systems.

B u i l d i n g a n e q u i t a b l e , e x c e l l e n t a n d i n c l u s i ve e d u c a t i o n s y s t e m
102
Chapter 5
© OECD 2014 Equity, ExcEllEncE and inclusivEnEss in Education: Policy lEssons from around thE World
The impact of the recent economic crisis on education budgets has only just begun to be observed; but it is evident that, in the context of the crisis, countries need to structure and manage school systems efficiently to maximise the impact of limited resources on excellence, equity and inclusiveness. However, as the data from PISA show, when it comes to education, money isn’t everything. Excellence and equity in student performance are less related to a country’s / economy’s income or expenditure on education per student than to how those educational resources are allocated, and to the policies, practices and learning environments that determine the conditions in which students can work to achieve their full potential. In fact, education policies and practices can only be considered effective if they result in learning in the classroom.
PISA shows that disciplinary climate tends to be not conducive to learning in schools whose students come from diverse socio-economic backgrounds, schools with a large student population, schools located in cities, and public schools. These schools need targeted policies/interventions. Standardised assessments and information systems, already in place in most countries, can be used to identify individual schools that need special assistance by incorporating some questions about and/or measures of the learning environment. Colombia, Mexico and Poland, for example, have improved the information infrastructure of their education systems so that they can better identify and support struggling schools.
Comparisons of learning environments between 2003 and 2012 suggest that they have improved overall; but there are still schools with poor learning environments in all countries and economies. What kinds of interventions are most effective for these schools? PISA results show that, when comparing two schools, public or private, of the same size, in the same kind of location, and whose students share similar socio-economic status, disciplinary climate tends to be better in the school that does not suffer from a shortage of qualified teachers. Teacher shortage and disciplinary climate are inter-related: most teachers tend to avoid schools with more disciplinary problems, while a shortage of qualified teachers adversely affects disciplinary climate. What is needed in these schools is an intervention to break this vicious cycle.
aTTraCT, nurTure anD reTaIn qualIfIeD TeaCherSSchool systems must attract, nurture and retain quality teachers by setting relevant criteria for entering the teaching profession and providing sufficient and appropriate pre-service and in-service training. Countries that have improved their performance in PISA, like Brazil, Colombia, Estonia, Israel, Japan and Poland, for example, have established policies to improve the quality of their teaching staff by either adding to the requirements to earn a teaching license, providing incentives for high-achieving students to enter the profession, increasing salaries to make the profession more attractive and to retain more teachers, or by offering incentives for teachers to engage in in-service teacher-training programmes. While paying teachers well is only part of the equation, higher salaries can help school systems to attract the best candidates to the teaching profession. PISA results show that high-performing countries tend to pay teachers higher salaries relative to their per capita GDP.
School systems also need to ensure equity in the allocation of teachers across schools. To this end, some systems need to re-examine teacher hiring/allocation systems to ensure that difficult schools get enough qualified teachers, develop incentive systems to attract qualified teachers to these difficult schools, and ensure that teachers in difficult schools participate in in-service training (results show that these teachers are less likely to participate in professional training). If these difficult schools can attract and retain enough qualified teachers, that will go a long way towards promoting a positive school culture.
alloCaTe reSourCeS equITablyThe results from PISA also show that schools with more socio-economically disadvantaged students tend to have lower-quality resources than schools with more advantaged students. Fairness in resource allocation is not only important for equity in education, it is also related to the performance of the education system as a whole. PISA results show that school systems with high student performance in mathematics tend to allocate resources more equitably between advantaged and disadvantaged schools. In these systems, there are smaller differences between higher-performing and lower-performing schools in principals’ reports on teacher shortage, the adequacy of educational resources and physical infrastructure, and smaller differences in average mathematics learning time between schools with more advantaged and those with more disadvantaged students.
For example, Estonia, Finland, Germany, Korea and Slovenia all show higher-than-OECD-average performance in mathematics. In these countries, principals in disadvantaged schools tended to report that their schools had adequate educational resources as much as, if not more than, principals in advantaged schools reported.
B u i l d i n g a n e q u i t a b l e , e x c e l l e n t a n d i n c l u s i ve e d u c a t i o n s y s t e m
103
Chapter 5
Equity, ExcEllEncE and inclusivEnEss in Education: Policy lEssons from around thE World © OECD 2014
In systems where the overall level of educational resources is below the OECD average, there tends to be a greater gap in educational resources between advantaged and disadvantaged schools. Scarce resources tend to be more concentrated in advantaged schools, and disadvantaged schools tend to suffer from inadequacy or shortage of resources. In these countries and economies, policies need to increase the overall level of resources while also ensuring that resources are allocated equitably between advantaged and disadvantaged schools.
Among systems where the overall level of educational resources is above the OECD average, equity in resource allocation is not necessary linked to the overall level of resources. Even if two countries have similar levels of educational resources overall, one may allocate those resources more equitably than the other. Thus, in countries and economies that have already attained a certain level of resources, policy should focus on allocating those resources equitably, rather than just on increasing the overall level of resources.
make Pre-PrImary eDuCaTIon aCCeSSIble To allPolicies should also target individual students and parents, either through institutions or families. For example, PISA shows that, in nearly all countries and economies, students who had attended pre-primary school tend to perform better at the age of 15 than students who had not attended, even after accounting for students’ socio-economic status.
PISA also allows for comparisons of how students’ reports on having attended pre-primary school changed between 2003 and 2012. Fifteen-year-old students in 2012 were more likely than 15-year-olds in 2003 to have attended at least one year of pre-primary education. But the rate of increase in pre-primary enrolment is higher among advantaged students than disadvantaged students, which means that the socio-economic gap between students who had attended pre-primary education and those who had not has widened over time.
Policies targeting disadvantaged students and families can highlight the importance of pre-primary education. It is important to provide information and guidance for parents to increase enrolment in pre-primary education for all children, regardless of their socio-economic status. Governments should ensure that quality pre-primary education is available locally, especially when disadvantaged families are concentrated in certain geographic areas. Governments should also develop fair and efficient mechanisms for subsidising pre-primary education to ease the financial burden on families.
In line with these results, Brazil, Germany, Israel, Mexico and Turkey have already implemented targeted policies to improve the performance of low-achieving schools or students, or have distributed more resources to those regions and schools that need them most. Considering the importance of equity in resource allocation, OECD has launched a new project on this issue (the OECD Review of Policies to Improve the Effectiveness of Resource Use in Schools), and more detailed information on how some high-performing countries allocate resources will be available as of 2015.
enCourage auTonomy In The ConTexT of aCCounTabIlITyIn recent years, many school systems have moved away from a model of purely administrative control towards one where schools become more autonomous organisations, accountable to their users and to the public for outcomes. PISA results show that in higher-performing systems, schools have more autonomy so that they have the incentives and the capacity to improve. In these systems, schools have more responsibility for establishing student disciplinary policies, student assessment policies, approving students for admission to the school, and choosing which textbooks are used and which courses are offered.
A stand-alone policy to grant schools greater autonomy, however, will not, in itself, result in better outcomes. PISA shows that school autonomy is most effective in the context of accountability arrangements and a collaborative culture. In other words, schools with more autonomy tend to perform better than schools with less autonomy when the system as a whole uses such accountability arrangements as setting clear objectives of what students are expected to learn and sharing information about outcomes, and/or when principals and teachers work together to manage schools. Some countries, like Colombia, Korea and Poland have given schools and local authorities more autonomy and have recognised that autonomy works only in the context of collaboration and accountability. Others, like Portugal, have reshaped the organisation of schools to facilitate collaboration and economies of scale among individual schools by creating school clusters. These countries’ approaches to autonomy suggest that it is the combination of various conditions, rather than a single policy in isolation, that is related to better outcomes.
avoID SegregaTIon anD STraTIfICaTIonIn contrast, some features, most notably the prevalence of private schools and competition for students, have no discernible relationship with student performance and the share of top performers. Socio-economically advantaged

B u i l d i n g a n e q u i t a b l e , e x c e l l e n t a n d i n c l u s i ve e d u c a t i o n s y s t e m
104
Chapter 5
© OECD 2014 Equity, ExcEllEncE and inclusivEnEss in Education: Policy lEssons from around thE World
students, who tend to be high achievers, are also more likely to attend private schools and schools that compete for enrolment. Thus, after socio-economic status is accounted for, private schools do not perform better than public schools; and schools that compete with other schools for students do not perform better than schools that don’t compete. Thus, the cross-country analysis suggests that systems, as a whole, do not benefit from a greater prevalence of private schools or school competition.
In fact, school competition is a multi-faceted concept. Principals’ perceptions of school competition are not necessarily the same as that of the parents of students in their schools. More worryingly, in the countries that distributed the PISA parent questionnaire, disadvantaged parents are significantly more likely than advantaged parents to report that “low expenses” and “financial aid” are very important factors to consider when choosing a school. While parents from all backgrounds cite academic achievement as an important consideration when choosing a school for their children, advantaged parents are, on average, nine percentage points more likely than disadvantaged parents to cite this criterion as “very important”. These differences suggest that disadvantaged parents may believe that their choice of schools for their child is limited, due to the cost of some schools. If children from disadvantaged backgrounds cannot attend high-performing schools because of financial constraints, then school systems that offer parents more choice of schools for their children will necessarily be less effective in improving the performance of all students.
PISA 2012 results, like those of earlier PISA assessments, show that, in general, school systems that cater to different students’ needs by separating students into different institutions, grade levels and classes, known as stratification, have not succeeded in producing superior overall results, and in some cases they have lower-than-average and more inequitable performance. For example, cross-country analysis shows that in the systems where more students repeat a grade, the impact of students’ socio-economic status on their performance is stronger. Furthermore, trends analysis shows that stratification is negatively related to systems’ overall performance. Students in schools where no ability grouping is practiced scored eight points higher in mathematics in 2012 compared to their counterparts in 2003, while students in schools where ability grouping is practiced in some or all classes had lower scores in PISA 2012 than their counterparts in PISA 2003.
In highly stratified systems, there may be more incentives for schools to select the best students, and fewer incentives to work with difficult students if there is an option of transferring those students to other schools. In contrast, in comprehensive systems, schools must find ways of working with students from across the performance spectrum. These different incentive systems may help explain the greater level of equity achieved in systems that use stratification less. School systems that continue to differentiate among students in these ways need to create appropriate incentives to ensure that some students are not “discarded” by the system.
Reflecting these results, for example, Poland reformed its education system by delaying the age of selection into different programmes; and schools in Germany are also moving towards reducing the levels of stratification across education programmes.
PISA 2012 results also show that students in more comprehensive systems reported that making an effort in mathematics and learning mathematics is important for their future career. This does not necessarily mean that if stratification policies were changed, students in stratified systems would have better instrumental motivation to learn, since PISA does not measure cause and effect. However, policy makers in highly stratified systems need to consider not only the equity aspect of education outcomes but also non-cognitive outcomes, such as students’ attitudes towards learning.
uSe aSSeSSmenTS anD evaluaTIonS To IDenTIfy STrugglIng STuDenTS anD SChoolSCompared with PISA 2003, more schools are using student assessments to compare the school’s performance to that of other schools or use student assessment data to monitor teacher practice. The scope of evaluations and assessments is not only limited to student assessments; most schools use various forms of evaluations, such as self-evaluations, external school evaluation and teacher appraisals as well. PISA shows that, on average across OECD countries, 92% of students are in schools that use at least a self-evaluation or external evaluation to assure and improve school quality, and 60% of students are in schools that seek written feedback from students regarding lessons, teachers or resources in addition to using self-evaluations and/or external evaluations of the school. PISA results also show that in systems that attain a high level of equity, more schools tend to seek written feedback from students regarding lessons, teachers or resources.
The OECD review on evaluation and assessment in education, Synergies for Better Learning: An International Perspectives on Evaluation and Assessment (OECD, 2013), emphasises the importance of engaging all staff and students in school self-evaluations and using student feedback to teachers for formative purposes. Some countries engage students in school
B u i l d i n g a n e q u i t a b l e , e x c e l l e n t a n d i n c l u s i ve e d u c a t i o n s y s t e m
105
Chapter 5
Equity, ExcEllEncE and inclusivEnEss in Education: Policy lEssons from around thE World © OECD 2014
evaluations by establishing student councils or conducting student surveys in schools. In order to use the feedback from students effectively, school staff may need assistance in interpreting the evaluation information and translating it into action. Trust among school staff and students, and strong commitment from the school community, is key to making this practice work.
What these findings tell policy makers is that while there are several features that are shared among high-performing systems, among systems with greater equity, or among high-performing schools, no one policy or practice spells success. What is important is a cohesive and systematic approach, as education policies and practices, resources invested in education, the learning environment, socio-economic status, demographics and education outcomes are all interrelated. In addition, school systems change over time, intentionally or unintentionally, in response to external changes. Thus, continuous and strategic efforts to improve school systems are required. These efforts need to anticipate challenges (e.g. demographic changes) and provide guidance for coherent policies and programmes to be implemented at different levels of education. And they need to be flexible enough to allow for revisions and to be adapted to local contexts.

B u i l d i n g a n e q u i t a b l e , e x c e l l e n t a n d i n c l u s i ve e d u c a t i o n s y s t e m
106
Chapter 5
© OECD 2014 Equity, ExcEllEncE and inclusivEnEss in Education: Policy lEssons from around thE World
reference
OECD (2013), Synergies for Better Learning: An International Perspective on Evaluation and Assessment, OECD Reviews of Evaluation and Assessment in Education, OECD Publishing, http://dx.doi.org/10.1787/9789264190658-en.
The statistical data for Israel are supplied by and under the responsibility of the relevant Israeli authorities. The use of such data by the OECD is without prejudice to the status of the Golan Heights, East Jerusalem and Israeli settlements in the West Bank under the terms of international law.
oecd PuBlishinG, 2, rue André-Pascal, 75775 PAris cedeX 16
ORGANISATION FOR ECONOMIC CO-OPERATIONAND DEVELOPMENT
the oecd is a unique forum where governments work together to address the economic, social and environmental challenges of globalisation. the oecd is also at the forefront of efforts to understand and to help governments respond to new developments and concerns, such as corporate governance, the information economy and the challenges of an ageing population. the organisation provides a setting where governments can compare policy experiences, seek answers to common problems, identify good practice and work to co-ordinate domestic and international policies.
the oecd member countries are: Australia, Austria, Belgium, canada, chile, the czech republic, denmark, estonia, finland, france, Germany, Greece, hungary, iceland, ireland, israel, italy, Japan, Korea, luxembourg, mexico, the netherlands, new Zealand, norway, Poland, Portugal, the slovak republic, slovenia, spain, sweden, switzerland, turkey, the united Kingdom and the united states. the european commission takes part in the work of the oecd.
oecd Publishing disseminates widely the results of the organisation’s statistics gathering and research on economic, social and environmental issues, as well as the conventions, guidelines and standards agreed by its members.

2014
Equity, Excellence and Inclusiveness in Education Policy lessons from Around the World
excellence in education without equity risks leading to large economic and social disparities; equity in education at the expense of quality is a meaningless aspiration. the most advanced education systems now set ambitious goals for all students, focusing on both excellence and equity. they also equip their teachers with the pedagogic skills that have been proven effective and with enough autonomy so that teachers can use their own creativity in determining the content and instruction they provide to their individual students.
this report provides the background to the 2014 international summit on the teaching Profession and offers examples, from school systems around the world, of how schools with the greatest need attract and retain high-quality teachers, how equity is ensured in devolved education systems, and the kinds of learning environments that elicit the best work from all students.
Contents
chapter 1. charting a way towards equity and excellence
chapter 2. developing high-quality teachers for the schools with the greatest need
chapter 3. Achieving equity in increasingly devolved education systems
chapter 4. creating learning environments that address the needs of all children
chapter 5. Building an equitable, excellent and inclusive education system


