72
Investor Briefing & Q3 2015 Performance Oct 2015
| Date post: | 21-Feb-2017 |
| Category: |
Investor Relations |
| Upload: | red-fox-communications |
| View: | 145 times |
| Download: | 1 times |

Investor Briefing &
Q3 2015 Performance
Oct 2015

2
Economic Overview

3
§ After experiencing an upward pressure since the start of the year and peaking in mid September, the exchange rate (KES against
the US Dollar) appears to have stabilized at levels averaging 102-103
§ The Kenya Shilling depreciation was mainly a reflection of:
- A strong US Dollar as a result of the recovery of the US economy
- An elevated but seasonal demand for foreign exchange from the local corporate sector
- Repatriation of dividends by foreign investors
- Falling revenues from tourism, tea and horticulture
- Massive capital investments in infrastructure
Foreign Exchange Rate - Kenya
May-15Feb-150
Mar-15
102
Apr-15Jan-15 08-Sep-15
94
98
106
104
108
Aug-15
96
100
92
Jun-15 Jul-15 23-Oct-1530-Sep-15
105.3
12.5%
102.0
91.4
94.6
97.8
92.3
98.6
106.2
102.5
90.7
103.9
KES / USD
FX Movement over the last 9 month

4
USD vs. USH,TSH, RWF, KSH
KES vs East African Currencies
35.335.035.233.333.3
31.231.632.131.731.230.6
21.720.520.620.620.0
21.321.020.020.119.519.2
7.37.07.06.87.37.07.37.57.57.57.6
0.0
5.0
10.0
15.0
20.0
25.0
30.0
35.0
40.0
Aug-15Apr-15 Jul-15May-15Mar-15 Jun-15Jan-151st Jan 15 Feb-15
-4%
+13%
+15%
KES / RWF
KES / TSHS
KES / USHS
21-Oct-15Sep-15
§ Although the KES has witnessed an upward pressure against the USD over the last few
months, it has strengthened against some of the regional currencies

55
Months of Import Cover - Kenya
4.14.04.14.4
4.74.64.34.34.3
4.14.14.23.9
4.1
0.0
0.5
1.0
1.5
2.0
2.5
3.0
3.5
4.0
4.5
5.0
22th Oct-15
16th
Oct-15Q3 15Q2 15Q1 15Q4 14Q3 14Q2 14Q1 14Q4 13Q3 13Q2 13Q1 13Q3 12
Monthly Average
Desired MinimumMonths of Import Cover
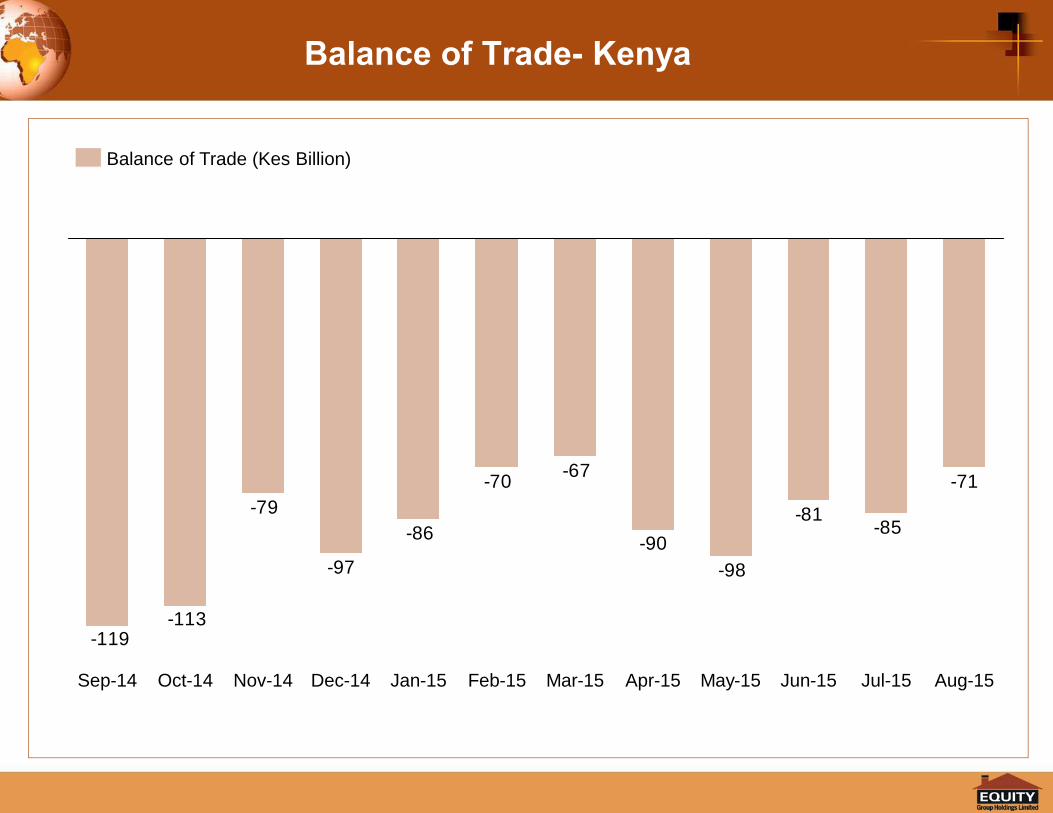
6
Balance of Trade- Kenya
-71
-85-81
-98-90
-67-70
-86
-97
-79
-113-119
Jul-15Nov-14 Feb-15Dec-14 Jan-15 Jun-15 Aug-15May-15Mar-15 Apr-15Oct-14Sep-14
Balance of Trade (Kes Billion)
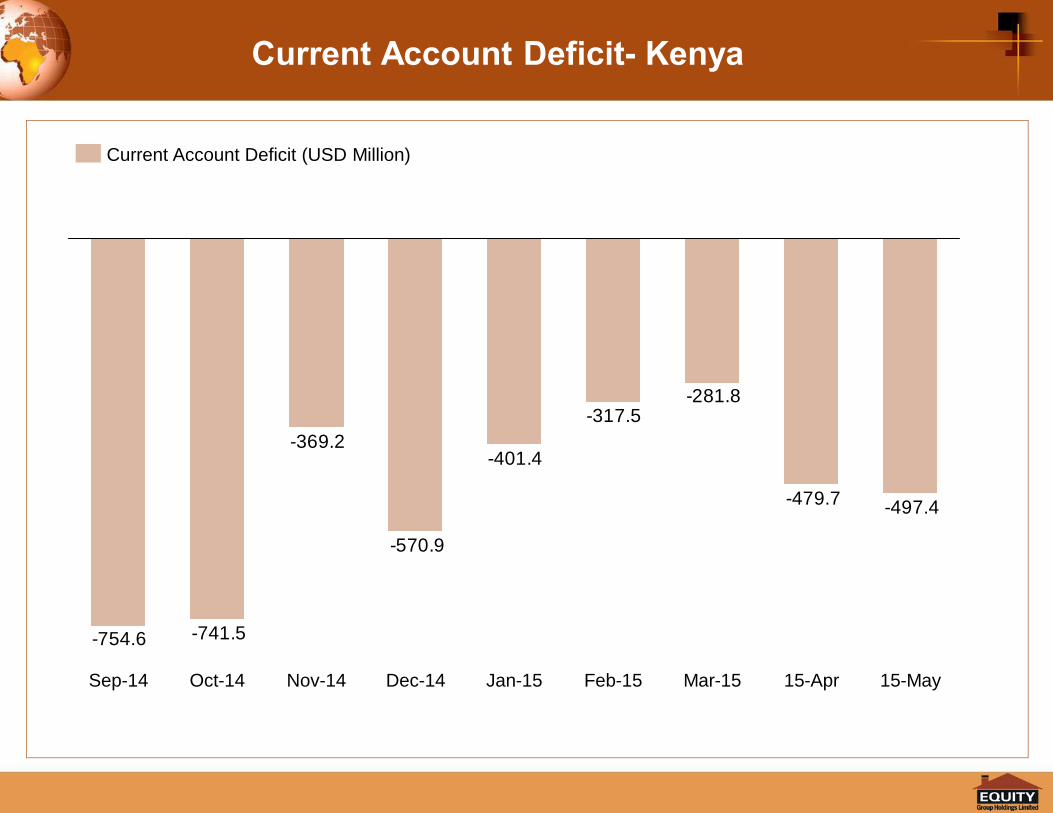
7
Current Account Deficit- Kenya
-497.4-479.7
-281.8-317.5
-401.4
-570.9
-369.2
-741.5-754.6
Dec-14 Feb-15Jan-15 15-May15-AprMar-15Nov-14Sep-14 Oct-14
Current Account Deficit (USD Million)

8
Political and Economic review in the regionThere has been an increasing trend in interest rates over the last 6 months peaking in September and
October 2015
Interest Rates Tend - Kenya
91 Days T. Bill
182 Days T. Bill
364 Days T. Bill
Interbank rate
Jan Feb JuneMar Apr May
8.6% 8.6% 8.5% 8.4% 8.3% 8.3% 11.3% 11.5% 18.6% 22.6%
7.1% 6.8% 6.9% 8.8% 11.8% 11.8% 12.9% 18.8% 19.8% 25.8%
10.2% 10.4% 10.4% 10.3% 10.4% 10.6% 12.2% 12.4% 14.6% 21.6%
10.7% 11.0% 10.7% 10.6% 10.7% 11.0% 12.5% 13.8% 16.3% 21.5%
Jul Aug SepSep-Oct
Peak
9
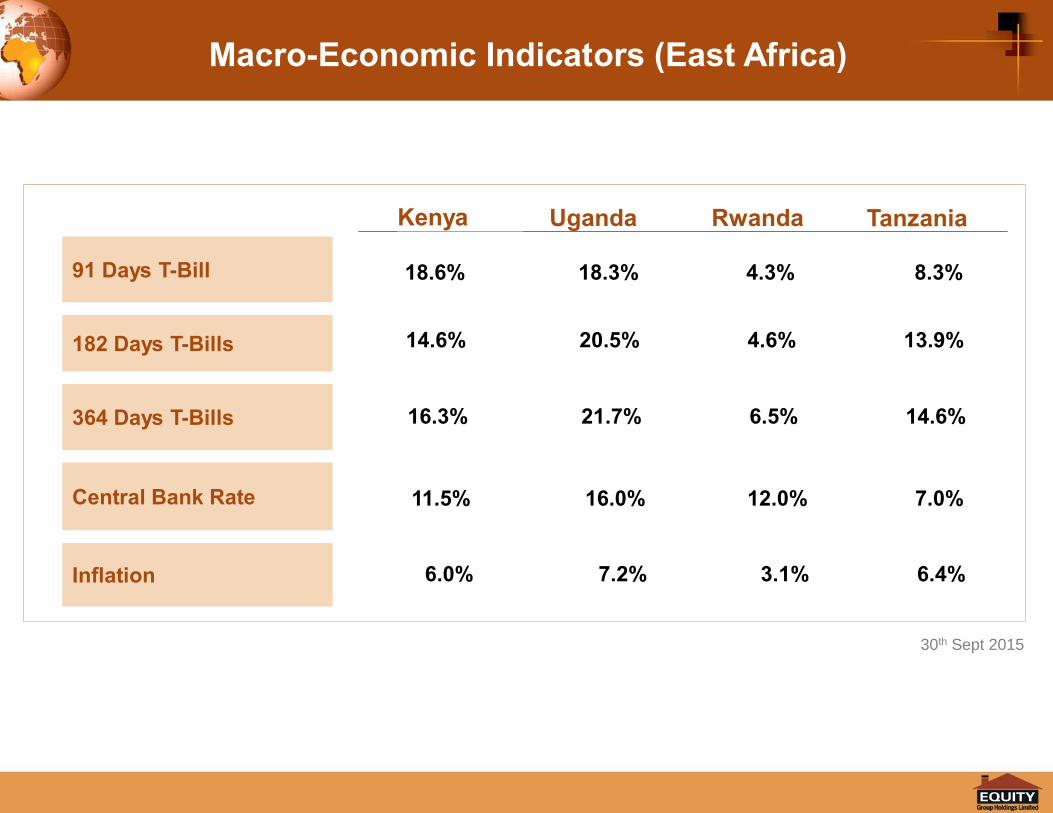
Macro-Economic Indicators (East Africa)
182 Days T-Bills
364 Days T-Bills
Central Bank Rate
91 Days T-Bill
Uganda Rwanda Tanzania
14.6% 20.5% 4.6% 13.9%
18.6% 18.3% 4.3% 8.3%
16.3% 21.7% 6.5% 14.6%
11.5% 16.0% 12.0% 7.0%
Inflation 6.0% 7.2% 3.1% 6.4%
Kenya
30th Sept 2015
10
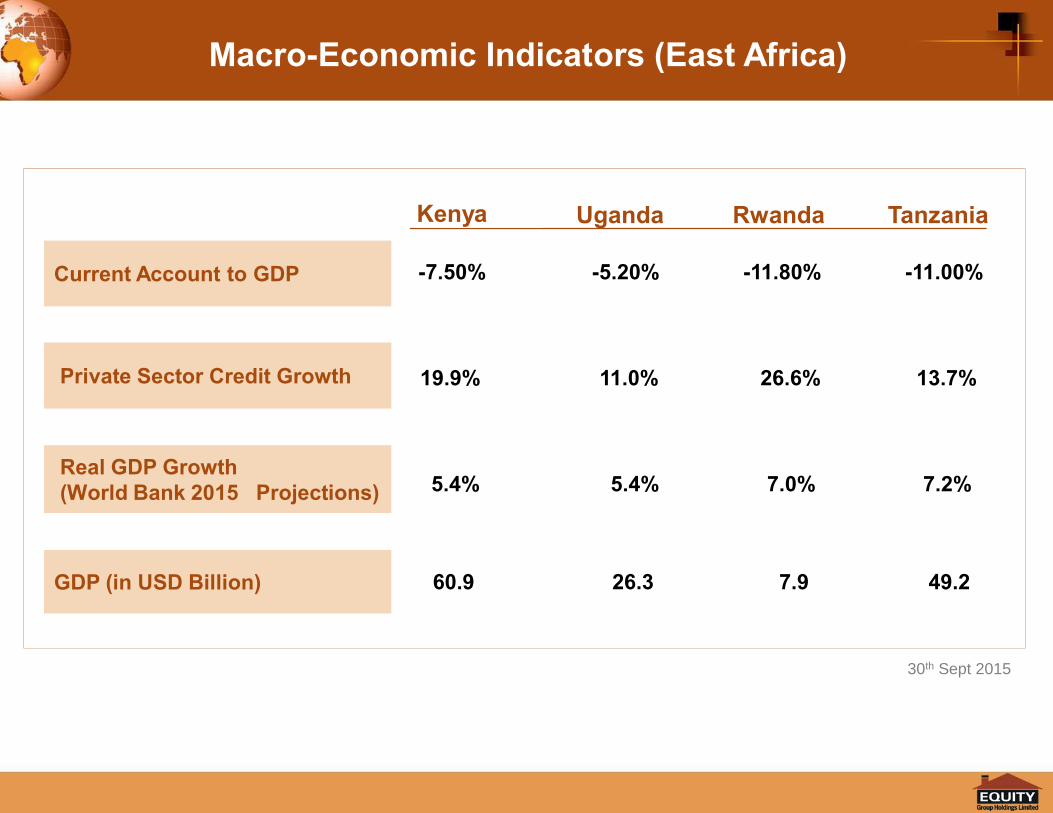
Macro-Economic Indicators (East Africa)
Private Sector Credit Growth
Real GDP Growth(World Bank 2015 Projections)
Current Account to GDP
Uganda Rwanda Tanzania
-7.50% -5.20% -11.80% -11.00%
19.9% 11.0% 26.6% 13.7%
5.4% 5.4% 7.0% 7.2%
GDP (in USD Billion) 60.9 26.3 7.9 49.2
Kenya
30th Sept 2015

11
GDP Growth - East Africa
6
9
10
7
5
0
4
8
5.7%
5.3%
4.6%
Uganda
Tanzania
5.4% KenyaDRC
6.1%
Rwanda7.5%
2015E
7.0%
5.8%
2014
9.0%
4.5%
7.0%
2013
8.5%
4.7%
3.3%
7.3%
2012
7.2%
8.8%
4.4%
5.1%
2011
6.9%
7.9%
9.7%
7.9

12
Debt to GDP Trend (East Africa)
In Percent
50
4544
4748
3533
3129
27 2829
2424
23
18
24
13
6
424040
44
37
2023
0
5
10
15
20
25
30
35
40
45
50
2011 2012 2013 2014 2015
20 19South Sudan
Rwanda
Uganda
Kenya
DRC
Tanzania
South Sudan became independent in 2011. Independent Economic environment started in 2012
*
*

13
Update on Strategic Initiatives

14
SME Strategy
Solid ICT Infrastructure Supporting our Business
Merchant Business & Payment Processing
Iconic and social brand
with significant impact
Progress in key execution priorities
§ 20% increase in Diaspora remittances commissions
§ 59% increase in Merchant commissions
§ 105 Million Mobile Banking transactions done since start of year.
§ 36.2% increase in Agent transactions
Innovative Delivery Channels
§ Mobile Banking§ Agency
§ SME’s now account for 70.7% of the loan book§ FX income growth of
64%§ Current accounts
34% of deposits
Regional subsidiaries§ Loans grew by 103%§ Deposits grew by
93%§ Assets grew by 94%§ PBT grew by 102%
Diaspora Remittances8
6
4
Brand & Foundation 7
5
Regional Expansion & Diversification
3
2
Growth in investment in ICT leading to growth in ICT expenses
Equity Group Holdings Limited
(Governance & Leadership structure)
Completed restructuring &
staffed
1

15
Strong Governance & Leadership Structure
Group Board
CEO
Banking Subsidiaries*
Equity Bank Rwanda
Equity Bank Tanzania
Equity Bank Uganda
Equity DRC (Pro Credit Bank)
Equity Bank Kenya
Director Strategy & Company Secretary
Director Strategic Partnerships & Programme Mgt
Group Internal Auditor
CEO’s office
Corporate Office
Director, HR & Admin
Chief Risk and Compliance Officer
Chief Operating Officer
Director, Corporate & SME Banking
Chief Marketing Officer
Chief Technology & Information Officer
Director, Group Treasury
Subsidiary Boards
* Each subsidiary with own Board of Directors compliant with local regulations
Non-Banking Subsidiaries
Consulting
Equity Insurance Agency
Equity Investment Bank
Equity Group Foundation
Infrastructure Services
Shareholders
Subsidiary Boards
Director, Group Finance
1
Director Brand, Culture and Communications
Equity Bank South Sudan
Chief Finance, Innovation & Payments Officer

16
IT investment and impact on P&LFocusing Leveraging on mobility, digitization and rapid growth of social media2
14.9
+35%
7.1
8.1
Q3 2012
Q3 2013
11.0
+15%
Q3 2014
+35%
Q3 2015
KES “Billion”
IT Spend over time
+43%
2.6
Q32014
Q32015
1.8
IT Expense (P&L) Investment
• MVNO capability expansion, channel security , EGF capabilities Equity world , healthcare system, education content, agricultural programmes and more.
• Enterprise service bus (BPM / BAM / SOA and security) , rich API capabilities for corporate customers and partners.
• Investment in rich user experience for Mobile and e-Banking due for release Q4 and Q1 2016 respectively
• Digitisation and process automation enabling streamlined efficient paperless processes. Analytical capabilities, AML, Risk Analytics, planning and performance management
• PCI-DSS compliant platform that is solidified in payment switch upgrade. E Commerce payment platform implementation
• Investments in enabling expertise, learning and knowledge acquisition
• MSSP, extension of data centre capacity to cater for growth, comprehensive BCP capability, high availability on 99.97% uptime SLA. Moving to outsourced multitenancy cloud model
17
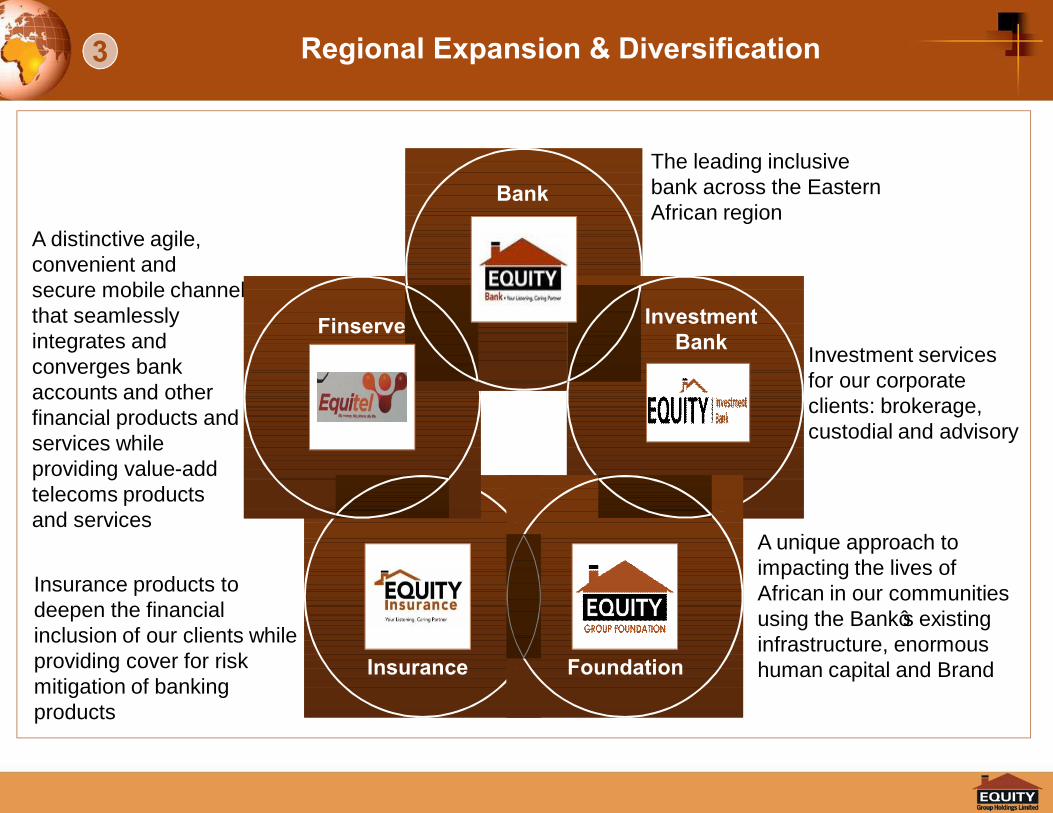
Regional Expansion & Diversification
Insurance
Investment Bank
Foundation
Finserve
Bank
A distinctive agile, convenient and secure mobile channel that seamlessly integrates and converges bank accounts and other financial products and services while providing value-add telecoms products and services
Insurance products to deepen the financial inclusion of our clients while providing cover for risk mitigation of banking products
A unique approach to impacting the lives of African in our communities using the Bank’s existing infrastructure, enormous human capital and Brand
Investment services for our corporate clients: brokerage, custodial and advisory
The leading inclusive bank across the Eastern African region
3

18
Regional Expansion - key delivery under Equity 3.0 3
§ Equity 3.0 is a comprehensive 10 year plan to transform Equity Group Holdings Ltd (EGHL) into a diversifiedregional financial services providers in Africa. EGHL’s overarching objective is to grow its member base to over 100million customers, in 15 countries across the continent.
Rwanda
Kenya
Tanzania
Uganda
South Sudan
DRC

19
KES “Billion”
Tanzania Rwanda S. Sudan
Deposits
Loan
Growth
Growth
AssetsGrowth
PBTGrowth
Regional & Non-banking
Total
15.39
60%
15.63
105%
21.79
73%
0.27137%
9.26
1%
8.24
58%
13.57
16%
0.32463%
11.11
18%
7.07
11%
16.21
22%
0.21
92%
43.98
93%
3.42
-20%
54.22
81%
0.70
23%
98.44
93%
47.71
103%
130.75
94%
2.47102%
Regional & Non-Banking Expansion – Key Metrics3
Kenya
222.0
215.7
18%
321.1
13%
15.99%
Regional & Non-banking Contribution
Q3 2015
31%
18%
29%
14%
15%
Regional & Non-banking Contribution
Q3 2014
21%
11%
20%
8%
DRC
18.70
23%
13.34
78%
24.96
27%
0.44
36%
EIA EIB
0.43 0.1026% 255%
Uganda

20
Assets and PBT contribution by countries3
3.8% 3.6%
3.3% 3.0%Rwanda
Q3 2015
100.0%
71.1%
12.0%
5.5%
4.8%
Q3 2014
100.0%
80.8%
8.5%
Kenya
S. Sudan
DRCTanzania
Uganda
0.0%3.6%
Total Assets split by Country PBT split by Country
2.5%
1.5%
0.7%1.2%
0.7% 1.8%
100.0%
94.5%
3.7%
0.0%
DRC
Kenya
S. Sudan
0.4%
TanzaniaUgandaRwanda
Q3 2015
100.0%
89.1%
3.9%
Q3 2014
Graphs depict Banking entities only

21
Equitel uptake has soared with 162% growth in 10 months 4
300
1,300
900
1,400
1,200
1,000
400
100
1,200
300
600
700
1,100
200
900
500
0
400
600
700
800
0
200
1,000
500
1,100
1,300
800
100
1,400
23rd Oct2015
Sep2015
Apr2015
+162%
Jul2015
Feb2015
505
Jan2015
1,322
581666
788
1,166
1,024
1,253
Jun2015
902
May2015
1,085
Aug2015
Mar2015
SIM uptakeLinkage to M-Banking
81%
76%78%
83%
85%
Count “000” Count “000”
87% 85%86%
87%88%

22
Loan Disbursements through Mobile Banking- Analytics used for credit decisions 4
5.4
4.6
3.8
2.92.4
1.91.6
1.31.00.8
23rd Oct2015
+21%+22%
Feb2015
Jun2015
+31%
Mar2015
+25%+27%
May2015
Jan2015
+22%
Apr2015
Aug2015
Jul2015
+22%
Sep2015
+25%
+19%
Loan Value Disbursement (KES "Billion")Disbursement Count (number)
225,457 284,284 353,052 430,186 524,418 623,171 718,507 902,113 1,087,022
Cumulative figures
1,268,804
23
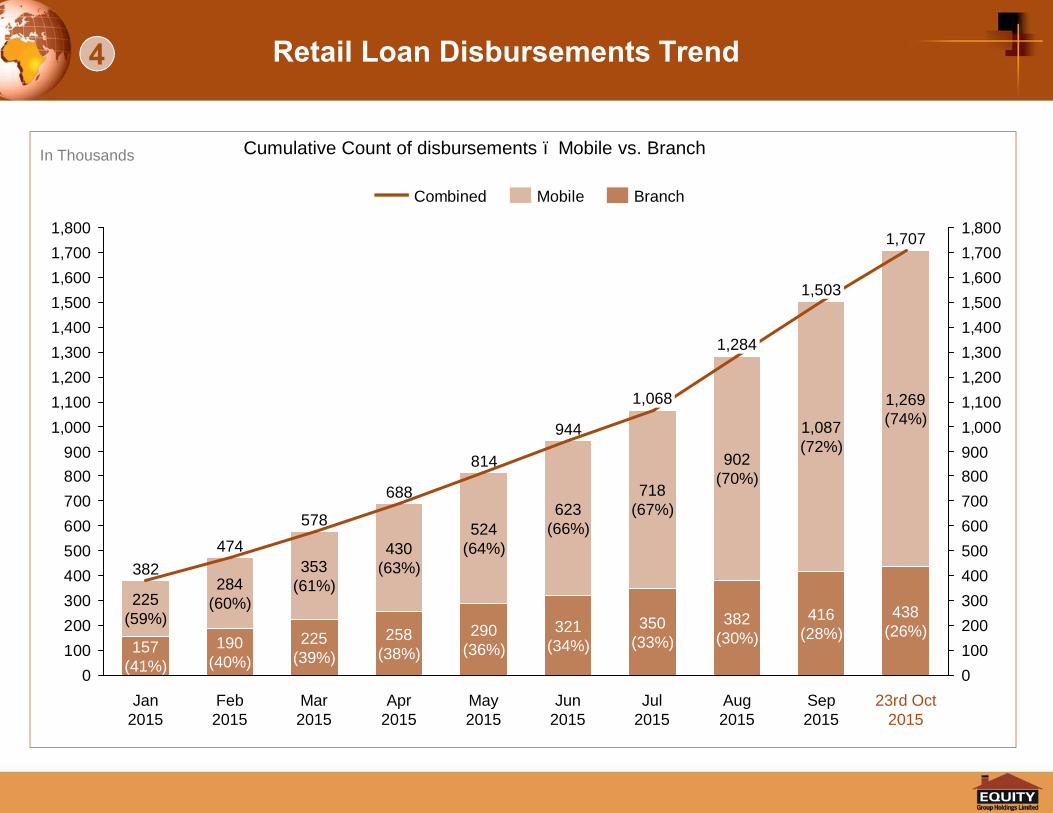
Retail Loan Disbursements Trend4
0100200300400500600700800900
1,0001,1001,2001,3001,4001,5001,6001,7001,800
01002003004005006007008009001,0001,1001,2001,3001,4001,5001,6001,7001,800
225(39%)
353(61%)
Feb2015
474
190(40%)
284(60%)
Jan2015
382
157(41%)
225(59%)
1,707
23rd Oct2015
944
321(34%)
623(66%)
May2015
814
290(36%)
524(64%)
Apr2015
688
258(38%)
430(63%)
Mar2015
578
438(26%)
1,269(74%)
Sep2015
1,503
416(28%)
1,087(72%)
Aug2015
1,284
382(30%)
902(70%)
Jul2015
1,068
350(33%)
718(67%)
Jun2015
MobileCombined Branch
Cumulative Count of disbursements – Mobile vs. BranchIn Thousands

24
M-Banking Transactions & Volume Trend (cumulative)4
22
100
110
120
50
10
0
60
40
60
20
130
30
70
80
40
80
30
110
90
0
70
20
10
100
120
90
50
24.4
35.8
17.210.5
77.7
113.2
23rd Oct2015
105.4
77.6
Jun2015
48.6
94.9
69.5
Sep2015
Jul2015
5.4
Feb2015
11.3
Jan2015
22.5
Aug2015
85.4
Apr2015
58.8
49.5
May2015
Mar2015
63.2
42.3
33.0
Cumulative M-Banking Volumes (billions)Cumulative M-Banking Transactions (millions)

25
Analysis distribution by time of day4
26
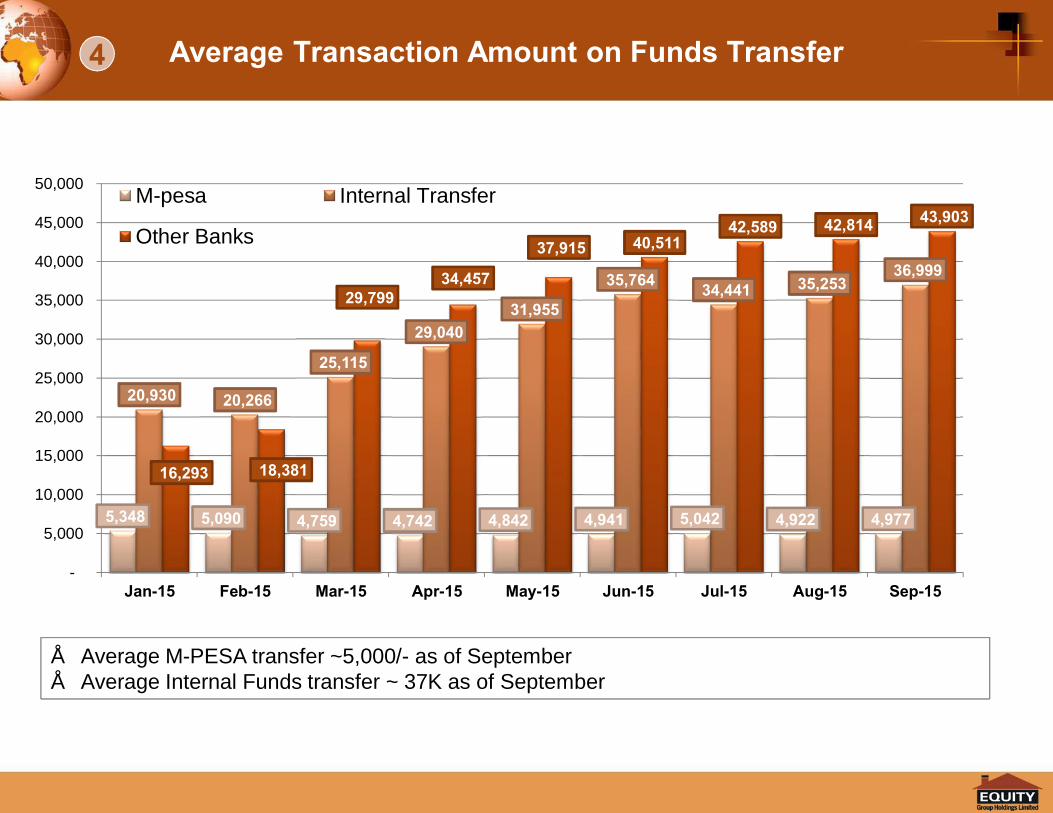
Average Transaction Amount on Funds Transfer4
5,348 5,090 4,759 4,742 4,842 4,941 5,042 4,922 4,977
20,930 20,266
25,115
29,040 31,955
35,764 34,441 35,253 36,999
16,293 18,381
29,799 34,457
37,915 40,511 42,589 42,814 43,903
-
5,000
10,000
15,000
20,000
25,000
30,000
35,000
40,000
45,000
50,000
Jan-15 Feb-15 Mar-15 Apr-15 May-15 Jun-15 Jul-15 Aug-15 Sep-15
M-pesa Internal Transfer
Other Banks
• Average M-PESA transfer ~5,000/- as of September• Average Internal Funds transfer ~ 37K as of September
27
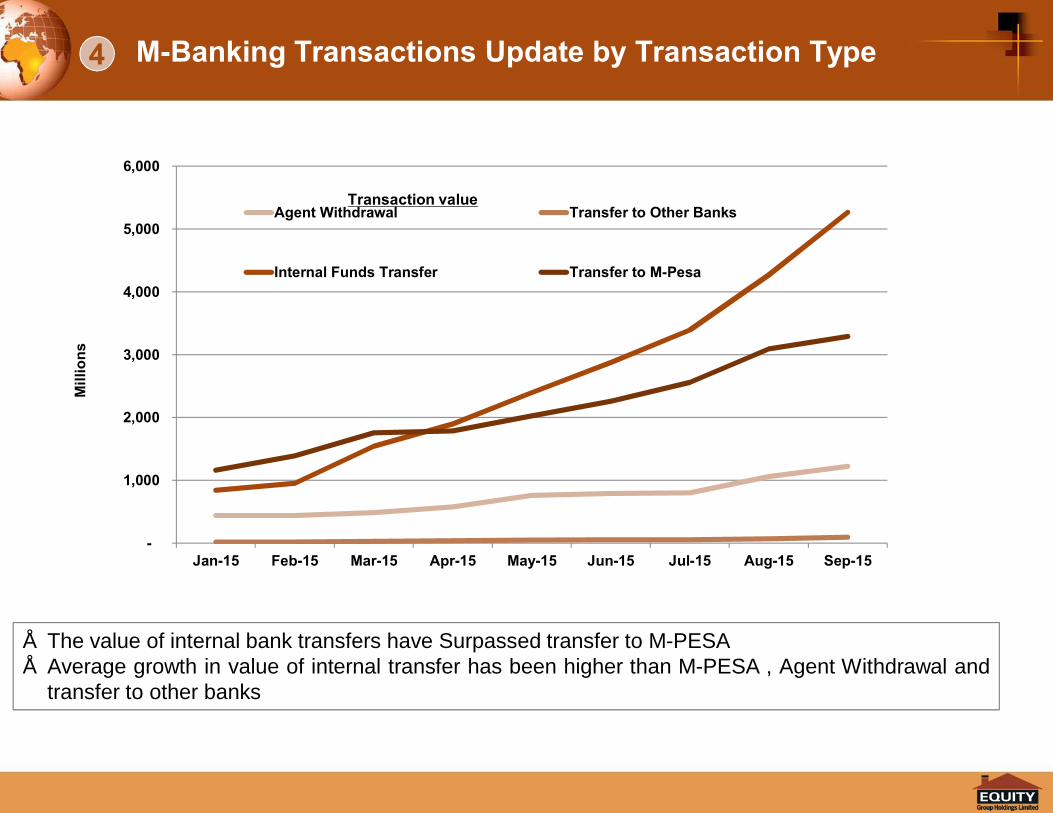
• The value of internal bank transfers have Surpassed transfer to M-PESA• Average growth in value of internal transfer has been higher than M-PESA , Agent Withdrawal and
transfer to other banks
Transaction value
-
1,000
2,000
3,000
4,000
5,000
6,000
Jan-15 Feb-15 Mar-15 Apr-15 May-15 Jun-15 Jul-15 Aug-15 Sep-15
Mill
ions
Agent Withdrawal Transfer to Other Banks
Internal Funds Transfer Transfer to M-Pesa
M-Banking Transactions Update by Transaction Type4

28
28
• Equitel market share has grownsignificantly from 1.9% in Mar to2.4% in June 2015.
• 18% of the total subscriber activatedbetween January and June 2015 wascontributed by Equitel.
Source: Communications Authority of Kenya Q4 Industry Statistics
Safaricom
67.4%
Airtel22.6%
Orange10.0%
December 2014
Total Subscribers33,632,631
Safaricom67.1%
Airtel20.2%
Orange10.8%
Equitel1.9%March 2015
Total
Safaricom67.0%
Airtel19.4%
Orange11.2%
Equitel2.4%
June 2015
Total Subscriber
s
Equitel Market Share4

29
Focus on Variable cost model…
Continuous Growth in Agency Banking4
▪ Number of agents increased to 22,017 agents. 39% growth y/y
… More transactions now processed under 3rd party infrastructure saving on fixed costs
▪ More transactions now processed under 3rd party infrastructure
▪ Agent transactions registered a 36.2% y/y growth 18.3
20.420.021.1
23.1
24.924.625.5
0
5
10
15
20
25
30
35
40
+36.2%
3.0
Q3 2011
13.6
Q3 2012
20.7
Q3 2013
21.524.1
27.3
Q3 2014
37.2
Q3 2015
Transactions (Millions) 9.0
2.0(22.2%)Branch
Sep-15
2.5(27.4%)
4.5(50.4%)Agency
ATM
Agency
ATM
Branch

30
Continuous Growth in Agency Deposits…4
62.8
56.452.2
49.945.2
25.124.222.321.418.5
+8%+5%
+10%
Q2 2015Q1 2015Q4 2014Q3 2014 Q3 2015
+11%
Agency Withdrawal AmountAgency Deposit AmountIn KES Billion
Deposits growing faster than withdrawals hence a “Net Cash-Inflow” position

31
SME contribution to the Loan Book5
46.5%
46.4% 53.1%
8.2%6.8%
6.2%
29.2%24.1% 20.5%
19.5%
100.0% 100.0%
Q3 2013
17.5%
Q3 2014
3.1% 2.7%
12.5%
100.0%
Q3 2015
Consumer
3.5%Agriculture
Large Enterprises
Micro
SME
32
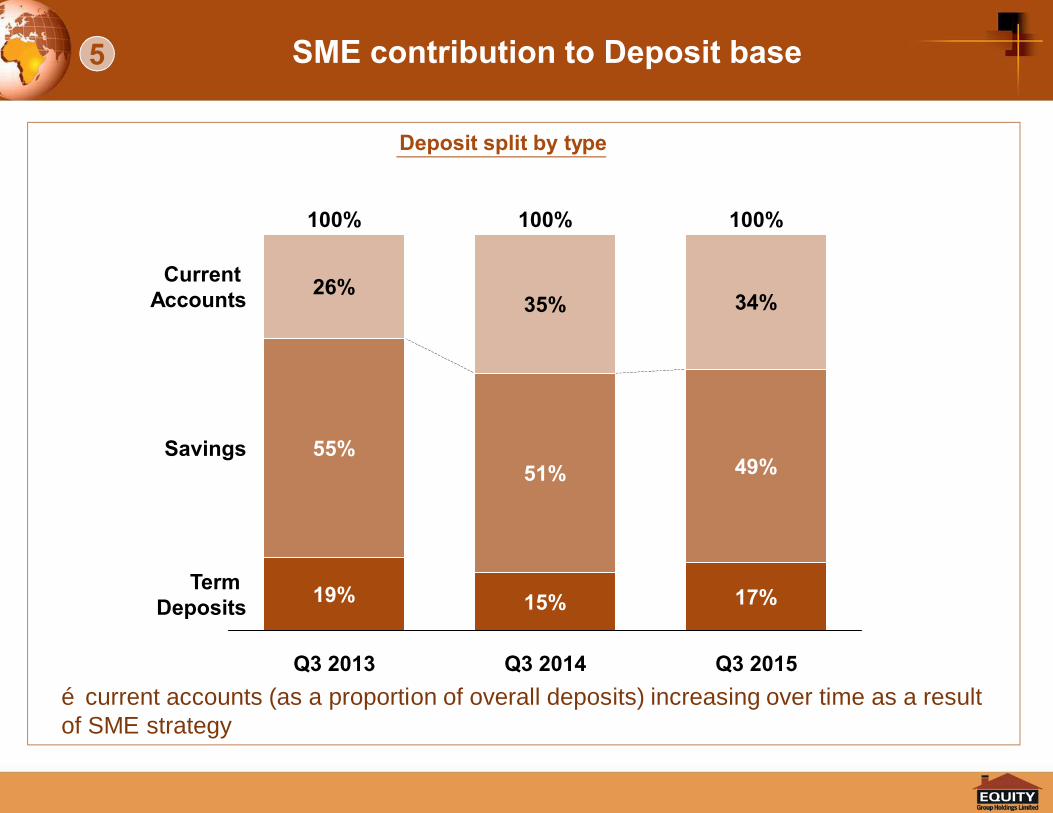
SME contribution to Deposit base5
19%
34%35%
15%
Q3 2014
17%
100%
Q3 2015
100%
Term Deposits
100%
Q3 2013
Current Accounts 26%
49%51%55%Savings
Deposit split by type
…current accounts (as a proportion of overall deposits) increasing over time as a result of SME strategy

33
SME Income Contribution5
+58%
624.5
393.9
Q3 2015Q3 2013 Q3 2014
249.1
+59%
1,375.3
Q3 2013
1,571.4
Q3 2014
2,577.0
Q3 2015
+64%
+14%
Merchant Income Growth FX Income GrowthKES “Million”

34
SME - NPL Trend5
Q3 2015Q3 2014
4.5%
Q3 2013
7.0%
4.4%
SME loans are 100% secured
35
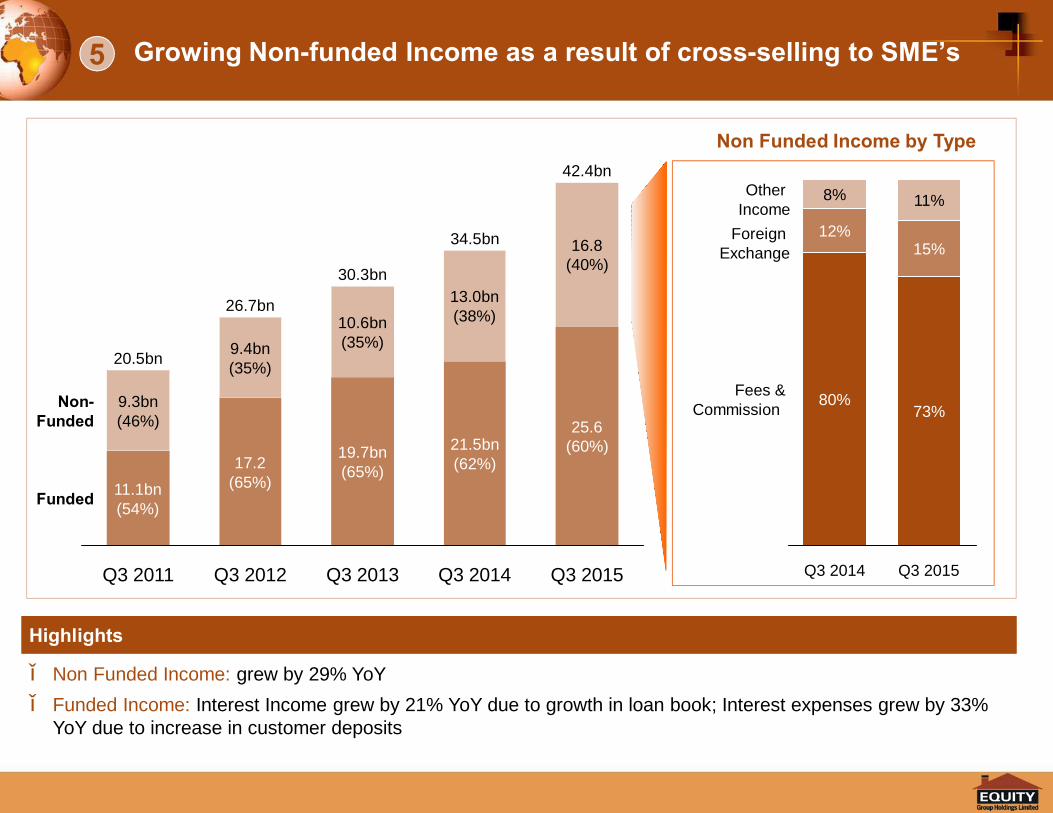
Growing Non-funded Income as a result of cross-selling to SME’s5
Highlights
▪ Non Funded Income: grew by 29% YoY▪ Funded Income: Interest Income grew by 21% YoY due to growth in loan book; Interest expenses grew by 33%
YoY due to increase in customer deposits
19.7bn(65%)
10.6bn(35%)
30.3bn
9.3bn(46%)
16.8(40%)
34.5bn
Q3 2014
Non-Funded 25.6
(60%)
42.4bn
Q3 2015
Funded
17.2(65%)
Q3 2012
26.7bn
Q3 2013
21.5bn(62%)
13.0bn(38%)
9.4bn(35%)
Q3 2011
20.5bn
11.1bn(54%)
Non Funded Income by Type
73%Fees &
Commission
8%
15%
Other Income
Foreign Exchange
11%
Q3 2014
80%
Q3 2015
12%

36
Group net interest margin on an upward trajectory reflecting an increasing interest yield and stabilized cost of funds5
Cost of funds
Net Interest Margin increased between Q2 and Q3…driven by an increase in interest yieldand stable cost of funds
Percentage
Net Interest Margin Yield on interest Earning Assets
10.29.89.9
10.810.9
Q2 ’15 Q3 ’15Q1 ’15Q3 ’14 Q4 ’14
2.52.52.62.52.4
Q2 ’15 Q3 ’15Q1 ’15Q4 ’14Q3 ’14
12.712.312.513.313.3
Q3 15Q2 15Q1 15Q4 ’14Q3 ’14

37
We are building on our momentum in Payment Processing and Merchants…6
We have partnered with key payment companies…
…which has allowed us to grow our number of transactions and commissions
▪ Equity is leading in Acquiring and Issuing
▪ Best in class payment channelservices work well with merchants
26,763
+59%
+61%+59%
+58%
Sep-15Sep-14
394
10,506
249
624
Sep-13
16,661
Merchant CommissionsMerchant Transaction Volumes
KES “Million”
38
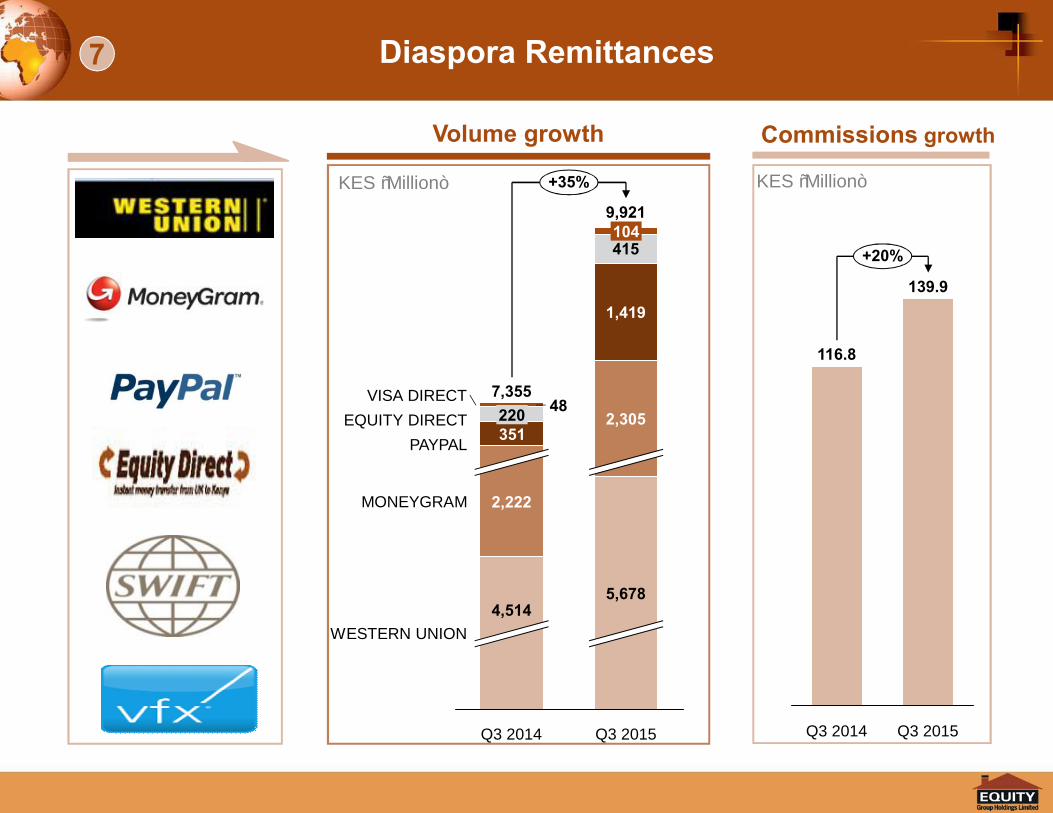
Diaspora Remittances7
351
415
48
5,678
Q3 2014
7,355220
WESTERN UNION
MONEYGRAM
VISA DIRECT
PAYPALEQUITY DIRECT
+35%
4,514
2,222
104
1,419
9,921
Q3 2015
2,305
KES “Million”
139.9
+20%
Q3 2014
116.8
Q3 2015
Commissions growthVolume growth
KES “Million”

39
EGF 7 Programmatic Pillars
Monitoring and evaluation
1
2
4
3
Education and Leadership
Development
Agriculture
Entrepreneurship
Health
Innovation
Financial Inclusion and
Literacy
Environment
7
6
5
▪ Equity Afia
▪ Cash transfers▪ Fanikisha▪ Fanikisha+ (Tanzania)▪ Financial Knowledge for
Africa training programme
▪ Forest restoration▪ Energy program
▪ Wings to Fly Learning▪ Equitel - MY LIFE
▪ Entrepreneurship training program
▪ Transforming smallholder farmers
▪ Accelerating medium size farms
▪ Wings to Fly▪ Equity African Leaders
Programme
8 EGF 7 Programmatic Pillars
40
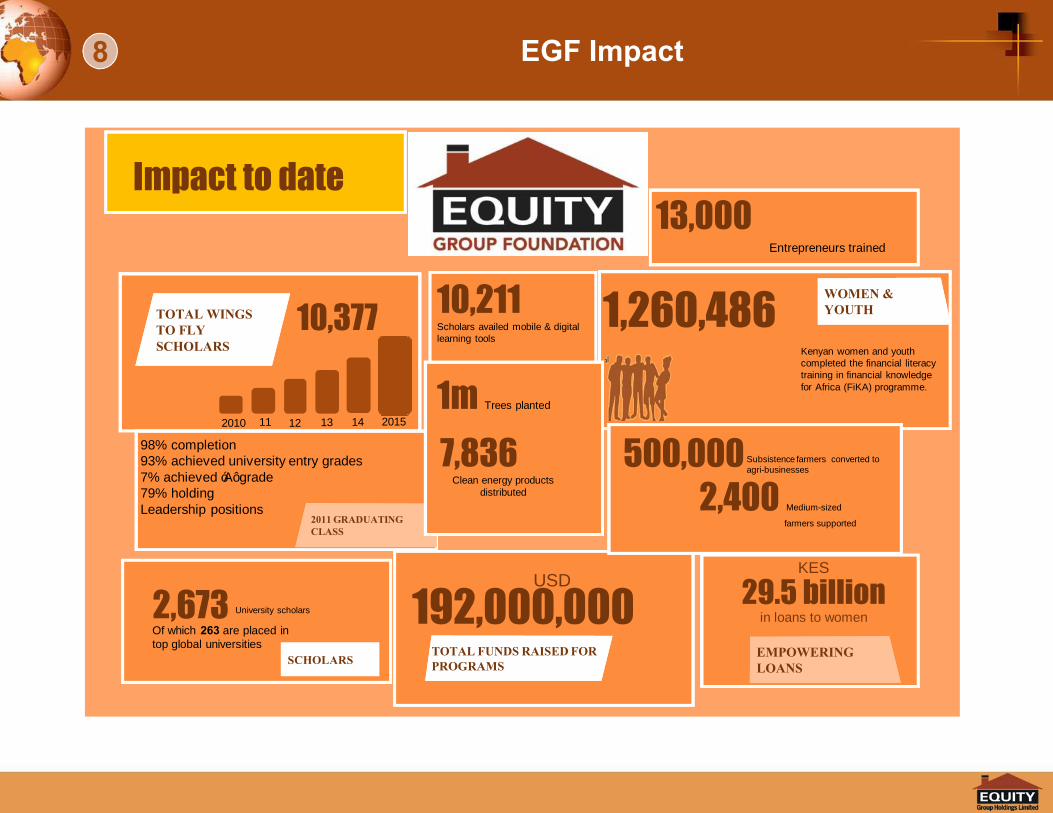
10,377TOTAL WINGS TO FLY SCHOLARS
TOTAL WINGS TO FLY SCHOLARS
13,000Entrepreneurs trained
USD
192,000,000TOTAL FUNDS RAISED FOR PROGRAMSTOTAL FUNDS RAISED FOR PROGRAMS
2,673 University scholars
Of which 263 are placed in top global universities
SCHOLARSSCHOLARS
98% completion93% achieved university entry grades7% achieved ‘A’ grade79% holding Leadership positions
2011 GRADUATING CLASS2011 GRADUATING CLASS
KES
29.5 billion in loans to women
EMPOWERING LOANSEMPOWERING LOANS
1,260,486 Kenyan women and youth completed the financial literacy training in financial knowledge for Africa (FiKA) programme.
WOMEN & YOUTHWOMEN & YOUTH
Impact to date
500,000 Subsistence farmers converted to agri-businesses
2010 11 12 13 14 2015
10,211 Scholars availed mobile & digital learning tools
1m Trees planted
7,836 Clean energy products
distributed 2,400 Medium-sized
farmers supported
8 EGF Impact

41
Qualitative Analysis
42
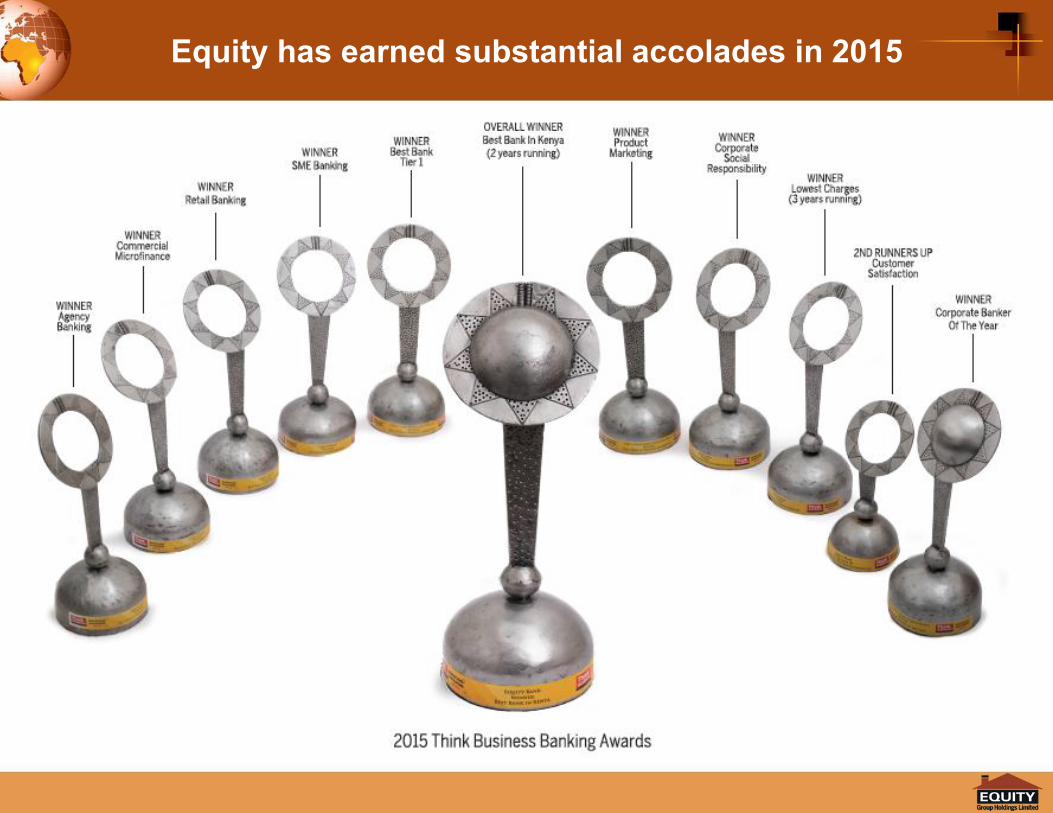
Equity has earned substantial accolades in 2015

43
Equity has earned substantial accolades in 2015

44
Equity has earned substantial accolades in 2015
Equity Bank - Winner2015 Best
Performing Ai40 Company
Dr James Mwangi -Winner
2015 Ai40 CEO of the Year
45
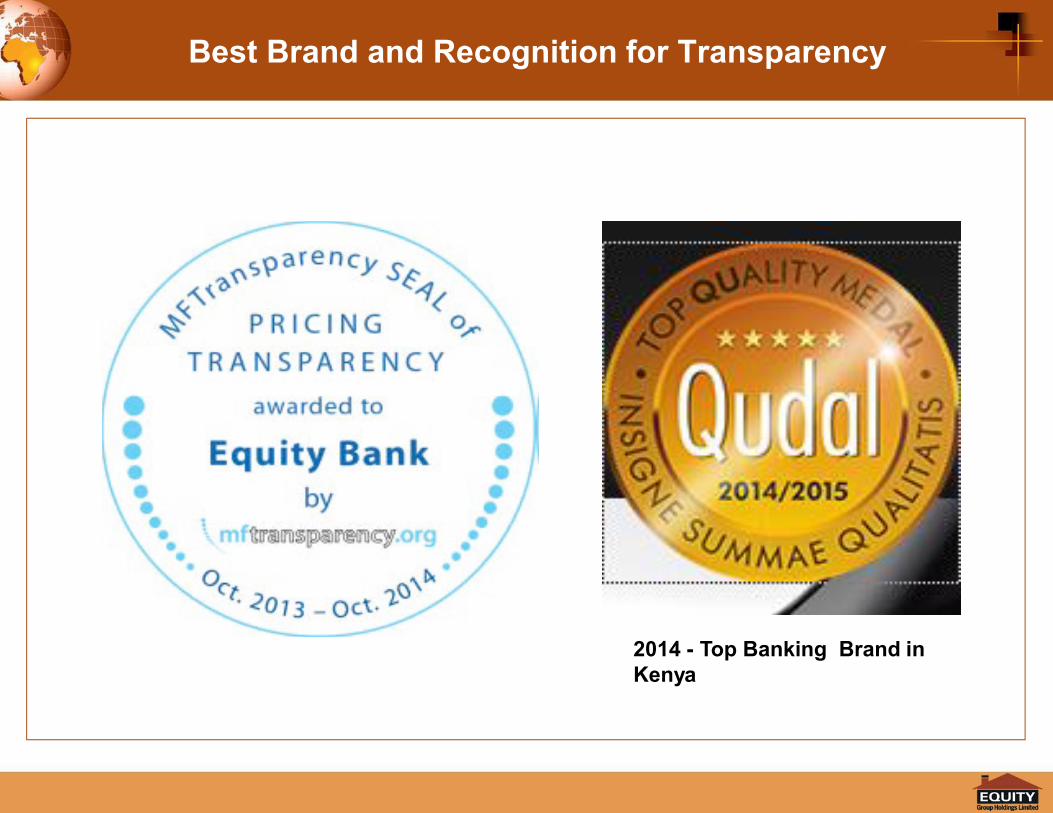
Best Brand and Recognition for Transparency
2014 - Top Banking Brand in Kenya

46
Equity has earned recognition in 2015
Equity’s International Rankings
Equity’s Global Credit Rating
Equity BankOverall Soundness Performance
(Capital Assets Ratio) (Profits on capital) (Return on assets)
2015 Global Rank 916 88 18 8
2014 Global Rank 999 112 8 4

47
Performance of Core Business (Intermediation)

48
44%
25%
70%
30%
Growth per Class
Funding BaseSignificant improvement in funding profile
57.1(17%)
5.1(2%)34.1
(10%)
445.8
48.9(11%)
317.0(71%)
Borrowed Funds
Shareholders’ Funds
243.1(72%)
Q3 2015
71.1(16%)
8.7(2%)
31.3%
339.4
Deposits
Other Liabilities
Q3 2014
In KES “Billion” 31.3% growth in funding with deposits accounting for 71%

49
Customer Deposits Growth
317.0
243.1
192.0
164.6149.7
99.3
0
20
40
60
80
100
120
140
160
180
200
220
240
260
280
300
320
+30%
+51%
+10%
+17%
+27%
Q3 2015
Q3 2014
Q3 2013
Q3 2012
Q3 2011
Q3 2010
Deposit (Kes Billion)
3.8%
3.5%
3.7%
2.9%
5.8%
UgandaRwanda
S. Sudan
Tanzania
Kenya
DRC
Q3 2015
100.0%
69.3%
13.7%
4.8%
Q3 2014
100.0%
79.2%
9.3%
3.9%
0.0%
Deposit split by Country
Q3 2015
40.2%
43.5%
16.3%
Q3 2014
100.0%
40.1%
45.4%
14.5%
Savings
Term Deposits
Current Accounts
100.0%
Deposit split by Type

50
51.5(11.6%)
86.0(19.3%)
+31.3%
32.5(9.6%)
44.9(10.1%)
339.4
Government Securities
206.7(60.9%)
47.4(14.0%)
263.4(59.1%)
Q3 2015Q3 2014
52.8(15.6%)
445.8
Cash & Cash Equivalents
Net Loans
Other Assets63%
9%
38%
27%
Growth per Asset Class
31.3% growth in asset base while still maintaining portfolio diversification
Assets of KSH 446 Billion driven by stable Deposit base
In KES billion
51
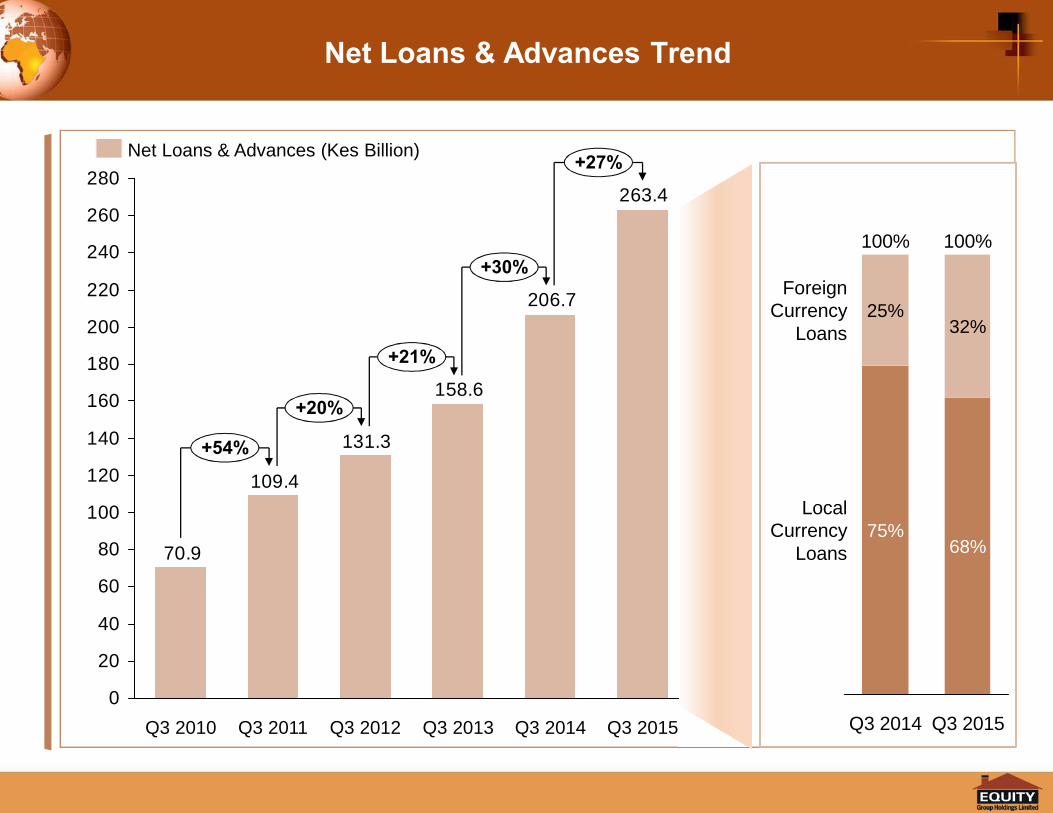
Net Loans & Advances Trend
263.4
206.7
158.6
131.3
109.4
70.9
0
20
40
60
80
100
120
140
160
180
200
220
240
260
280
+20%
Q3 2014Q3 2013 Q3 2015
+30%
+27%
+54%
+21%
Q3 2012Q3 2011Q3 2010
Net Loans & Advances (Kes Billion)
Q3 2014
100% 100%
LocalCurrency
Loans
ForeignCurrency
Loans
Q3 2015
68%
25%
75%
32%

52
Loan book by Segment and Entity
2.5%3.1%
3.0%2.6%
1.6%2.3%S. Sudan
DRC
100.0%
Rwanda0.0%
5.0%
Q3 2015Q3 2014
100.0%
Uganda
5.8%
Tanzania 3.6%
81.9%
88.6%Kenya
Split across the banking entities within the GroupSplit across Segments
46.4% 53.1%
6.8%6.2%
24.1% 20.5%
Micro
100.0%
Consumer
Q3 2015
17.5%
2.7%
Q3 2014
100.0%
19.5%
3.1%
Large Enterprises
SME
Agriculture

53
4.1%4.1%3.9%3.8%4.0%
4.3%4.4%4.3%4.2%4.3%
Q1 2015 Q2 2015Q4 2014Q3 2014 Q3 2015
GroupEBKL
Stable NPL Trend over time

54
64.4%62.5%63.2%64.5%61.2%
56.0%55.4%59.8%
64.4%
51.0%
89.1%86.2%87.0%88.0%
83.5%
Q1’2015Q3’2014 Q4’2014 Q2’2015 Q3’2015
CBK: (Spec. Prov. + Int. Susp) / Gross NPLIFRS: Impairment per IAS39 / Gross NPL(Gen. Prov. + Spec. Prov. + Int. Susp) / Gross NPL
0.63% 0.83% 0.63% 0.61%Cost of Risk: 0.95%
Non-Performing Loans: High Coverage Levels
55
Financial Performance

56
Funding Distribution
Q3 2015
Broad base liabilities & funding sources
Q3 2014 Q3 2015 Growth Y/Y
Liabilities & Capital (Bn) KSH KSH %
Deposits 243.1 317.0 30%
Borrowed Funds 34.1 48.9 44%
Other Liabilities 5.1 8.7 70%
Shareholders’ Funds 57.1 71.1 25%
Total Liabilities & Capital 339.4 445.8 31%
Q3 2014
Borrowed Funds 10%
Shareholders’ Funds
17%
Other Liabilities
Deposits
2%
72%
Other Liabilities
Deposits
11%
2%
71%
Borrowed Funds
16%
Shareholders’ Funds

57
Asset Distribution
Q3 2015Q3 2014
Asset Portfolio & Distribution
Q3 2014 Q3 2015 Growth Y/Y
Assets (bn) KSH KSH %
Net Loans 206.7 263.4 27%
Cash & Cash Equivalents 52.8 86.0 63%
Government Securities 47.4 51.5 9%
Other Assets 32.5 44.9 38%
Total Assets 339.4 445.8 31%
61%Net Loans
14%
Cash & Cash Equivalents
Government Securities
Other Assets
16%
10% 10%
Cash & Cash Equivalents
Government Securities
Other Assets
12%
19% 59% Net Loans

58
Strong Capital Position - EBKL
14.5%
Sep-14 Sep-15
16.6%16.1%
13.0%
14.8%
Sep-14 Sep-15
Total Capital to Risk Weighted AssetsCore Capital to Risk Weighted Assets
10.5%RegulatoryMinimum
RegulatoryMinimum
20.0% 20.5%
Sep-14 Sep-15
Core Capital to Total Deposits
8%RegulatoryMinimum
59
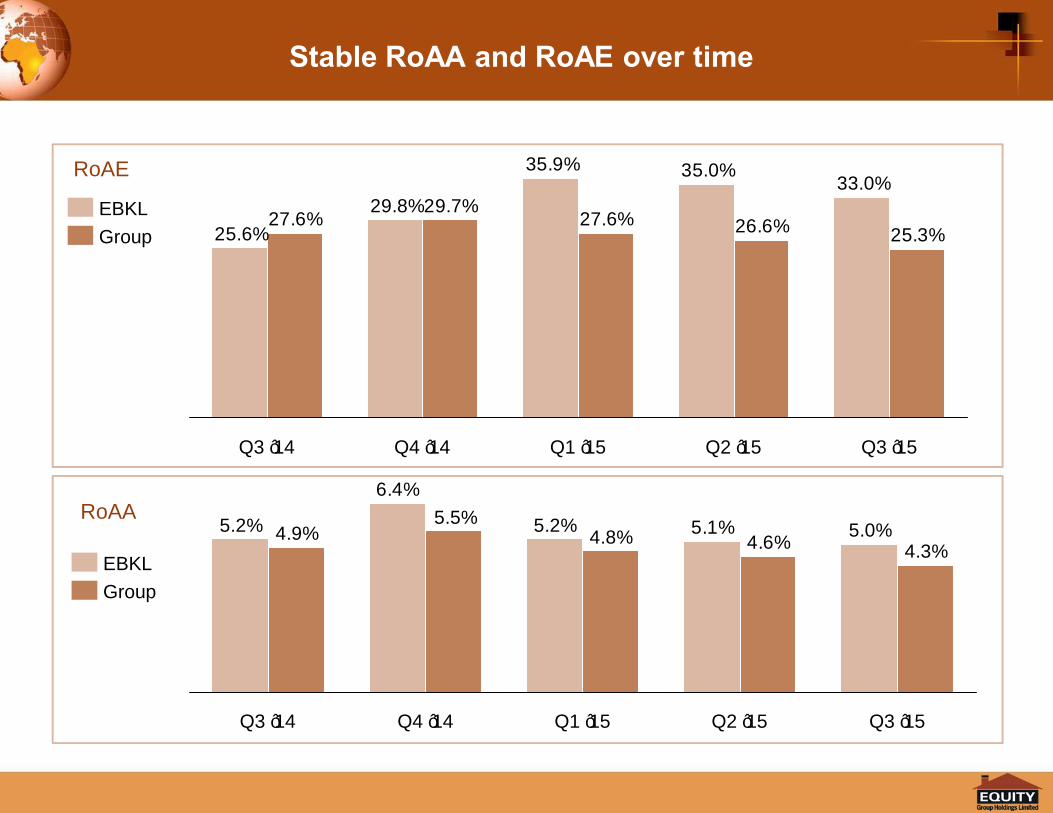
35.0%35.9%
29.8%25.6%
33.0%
26.6%27.6%29.7%
27.6%25.3%
Q1 ’15Q4 ’14 Q2 ’15Q3 ’14 Q3 ’15
EBKLGroup
RoAE
5.0%5.1%5.2%
6.4%
5.2%4.3%4.6%4.8%
5.5%4.9%
Q3 ’15Q3 ’14 Q2 ’15Q1 ’15Q4 ’14
GroupEBKL
RoAA
Stable RoAA and RoAE over time

60
KES (Billion) Q3 2014 Q3 2015 Growth
Interest Income 26.04 31.60 21%
Interest Expense (4.50) (6.00) 33%
Net Interest Income 21.55 25.60 19%
Non-Funded Income 12.99 16.81 29%
Total Income 34.53 42.41 23%
Loan Loss Provision (0.90) (1.70) 89%
Staff Costs (7.77) (8.39) 8%
Other Operating Expenses (10.17) (14.09) 38%
Total Costs (18.84) (24.18) 28%
PBT 15.86 18.14 14%
Tax (4.65) (5.33) 15%
PAT 11.21 12.81 14%
Delivering 14% Growth in PBT for the Group

61
… PBT has grown at ~15% (CAGR)
PBT evolutionCost to Income Ratio EvolutionKES Billion
18.14
15.86
12.6411.79
15%CAGR
Q3 ’15Q3 ’14Q3 ’13Q3 ’12
▪ Total Operating Income up 23% y/y .The growth is mainly attributed to increased diversification of income streams
▪ Operating expenses up 28% y/y due to expansion on IT capacity
The growth in Profit attributed to diversification of revenue streams (non-interest income activities)
53.0%51.9%50.9%50.2%47.4%48.0%46.8%46.9%
Q3 ’12 Q3 ’14Q3 ’13 Q3 ’15
EBKLGroup

62
Positive Financial Ratios
EBKL EBKL Group Group
Q3 2014 Q3 2015 Q3 2014 Q3 2015
Profitability
NIM 11.9% 11.1% 10.9% 10.2%
Cost to Income Ratio (with provisions) 50% 51% 55% 57%
Cost to Income Ratio (without provision) 48% 47% 52% 53%
RoAE 25.6% 33.0% 27.6% 25.3%
RoAA 5.2% 5.0% 4.9% 4.3%
Asset Quality
Cost of Risk 0.49% 0.75% 0.63% 0.95%
Liquidity / Leverage
Loan / Deposit Ratio 94.6% 97.0% 73.0% 83.2%
Capital Adequacy Ratios
Core Capital to Risk Weighted Assets 13.4% 14.8%
Total Capital to Risk Weighted Assets 16.1% 16.6%
Core Capital to Deposits Ratio 20.2% 20.5%
63
Appendix

64
Cost of funds
Kenya - Net Interest Margin
Net Interest Margin increased over the last 2 quarters…
…driven by a increase in yield and a marginal increase in Cost of Funds
Percentage
Net Interest Margin Yield on Interest Earning Assets
11.110.910.9
11.9
Q4 ’14 Q3 ’15Q1 ’15 Q2 ’15
13.913.513.514.3
Q4 ’14 Q2 ’15Q1 ’15 Q3 ’15
2.82.62.62.4
Q4 ’14 Q3 ’15Q2 ’15Q1 ’15

65
Cost of funds
Uganda - Net Interest Margin
… driven by an increase in yield and a decrease in Cost of Funds
Percentage
Net Interest Margin Yield on interest Earning Assets
10.5
9.79.6
10.8
Q3 ’15Q1 ’15Q4 ’14 Q2 ’15
13.713.212.614.3
Q3 15Q2 15Q4 ’14 Q1 15
3.23.53.1
3.5
Q4 ’14 Q3 ’15Q2 ’15Q1 ’15
Net Interest Margin increasing over the last 3 quarters

66
Cost of funds
Tanzania - Net Interest Margin
… driven by a marginal increase in yield and Cost of Funds
Percentage
Net Interest Margin Yield on interest Earning Assets
4.74.74.6
4.3
Q2 ’15Q1 ’15Q4 ’14 Q3 ’15
10.210.010.410.7
Q3 15Q2 15Q1 15Q4 ’14
5.55.45.76.4
Q4 ’14 Q3 ’15Q2 ’15Q1 ’15
Net Interest Margin has been stable over the last 2 quarters
67
Cost of funds
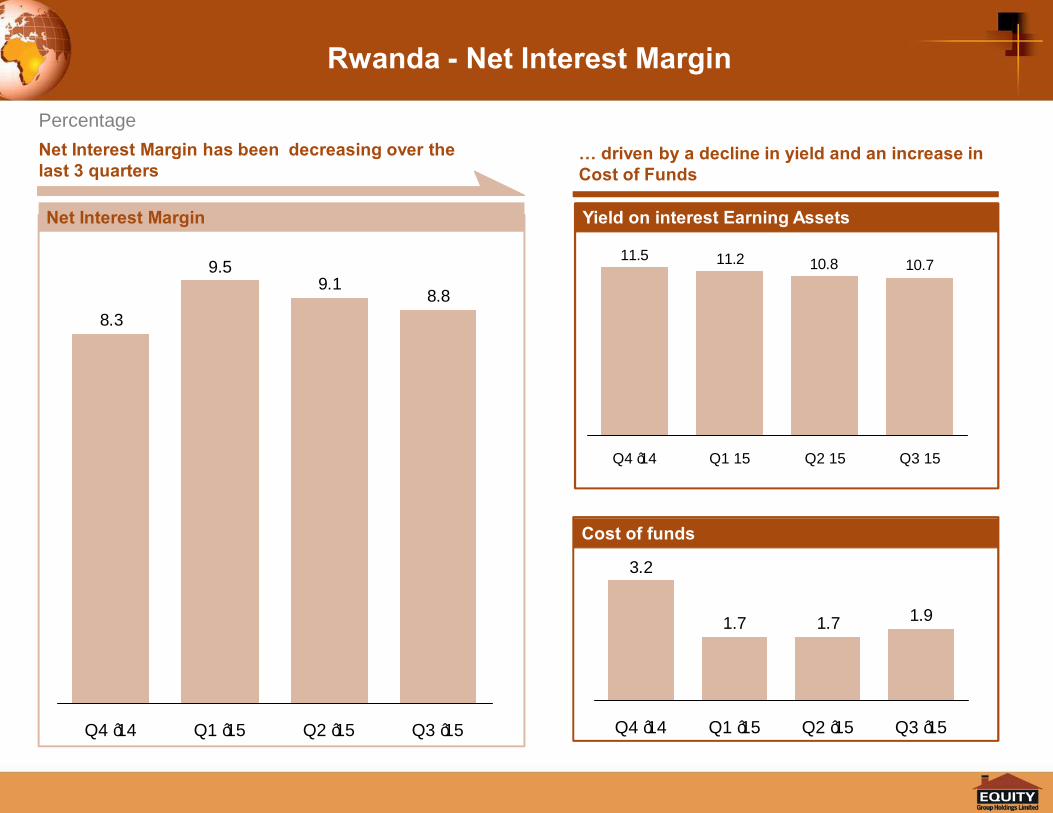
Rwanda - Net Interest Margin
… driven by a decline in yield and an increase in Cost of Funds
Percentage
Net Interest Margin Yield on interest Earning Assets
8.89.1
9.5
8.3
Q2 ’15Q1 ’15Q4 ’14 Q3 ’15
10.710.811.211.5
Q2 15Q1 15Q4 ’14 Q3 15
1.91.71.7
3.2
Q4 ’14 Q3 ’15Q2 ’15Q1 ’15
Net Interest Margin has been decreasing over the last 3 quarters
68
Cost of funds
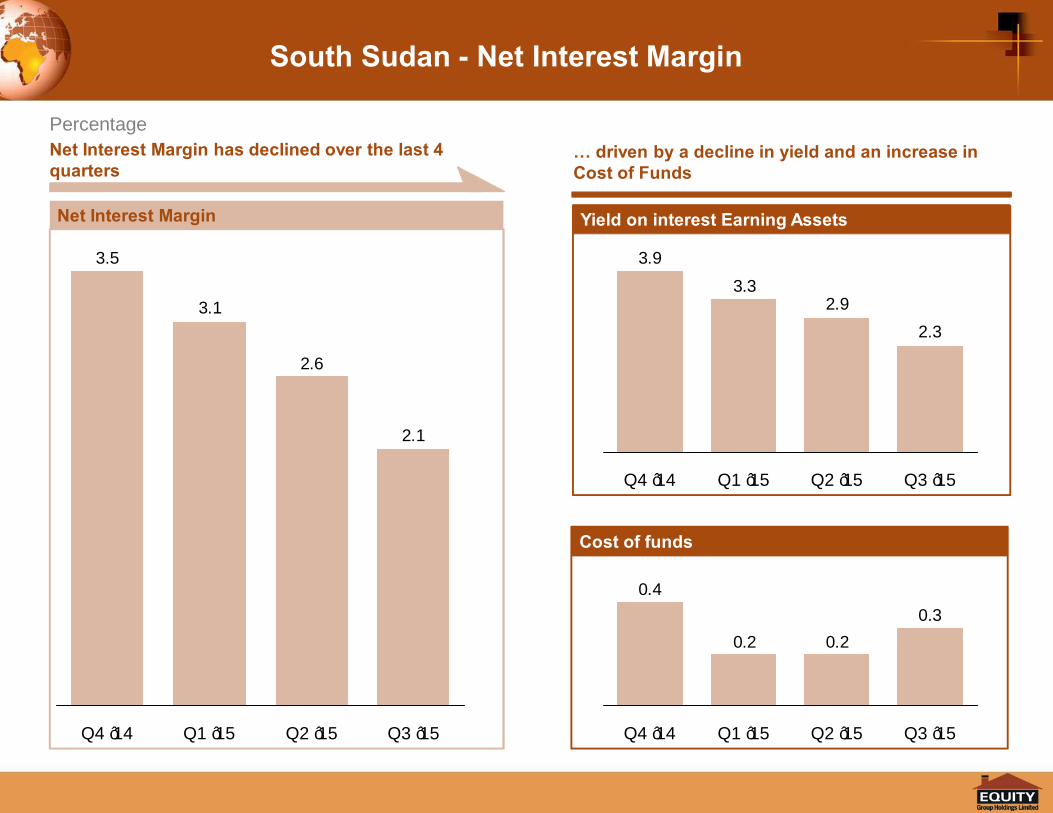
South Sudan - Net Interest Margin
… driven by a decline in yield and an increase in Cost of Funds
Percentage
Net Interest Margin Yield on interest Earning Assets
2.1
2.6
3.1
3.5
Q4 ’14 Q2 ’15Q1 ’15 Q3 ’15
0.30.20.2
0.4
Q4 ’14 Q2 ’15Q1 ’15 Q3 ’15
2.32.9
3.33.9
Q4 ’14 Q2 ’15Q1 ’15 Q3 ’15
Net Interest Margin has declined over the last 4 quarters
69
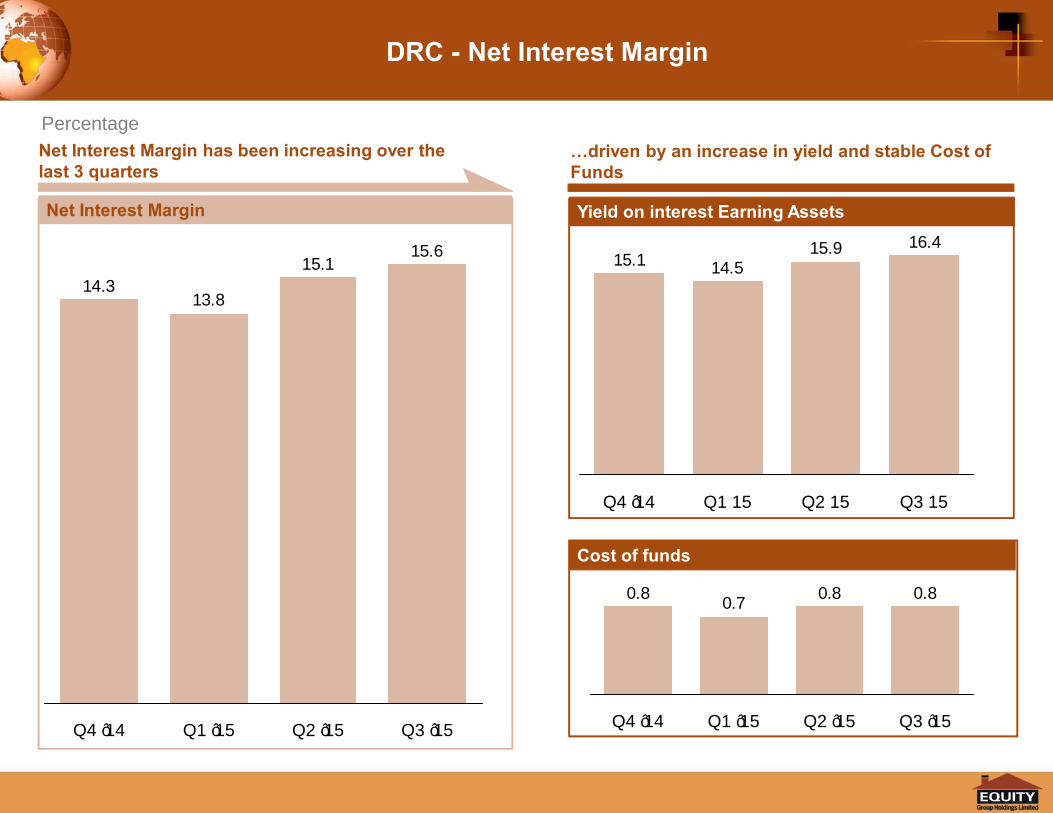
DRC - Net Interest Margin
Cost of funds
…driven by an increase in yield and stable Cost of Funds
Percentage
Net Interest Margin Yield on interest Earning Assets
15.615.1
13.814.3
Q3 ’15Q2 ’15Q1 ’15Q4 ’14
16.415.914.515.1
Q1 15Q4 ’14 Q2 15 Q3 15
0.80.80.70.8
Q4 ’14 Q1 ’15 Q2 ’15 Q3 ’15
Net Interest Margin has been increasing over the last 3 quarters

70
RoAE and RoAA Trend – Banking EntitiesF Y 2012 F Y 2013 F Y 2014 Q3 2015
Ta nz a nia - 5.9% 3. 8% 6. 1% 9. 0%Rwa nda - 18. 6% - 24. 6% 11. 7% 11. 0%S out h S udan 40.6% 5. 6% 13. 5% 17. 2%Ug a nda 3.6% 12. 6% 4. 0% 12. 8%DRC 12.8% 8. 3% 10. 8% 10. 6%
F Y 2012 F Y 2013 F Y 2014 Q3 2015Ta nz a nia - 1.9% 0. 8% 1. 1% 1. 4%Rwa nda - 6.4% -4. 4% 2. 2% 2. 3%S out h S udan 4.5% 0. 8% 1. 9% 1. 8%Ug a nda 0.6% 2. 0% 0. 6% 1. 5%DRC 1.6% 1. 0% 1. 3% 1. 3%
RoAE
RoAA

71
Performance Trend – Banking EntitiesFY 2012 FY 2013 FY 201 4 Q 3 20 15
Tanzani a N/A 230% 116% 1 05%Rw anda 387 7% 113% 71% 58%Sout h Su dan 125 % 23% - 17% - 20%Ugand a 11 % 2% - 1% 11%DRC 32 % 30% 27% 52%
FY 2012 FY 2013 FY 201 4 Q 3 20 15Tanzani a 0.7 % 1. 7% 2. 3% 3. 1%Rw anda 0.6 % 2. 4% 3. 6% 4. 4%Sout h Su dan 1.3 % 11. 6% 24. 7% 32. 9%Ugand a 3.5 % 4. 2% 3. 8% 3. 2%DRC 2.8 % 3. 8% 5. 1% 3. 9%
LO AN GRO WTH TREN D
N PL T REND
78%

72
THANK YOUDr James Mwangi, CBSGroup Managing Director & CEO
KeEquityBank@KeEquityBank
Email: [email protected] site: www.equitybankgroup.com


