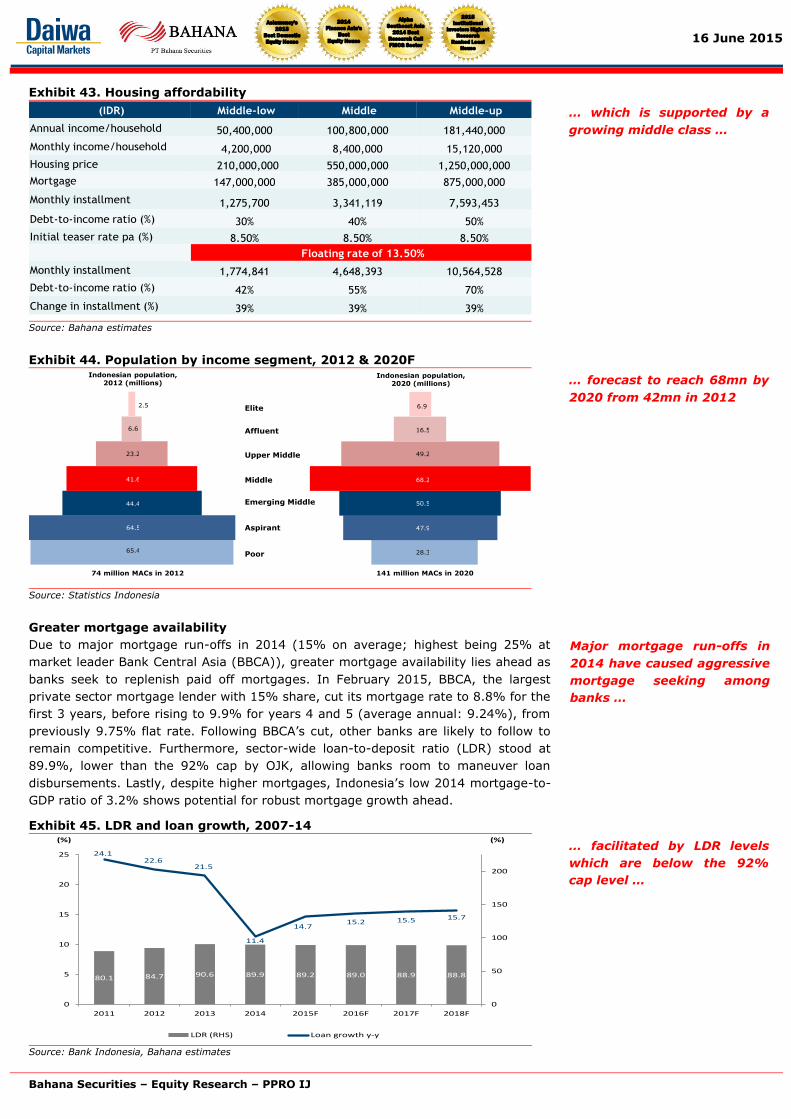
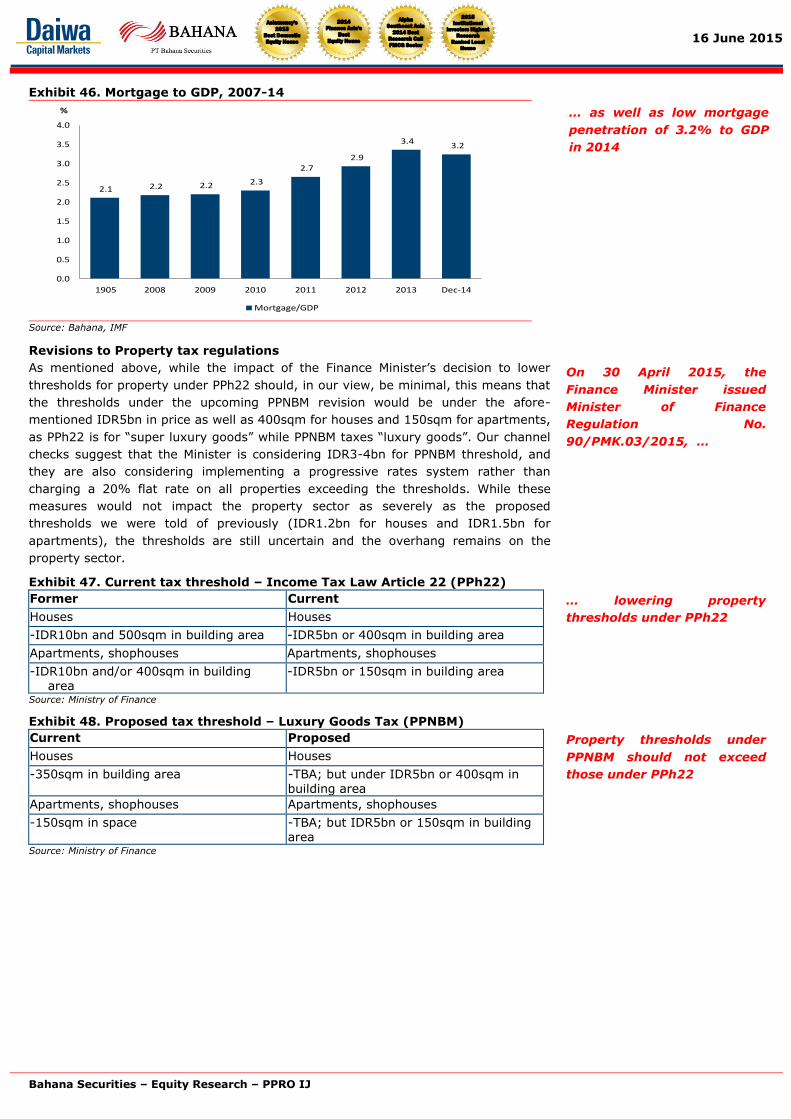
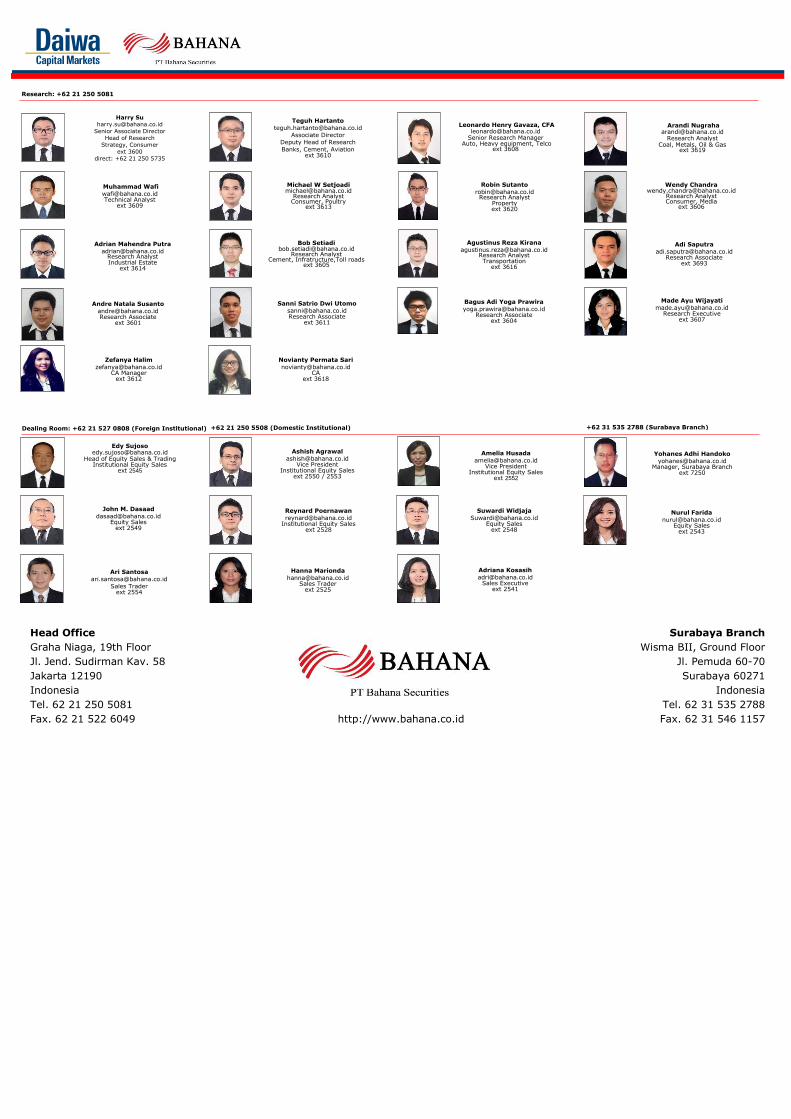
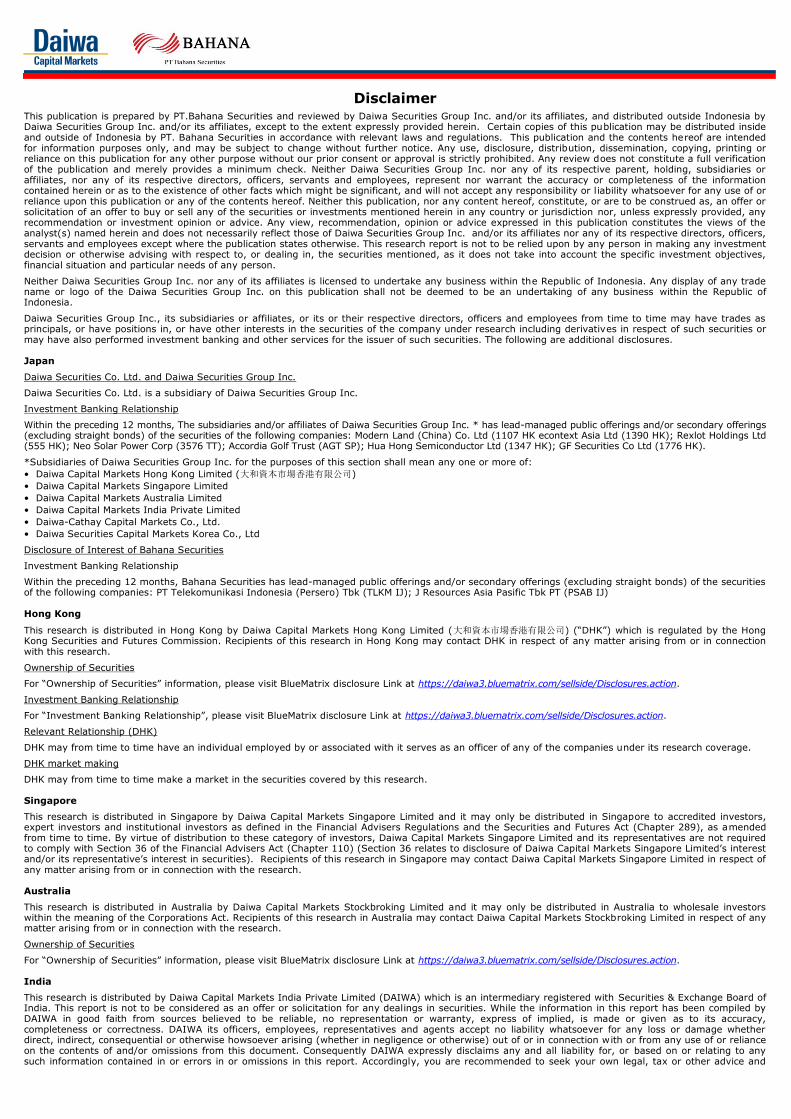
Asiamoney’s
2013
Best Domestic
Equity House
Spotlight
16 June 2015
Disclosure: Bahana Securities does and seeks to do business with companies covered in its research reports. Investors should consider this report as only a single factor in
making their investment decision.
Please see the important disclaimer information on the back of this report
*Based on consensus’ recent changes ↑ (up), ↓ (down), ↔ (unchanged)
2014
Finance Asia's
Best
Equity House
Alpha
Southeast Asia
2014 Best
Research Call
FMCG Sector
Asiamoney's
2013
Best Domestic
Equity House
2015
Institutional
Investors Highest
Research
Ranked Local
House
PP Properti Sector: Property (Underweight)
BUY (Initial Coverage)
Robin Sutanto E-mail: [email protected] Phone: +6221 250 5081 ext. 3620
PX:IDR156 –TP:IDR250 JCI: 4,838
Small but swift
Long historical track record of 25 years with sufficient land bank
Owned by Pembangunan Perumahan (PTPP) and established in 1990 as a
business unit, PP Properti (PPRO) has come a long away from just building
commissioned housing units, to developing apartments, commercial buildings
and hotels. Its total land bank of 55ha; the largest is in Bekasi (25ha) and is
sufficient for development up to 2035. Its main property portfolio includes 3
superblocks: 1 in Bekasi (Grand Kamala Lagoon) and 2 in Surabaya (Dharma
Husada and Grand Sungkono Lagoon). PPRO should benefit from its main
Bekasi location due to the area’s strong middle-income growth, supported by
3mn inhabitants (Indonesia’s 4th most densely populated city) with
IDR3mn/month minimum wage, presently the highest in the country.
Concept-driven development with high plot ratios
A concept-driven developer, PPRO focuses on ensuring a higher quality of life
for its residents by providing plenty of green space with water features. The
company’s strong take-up rates across its projects are also backed by well-
designed common grounds for social interaction and environmentally-friendly
facilities. Hence, PPRO’s projects comprise of a relatively large proportion of
end-users, which should in turn bode well for the company’s future launches.
Additionally, the management’s track record shows their uncanny ability to
develop less prime land banks into highly successful projects with high
building area coefficients (KLB) of more than 10 usually.
Beneficiary of SOE status and synergies from PTPP
PPRO benefits from parent-company synergies as it commissions PTPP as the
builder for most of its projects, ensuring not only timely completion but also
cost-efficiency advantages. Looking ahead, with PTPP’s growing toll-road
construction portfolio, the company should also benefit from PTPP’s discretion
to locate toll exits and entrances close to PPRO’s project locations. In addition,
the company’s SOE status paves the way for JVs, and more recently JOs with
other SOEs owning under-utilized land banks such as Pertamina, the state-
owned oil company, and BPJS, the Healthcare and Social Security Agency. We
note that PPRO has an edge over other SOE developers, helped by its strong
historical track record and innovative development concepts.
Fastest growing developer; Safe from luxury tax; BUY on 60% upside
Given its innovation and concept-based developments focusing on providing
an improved quality of life for its middle-class buyers, we expect PPRO to
enjoy the fastest 2015F earnings growth of 181% y-y within our Property
universe. Additionally, PPRO is free from the government’s upcoming luxury
property tax given its low unit pricing of between IDR700mn-1.5bn, targeted
at IDR7-30mn/month income earners, a group forecast to grow from 42mn in
2012 to 68mn by 2020. To fund its 2015-16 expansion plans, PPRO has
obtained IDR909bn from its recent IPO, of which 75% would be utilized for
land bank purchases across various projects (exhibit 39). On valuation, our
target price of IDR250 is based on a 50% discount to NAV (exhibit 3). BUY on
60% upside to our TP. Risk: Slower-than-expected project completion.
Exhibit 1. Company and shareholders info
Bloomberg code : PPRO IJ
Pembangunan Perumahan (%) : 65.0
Pembangunan Perumahan Employee Welfare Found.(%)
: 0.1
Free float (%) : 34.9
Source: Bloomberg
Exhibit 2. Key forecasts and valuations
Year to 31 Dec 2013 2014 2015F 2016F
Revenue (IDRbn) 192 555 1,545 1,887
EBIT (IDRbn) 46 128 419 526
Net profit (IDRbn) 49 106 298 361
EPS (IDR) 5 12 21 26
EV/EBITDA (x) 25.2 12.1 7.3 6.6
PER (x) 28.9 13.4 7.4 6.1
FCFPS (IDR) 23 (19) (66) (45)
FCF yield (%) 0.2 (0.2) (0.5) (0.3)
BVPS (IDR) 101 113 157 176
PBV (x) 1.5 1.4 1.0 0.9
DPS (IDR) - - 2 6
Yield (%) - - 1.2 3.4
ROAA (%) 3.2 5.1 8.2 6.9
ROAE (%) 5.3 10.8 18.4 15.4
EBIT margin (%) 24.1 23.1 27.1 27.9
Net gearing (%) nc 7.5 39.1 52.9 Source: Bloomberg, Bahana estimates
Note: Pricing as of close on 15 June 2015
Exhibit 3. NAV calculation
Portfolio Value (IDRbn)
Land bank 669 High rise 7,143
Recurring income 733
Total 8,545 Add: Cash (2015F) 196 Less: Debt (1,058) Less: Customer deposit (751) Adjusted NAV 6,932 No. of shares outstanding (m shares)
14,044
Discounted value 3,466 Discount to NAV 50% Target price 250 Source: Bahana estimates
16 June 2015
Bahana Securities – Equity Research – PPRO IJ
2014
Finance Asia's
Best
Equity House
Alpha
Southeast Asia
2014 Best
Research Call
FMCG Sector
Asiamoney's
2013
Best Domestic
Equity House
2015
Institutional
Investors Highest
Research
Ranked Local
House
PP Properti Year to 31 December 2013 2014 2015F 2016F 2017F PROFIT & LOSS (IDRbn) Sales 192 555 1,545 1,887 2,219 Gross profit 49 143 459 575 706 EBITDA 60 135 448 559 689 Depreciation 14 7 29 33 40 EBIT 46 128 419 526 649 Net interest inc./(expense) - 1 (46) (73) (84) Forex gain/(losses) - - - - - Other income/(expense) 4 2 2 2 2 Pre-tax profit 51 131 375 455 566 Taxes (2) (25) (77) (94) (111) Minority interest - - - - - Extraordinary gain/(losses) - - - - - Net profit 49 106 298 361 455
BALANCE SHEET (IDRbn) Cash and equivalents 32 229 196 167 220 S-T investments - - - - - Trade receivables 199 439 1,270 1,551 1,824 Inventories 817 1,529 1,866 2,190 2,589 Fixed assets 207 218 441 737 984 Other assets 181 315 803 1,254 1,535 Total assets 1,437 2,731 4,577 5,899 7,151 Interest bearing liabilities - 307 1,058 1,478 1,478 Trade payables 21 752 892 1,079 829 Other liabilities 491 640 420 865 2,019 Total liabilities 512 1,699 2,371 3,421 4,326 Minority interest - - - - - Shareholders' equity 925 1,031 2,206 2,478 2,825
CASH FLOW (IDRbn) EBIT 46 128 419 526 649 Depreciation 14 7 29 33 40
Working capital (5) 536 (186) 71 734 Other operating items (8) (22) (121) (165) (194) Operating cash flow 47 649 141 465 1,229 Net capital expenditure 161 (821) (1,067) (1,095) (957) Free cash flow 207 (172) (926) (630) 272 Equity raised/(bought) 913 - 909 - - Net borrowings - 296 168 690 (110) Other financing (1,104) 72 (183) (89) (109) Net cash flow 16 196 (32) (30) 53 Cash flow at beginning 16 32 229 196 167 Ending cash flow 32 228 196 167 220
RATIOS ROAE (%) 5.3 10.8 18.4 15.4 17.2 ROAA (%) 3.2 5.1 8.2 6.9 7.0 Gross margin (%) 25.3 25.7 29.7 30.5 31.8 EBITDA margin (%) 31.4 24.3 29.0 29.6 31.0 EBIT margin (%) 24.1 23.1 27.1 27.9 29.2 Net margin (%) 25.6 19.1 19.3 19.1 20.5 Payout ratio (%) - - 30.0 30.0 30.0 Current ratio (x) 8.0 2.1 2.1 2.0 1.6 Interest coverage (x) na na 9.1 7.3 7.7 Net gearing (%) nc 7.5 39.1 52.9 44.5 Debts to assets (%) 0.0 11.2 23.1 25.1 20.7 Debtor turnover (days) 335 210 300 300 300 Creditor turnover (days) 38 343 300 300 200 Inventory turnover (days) 2,691 1,039 571 564 577
MAJOR ASSUMPTIONS Marketing sales (IDRb) 407 1,203 2,233 2,902 3,272 Marketing sales growth (%) - 195.9 85.6 30.0 12.8
Source: Company, Bahana estimates
Robust 84% revenue CAGR in 2013-17F on rapid development projects
Cash levels to fall in 2016F …
… to support elevated capex levels, although …
… net gearing is expected to
remain healthy at around 53% at its peak in 2016
Marketing sales growth to fall to more manageable levels in 2016-17F
Robin Sutanto ([email protected]) +6221 2505081 ext. 3620
16 June 2015
Bahana Securities – Equity Research – PPRO IJ
2014
Finance Asia's
Best
Equity House
Alpha
Southeast Asia
2014 Best
Research Call
FMCG Sector
Asiamoney's
2013
Best Domestic
Equity House
2015
Institutional
Investors Highest
Research
Ranked Local
House
BUSINESS OUTLOOK
Developments since 1991; Middle-income as a more recent target market
PPRO was founded as a development-focused branch office of a well-established SOE
construction company PTPP in 1990. Its first projects, completed in 1991, included
housing units for the Jatiluhur Housing Authority (JHA), Bandung’s Kopo Kencana 1
and 2 shop houses, and the Permata Puri residential cluster in Bogor.
Exhibit 4. PPRO’s first residential projects, 1991-94
Jatiluhur Housing Authority employeeresidential complex,
PurwakartaPermata Puri, Cibubur
Bumi Kopo Kencana 1 shop houses
Bumi Kopo Kencana 2 shop houses
Source: Company
In 1995, the company was formally recognized as a business unit within PTPP,
following the groundbreaking of housing clusters Taman Griya Permata in Bali and
Perumahan Permata Puri Laguna in Cibubur. The company then followed up with
Bukit Permata Puri Semarang, another housing cluster development, in 1996; this is
still continuing with expected completion in 2016.
Exhibit 5. PPRO’s projects as a business unit, 1995
Taman Griya Permata, Bali Permata Puri Laguna, Cibubur
Source: Company
PPRO’s developments date
back to 1991 …
… with small housing
clusters and low-rise
buildings in Purwakarta,
Bandung and Bogor
After being formally
recognized as a business unit
…
… PPRO’s project sizes grew
steadily
16 June 2015
Bahana Securities – Equity Research – PPRO IJ
2014
Finance Asia's
Best
Equity House
Alpha
Southeast Asia
2014 Best
Research Call
FMCG Sector
Asiamoney's
2013
Best Domestic
Equity House
2015
Institutional
Investors Highest
Research
Ranked Local
House
Exhibit 6. Bukit Permata Puri, Semarang, 1996
Source: Company
High-rise projects
PPRO began its first forays into high-rise developments with Paladian Park, an
apartment complex located in Kelapa Gading, Jakarta, with a total gross floor area
(GFA) of 155,030sqm. Paladian Park’s groundbreaking was in 1997 and through
various phases of development, saw completion in 2009. Its next high-rise project
was Patria Park in Cawang, Jakarta, commencing in 2004 and completed in 2007. The
late-2000s also saw PPRO extending into commercial properties with Mall Serang,
Banten, in 2009, and Grand Slipi Tower, an office building, in 2010. In addition, PPRO
ventured into hotels in 2010 with the opening of Park Hotel Jakarta, a 3 star, 162-
room hotel in Cawang, marking the first of its Park Hotel line. A second 3 star hotel
under its Park brand was opened in Bandung in 2013, comprising 12,727sqm in GFA
across 127 rooms. We note that since 2012, PPRO’s high-rise projects have been
growing steadily, having dominated total marketing sales by 2014.
Exhibit 7. PPRO’s first high-rise residential projects, 1997-2004
Paladian Park, Kelapa Gading, Jakarta
Patria Park, Cawang, Jakarta
Source: Company
Its next project, located in
Semarang, is still ongoing
this year
In 2009, the company
branched out to building
high-rise buildings …
… beginning with apartment
towers in Jakarta …
16 June 2015
Bahana Securities – Equity Research – PPRO IJ
2014
Finance Asia's
Best
Equity House
Alpha
Southeast Asia
2014 Best
Research Call
FMCG Sector
Asiamoney's
2013
Best Domestic
Equity House
2015
Institutional
Investors Highest
Research
Ranked Local
House
Exhibit 8. PPRO’s first commercial projects, 2009-11
Park Hotel Jakarta Park Hotel Bandung
Mall Serang, Banten Grand Slipi Tower, Jakarta
Source: Company
Exhibit 9. Marketing sales breakdown 2012-14
80.6% 47.4%1.6%
4.5%41.4%
95.2%
14.9%
11.2%
3.2%
0
200
400
600
800
1,000
1,200
1,400
2012 2013 2014
IDRbn
Commercial Highrise - refer "Highrise" tab Landed
Source: Company
Exhibit 10. Residential breakdown by market segment, 2012-14
76.8%65.3%
86.1%
23.2%34.7%
13.9%
0
200
400
600
800
1,000
1,200
1,400
2012 2013 2014
(IDRbn)
Residential - middle Residential - low
Source: Company
On payment terms, mortgages make up the largest proportion at 50%, followed by
in-house installments at 40% and cash at 10%. This is due to PPRO’s marketing sales
mix having been dominated by its Surabaya projects, at which mortgages formed the
most popular payment method.
… followed by commercial
buildings
High-rise portfolio has been
growing to dominate
marketing sales mix
More recently, we note that
PPRO has targeted the
middle-income class for the
majority of its residential
projects
Due to contribution from its
Surabaya projects …
16 June 2015
Bahana Securities – Equity Research – PPRO IJ
2014
Finance Asia's
Best
Equity House
Alpha
Southeast Asia
2014 Best
Research Call
FMCG Sector
Asiamoney's
2013
Best Domestic
Equity House
2015
Institutional
Investors Highest
Research
Ranked Local
House
Exhibit 11. Payment terms across PPRO’s projects
10
50
40
Cash Mortgage Internal Installments
0
10
20
30
40
50
60
Cash Mortgage Internal Installments
(%)
Source: Company
2013: Spin-off & start of aggressive expansion phase
In 2013, with plans to launch superblocks in the works, PPRO was spun off into its
own legal entity, separate from its parent PTPP, marking the start of the company’s
aggressive expansion phase with the superblocks Grand Sungkono Lagoon (GSL),
Grand Kamala Lagoon (GKL) and North East Square (NES) within its pipeline.
Grand Sungkono Lagoon
GSL was launched in September 2013. Located on a 3.6ha land bank next to Golden
City Mall and purchased for IDR382bn (IDR8.3mn/sqm), GLS has a KLB of 10.48 and
would be PPRO’s first high-density development. Displaying its “beyond space”
development approach, PPRO designed GSL with plenty of amenities to cater for the
well-being of its residents. Surrounding a water lagoon, the facilities which would be
offered include 5 thematic gardens, a river walk, splash pads, fountains and health
tracks for exercise on top of the standard condominium facilities. It was designed in
collaboration with Green Building Council Indonesia for the optimum window-wall
ratio. Upon completion, PPRO expects GSL to total 240,000sqm in residential GFA. It
would also include a 22,000sqm (NLA) commercial area to cater for residents’ daily
and entertainment needs, and further ahead, PPRO plans to include an office tower
and a hotel within GSL.
Exhibit 12. Location of Grand Sungkono Lagoon
Source: Company
… PPRO has seen mortgages
being the most popular form
of payment
Spin-off in 2013 given
aggressive expansion stage
PPRO’s first superblock,
kicked off in 2013
Located along Jl. Mayjend
Sungkono, GSL is located
close to Surabaya’s outer
ring road
16 June 2015
Bahana Securities – Equity Research – PPRO IJ
2014
Finance Asia's
Best
Equity House
Alpha
Southeast Asia
2014 Best
Research Call
FMCG Sector
Asiamoney's
2013
Best Domestic
Equity House
2015
Institutional
Investors Highest
Research
Ranked Local
House
Exhibit 13. Rendering of Grand Sungkono Lagoon
Source: Company
Venetian, the first tower launched at GSL, was offered at an ASP of IDR14mn/sqm in
September 2013. It was sold out within a year with the final ASP at IDR21mn/sqm,
translating to a 50% increase. Totaling 34 storeys, Venetian is expected to have
34,703sqm in total GFA. Groundbreaking took place in mid-2014. As of February
2015, PPRO was in the process of constructing Venetian’s basement.
Exhibit 14. Venetian, construction progress, February 2015
Source: Company
Exhibit 15. Venetian’s payment terms
0.5
89
11
Cash KPA Internal Installments
0
10
20
30
40
50
60
70
80
90
100
Cash KPA Internal Installments
(%)
Source: Company
A second tower, Caspian, was launched on 21 January 2015, at an ASP of
IDR22.5mn/sqm. Caspian would be 48 storeys high with a total GFA of 46,750sqm.
Groundbreaking is expected to be held in August 2015.
GSL is expected to be one of
Surabaya’s tallest residential
buildings
Venetian, GSL’s first tower,
was first launched in 3Q13
with …
… groundbreaking in mid-
2014, and its construction is
currently at the basement
stage
Huge majority of buyers
chose mortgage payments
over the typically more
popular internal installments
Caspian, GSL’s second tower,
was launched on 21 January
2015 …
16 June 2015
Bahana Securities – Equity Research – PPRO IJ
2014
Finance Asia's
Best
Equity House
Alpha
Southeast Asia
2014 Best
Research Call
FMCG Sector
Asiamoney's
2013
Best Domestic
Equity House
2015
Institutional
Investors Highest
Research
Ranked Local
House
Exhibit 16. Caspian, launched January 2015
Source: Company
Grand Kamala Lagoon
Following GSL, PPRO commenced monetization of its 27ha Kalimalang, Bekasi, land
bank with the launch of Grand Kamala Lagoon’s (GKL) in May 2014. GKL’s
development would encompass 7 phases up to 2035, and is expected to generate
IDR46tn in total marketing sales. PPRO expects GKL to be its main foothold within the
Indonesian property universe, eventually developing it to be its flagship township.
PPRO accumulated ownership of the land bank from 1983-2003 for a total of
IDR121bn (IDR485k/sqm).
Exhibit 17. Location of Grand Kamala Lagoon
Source: Company
Exhibit 18. Architect’s model of Grand Kamala Lagoon
Source: Company
… with groundbreaking
planned for August
Launched in May 2014, GKL,
where PPRO expects to
establish its main presence,
…
… is located in Kalimalang,
complete with various
alternative access ways
High 10.6 KLB obtained for
GKL
16 June 2015
Bahana Securities – Equity Research – PPRO IJ
2014
Finance Asia's
Best
Equity House
Alpha
Southeast Asia
2014 Best
Research Call
FMCG Sector
Asiamoney's
2013
Best Domestic
Equity House
2015
Institutional
Investors Highest
Research
Ranked Local
House
PPRO has obtained a KLB of 10.6 for GKL’s first phase, and expects to build 3 pairs of
conjoined condominium towers and an additional standalone tower, each building
being 45 storeys high, translating to a total residential GFA of 418,340sqm across the
4 towers. Following GSL’s concept, GKL would also include various water-based
attractions and amenities, including a lagoon, several koi ponds, water gardens, a
tropical terrace, a greenway belt, water taxis, and health tracks. In line with GSL,
GKL would also have a commercial area catering to residents’ daily and entertainment
needs. It would span 26,000sqm in NLA, and has garnered interest from Lotte as well
as Aeon.
Exhibit 19. Bird’s eye view of PPRO’s Kalimalang land bank
Source: Company
For improved access, GKL would also include a IDR90bn, 26x300m bridge connecting
GKL with the Jakarta-Cikampek toll road and the planned Bekasi-Cawang-Kampung
Melayu (Becakayu) toll road. A monorail stop, part of the Jakarta Monorail project, is
also planned to be stationed at the foot of the bridge. Furthermore, a Shinkansen line
is currently being planned to pass along GKL’s entrance, according to PPRO’s
management.
Exhibit 20. Rendering of Grand Kamala Lagoon’s access bridge
Source: Company
Located in Kalimalang, GKL
boasts various alternative
access ways
PPRO’s Kalimalang land
bank, marked by the green
area circled, is expected to
last the company 20 years
A bridge would be
established to vastly improve
GKL’s access with …
… Jakarta-Cikampek and
Becakayu toll roads, as well
as monorail stops
16 June 2015
Bahana Securities – Equity Research – PPRO IJ
2014
Finance Asia's
Best
Equity House
Alpha
Southeast Asia
2014 Best
Research Call
FMCG Sector
Asiamoney's
2013
Best Domestic
Equity House
2015
Institutional
Investors Highest
Research
Ranked Local
House
Exhibit 21. Grand Kamala Lagoon’s access bridge, currently 95% completed
Source: Bahana
Exhibit 22. Phase-mood lighting at Grand Kamala Lagoon
Source: Company
Exhibit 23. Grand Kamala Lagoon – buyers’ payment terms
10
30
60
Cash KPA Internal Installments
0
10
20
30
40
50
60
70
Cash KPA Internal Installments
(%)
Source: Company, Bahana
PPRO launched GKL’s first tower, Emerald, on 20 May 2014 at an ASP of IDR14
mn/sqm and currently only has a few penthouses remaining unsold. Totaling 45
storeys, Emerald’s planned total GFA is expected to reach 70,000sqm.
Groundbreaking took place in August 2014 and construction progress is currently
underway at the foundation level.
Construction progress of
GKL’s access bridge,
currently at 95%
An example of a comfort-
enhancing feature at PPRO’s
unit at GKL, also available at
its other projects
Unlike GSL, majority of GKL’s
buyers prefer internal
installments
Solid sales performance at
Emerald, GKL’s first tower,
with all but the highest-end
penthouses sold
16 June 2015
Bahana Securities – Equity Research – PPRO IJ
2014
Finance Asia's
Best
Equity House
Alpha
Southeast Asia
2014 Best
Research Call
FMCG Sector
Asiamoney's
2013
Best Domestic
Equity House
2015
Institutional
Investors Highest
Research
Ranked Local
House
Exhibit 24. Emerald, construction progress, February 2015
Source: Company
GKL’s second offering, Barclay, was formally launched on 23 March 2015, with 1,000
units at its North tower offered at IDR16mn/sqm. 700 units were sold during the
launch, translating to a 70% launch-day take-up rate. PPRO expects to launch Barclay
South in July and break ground for Barclay North and South in August 2015.
North East Square
PPRO plans to launch its third superblock, North East Square (NES), on a 4.2ha land
bank in East Surabaya by Jln. Dharma Husada, which PPRO purchased in 2014 at
IDR15/sqm. The location is within walking distance to the Al Azhar educational
institution, Institut Teknologi Sepuluh Nopember (ITS) and Universitas Airlangga, the
latter 2 being among Surabaya’s largest universities. Other educational facilities in
the vicinity include Universitas Surabaya and Universitas Muhammadiyah. This would
be NES’ main attraction and selling point, with reliance on the surrounding student
population. For this project, PPRO has obtained a KLB of 10.
PPRO plans to launch 8 residential towers at NES, 2 of which would be higher-end.
The first tower is planned for launch in August-September 2015 at an ASP of
IDR15mn/sqm. IDR9.2tn in total marketing sales is expected from NES. It would also
include a 5,000sqm (NLA) commercial area which would include a thematic indoor
area simulating the outdoors, a karaoke area and a theater catering for students’
lifestyle needs, to complement nearby shopping malls rather than being a head-to-
head competitor.
Exhibit 25. NES location
Source: Company
With groundbreaking in mid-
2014, construction of
Emerald is currently at the
basement stage
Decent take-up at GKL’s
second offering
North East Square, PPRO’s
third upcoming superblock, is
…
… expected to generate
IDR9.2tn in total marketing
sales
Located within close
proximity of several
educational institutions, NES
is targeted towards students
16 June 2015
Bahana Securities – Equity Research – PPRO IJ
2014
Finance Asia's
Best
Equity House
Alpha
Southeast Asia
2014 Best
Research Call
FMCG Sector
Asiamoney's
2013
Best Domestic
Equity House
2015
Institutional
Investors Highest
Research
Ranked Local
House
Exhibit 26. Dharma Husada land bank, February 2015
Source: Company
Pavilion Permata
Apart from its superblocks, PPRO’s 2015 pipeline also includes the second tower at
Pavilion Permata (PP), Pavilion Permata 2, which is planned for groundbreaking in
2H15. It is a follow-up to Pavilion Permata 1, which was launched in 2013 and
planned for handover later this year. Along with GSL, PP also sits next to Golden City
Mall, albeit on the opposite side of the mall from GSL. Upon completion, PP2 would
feature a connecting bridge to Golden City Mall to enhance access for residents.
Although targeted at the middle class, PP would offer housekeeping and laundry
services, as well as plenty of common areas for relaxation and exercise, features not
commonly found in middle-class apartments, highlighting PPRO’s advanced
development concept with its residents’ well-being in mind.
Exhibit 27. Pavilion Permata 1 apartment tower, February 2015
Source: Company
Exhibit 28. Facilities at Pavilion Permata, February 2015
Source: Company
Present stage of PPRO’s
Dharma Husada land bank
Pavilion Permata, PPRO’s
middle-class apartment
project close to GSL, has
advanced development
concept
Present stage of PP1,
planned for handover in
2H15
Examples of common area
and exercise space at PP
16 June 2015
Bahana Securities – Equity Research – PPRO IJ
2014
Finance Asia's
Best
Equity House
Alpha
Southeast Asia
2014 Best
Research Call
FMCG Sector
Asiamoney's
2013
Best Domestic
Equity House
2015
Institutional
Investors Highest
Research
Ranked Local
House
Exhibit 29. Site for Pavilion Permata 2, February 2015
Source: Company
Other projects in 2015 pipeline
On top of the superblocks, PPRO’s project pipeline over 2015-16 also includes 3 high-
rise projects: 1. Ayoma Residence, a middle-upper class project in Serpong, and 2.
Gunung Putri Square, Bogor, targeted at the low-income population. Its pipeline also
includes landed housing projects under way: 1. Payon Amartha in Semarang, a mid-
high end residential cluster, and 2. Bukit Permata Puri, also in Semarang, a
continuation of PPRO’s project which dates back to 1996, catering to the middle class.
However, high-rise residences would be PPRO’s main focus going forward.
On aggregate, these projects are expected to generate over IDR5tn in marketing
sales over the next few years. For the high-rise projects, PPRO has also obtained
KLBs of over 10, with the exception of Ayoma Residence for which KLB stands at 7.2.
PPRO also expects to build a hotel located next to Kaza, scheduled to be operational
by 2017. This is on top of 2 Park hotels, 1 in Lombok and another in Bengkulu, which
should be operational by 2017 and 2018 respectively. PPRO estimates IDR50bn in
capex for each hotel. The company also plans to acquire an existing hotel in
Kalimantan by 2015.
Notably, Ayoma Residence was met with strong demand as it was put up for offers at
PPRO’s exhibition booth at a property expo held in Jakarta Convention Center, prior to
the rendering of the project being completed. PPRO sold a remarkable 79% of
Ayoma’s units at the event. In addition, Gunung Putri Square (Bogor) is a
government-supported project offered at the low-income population working in the
nearby industrial areas, representing a healthy source of buyers, along with increased
affordability due to lower down payment requirements.
Future plans
Going forward, PPRO would continue offering high-density mixed use and high-rise
projects targeted at the middle to upper income segments, priced between
IDR700mn-1.5bn per unit, a range which it has identified as its “sweet spot”. In
particular, the company’s target market includes households with monthly income of
IDR7-30mn, which is forecast to grow from 42mn in 2012 to 68mn by 2020.
Spot planned for PP2, viewed
from PP1’s partly-completed
building
Other projects in 2015
pipeline include high-rise and
landed housing projects,
which are …
… expected to generate
IDR5tn over the next few
years
Additional hotel construction
and acquisition in the
pipeline
Robust performance at
Ayoma Residence,
suggesting high public trust
in PPRO
Going forward, PPRO to offer
housing units to middle to
upper income earners, a
segment forecast to grow
from 42mn in 2012 to 68mn
by 2020
16 June 2015
Bahana Securities – Equity Research – PPRO IJ
2014
Finance Asia's
Best
Equity House
Alpha
Southeast Asia
2014 Best
Research Call
FMCG Sector
Asiamoney's
2013
Best Domestic
Equity House
2015
Institutional
Investors Highest
Research
Ranked Local
House
FINANCIAL OUTLOOK
84% 2013-17F top line CAGR from robust marketing sales since 2014
With the launch of its superblock projects, PPRO’s marketing sales increased 123% y-
y from 2013 to 2014. We expect strong take-up at PPRO’s projects to continue given
the company’s commitment to innovative high-density developments, which should
translate to continued strong marketing sales momentum with additional pre-sales
progress across its projects, most notably at GKL, GSL and NES (which together we
expect would contribute 79-85% to total marketing sales in 2015-17F) as PPRO
launches additional towers and phases. Assuming 5-10% annual ASP growth, in line
with typical market conditions, we expect PPRO’s marketing sales to grow at a CAGR
of 68% from 2013-17F.
Exhibit 30. Marketing sales growth, 2013-17F
407
1,203
2,233
2,902
3,272
2013 2014 2015F 2016F 2017F
-
500
1,000
1,500
2,000
2,500
3,000
3,500
Marketing sales
(IDRbn)
Source: Company, Bahana estimates
2014’s strong marketing sales growth is expected to strongly drive revenue growth
going forward as physical construction progresses across PPRO’s superblock projects
(including GKL and GSL). In this aspect, PPRO’s forte lies in its parent being
commissioned to build its projects, thereby providing PPRO with a reliable contractor
with few project delays. Marketing sales growth should therefore translate to
accelerated revenues with minimal hiccups. On the back of this, we expect top line
growth to strongly come in at 84% CAGR in 2013-17F.
Exhibit 31. Revenue growth, 2013-17F
192
555
1,545
1,887
2,219
2013 2014 2015F 2016F 2017F
-
500
1,000
1,500
2,000
2,500
Revenue
(IDRbn)
Source: Company, Bahana estimates
Robust 2014 marketing sales
performance …
… which we expect to
continue with the company’s
additional launches …
… should result in a
significant boost to 2015-17
revenue …
… translating to 84% 2013-
17F revenue CAGR
16 June 2015
Bahana Securities – Equity Research – PPRO IJ
2014
Finance Asia's
Best
Equity House
Alpha
Southeast Asia
2014 Best
Research Call
FMCG Sector
Asiamoney's
2013
Best Domestic
Equity House
2015
Institutional
Investors Highest
Research
Ranked Local
House
Slight recurring base comeback in 2017
On the back of faster development activities, we expect recurring income to drop to
6% in 2015-16F from 50% in 2013 and 14% in 2014. In 2017, with PPRO expecting
the completion of the commercial areas in GKL and GSL, as well as Park Hotel
Lombok and Kaza Hotel, recurring income should get a boost with an additional
IDR51bn in recurring income, bringing recurring income up slightly to 8% of total
2017F revenue. In the longer term, with the addition of malls, hotels and commercial
areas in its pipeline, PPRO aims for its recurring income base to reach 25-30% of total
revenue.
Exhibit 32. Revenue breakdown, recurring VS development, 2013-17F
50
86 94 94 92
50
14 6 6 8
2013 2014 2015F 2016F 2017F
-
20
40
60
80
100
120
Development Recurring
(%)
Source: Company, Bahana estimates
Improving margins from higher yielding high-rise projects
On the back of increased revenue contribution from its high-rise projects as well as its
hotels turning profitable as they mature, we expect PPRO's gross margin to move up
to 30-32% in 2015-17F from 25-26% in 2013-14, which should translate into
expansion in both operating and net margins. In addition, we note that PPRO’s gross
margin had taken a hit from having engaged in a price game by charging lower ASPs
than comparable projects of its competitors in nearby areas, a move through which
the company hopes to gain market share in an industry that ascribes premiums for
market stature. Going forward, as its market share improves, PPRO’s bargaining
power should increase, and it aims to see gross margins rise to industry-average
levels of 40-45% for its high-rise projects, which we think is achievable driven by the
company’s ability to come up with creative concepts for its developments.
Exhibit 33. PPRO’s gross margins, 2013-17F
25.3 25.7
29.7
30.5
31.8
2013 2014 2015F 2016F 2017F
25.0
26.0
27.0
28.0
29.0
30.0
31.0
32.0
33.0
Gross margin
(%)
Source: Company, Bahana estimates
While 2015-16F recurring
income should fall on the
back of increase in
development revenue, …
… we expect slight rebound
in recurring income
contribution in 2017
While gross margin has been
depressed …
… we expect improvements
ahead on market share gains
and higher yielding projects
16 June 2015
Bahana Securities – Equity Research – PPRO IJ
2014
Finance Asia's
Best
Equity House
Alpha
Southeast Asia
2014 Best
Research Call
FMCG Sector
Asiamoney's
2013
Best Domestic
Equity House
2015
Institutional
Investors Highest
Research
Ranked Local
House
Exhibit 34. PPRO’s revenue breakdown by product type, 2014-15F
7%
79%
12%
2%
2014
Landed Apartments Hotels Others
3%
91%
5%
1%1%
2015F
Landed Apartments Hotels Others Malls
Source: Company, Bahana estimates
Exhibit 35. PPRO’s gross margin breakdown by product type, 2014-15F
40
29
-2
11
-5
0
5
10
15
20
25
30
35
40
45
Land
ed
Apar
tmen
ts
Hot
els
Oth
ers
2014
Average: 15.6%
40
31
15
10 10
-5
0
5
10
15
20
25
30
35
40
45
Land
ed
Apar
tmen
ts
Hot
els
Reta
il m
alls
Oth
ers
2015F
Average: 21.1%
Source: Company, Bahana estimates
Exhibit 36. PPRO’s gross profit breakdown by product type, 2014-15F
10%
90%
1%
2014
Landed Apartments Hotels Others
4%
93%
2%
0.3%
0.2%
2015F
Landed Apartments Hotels Others Malls
Source: Company, Bahana estimates
Greater top line contribution
from apartments to 91% this
year, while hotels should
come down from 12% to 5%
Apartments should see
higher margin this year due
to high yielding projects
while hotels are expected to
become profitable as they
mature, paving the way …
… for greater gross profit
contribution for apartments
from 90% in 2014 to 93% in
2015F
16 June 2015
Bahana Securities – Equity Research – PPRO IJ
2014
Finance Asia's
Best
Equity House
Alpha
Southeast Asia
2014 Best
Research Call
FMCG Sector
Asiamoney's
2013
Best Domestic
Equity House
2015
Institutional
Investors Highest
Research
Ranked Local
House
In addition, we note that PPRO’s COGS includes marketing expenses, which has
accounted for some 5% to total revenue in 2013-14, and is expected to remain at
that level in 2015-17F. Should this be reclassified as operating expenses, PPRO’s
gross margins would improve to 34-35% in 2015-17F.
Exhibit 37. Gross margins with marketing costs reclassified, 2013-17F
27.8
30.0
34.535.1 35.3
2013 2014 2015F 2016F 2017F
25.0
27.0
29.0
31.0
33.0
35.0
37.0
Gross margin
(%)
Source: Company, Bahana estimates
Net debt to increase, albeit maintaining manageable gearing levels
PP Properti expects additional borrowings to support its heightened capex during its
expansion phase going forward. On the back of this, we expect net gearing to rise to
a peak of 52.9% in 2016F, which should remain manageable for the company, before
dropping slightly to 44.5% in 2017F.
Exhibit 38. Financial highlights
(IDRb) 2013 2014 2015F 2016F 2017F
Sales 192 555 1,545 1,887 2,219
Gross profit 49 143 459 575 706
Operating
profit 46 128 419 526 649
Net profit 49 106 298 361 455
Cash 32 229 196 167 220
Assets 1,437 2,731 4,577 5,899 7,151
Net debt (32) 78 862 1,311 1,258
Net gearing
(%) nc 7.5 39.1 52.9 44.5 Source: Company, Bahana estimates
COGS includes around 5%
marketing expenses …
… which, if re-classified as
opex, would boost 2015-17F
gross margins to 34-35%
levels
To support its expansion
plans, we expect PPRO to
obtain additional funding …
… while maintaining healthy
gearing levels at around 50%
in 2016
16 June 2015
Bahana Securities – Equity Research – PPRO IJ
2014
Finance Asia's
Best
Equity House
Alpha
Southeast Asia
2014 Best
Research Call
FMCG Sector
Asiamoney's
2013
Best Domestic
Equity House
2015
Institutional
Investors Highest
Research
Ranked Local
House
2015 expansion plans
In 2015, PPRO’s funds raised through its IPO are planned to be used as follows:
1. 15% would be utilized towards working capital requirements for funding
ongoing construction at its existing projects;
2. 10% for partial repayment of PPRO’s IDR244bn loan from PTPP, which was
provided to facilitate construction of Park Hotel Jakarta and Park Hotel Bandung
as well as for working capital requirements; and
3. 75% for investments with breakdown as below:
a. 27% for construction of new malls and commercial areas on its Bekasi and
Surabaya land banks, as well as acquisition of an existing mall in
Kalimantan;
b. 23% for acquiring land parcels for its future projects, most of which would
be in Greater Jakarta, but could also include land in developing areas in
Central Java, East Java, West Java and Bali;
c. 21% for construction of new hotels across existing land banks, as well as
acquisition of an existing hotel in Kalimantan; and
d. 4% for supporting its subsidiaries’ development activities.
Exhibit 39. Utilization of capital injection
15%
10%
27%
23%
21%4%
75%
Working capital Debt refinancing Malls Land acquisition Hotels Subsidiaries
Source: Company
Valuation: Equity fair value of IDR3,466bn
Our estimated fair value for PPRO (exhibit 3) is based on 50% discount to PPRO’s
2015F NAV, which we arrived at using market value-based RNAV for PPRO’s land
banks and DCF-based valuation for its high-rise and recurring projects applying
12.6% WACC. This is lower than the average sector discount to NAV of 60%, due to
PPRO’s relatively lower exposure to taxation risks. This translates to an equity value
of IDR3,466bn or IDR250 per share. Currently, PPRO is trading at an attractive 7.4x
2015F earnings, a 45.2% discount to sector P/E of 13.5x (exhibit 40).
We expect IDR1.3tn capital
injection this year to fund
PPRO’s expansion activities
… of which investments
would account for 75%, most
of which would be evenly
distributed for land
acquisition, construction of
new hotels and malls as well
as acquisition of a hotel and
mall in Kalimantan
Based on 50% discount to
2015 NAV, we arrive at our
equity fair value per share of
IDR250
16 June 2015
Bahana Securities – Equity Research – PPRO IJ
2014
Finance Asia's
Best
Equity House
Alpha
Southeast Asia
2014 Best
Research Call
FMCG Sector
Asiamoney's
2013
Best Domestic
Equity House
2015
Institutional
Investors Highest
Research
Ranked Local
House
Exhibit 40. P/E peers comparison
Company
Share
price
(IDR)
M. cap
(IDRb)
Net
profit
growth
(%)
2015F
P/E
(x)
Target
Price
(IDR)
Discount
to NAV
at TP(%)
BSDE 1,615 31,083 (31.2) 11.8 2,020 60
LPKR 1,115 25,732 (39.6) 16.5 1,000 60
PWON 389 18,734 (13.1) 8.6 425 60
SMRA 1,620 23,371 (19.3) 20.8 1,600 60
CTRA 1,205 18,275 0.6 13.7 1,400 60
ASRI 505 9,923 17.9 7.7 720 60
APLN 336 6,888 (13.8) 9.3 380 60
CTRP 570 3,506 (16.9) 10.7 790 55
PPRO 156 2,191 180.7 7.4 250 50
Avg. (market-cap weighted)
(16.1) 13.5
Discount (%) 45.2
Source: Bahana estimates, share prices as of 15 June 2015
7.4x 2015F P/E, around
45.2% discount to sector’s
average P/E
16 June 2015
Bahana Securities – Equity Research – PPRO IJ
2014
Finance Asia's
Best
Equity House
Alpha
Southeast Asia
2014 Best
Research Call
FMCG Sector
Asiamoney's
2013
Best Domestic
Equity House
2015
Institutional
Investors Highest
Research
Ranked Local
House
MANAGEMENT PROFILE Name & current position Industry experience (current & previous) Relevant
work exp.
(years)
Board of Commissioners
1. Betty Ariana
President
Commissioner
Joined PTPP in 1980 in one of its branch offices and held
various posts before becoming Assistant to the President
Director in 2004 and Corporate Secretary in 2006. She was
appointed as PPRO’s President Commissioner in 2013. Betty
graduated from ITS with a Civil Engineering degree and a
Master of Engineering from Universitas Indonesia.
33
2. Mohammad Farela
Independent
Commissioner
Prior to being appointed as PPRO’s Independent Commissioner
in 2013, Mohammad has been part of the Attorney General’s
office since 1973. He currently also serves as a Functional
Prosecutor for the Attorney General’s office. He obtained his
Bachelor Law from Universitas Islam Indonesia and Master of
Law from Universitas Indonesia.
32
Total relevant work experience (years) 65
Average relevant work experience (years) 33
Name & current position Industry experience (current & previous) Relevant
work exp.
(years)
Board of Directors
1. Galih Praharanto ,
President Director
Joined PTPP as site engineer in 1988 before rising the ranks to
become the head of PTPP’s property Division in 2012. He was
appointed as PPRO’s President Director in 2013. Galih majored
in Civil Engineering, from Institut Teknologi Bandung and
Master of Construction Management from the University of
New South Wales.
27
2. Indaryanto,
Director
Joined PTPP as Finance Manager in 1984. He was PTPP’s Head
of Accounting before being appointed as one of PPRO’s
directors in 2013. Indaryanto graduated from Universitas
Gajah Mada in 1983 with a Bachelor of Accounting degree and
pursued his further education at ADL Management Education
Institute in Boston, Massachusetts.
30
3. Galih Saksono
Director
Joined PTPP as a site engineer in 1991 before being appointed
as General Manager of PTPP’s property division in 2013. He
was appointed as PPRO’s Director in 2013. Galih majored in
Civil Engineering from Universitas Diponegoro and MBA from
Universitas Gajah Mada.
21
4. Giyoko Surahmat
Independent
Director
Joined PTPP in 1980 as Project Manager before being a part of
PTPP’s Engineering and Risk Management Division in 2011. He
was appointed as PPRO’s Independent Director in 2015.
Giyoko majored in Civil Engineering from Universitas Gajah
Mada and Master of Civil Engineering from Institut Teknologi
Bandung.
35
Total relevant work experience (years) 113
Average relevant work experience (years) 28
16 June 2015
Bahana Securities – Equity Research – PPRO IJ
2014
Finance Asia's
Best
Equity House
Alpha
Southeast Asia
2014 Best
Research Call
FMCG Sector
Asiamoney's
2013
Best Domestic
Equity House
2015
Institutional
Investors Highest
Research
Ranked Local
House
INVESTMENT RISKS
Policy risks - tax revisions
On 30 April 2015, the Finance Minister issued Minister of Finance No.
90/PMK.03/2015 which reduced threshold for 5% income tax on sales of super luxury
goods (PPh22) to: IDR5bn or 400sqm in building area for landed houses, and IDR5bn
or 150sqm in space for apartments. We think the impact from these taxes should be
minimal, given it is deductible from annual income tax payments, and its only 5% of
each unit’s sale price. However, this renders property threshold under the luxury
goods VAT (PPNBM) to be under IDR5bn as well as under 400sqm in building area for
houses and 150sqm for apartments. Our channel checks suggest that the Finance
Ministry is considering to lower PPNBM’s thresholds to IDR3-5bn. Although these
would be more conducive for the property sector than the IDR1.5bn (apartments) and
IDR1.2bn (houses) we were told of previously, these thresholds remain uncertain,
and the policy overhang for the property sector as a whole remains.
Licensing hurdles
Indonesian property developers face regulatory hurdles when it comes to obtaining
development licenses, which could be arduous and extremely time consuming.
Furthermore, the current Jakarta’s governor, Ahok, has been known to be less-than-
generous in handing KLB coefficients. Although PPRO has managed to secure higher-
than-average KLBs across its projects, it may face insufficient KLBs as it expands
inwards into Jakarta’s metropolitan area going forward. Despite its status as an SOE,
PPRO’s management stated that they do not expect this to provide the company an
edge over other industry players in terms of securing the necessary licenses for its
development requirements.
Competition from other developers
Branding has been known to be crucial in the property sector as it determines
developers’ integrity, building quality, regular maintenance of facilities, ease of
obtaining mortgage loans as well as potential secondary market competition from
developers’ new launches. Being a relatively new full-fledged developer, PPRO faces
risk of buyers preferring property offerings from other more popular and well-
established developers.
Slower demand from higher interest rates
Being an interest-rate sensitive sector, property developers face risk of demand
slowing amid a high interest-rate operating environment. The US Federal Reserve has
plans to raise its benchmark interest rate sometime this year, and it is possible that
Bank Indonesia (BI) would also react by raising its benchmark BI rate in order to
counteract likely fund outflows from local markets.
Executions risks
While its forward development concepts are innovative, PPRO lacks the track record
to prove its ability to deliver such concepts, as to-date none of its futuristic
developments has been completed. In addition, many of its ambitious projects would
be the first of its kinds in Indonesia, creating uncertainties not only for buyers but will
also the ability of the company to complete these unprecedented projects. In this
regard, PPRO faces risks that its projects may not meet customers’ standards,
causing disappointments among customers, which could in turn pose additional
challenges in selling company’s future portfolio launches.
Despite the recent
developents, uncertainty on
policy risks remain for the
sector
Obtaining development
licenses is a well-known
issue for developers
Other more well-known
developers could prevent
PPRO from gaining market
share
Higher interest rates would
normally erode demand for
real estate
PPRO’s ambitious projects
could pose risks for its
development in not meeting
standards
16 June 2015
Bahana Securities – Equity Research – PPRO IJ
2014
Finance Asia's
Best
Equity House
Alpha
Southeast Asia
2014 Best
Research Call
FMCG Sector
Asiamoney's
2013
Best Domestic
Equity House
2015
Institutional
Investors Highest
Research
Ranked Local
House
Margin erosion from fluctuations in prices of building materials
With its project portfolio consisting mostly of high-rise buildings, with building
materials accounting for a larger proportion of COGS (around 60%), PPRO runs risks
of contracting margins with increases in prices of building materials. This is especially
more prominent for PPRO as it is already earning a lower-than-industry average gross
margins on the back of its low price strategy.
Foreign exchange volatility
Amid a volatile currency environment, PPRO faces foreign exchange risks as it does
not earn USD-based revenues, while some 25% of its COGS are USD-linked.
Nevertheless, such risks are mitigated by PPRO’s contracts with its builders which
stipulate fluctuations in building costs within 10% of initial agreed amount to be
borne by the contractors. We note, however, that in the event that the IDR
depreciates by more than 10%, we estimate that gross profit would be eroded by
7.2% and net profit by 10.1%, and for every additional 1% depreciation, PPRO’s
gross profit and net profit would dip by additional 0.66% and 0.93% respectively.
Rising costs could pressurize
earnings, particularly given a
low pricing strategy
Once the built-in protection
threshold within the
contracts are broken, every
1% IDR weakness against
the USD could mean 0.93%
erosion in bottom line
16 June 2015
Bahana Securities – Equity Research – PPRO IJ
2014
Finance Asia's
Best
Equity House
Alpha
Southeast Asia
2014 Best
Research Call
FMCG Sector
Asiamoney's
2013
Best Domestic
Equity House
2015
Institutional
Investors Highest
Research
Ranked Local
House
INDUSTRY ANALYSIS
Marketing sales rebound post elections
Post the presidential and legislative elections and political tension in 2014, recent
trends have shown improving take-up rates across developers, evidenced by
significant oversubscriptions at several launches. Apartment sales data compiled by
Jones Lang Lasalle (JLL) supports this trend, indicating 3Q14 and 4Q14 apartment
sales matching euphoric 2H12 and 1H13 levels. JLL also found that 2014 apartment
take-up was at a record 16,961 units, significantly higher than the next highest
period in 2013.
Exhibit 41. Quarterly apartment sales, 1Q11-4Q14
0
500
1000
1500
2000
2500
3000
3500
4000
4500
5000
1Q11 2Q11 3Q11 4Q11 1Q12 2Q12 3Q12 4Q12 1Q13 2Q13 3Q13 4Q13 1Q14 2Q14 3Q14 4Q14
Source: Jones Lang Lasalle
Exhibit 42. Apartment take-up, 2004-14
0
2000
4000
6000
8000
10000
12000
14000
16000
18000
2004 2005 2006 2007 2008 2009 2010 2011 2012 2013 2014
Source: Jones Lang Lasalle
Housing deficit: Currently at 13.6mn homes
According to the World Bank, Indonesia currently faces an estimated housing backlog
of 15mn homes, with the shortage increasing by 300-400k homes annually. This
number is set to grow with Indonesia’s rising middle class, increasing urbanization
and strong GDP growth. In light of this, the government is planning to implement its
“one million housing program” (program satu juta rumah) through which it aims to
build a million houses over 2 years in order to bolster housing construction, in
particular to help the low-income population. The program is expected to commence
in April 2015. It would involve state-owned developer Perumnas, regional
governments, the national government, BPJS as well as private sector developers.
Marketing sales recovering
across sector post political
tensions in 2014…
… with apartment sales in
2H14 having exceeded 2H12-
1H13’s highs, …
… translating into a record
year for apartment sales in
2014
Large housing backlog
presents upside for property
developers …
16 June 2015
Bahana Securities – Equity Research – PPRO IJ
2014
Finance Asia's
Best
Equity House
Alpha
Southeast Asia
2014 Best
Research Call
FMCG Sector
Asiamoney's
2013
Best Domestic
Equity House
2015
Institutional
Investors Highest
Research
Ranked Local
House
Exhibit 43. Housing affordability
(IDR) Middle-low Middle Middle-up
Annual income/household 50,400,000 100,800,000 181,440,000
Monthly income/household 4,200,000 8,400,000 15,120,000
Housing price 210,000,000 550,000,000 1,250,000,000
Mortgage 147,000,000 385,000,000 875,000,000
Monthly installment 1,275,700 3,341,119 7,593,453
Debt-to-income ratio (%) 30% 40% 50%
Initial teaser rate pa (%) 8.50% 8.50% 8.50%
Floating rate of 13.50%
Monthly installment 1,774,841 4,648,393 10,564,528
Debt-to-income ratio (%) 42% 55% 70%
Change in installment (%) 39% 39% 39%
Source: Bahana estimates
Exhibit 44. Population by income segment, 2012 & 2020F
65.4
44.4
41.6
23.2
6.6
2.5
64.5
28.3
47.9
50.5
68.2
49.2
16.5
6.9Elite
Affluent
Upper Middle
Middle
Emerging Middle
Aspirant
Poor
Indonesian population,
2012 (millions)Indonesian population,
2020 (millions)
74 million MACs in 2012 141 million MACs in 2020
Source: Statistics Indonesia
Greater mortgage availability
Due to major mortgage run-offs in 2014 (15% on average; highest being 25% at
market leader Bank Central Asia (BBCA)), greater mortgage availability lies ahead as
banks seek to replenish paid off mortgages. In February 2015, BBCA, the largest
private sector mortgage lender with 15% share, cut its mortgage rate to 8.8% for the
first 3 years, before rising to 9.9% for years 4 and 5 (average annual: 9.24%), from
previously 9.75% flat rate. Following BBCA’s cut, other banks are likely to follow to
remain competitive. Furthermore, sector-wide loan-to-deposit ratio (LDR) stood at
89.9%, lower than the 92% cap by OJK, allowing banks room to maneuver loan
disbursements. Lastly, despite higher mortgages, Indonesia’s low 2014 mortgage-to-
GDP ratio of 3.2% shows potential for robust mortgage growth ahead.
Exhibit 45. LDR and loan growth, 2007-14
80.1 84.7 90.6 89.9 89.2 89.0 88.9 88.8
24.122.6
21.5
11.4
14.715.2 15.5 15.7
0
50
100
150
200
0
5
10
15
20
25
2011 2012 2013 2014 2015F 2016F 2017F 2018F
(%)(%)
LDR (RHS) Loan growth y-y
Source: Bank Indonesia, Bahana estimates
… which is supported by a
growing middle class …
… forecast to reach 68mn by
2020 from 42mn in 2012
Major mortgage run-offs in
2014 have caused aggressive
mortgage seeking among
banks …
… facilitated by LDR levels
which are below the 92%
cap level …
16 June 2015
Bahana Securities – Equity Research – PPRO IJ
2014
Finance Asia's
Best
Equity House
Alpha
Southeast Asia
2014 Best
Research Call
FMCG Sector
Asiamoney's
2013
Best Domestic
Equity House
2015
Institutional
Investors Highest
Research
Ranked Local
House
Exhibit 46. Mortgage to GDP, 2007-14
2.1 2.2 2.2 2.3
2.7 2.9
3.4 3.2
0.0
0.5
1.0
1.5
2.0
2.5
3.0
3.5
4.0
1905 2008 2009 2010 2011 2012 2013 Dec-14
%
Mortgage/GDP
Source: Bahana, IMF
Revisions to Property tax regulations
As mentioned above, while the impact of the Finance Minister’s decision to lower
thresholds for property under PPh22 should, in our view, be minimal, this means that
the thresholds under the upcoming PPNBM revision would be under the afore-
mentioned IDR5bn in price as well as 400sqm for houses and 150sqm for apartments,
as PPh22 is for “super luxury goods” while PPNBM taxes “luxury goods”. Our channel
checks suggest that the Minister is considering IDR3-4bn for PPNBM threshold, and
they are also considering implementing a progressive rates system rather than
charging a 20% flat rate on all properties exceeding the thresholds. While these
measures would not impact the property sector as severely as the proposed
thresholds we were told of previously (IDR1.2bn for houses and IDR1.5bn for
apartments), the thresholds are still uncertain and the overhang remains on the
property sector.
Exhibit 47. Current tax threshold – Income Tax Law Article 22 (PPh22)
Former Current
Houses Houses
-IDR10bn and 500sqm in building area -IDR5bn or 400sqm in building area
Apartments, shophouses Apartments, shophouses
-IDR10bn and/or 400sqm in building area
-IDR5bn or 150sqm in building area
Source: Ministry of Finance
Exhibit 48. Proposed tax threshold – Luxury Goods Tax (PPNBM)
Current Proposed
Houses Houses
-350sqm in building area -TBA; but under IDR5bn or 400sqm in building area
Apartments, shophouses Apartments, shophouses
-150sqm in space -TBA; but IDR5bn or 150sqm in building area
Source: Ministry of Finance
… as well as low mortgage
penetration of 3.2% to GDP
in 2014
On 30 April 2015, the
Finance Minister issued
Minister of Finance
Regulation No.
90/PMK.03/2015, …
… lowering property
thresholds under PPh22
Property thresholds under
PPNBM should not exceed
those under PPh22
Research: +62 21 250 5081
Andre Natala Susanto
[email protected] Associate
ext 3601
Chandra Widjanarka
[email protected] Analyst
ext 1252
Harry [email protected]
Senior Associate DirectorHead of Research
Strategy, Consumer
ext 3600direct: +62 21 250 5735
Dealing Room: +62 21 527 0808 (Foreign Institutional)
Teguh Hartanto
[email protected] Director
Deputy Head of Research
Banks, Cement, Aviationext 3610
Leonardo Henry Gavaza, [email protected]
Senior Research ManagerAuto, Heavy equipment, Telco
ext 3608
Chandra Widjanarka
[email protected] Analyst
ext 1252
+62 21 250 5508 (Domestic Institutional)
Ashish Agrawal
[email protected] President
Institutional Equity Salesext 2550 / 2553
Reynard Poernawan
[email protected] Equity Sales
ext 2528
John M. Dasaad
[email protected] Sales
ext 2549
Yohanes Adhi Handoko
[email protected], Surabaya Branch
ext 7250
Suwardi Widjaja
[email protected] Sales
ext 2548
Amelia Husada
[email protected] President
Institutional Equity Salesext 2552
Michael W Setjoadi [email protected]
Research AnalystConsumer, Poultry
ext 3613
Nurul Farida
[email protected] Sales
ext 2543
Adrian Mahendra Putra
[email protected] AnalystIndustrial Estate
ext 3614
Hanna Marionda
[email protected] Trader
ext 2525
Adriana Kosasih
[email protected] Executive
ext 2541
Ari Santosa
[email protected] Trader
ext 2554
Adi Saputra
[email protected] Associate
ext 3693
Robin Sutanto
[email protected] Analyst
Propertyext 3620
Agustinus Reza Kirana
[email protected] AnalystTransportation
ext 3616
Wendy [email protected]
Research AnalystConsumer, Media
ext 3606
Research AnalystCement, Infratructure,Toll roads
ext 3605
Muhammad Wafi
[email protected] Analyst
ext 3609
+62 31 535 2788 (Surabaya Branch)
Arandi [email protected]
Research AnalystCoal, Metals, Oil & Gas
ext 3619
Head of Equity Sales & TradingInstitutional Equity Sales
ext 2545
Made Ayu Wijayati
[email protected] Executive
ext 3607
Sanni Satrio Dwi Utomo
[email protected] Associate
ext 3611
Andre Natala Susanto
[email protected] Associate
ext 3601
Zefanya Halim
[email protected] Manager
ext 3612
Novianty Permata Sari
ext 3618
Bagus Adi Yoga Prawira
[email protected] Associate
ext 3604
Head Office Surabaya Branch
Graha Niaga, 19th Floor Wisma BII, Ground Floor
Jl. Jend. Sudirman Kav. 58 Jl. Pemuda 60-70
Jakarta 12190 Surabaya 60271
Indonesia Indonesia
Tel. 62 21 250 5081 Tel. 62 31 535 2788
Fax. 62 21 522 6049 http://www.bahana.co.id Fax. 62 31 546 1157
Disclaimer This publication is prepared by PT.Bahana Securities and reviewed by Daiwa Securities Group Inc. and/or its affiliates, and distributed outside Indonesia by Daiwa Securities Group Inc. and/or its affiliates, except to the extent expressly provided herein. Certain copies of this publication may be distributed inside and outside of Indonesia by PT. Bahana Securities in accordance with relevant laws and regulations. This publication and the contents hereof are intended for information purposes only, and may be subject to change without further notice. Any use, disclosure, distribution, dissemination, copying, printing or reliance on this publication for any other purpose without our prior consent or approval is strictly prohibited. Any review does not constitute a full verification of the publication and merely provides a minimum check. Neither Daiwa Securities Group Inc. nor any of its respective parent, holding, subsidiaries or affiliates, nor any of its respective directors, officers, servants and employees, represent nor warrant the accuracy or completeness of the information contained herein or as to the existence of other facts which might be significant, and will not accept any responsibility or liability whatsoever for any use of or reliance upon this publication or any of the contents hereof. Neither this publication, nor any content hereof, constitute, or are to be construed as, an offer or solicitation of an offer to buy or sell any of the securities or investments mentioned herein in any country or jurisdiction nor, unless expressly provided, any recommendation or investment opinion or advice. Any view, recommendation, opinion or advice expressed in this publication constitutes the views of the analyst(s) named herein and does not necessarily reflect those of Daiwa Securities Group Inc. and/or its affiliates nor any of its respective directors, officers, servants and employees except where the publication states otherwise. This research report is not to be relied upon by any person in making any investment decision or otherwise advising with respect to, or dealing in, the securities mentioned, as it does not take into account the specific investment objectives, financial situation and particular needs of any person.
Neither Daiwa Securities Group Inc. nor any of its affiliates is licensed to undertake any business within the Republic of Indonesia. Any display of any trade name or logo of the Daiwa Securities Group Inc. on this publication shall not be deemed to be an undertaking of any business within the Republic of Indonesia.
Daiwa Securities Group Inc., its subsidiaries or affiliates, or its or their respective directors, officers and employees from time to time may have trades as principals, or have positions in, or have other interests in the securities of the company under research including derivatives in respect of such securities or may have also performed investment banking and other services for the issuer of such securities. The following are additional disclosures.
Japan
Daiwa Securities Co. Ltd. and Daiwa Securities Group Inc.
Daiwa Securities Co. Ltd. is a subsidiary of Daiwa Securities Group Inc.
Investment Banking Relationship
Within the preceding 12 months, The subsidiaries and/or affiliates of Daiwa Securities Group Inc. * has lead-managed public offerings and/or secondary offerings (excluding straight bonds) of the securities of the following companies: Modern Land (China) Co. Ltd (1107 HK econtext Asia Ltd (1390 HK); Rexlot Holdings Ltd (555 HK); Neo Solar Power Corp (3576 TT); Accordia Golf Trust (AGT SP); Hua Hong Semiconductor Ltd (1347 HK); GF Securities Co Ltd (1776 HK).
*Subsidiaries of Daiwa Securities Group Inc. for the purposes of this section shall mean any one or more of:
• Daiwa Capital Markets Hong Kong Limited (大和資本市場香港有限公司)
• Daiwa Capital Markets Singapore Limited
• Daiwa Capital Markets Australia Limited
• Daiwa Capital Markets India Private Limited
• Daiwa-Cathay Capital Markets Co., Ltd.
• Daiwa Securities Capital Markets Korea Co., Ltd
Disclosure of Interest of Bahana Securities
Investment Banking Relationship
Within the preceding 12 months, Bahana Securities has lead-managed public offerings and/or secondary offerings (excluding straight bonds) of the securities of the following companies: PT Telekomunikasi Indonesia (Persero) Tbk (TLKM IJ); J Resources Asia Pasific Tbk PT (PSAB IJ)
Hong Kong
This research is distributed in Hong Kong by Daiwa Capital Markets Hong Kong Limited (大和資本市場香港有限公司) (“DHK”) which is regulated by the Hong Kong Securities and Futures Commission. Recipients of this research in Hong Kong may contact DHK in respect of any matter arising from or in connection with this research.
Ownership of Securities
For “Ownership of Securities” information, please visit BlueMatrix disclosure Link at https://daiwa3.bluematrix.com/sellside/Disclosures.action.
Investment Banking Relationship
For “Investment Banking Relationship”, please visit BlueMatrix disclosure Link at https://daiwa3.bluematrix.com/sellside/Disclosures.action.
Relevant Relationship (DHK)
DHK may from time to time have an individual employed by or associated with it serves as an officer of any of the companies under its research coverage.
DHK market making
DHK may from time to time make a market in the securities covered by this research.
Singapore
This research is distributed in Singapore by Daiwa Capital Markets Singapore Limited and it may only be distributed in Singapore to accredited investors, expert investors and institutional investors as defined in the Financial Advisers Regulations and the Securities and Futures Act (Chapter 289), as amended from time to time. By virtue of distribution to these category of investors, Daiwa Capital Markets Singapore Limited and its representatives are not required to comply with Section 36 of the Financial Advisers Act (Chapter 110) (Section 36 relates to disclosure of Daiwa Capital Markets Singapore Limited’s interest and/or its representative’s interest in securities). Recipients of this research in Singapore may contact Daiwa Capital Markets Singapore Limited in respect of any matter arising from or in connection with the research.
Australia
This research is distributed in Australia by Daiwa Capital Markets Stockbroking Limited and it may only be distributed in Australia to wholesale investors within the meaning of the Corporations Act. Recipients of this research in Australia may contact Daiwa Capital Markets Stockbroking Limited in respect of any matter arising from or in connection with the research.
Ownership of Securities
For “Ownership of Securities” information, please visit BlueMatrix disclosure Link at https://daiwa3.bluematrix.com/sellside/Disclosures.action.
India
This research is distributed by Daiwa Capital Markets India Private Limited (DAIWA) which is an intermediary registered with Securities & Exchange Board of India. This report is not to be considered as an offer or solicitation for any dealings in securities. While the information in this report has been compiled by DAIWA in good faith from sources believed to be reliable, no representation or warranty, express of implied, is made or given as to its accuracy, completeness or correctness. DAIWA its officers, employees, representatives and agents accept no liability whatsoever for any loss or damage whether direct, indirect, consequential or otherwise howsoever arising (whether in negligence or otherwise) out of or in connection with or from any use of or reliance on the contents of and/or omissions from this document. Consequently DAIWA expressly disclaims any and all liability for, or based on or relating to any such information contained in or errors in or omissions in this report. Accordingly, you are recommended to seek your own legal, tax or other advice and
should rely solely on your own judgment, review and analysis, in evaluating the information in this document. The data contained in this document is subject to change without any prior notice DAIWA reserves its right to modify this report as maybe required from time to time. DAIWA is committed to providing independent recommendations to its Clients and would be happy to provide any information in response to any query from its Clients. This report is strictly confidential and is being furnished to you solely for your information. The information contained in this document should not be reproduced (in whole or in part) or redistributed in any form to any other person. We and our group companies, affiliates, officers, directors and employees may from time to time, have long or short positions, in and buy sell the securities thereof, of company(ies) mentioned herein or be engaged in any other transactions involving such securities and earn brokerage or other compensation or act as advisor or have the potential conflict of interest with respect to any recommendation and related information or opinion. DAIWA prohibits its analyst and their family members from maintaining a financial interest in the securities or derivatives of any companies that the analyst cover. This report is not intended or directed for distribution to ,or use by any person, citizen or entity which is resident or located in any state or country or jurisdiction where such publication, distribution or use would be contrary to any statutory legislation, or regulation which would require DAIWA and its affiliates/ group companies to any registration or licensing requirements. The views expressed in the report accurately reflect the analyst’s personal views about the securities and issuers that are subject of the Report, and that no part of the analyst’s compensation was, is or will be directly or indirectly, related to the recommendations or views expressed in the Report. This report does not recommend to US recipients the use of Daiwa Capital Markets India Private Limited or any of its non – US affiliates to effect trades in any securities and is not supplied with any understanding that US recipients will direct commission business to Daiwa Capital Markets India Private Limited.
Taiwan
This research is distributed in Taiwan by Daiwa-Cathay Capital Markets Co., Ltd and it may only be distributed in Taiwan to institutional investors or specific investors who have signed recommendation contracts with Daiwa-Cathay Capital Markets Co., Ltd in accordance with the Operational Regulations Governing Securities Firms Recommending Trades in Securities to Customers. Recipients of this research in Taiwan may contact Daiwa-Cathay Capital Markets Co., Ltd in respect of any matter arising from or in connection with the research.
Philippines
This research is distributed in the Philippines by DBP-Daiwa Capital Markets Philippines, Inc. which is regulated by the Philippines Securities and Exchange
Commission and the Philippines Stock Exchange, Inc. Recipients of this research in the Philippines may contact DBP-Daiwa Capital Markets Philippines, Inc.
in respect of any matter arising from or in connection with the research. DBP-Daiwa Capital Markets Philippines, Inc. recommends that investors
independently assess, with a professional advisor, the specific financial risks as well as the legal, regulatory, tax, accounting, and other consequences of a proposed transaction. DBP-Daiwa Capital Markets Philippines, Inc. may have positions or may be materially interested in the securities in any of the markets
mentioned in the publication or may have performed other services for the issuers of such securities.
For relevant securities and trading rules please visit SEC and PSE Link at http://www.sec.gov.ph/irr/AmendedIRRfinalversion.pdf and
http://www.pse.com.ph/ respectively.
United Kingdom
This research report is produced by Daiwa Capital Markets Europe Limited and/or its affiliates and is distributed in the European Union, Iceland, Liechtenstein, Norway and Switzerland. Daiwa Capital Markets Europe Limited is authorised and regulated by The Financial Conduct Authority (“FCA”) and is a member of the London Stock Exchange, Eurex and NYSE Liffe. Daiwa Capital Markets Europe Limited and/or its affiliates may, from time to time, to the extent permitted by law, participate or invest in other financing transactions with the issuers of the securities referred to herein (the “Securities”), perform services for or solicit business from such issuers, and/or have a position or effect transactions in the Securities or options thereof and/or may have acted as an underwriter during the past twelve months for the issuer of such securities. In addition, employees of Daiwa Capital Markets Europe Limited and/or its affiliates may have positions and effect transactions in such securities or options and may serve as Directors of such issuers. Daiwa Capital Markets Europe Limited may, to the extent permitted by applicable UK law and other applicable law or regulation, effect transactions in the Securities before this material is published to recipients.
This publication is intended for investors who are not Retail Clients in the United Kingdom within the meaning of the Rules of the FCA and should not therefore be distributed to such Retail Clients in the United Kingdom. Should you enter into investment business with Daiwa Capital Markets Europe’s affiliates outside the United Kingdom, we are obliged to advise that the protection afforded by the United Kingdom regulatory system may not apply; in particular, the benefits of the Financial Services Compensation Scheme may not be available.
Daiwa Capital Markets Europe Limited has in place organisational arrangements for the prevention and avoidance of conflicts of interest. Our conflict management policy is available at http://www.uk.daiwacm.com/about-us/corporate-governance-regulatory. Regulatory disclosures of investment banking relationships are available at https://daiwa3.bluematrix.com/sellside/Disclosures.action.
Germany
This document is distributed in Germany by Daiwa Capital Markets Europe Limited, Niederlassung Frankfurt which is regulated by BaFin (Bundesanstalt fuer Finanzdienstleistungsaufsicht) for the conduct of business in Germany.
Bahrain
This research material is distributed by Daiwa Capital Markets Europe Limited, Bahrain Branch, regulated by The Central Bank of Bahrain and holds Investment Business Firm – Category 2 license and having its official place of business at the Bahrain World Trade Centre, South Tower, 7th floor, P.O. Box 30069, Manama, Kingdom of Bahrain. Tel No. +973 17534452 Fax No. +973 535113
This material is provided as a reference for making investment decisions and is not intended to be a solicitation for investment. Investment decisions should be made at your own discretion and risk. Accordingly, no representation or warranty, express or implied, is made as to and no reliance should be placed on the fairness, accuracy, completeness or correctness of the information and opinions contained in this document, Content herein is based on information available at the time the research material was prepared and may be amended or otherwise changed in the future without notice. All information is intended for the private use of the person to whom it is provided without any liability whatsoever on the part of Daiwa Capital Markets Europe Limited, Bahrain Branch, any associated company or the employees thereof. If you are in doubt about the suitability of the product or the research material itself, please consult your own financial adviser. Daiwa Capital Markets Europe Limited, Bahrain Branch retains all rights related to the content of this material, which may not be redistributed or otherwise transmitted without prior consent.
United States
This report is distributed in the U.S. by Daiwa Capital Markets America Inc. (DCMA). It may not be accurate or complete and should not be relied upon
as such. It reflects the preparer’s views at the time of its preparation, but may not reflect events occurring after its preparation; nor does it reflect
PT.Bahana Securities’ or DCMA’s views at any time. Neither PT.Bahana Securities, DCMA nor the preparer has any obligation to update this report
or to continue to prepare research on this subject. This report is not an offer to sell or the solicitation of any offer to buy securities. Unless this report says otherwise, any recommendation it makes is risky and appropriate only for sophisticated speculative investors able to incur significant losses.
Readers should consult their financial advisors to determine whether any such recommendation is consistent with their own investment objectives,
financial situation and needs. This report does not recommend to U.S. recipients the use of any of PT.Bahana Securities’ or DCMA’s non-U.S.
affiliates to effect trades in any security and is not supplied with any understanding that U.S. recipients of this report will direct commission business to
such non-U.S. entities. Unless applicable law permits otherwise, non-U.S. customers wishing to effect a transaction in any securities referenced in this
material should contact a Daiwa entity in their local jurisdiction. Most countries throughout the world have their own laws regulating the types of
securities and other investment products which may be offered to their residents, as well as a process for doing so. As a result, the securities
discussed in this report may not be eligible for sales in some jurisdictions. Customers wishing to obtain further information about this report should
contact DCMA: Daiwa Capital Markets America Inc., Financial Square, 32 Old Slip, New York, New York 10005 (telephone 212-612-7000).
Ownership of Securities
For “Ownership of Securities” information please visit BlueMatrix disclosure Link at https://daiwa3.bluematrix.com/sellside/Disclosures.action .
Investment Banking Relationships
For “Investment Banking Relationships” please visit BlueMatrix disclosure link at https://daiwa3.bluematrix.com/sellside/Disclosures.action .
DCMA Market Making
For “DCMA Market Making” please visit BlueMatrix disclosure link at https://daiwa3.bluematrix.com/sellside/Disclosures.action .
Research Analyst Conflicts
For updates on “Research Analyst Conflicts” please visit BlueMatrix disclosure link at https://daiwa3.bluematrix.com/sellside/Disclosures.action. The
principal research analysts who prepared this report have no financial interest in securities of the issuers covered in the report, are not (nor are any
members of their household) an officer, director or advisory board member of the issuer(s) covered in the report, and are not aware of any material
relevant conflict of interest involving the analyst or DCMA, and did not receive any compensation from the issuer during the past 12 months except as noted: no exceptions.
Research Analyst Certification
For updates on “Research Analyst Certification” and “Rating System” please visit BlueMatrix disclosure link at
https://daiwa3.bluematrix.com/sellside/Disclosures.action . The views about any and all of the subject securities and issuers expressed in this
Research Report accurately reflect the personal views of the research analyst(s) primarily responsible for this report (or the views of the firm
producing the report if no individual analysts[s] is named on the report); and no part of the compensation of such analyst(s) (or no part of the
compensation of the firm if no individual analyst[s)] is named on the report) was, is, or will be directly or indirectly related to the specific
recommendations or views contained in this Research Report.
For stocks and sectors in Indonesia covered by Bahana Securities, the following rating system is in effect:
Stock ratings are based on absolute upside or downside, which is the difference between the target price and the current market price. Unless otherwise specified, these ratings are set with a 12-month horizon. It is possible that future price volatility may cause a temporary mismatch between upside/downside for a stock based on the market price and the formal rating. "Buy": the price of the security is expected to increase by 10% or more. "Hold": the price of the security is expected to range from an increase of less than 10% to a decline of less than 5%. "Reduce": the price of the security is expected to decline by 5% or more.
Sector ratings are based on fundamentals for the sector as a whole. Hence, a sector may be rated “Overweight” even though its constituent stocks are all rated “Reduce”; and a sector may be rated “Underweight” even though its constituent stocks are all rated “Buy”. “Overweight”: positive fundamentals for the sector. “Neutral”: neither positive nor negative fundamentals for the sector. “Underweight”: negative fundamentals for the sector.
Ownership of Securities For “Ownership of Securities” information, please visit BlueMatrix disclosure Link at https://daiwa3.bluematrix.com/sellside/Disclosures.action .
Investment Banking Relationships For “Investment Banking Relationship”, please visit BlueMatrix disclosure Link at https://daiwa3.bluematrix.com/sellside/Disclosures.action . Relevant Relationships (Bahana Securities) Bahana Securities may from time to time have an individual employed by or associated with it serves as an officer of any of the companies under its research coverage.
Bahana Securities market making Bahana Securities may from time to time make a market in securities covered by this research.
Additional information may be available upon request.
Japan - additional notification items pursuant to Article 37 of the Financial Instruments and Exchange Law
(This Notification is only applicable where report is distributed by Daiwa Securities Co. Ltd.)
If you decide to enter into a business arrangement with us based on the information described in materials presented along with this document, we ask you to pay close attention to the following items.
In addition to the purchase price of a financial instrument, we will collect a trading commission* for each transaction as agreed beforehand with you. Since
commissions may be included in the purchase price or may not be charged for certain transactions, we recommend that you confirm the commission for
each transaction.
In some cases, we may also charge a maximum of ¥ 2 million (including tax) per year as a standing proxy fee for our deposit of your securities, if you are
a non-resident of Japan.
For derivative and margin transactions etc., we may require collateral or margin requirements in accordance with an agreement made beforehand with
you. Ordinarily in such cases, the amount of the transaction will be in excess of the required collateral or margin requirements. There is a risk that you will incur losses on your transactions due to changes in the market price of financial instruments based on fluctuations in interest
rates, exchange rates, stock prices, real estate prices, commodity prices, and others. In addition, depending on the content of the transaction, the loss
could exceed the amount of the collateral or margin requirements.
There may be a difference between bid price etc. and ask price etc. of OTC derivatives handled by us.
Before engaging in any trading, please thoroughly confirm accounting and tax treatments regarding your trading in financial instruments with such experts
as certified public accountants.
*The amount of the trading commission cannot be stated here in advance because it will be determined between our company and you based on current market conditions and the content of each transaction etc.
When making an actual transaction, please be sure to carefully read the materials presented to you prior to the execution of agreement, and to take responsibility for your own decisions regarding the signing of the agreement with us.
Corporate Name: Daiwa Securities Co. Ltd.
Financial instruments firm: chief of Kanto Local Finance Bureau (Kin-sho) No.108
Memberships: Japan Securities Dealers Association, Financial Futures Association of Japan
Japan Securities Investment Advisers Association
Type II Financial Instruments Firms Association