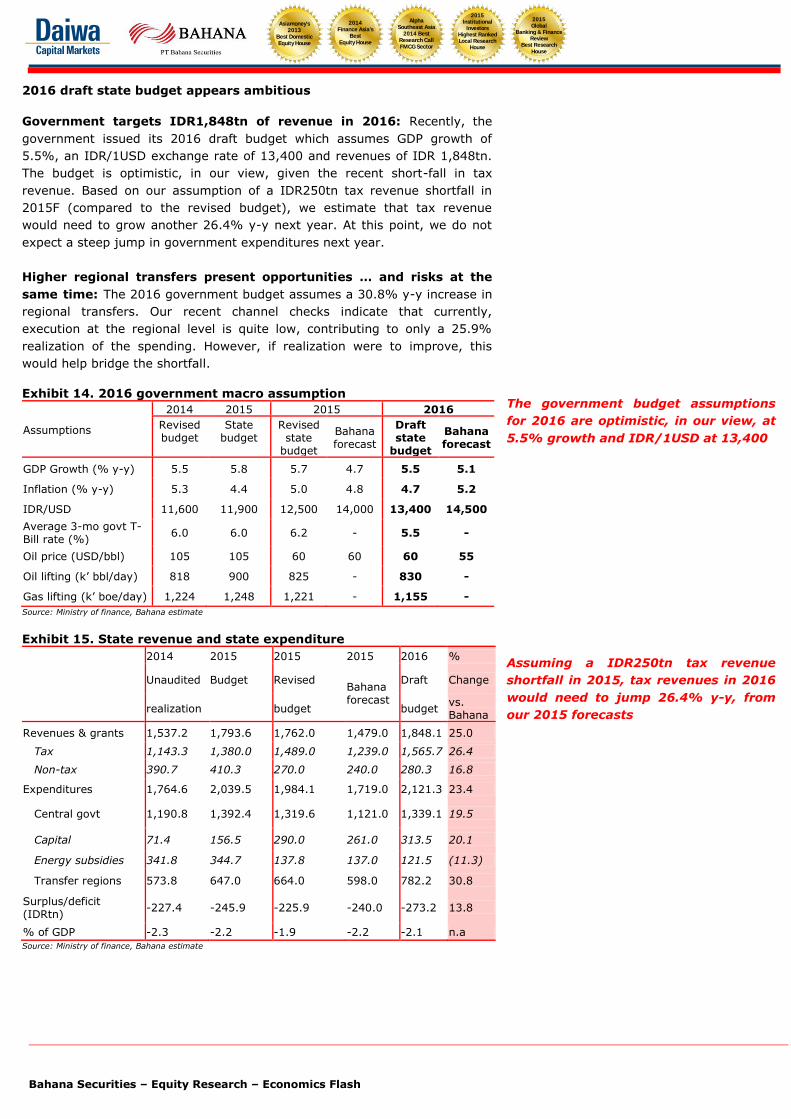
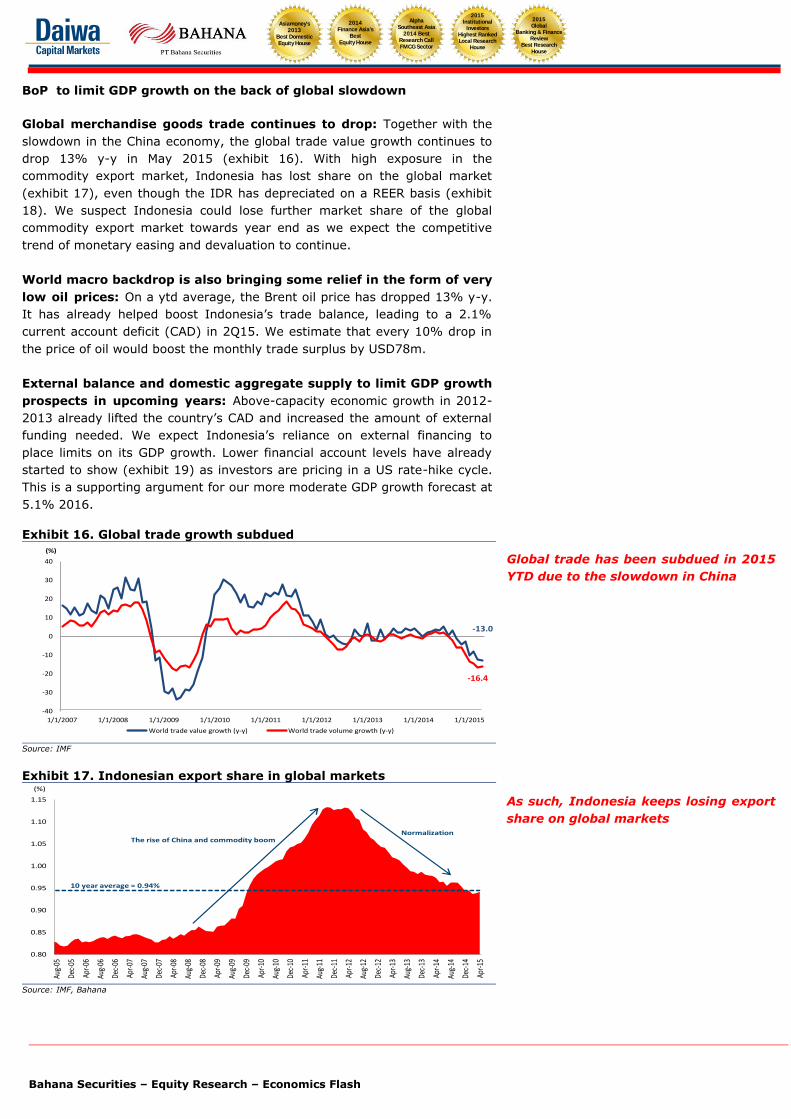
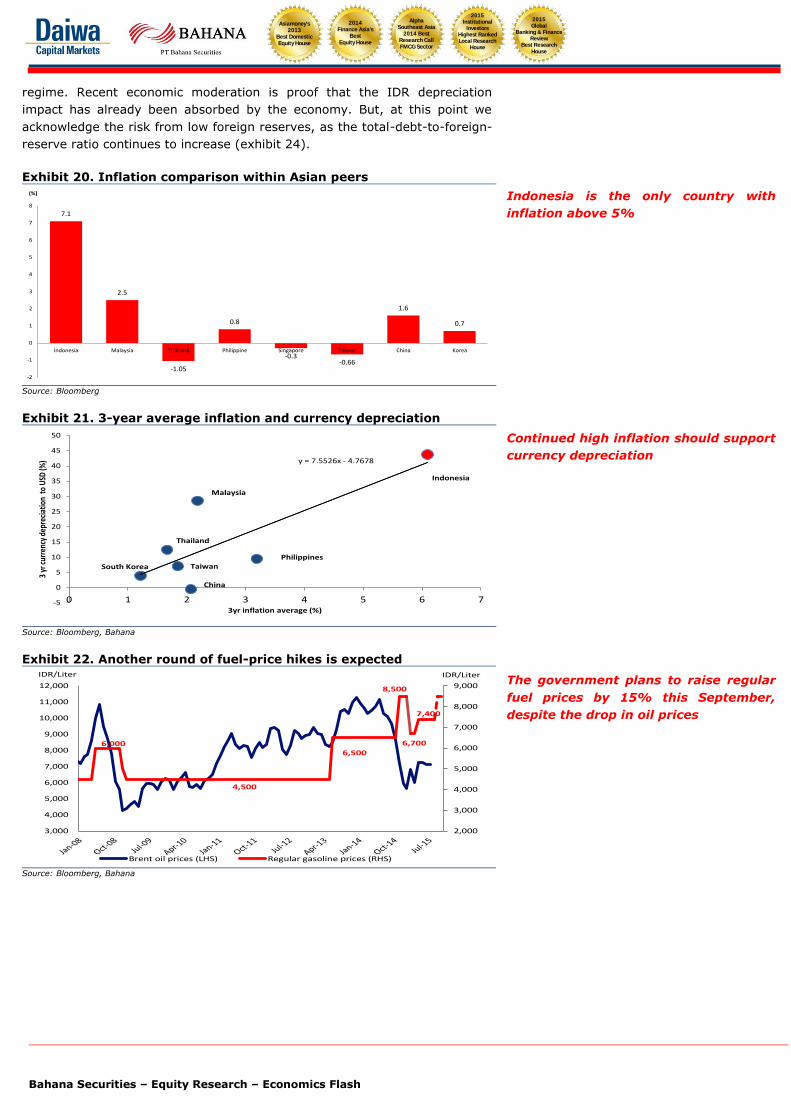
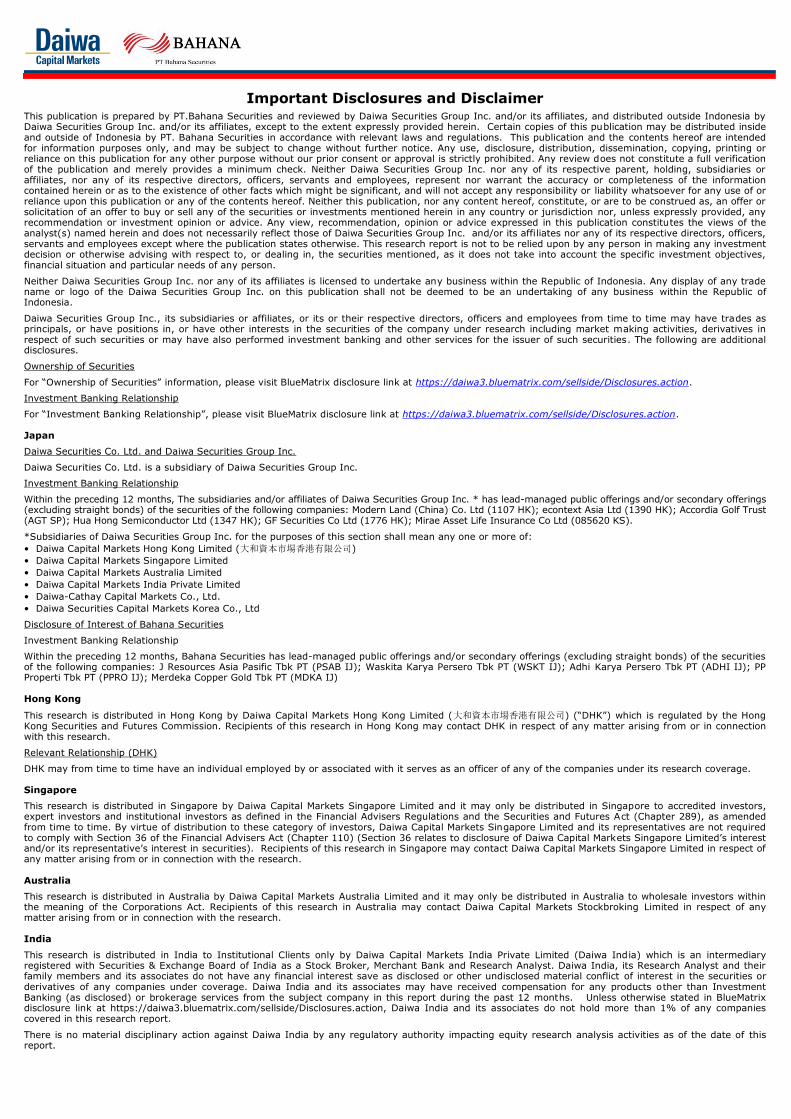
Asiamoney’s 2013 Best Domestic Equity House Economics flash 24 August 2015 Disclosure: Bahana Securities does and seeks to do business with companies covered in its research reports. Investors should consider this report as only a single factor in making their investment decision. Please see the important disclaimer information on the back of this report 2014 Finance Asia's Best Equity House Alpha Southeast Asia 2014 Best Research Call FMCG Sector Asiamoney's 2013 Best Domestic Equity House 2015 Institutional Investors Highest Ranked Local Research House 2015 Global Banking & Finance Review Best Research House Indonesia economic outlook Fakhrul Fulvian Adi Saputra E-mail: [email protected]Email: [email protected]Phone: +6221 2505081 ext. 3602 Phone: +6221 2505081 ext. 3693 Tough times ahead Moderate domestic demand and investment to continue: Private consumption growth of below 5% y-y in 2Q15 and declining imports in July (- 28% y-y) affirm our view of continued weak domestic demand and investment and leads us to make changes to our macro indicators (exhibit 2). The tight monetary policy of the past two years should continue to result in economic moderation through 1Q16. Region-wise, we expect the commodity economy outside of Java to persist with lower growth amid soft commodity prices. At this point, room for a BI rate cut to spur growth still appears limited, as the Indonesia-US real interest rate gap remains small (exhibit 10). Historically, a recovery has often followed a negative output gap by 3-4 quarters (exhibit 5). 2016 state budget draft seems overly optimistic: Last week, the government announced its 2016 state budget plan, which included IDR1,848tn of government revenue (+5% y-y). The target looks high, as assuming a IDR250tn shortfall in 2015, we estimate that tax revenue would have to jump 26.4% y-y in 2016 to achieve the target (exhibit 15). A higher regional transfer portion is an interesting part of the new budget, leading to greater unpredictability in terms of execution risk. Global slowdown, a blessing and a curse: The IMF already cut its 2015 GDP growth forecast for emerging economies to 4.2% from 4.6% in 2014 on lower commodity prices (exhibit 6) and tightening global financial conditions. For Indonesia, lower oil prices are already having a positive net effect on the external trade balance, as the CAD-to-GDP ratio was only 2.1% in 2Q15 (2014: 3.1%). We estimate that every 10% drop in the oil price would increase the monthly trade balance by USD78m. That said, even though the 2Q15 trade balance was a net positive, continued steep export drops (2Q15: -19.2% y-y) and an ongoing lower Indonesian shares in global markets are restraining the country’s ability to generate foreign reserves to finance external debt. Stable inflation the key to avoid a vicious circle: Indonesia currently is the only country with above 5% y-y inflation among its peers (exhibit 20), caused by several fuel-price hikes since 2013. In terms of purchasing power parity (PPP), this is why the IDR has depreciated the most among these countries. Technically, without another supply shock, we believe inflation should be below 5.0% at end-2015, but we see possible upside from the recent El Nino weather pattern and possible additional fuel-price hikes due in September/October. In our view, a managable inflation level is imperative to prevent a vicious circle of currency depreciation and high inflation. Fair and manageable moderation is expected this time: The recent IDR depreciation has raised concerns about foreign debt payments and the sufficiency of foreign reserves, which now cover just 6.9 months of imports. We remain cautious on this issue, although 2Q15 private external debt growth has slowed but to a still high level of 9.7% y-y (1Q15: 13.4%). However, BI's tightening policy, in place since 2013, has normalized the Exhibit 1. Macro assumptions 2014A 2015F 2016F 2017F Cur acc (% GDP) -3.0 -2.0 -2.3 -2.3 Fiscal bal (% GDP) -2.3 -2.2 -2.2 -2.3 GDP growth(% y-y) 5.0 4.7 5.1 5.2 Inflation (% y-y) 8.4 4.8 5.2 5.3 Oil price(USD/bbl) 57.3 55.0 57.0 63.0 Oil price(USD/bbl)* 99.5 58.0 55.0 60.0 IDR/1USD 12,385 14,000 14,500 14,000 BI rate (% p.a.) 7.75 7.50 7.00 6.50 FX reserve (USDbn) 111.9 105.0 110.0 112.0 Source: BI, BPS, Bahana estimate, *Average Brent oil price Exhibit 2. Forecast changes 2015F 2016F Old New Old New GDP growth (%) 4.86 4.72 5.29 5.10 CAD (% of GDP) 2.50 2.00 2.30 2.30 IDR/USD, Average 13,350 13,455 14,200 14,533 IDR/USD, End-year 13,700 14,000 14,000 14,500 Source: Bahana estimate Exhibit 3. GDP growth trend 6.1 6.8 6.2 6.5 6.5 6.3 6.0 5.9 6.1 6.2 5.9 5.9 5.6 5.6 5.5 5.6 5.1 5.0 5.0 5.0 5.0 4.7 4.7 4.0 4.5 5.0 5.5 6.0 6.5 7.0 4Q09 2Q10 4Q10 2Q11 4Q11 2Q12 4Q12 2Q13 4Q13 2Q14 4Q14 2Q15 (%) Source: Bank Indonesia Exhibit 4. Interest rate and inflation 7.50 7.50 7.50 7.00 7.25 3.99 4.83 8.36 6.38 7.15 7.88 6.90 6.09 6.09 0.0 1.0 2.0 3.0 4.0 5.0 6.0 7.0 8.0 9.0 Apr-14 Jul-14 Oct-14 Jan-15 Apr-15 Jul-15 Oct-15F Jan-16F Apr-16F Jul-16F Oct-16F (%) BI rate CPI y-y Source: Bank Indonesia, Bahana estimate Exhibit 5. Output gap 4.5 5.0 5.5 6.0 6.5 7.0 -0.8 -0.6 -0.4 -0.2 0.0 0.2 0.4 0.6 0.8 1Q07 4Q07 3Q08 2Q09 1Q10 4Q10 3Q11 2Q12 1Q13 4Q13 3Q14 2Q15 (%) (%) Output Gap (LHS) Annualized GDP Growth (RHS) 2009-2010 economic moderation period Source: Statistics Indonesia, Bahana Estimate
Transcript
Asiamoney’s
2013
Best Domestic
Equity House
Economics flash
24 August 2015
Disclosure: Bahana Securities does and seeks to do business with companies covered in its research reports. Investors should consider this report as only a single factor
in making their investment decision.
Please see the important disclaimer information on the back of this report
Important Disclosures and Disclaimer This publication is prepared by PT.Bahana Securities and reviewed by Daiwa Securities Group Inc. and/or its affiliates, and distributed outside Indonesia by Daiwa Securities Group Inc. and/or its affiliates, except to the extent expressly provided herein. Certain copies of this publication may be distributed inside and outside of Indonesia by PT. Bahana Securities in accordance with relevant laws and regulations. This publication and the contents hereof are intended for information purposes only, and may be subject to change without further notice. Any use, disclosure, distribution, dissemination, copying, printing or reliance on this publication for any other purpose without our prior consent or approval is strictly prohibited. Any review does not constitute a full verification of the publication and merely provides a minimum check. Neither Daiwa Securities Group Inc. nor any of its respective parent, holding, subsidiaries or affiliates, nor any of its respective directors, officers, servants and employees, represent nor warrant the accuracy or completeness of the information contained herein or as to the existence of other facts which might be significant, and will not accept any responsibility or liability whatsoever for any use of or reliance upon this publication or any of the contents hereof. Neither this publication, nor any content hereof, constitute, or are to be construed as, an offer or solicitation of an offer to buy or sell any of the securities or investments mentioned herein in any country or jurisdiction nor, unless expressly provided, any recommendation or investment opinion or advice. Any view, recommendation, opinion or advice expressed in this publication constitutes the views of the analyst(s) named herein and does not necessarily reflect those of Daiwa Securities Group Inc. and/or its affiliates nor any of its respective directors, officers, servants and employees except where the publication states otherwise. This research report is not to be relied upon by any person in making any investment decision or otherwise advising with respect to, or dealing in, the securities mentioned, as it does not take into account the specific investment objectives, financial situation and particular needs of any person.
Neither Daiwa Securities Group Inc. nor any of its affiliates is licensed to undertake any business within the Republic of Indonesia. Any display of any trade name or logo of the Daiwa Securities Group Inc. on this publication shall not be deemed to be an undertaking of any business within the Republic of Indonesia.
Daiwa Securities Group Inc., its subsidiaries or affiliates, or its or their respective directors, officers and employees from time to time may have trades as principals, or have positions in, or have other interests in the securities of the company under research including market making activities, derivatives in respect of such securities or may have also performed investment banking and other services for the issuer of such securities. The following are additional disclosures.
Ownership of Securities
For “Ownership of Securities” information, please visit BlueMatrix disclosure link at https://daiwa3.bluematrix.com/sellside/Disclosures.action.
Investment Banking Relationship
For “Investment Banking Relationship”, please visit BlueMatrix disclosure link at https://daiwa3.bluematrix.com/sellside/Disclosures.action.
Japan
Daiwa Securities Co. Ltd. and Daiwa Securities Group Inc.
Daiwa Securities Co. Ltd. is a subsidiary of Daiwa Securities Group Inc.
Investment Banking Relationship
Within the preceding 12 months, The subsidiaries and/or affiliates of Daiwa Securities Group Inc. * has lead-managed public offerings and/or secondary offerings (excluding straight bonds) of the securities of the following companies: Modern Land (China) Co. Ltd (1107 HK); econtext Asia Ltd (1390 HK); Accordia Golf Trust (AGT SP); Hua Hong Semiconductor Ltd (1347 HK); GF Securities Co Ltd (1776 HK); Mirae Asset Life Insurance Co Ltd (085620 KS).
*Subsidiaries of Daiwa Securities Group Inc. for the purposes of this section shall mean any one or more of:
• Daiwa Capital Markets Hong Kong Limited (大和資本市場香港有限公司)
• Daiwa Capital Markets Singapore Limited
• Daiwa Capital Markets Australia Limited
• Daiwa Capital Markets India Private Limited
• Daiwa-Cathay Capital Markets Co., Ltd.
• Daiwa Securities Capital Markets Korea Co., Ltd
Disclosure of Interest of Bahana Securities
Investment Banking Relationship
Within the preceding 12 months, Bahana Securities has lead-managed public offerings and/or secondary offerings (excluding straight bonds) of the securities of the following companies: J Resources Asia Pasific Tbk PT (PSAB IJ); Waskita Karya Persero Tbk PT (WSKT IJ); Adhi Karya Persero Tbk PT (ADHI IJ); PP Properti Tbk PT (PPRO IJ); Merdeka Copper Gold Tbk PT (MDKA IJ)
Hong Kong
This research is distributed in Hong Kong by Daiwa Capital Markets Hong Kong Limited (大和資本市場香港有限公司) (“DHK”) which is regulated by the Hong Kong Securities and Futures Commission. Recipients of this research in Hong Kong may contact DHK in respect of any matter arising from or in connection with this research.
Relevant Relationship (DHK)
DHK may from time to time have an individual employed by or associated with it serves as an officer of any of the companies under its research coverage.
Singapore
This research is distributed in Singapore by Daiwa Capital Markets Singapore Limited and it may only be distributed in Singapore to accredited investors, expert investors and institutional investors as defined in the Financial Advisers Regulations and the Securities and Futures Act (Chapter 289), as amended from time to time. By virtue of distribution to these category of investors, Daiwa Capital Markets Singapore Limited and its representatives are not required to comply with Section 36 of the Financial Advisers Act (Chapter 110) (Section 36 relates to disclosure of Daiwa Capital Markets Singapore Limited’s interest and/or its representative’s interest in securities). Recipients of this research in Singapore may contact Daiwa Capital Markets Singapore Limited in respect of any matter arising from or in connection with the research.
Australia
This research is distributed in Australia by Daiwa Capital Markets Australia Limited and it may only be distributed in Australia to wholesale investors within the meaning of the Corporations Act. Recipients of this research in Australia may contact Daiwa Capital Markets Stockbroking Limited in respect of any matter arising from or in connection with the research.
India
This research is distributed in India to Institutional Clients only by Daiwa Capital Markets India Private Limited (Daiwa India) which is an intermediary registered with Securities & Exchange Board of India as a Stock Broker, Merchant Bank and Research Analyst. Daiwa India, its Research Analyst and their family members and its associates do not have any financial interest save as disclosed or other undisclosed material conflict of interest in the securities or derivatives of any companies under coverage. Daiwa India and its associates may have received compensation for any products other than Investment Banking (as disclosed) or brokerage services from the subject company in this report during the past 12 months. Unless otherwise stated in BlueMatrix disclosure link at https://daiwa3.bluematrix.com/sellside/Disclosures.action, Daiwa India and its associates do not hold more than 1% of any companies covered in this research report.
There is no material disciplinary action against Daiwa India by any regulatory authority impacting equity research analysis activities as of the date of this report.
This research is distributed in Taiwan by Daiwa-Cathay Capital Markets Co., Ltd and it may only be distributed in Taiwan to institutional investors or specific investors who have signed recommendation contracts with Daiwa-Cathay Capital Markets Co., Ltd in accordance with the Operational Regulations Governing Securities Firms Recommending Trades in Securities to Customers. Recipients of this research in Taiwan may contact Daiwa-Cathay Capital Markets Co., Ltd in respect of any matter arising from or in connection with the research.
Philippines
This research is distributed in the Philippines by DBP-Daiwa Capital Markets Philippines, Inc. which is regulated by the Philippines Securities and Exchange
Commission and the Philippines Stock Exchange, Inc. Recipients of this research in the Philippines may contact DBP-Daiwa Capital Markets Philippines, Inc.
in respect of any matter arising from or in connection with the research. DBP-Daiwa Capital Markets Philippines, Inc. recommends that investors
independently assess, with a professional advisor, the specific financial risks as well as the legal, regulatory, tax, accounting, and other consequences of a proposed transaction. DBP-Daiwa Capital Markets Philippines, Inc. may have positions or may be materially interested in the securities in any of the markets
mentioned in the publication or may have performed other services for the issuers of such securities.
For relevant securities and trading rules please visit SEC and PSE link at http://www.sec.gov.ph/irr/AmendedIRRfinalversion.pdf and
http://www.pse.com.ph/ respectively.
United Kingdom
This research report is produced by Daiwa Capital Markets Europe Limited and/or its affiliates and is distributed in the European Union, Iceland, Liechtenstein, Norway and Switzerland. Daiwa Capital Markets Europe Limited is authorised and regulated by The Financial Conduct Authority (“FCA”) and is a member of the London Stock Exchange, Eurex and NYSE Liffe.
This publication is intended for investors who are not Retail Clients in the United Kingdom within the meaning of the Rules of the FCA and should not therefore be distributed to such Retail Clients in the United Kingdom. Should you enter into investment business with Daiwa Capital Markets Europe’s affiliates outside the United Kingdom, we are obliged to advise that the protection afforded by the United Kingdom regulatory system may not apply; in particular, the benefits of the Financial Services Compensation Scheme may not be available.
Daiwa Capital Markets Europe Limited has in place organisational arrangements for the prevention and avoidance of conflicts of interest. Our conflict management policy is available at http://www.uk.daiwacm.com/about-us/corporate-governance-regulatory.
Germany
This document is distributed in Germany by Daiwa Capital Markets Europe Limited, Niederlassung Frankfurt which is regulated by BaFin (Bundesanstalt fuer Finanzdienstleistungsaufsicht) for the conduct of business in Germany.
Bahrain
This research material is distributed by Daiwa Capital Markets Europe Limited, Bahrain Branch, regulated by The Central Bank of Bahrain and holds Investment Business Firm – Category 2 license and having its official place of business at the Bahrain World Trade Centre, South Tower, 7th floor, P.O. Box 30069, Manama, Kingdom of Bahrain. Tel No. +973 17534452 Fax No. +973 535113
This material is provided as a reference for making investment decisions and is not intended to be a solicitation for investment. Investment decisions should be made at your own discretion and risk. Accordingly, no representation or warranty, express or implied, is made as to and no reliance should be placed on the fairness, accuracy, completeness or correctness of the information and opinions contained in this document, Content herein is based on information available at the time the research material was prepared and may be amended or otherwise changed in the future without notice. All information is intended for the private use of the person to whom it is provided without any liability whatsoever on the part of Daiwa Capital Markets Europe Limited, Bahrain Branch, any associated company or the employees thereof. If you are in doubt about the suitability of the product or the research material itself, please consult your own financial adviser. Daiwa Capital Markets Europe Limited, Bahrain Branch retains all rights related to the content of this material, which may not be redistributed or otherwise transmitted without prior consent.
United States
This report is distributed in the U.S. by Daiwa Capital Markets America Inc. (DCMA). It may not be accurate or complete and should not be relied upon
as such. It reflects the preparer’s views at the time of its preparation, but may not reflect events occurring after its preparation; nor does it reflect
PT.Bahana Securities’ or DCMA’s views at any time. Neither PT.Bahana Securities, DCMA nor the preparer has any obligation to update this report
or to continue to prepare research on this subject. This report is not an offer to sell or the solicitation of any offer to buy securities. Unless this report
says otherwise, any recommendation it makes is risky and appropriate only for sophisticated speculative investors able to incur significant losses.
Readers should consult their financial advisors to determine whether any such recommendation is consistent with their own investment objectives,
financial situation and needs. This report does not recommend to U.S. recipients the use of any of PT.Bahana Securities’ or DCMA’s non-U.S. affiliates to effect trades in any security and is not supplied with any understanding that U.S. recipients of this report will direct commission business to
such non-U.S. entities. Unless applicable law permits otherwise, non-U.S. customers wishing to effect a transaction in any securities referenced in this
material should contact a Daiwa entity in their local jurisdiction. Most countries throughout the world have their own laws regulating the types of
securities and other investment products which may be offered to their residents, as well as a process for doing so. As a result, the securities
discussed in this report may not be eligible for sales in some jurisdictions. Customers wishing to obtain further information about this report should
contact DCMA: Daiwa Capital Markets America Inc., Financial Square, 32 Old Slip, New York, New York 10005 (Tel no. 212-612-7000).
Ownership of Securities
For “Ownership of Securities” information please visit BlueMatrix disclosure Link at https://daiwa3.bluematrix.com/sellside/Disclosures.action .
Investment Banking Relationships
For “Investment Banking Relationships” please visit BlueMatrix disclosure link at https://daiwa3.bluematrix.com/sellside/Disclosures.action.
DCMA Market Making
For “DCMA Market Making” please visit BlueMatrix disclosure link at https://daiwa3.bluematrix.com/sellside/Disclosures.action.
Research Analyst Conflicts
For updates on “Research Analyst Conflicts” please visit BlueMatrix disclosure link at https://daiwa3.bluematrix.com/sellside/Disclosures.action. The
principal research analysts who prepared this report have no financial interest in securities of the issuers covered in the report, are not (nor are any members of their household) an officer, director or advisory board member of the issuer(s) covered in the report, and are not aware of any material
relevant conflict of interest involving the analyst or DCMA, and did not receive any compensation from the issuer during the past 12 months except as
noted: no exceptions.
Research Analyst Certification
For updates on “Research Analyst Certification” and “Rating System” please visit BlueMatrix disclosure link at
https://daiwa3.bluematrix.com/sellside/Disclosures.action. The views about any and all of the subject securities and issuers expressed in this
Research Report accurately reflect the personal views of the research analyst(s) primarily responsible for this report (or the views of the firm
producing the report if no individual analysts[s] is named on the report); and no part of the compensation of such analyst(s) (or no part of the
compensation of the firm if no individual analyst[s)] is named on the report) was, is, or will be directly or indirectly related to the specific recommendations or views contained in this Research Report.
For stocks and sectors in Indonesia covered by Bahana Securities, the following rating system is in effect:
Stock ratings are based on absolute upside or downside, which is the difference between the target price and the current market price. Unless otherwise specified, these ratings are set with a 12-month horizon. It is possible that future price volatility may cause a temporary mismatch between upside/downside for a stock based on the market price and the formal rating. "Buy": the price of the security is expected to increase by 10% or more. "Hold": the price of the security is expected to range from an increase of less than 10% to a decline of less than 5%. "Reduce": the price of the security is expected to decline by 5% or more.
Sector ratings are based on fundamentals for the sector as a whole. Hence, a sector may be rated “Overweight” even though its constituent stocks are all rated “Reduce”; and a sector may be rated “Underweight” even though its constituent stocks are all rated “Buy”. “Overweight”: positive fundamentals for the sector. “Neutral”: neither positive nor negative fundamentals for the sector. “Underweight”: negative fundamentals for the sector.
Ownership of Securities For “Ownership of Securities” information, please visit BlueMatrix disclosure Link at https://daiwa3.bluematrix.com/sellside/Disclosures.action .
Investment Banking Relationships For “Investment Banking Relationship”, please visit BlueMatrix disclosure Link at https://daiwa3.bluematrix.com/sellside/Disclosures.action . Relevant Relationships (Bahana Securities) Bahana Securities may from time to time have an individual employed by or associated with it serves as an officer of any of the companies under its research coverage.
Bahana Securities market making Bahana Securities may from time to time make a market in securities covered by this research.
Additional information may be available upon request.
Japan - additional notification items pursuant to Article 37 of the Financial Instruments and Exchange Law
(This Notification is only applicable where report is distributed by Daiwa Securities Co. Ltd.)
If you decide to enter into a business arrangement with us based on the information described in materials presented along with this document, we ask you to pay close attention to the following items.
In addition to the purchase price of a financial instrument, we will collect a trading commission* for each transaction as agreed beforehand with you. Since
commissions may be included in the purchase price or may not be charged for certain transactions, we recommend that you confirm the commission for
each transaction.
In some cases, we may also charge a maximum of ¥ 2 million (including tax) per year as a standing proxy fee for our deposit of your securities, if you are
a non-resident of Japan.
For derivative and margin transactions etc., we may require collateral or margin requirements in accordance with an agreement made beforehand with
you. Ordinarily in such cases, the amount of the transaction will be in excess of the required collateral or margin requirements.
There is a risk that you will incur losses on your transactions due to changes in the market price of financial instruments based on fluctuations in interest
rates, exchange rates, stock prices, real estate prices, commodity prices, and others. In addition, depending on the content of the transaction, the loss
could exceed the amount of the collateral or margin requirements. There may be a difference between bid price etc. and ask price etc. of OTC derivatives handled by us.
Before engaging in any trading, please thoroughly confirm accounting and tax treatments regarding your trading in financial instruments with such experts
as certified public accountants.
*The amount of the trading commission cannot be stated here in advance because it will be determined between our company and you based on current
market conditions and the content of each transaction etc.
When making an actual transaction, please be sure to carefully read the materials presented to you prior to the execution of agreement, and to take responsibility for your own decisions regarding the signing of the agreement with us.
Corporate Name: Daiwa Securities Co. Ltd.
Financial instruments firm: chief of Kanto Local Finance Bureau (Kin-sho) No.108
Memberships: Japan Securities Dealers Association, Financial Futures Association of Japan