Equity markets – think differently! Thought Leadership Series – Series 1 of 3: Introducing the Minimum Variance strategy The investment dogma “higher returns require higher risk” has been widely spread for decades. Indeed, equity investors have been led to believe that to achieve higher returns, taking on a relatively higher level of risk is necessary. The positive relationship between risk and expected returns may hold true when allocating between different asset classes, but it is less valid when investing within a particular asset class such as equities. 1. Understanding a stock’s risk-return relationship The return of an equity investment is easy to calculate. Measuring the risk of a stock however relies on several metrics with potentially different approaches. Today, volatility is considered a standard and widely accepted unit of risk. Measuring the uncertainty of a stock’s returns over time, volatility allows us to rank-order stocks within the investment universe. High-volatility stocks are then considered the riskiest and low-volatility stocks the least risky. Traditional financial theory would suggest that low-volatility stocks are less rewarding than high-volatility stocks, but this may be misleading. Chart 1 represents the MSCI All Country World Index divided into five baskets of stocks, ranked by risk profile and their volatility and return levels over a 20-year period. As you can see, low-risk stocks (“Quintile 1”) have actually generated the highest returns over the period, while the highest-risk stocks (“Quintile 5”) have returned the least. KEY POINTS: 1. Equity risk is not necessarily compensated with higher return 2. Low volatility stocks tend to exceed market’s returns in the long run 3. Minimum Variance approach helps to build a diversified and adaptive portfolio with defensive qualities *Seeyond is a brand of Natixis Asset Management. Source: Seeyond / Bloomberg, 31 December 2016 . Q1 (lowest quintile) represents low-risk stocks based on beta. Q5 (highest quintile) represents high-risk stocks based on beta. Based on returns of stocks included in the MSCI ACWI NR USD index; Indices are unmanaged, do not incur fees, and include reinvestment of dividends and interest income, if any. It is not possible to invest in an index. Stocks are equal-weighted and quintiles are rebalanced on a quarterly basis; Risk represents the volatility of each quintile. Performance data shown represents past performance and is no guarantee of, and not necessarily indicative of, future restults. CHART 1: GLOBAL EQUITIES PER LEVEL OF RISK-RETURN (STUDY PERIOD: 01/01/1997 TO 31/12/2016) Risk (annualised) Return (annualised) 0% 5% 10% 15% 20% 25% 30% Quintile 5 Quintile 4 Quintile 3 Quintile 2 Quintile 1 By the Seeyond* Quantitative Research Team
Transcript
Equity markets – think differently! Thought Leadership Series – Series 1 of 3: Introducing the Minimum Variance strategy
The investment dogma “higher returns require higher risk” has been widely spread for decades. Indeed, equity investors have been led to believe that to achieve higher returns, taking on a relatively higher level of risk is necessary.
The positive relationship between risk and expected returns may hold true when allocating between different asset classes, but it is less valid when investing within a particular asset class such as equities.
1. Understanding a stock’s risk-return relationship
The return of an equity investment is easy to calculate. Measuring the risk of a stock however relies on several metrics with potentially different approaches. Today, volatility is considered a standard and widely accepted unit of risk. Measuring the uncertainty of a stock’s returns over time, volatility allows us to rank-order stocks within the investment universe. High-volatility stocks are then considered the riskiest and low-volatility stocks the least risky. Traditional financial theory would suggest that low-volatility stocks are less rewarding than high-volatility stocks, but this may be misleading.
Chart 1 represents the MSCI All Country World Index divided into five baskets of stocks, ranked by risk profile and their volatility and return levels over a 20-year period.
As you can see, low-risk stocks (“Quintile 1”) have actually generated the highest returns over the period, while the highest-risk stocks (“Quintile 5”) have returned the least.
KEY POINTS:
1. Equity risk is not necessarily compensated with higher return
2. Low volatility stocks tend to exceed market’s returns in the long run
3. Minimum Variance approach helps to build a diversified and adaptive portfolio with defensive qualities
*Seeyond is a brand of Natixis Asset Management.
Source: Seeyond / Bloomberg, 31 December 2016 . Q1 (lowest quintile) represents low-risk stocks based on beta. Q5 (highest quintile) represents high-risk stocks based on beta. Based on returns of stocks included in the MSCI ACWI NR USD index; Indices are unmanaged, do not incur fees, and include reinvestment of dividends and interest income, if any. It is not possible to invest in an index. Stocks are equal-weighted and quintiles are rebalanced on a quarterly basis; Risk represents the volatility of each quintile. Performance data shown represents past performance and is no guarantee of, and not necessarily indicative of, future restults.
CHART 1: GLOBAL EQUITIES PER LEVEL OF RISK-RETURN (STUDY PERIOD: 01/01/1997 TO 31/12/2016)
This highlights the low-volatility anomaly.This anomaly has many origins, including behavioral bias: the lottery effect – small chance of a large gain; overconfidence – inconsideration for a stock’s actual risk; or the herd effect – all investors attracted by a small selection of stocks. To sum up, empirical data shows that low-risk stocks tend to generate higher returns than high-risk stocks over the long term.
2. Equity markets from a different angle
To exploit this structural inefficiency, low volatility strategies aim to provide investors with above-benchmark returns and below-benchmark risk. But to reach this goal, selecting low-volatility stocks is not enough.
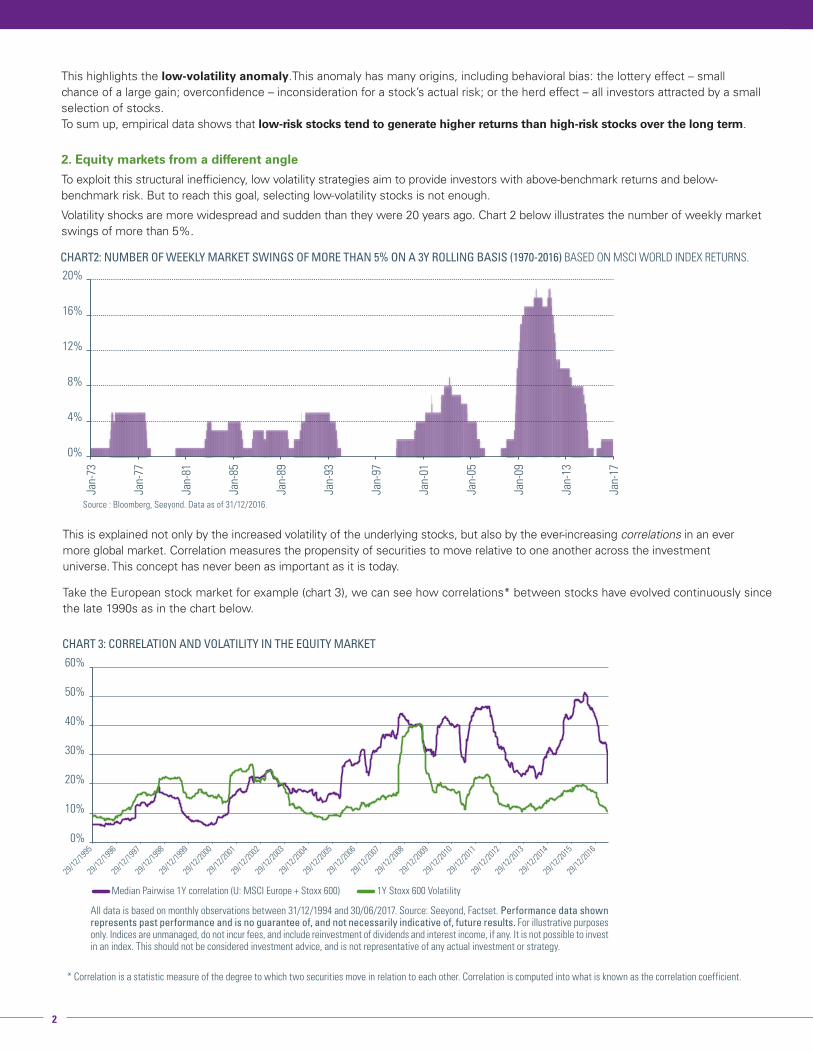
Volatility shocks are more widespread and sudden than they were 20 years ago. Chart 2 below illustrates the number of weekly market swings of more than 5%.
Source : Bloomberg, Seeyond. Data as of 31/12/2016.
2
CHART2: NUMBER OF WEEKLY MARKET SWINGS OF MORE THAN 5% ON A 3Y ROLLING BASIS (1970-2016) BASED ON MSCI WORLD INDEX RETURNS.
0%
4%
8%
12%
16%
20%
Jan-
73
Jan-
77
Jan-
81
Jan-
85
Jan-
89
Jan-
93
Jan-
97
Jan-
01
Jan-
05
Jan-
09
Jan-
13
Jan-
17
All data is based on monthly observations between 31/12/1994 and 30/06/2017. Source: Seeyond, Factset. Performance data shown represents past performance and is no guarantee of, and not necessarily indicative of, future results. For illustrative purposes only. Indices are unmanaged, do not incur fees, and include reinvestment of dividends and interest income, if any. It is not possible to invest in an index. This should not be considered investment advice, and is not representative of any actual investment or strategy.
* Correlation is a statistic measure of the degree to which two securities move in relation to each other. Correlation is computed into what is known as the correlation coefficient.
0%
29/12
/1995
29/12
/1996
29/12
/1997
29/12
/1998
29/12
/1999
29/12
/2000
29/12
/2001
29/12
/2002
29/12
/2003
29/12
/2004
29/12
/2005
29/12
/2006
29/12
/2007
29/12
/2008
29/12
/2009
29/12
/2010
29/12
/2011
29/12
/2012
29/12
/2013
29/12
/2014
29/12
/2015
29/12
/2016
10%
20%
30%
40%
50%
60%
Median Pairwise 1Y correlation (U: MSCI Europe + Stoxx 600) 1Y Stoxx 600 Volatility
CHART 3: CORRELATION AND VOLATILITY IN THE EQUITY MARKET
Take the European stock market for example (chart 3), we can see how correlations* between stocks have evolved continuously since the late 1990s as in the chart below.
This is explained not only by the increased volatility of the underlying stocks, but also by the ever-increasing correlations in an ever more global market. Correlation measures the propensity of securities to move relative to one another across the investment universe. This concept has never been as important as it is today.
3
SEEYOND – AT GLANCE
Seeyond is the structured product and volatility management investment division of Natixis Asset Management. In order to offer investments that combine performance generation with risk reduction, Seeyond applies investment strategies that go beyond conventional active management: structured and active protected management, flexible asset allocation and active volatility management, model-driven global and European equity strategies. With 33 employees, Seeyond has $18 billion in assets under management1.
• Overview of the Seeyond Minimum Variance Investment team Nicolas Just, CFA®: Head of Strategic Equities Management,
began investment career in 1994. Juan-Sebastian Caicedo, CFA®: Senior Portfolio Manager, began
investment career in 2009.
• Overview of the Seeyond Research team Hamza Bahaji, PhD: Head of Research & Development, began
career in 2003. Stephanie Ridon: Financial Engineer, began career in 2001. Alexis Flageollet: Financial Engineer, began career in 2006
4. ConclusionAt Seeyond, we adopt a pure, unconstrained, and active approach: - pure, by focusing solely on risk minimisation - unconstrained, by no limitations of sector, country or market cap - active, by providing high active share with portfolio managers implementing a simple approach and a specific risk monitoring.
3. Seeyond’s approach to Minimum Variance
We believe the most efficient approach to Minimum Variance investing is to favor low-volatility stocks with the lowest possible correlation to one another in order to maximise the diversification of the portfolio, and in turn reduce the overall portfolio volatility. Not only does it enables us to exploit the low-volatility anomaly, but also helps to avoid correlation traps as much as possible.
This focus on managing the overall portfolio volatility seeks to provide investors with superior returns in the long run, while substancially reducing downside risk and thus presents asymmetric risk/return qualities.
NATIXIS GLOBAL ASSET MANAGEMENT – AT GLANCE
Natixis Global Asset Management serves thoughtful investment professionals worldwide through our Durable Portfolio Construction® approach: applying risk-minded insights to empower more intelligent investing. Uniting over 20 specialised investment managers globally ($951.7 billion AUM2), Natixis is ranked among the world’s largest asset management firms3.
1. Source: Natixis Asset Management as of 30 June 2017.2. Source: Natixis Global Asset Management as of 30 June 2017.3. Cerulli Quantitative Update: Global Markets 2017 ranked Natixis Global Asset
Management, S.A. as the 15th largest asset manager in the world based on assets under management ($877.1 billion) as of December 31, 2016.
LEGAL INFORMATION
This material has been provided for information purposes only to investment service providers or other Professional Clients or Qualified Investors and, when required by local regulation, only at their written request. In the E.U. (outside of the UK): Provided by NGAM S.A. or one of its branch offices listed below. NGAM S.A. is a Luxembourg management company that is authorised by the Commission de Surveillance du Secteur Financier and is incorporated under Luxembourg laws and registered under n. B 115843. Registered office of NGAM S.A.: 2, rue Jean Monnet, L-2180 Luxembourg, Grand Duchy of Luxembourg. France: NGAM Distribution (n.509 471 173 RCS Paris). Registered office: 21 quai d’Austerlitz, 75013 Paris. Italy: NGAM S.A., Succursale Italiana (Bank of Italy Register of Italian Asset Management Companies no 23458.3). Registered office: Via Larga, 2 - 20122, Milan, Italy. Germany: NGAM S.A., Zweigniederlassung Deutschland (Registration number: HRB 88541). Registered office: Im Trutz Frankfurt 55, Westend Carrée, 7. Floor, Frankfurt am Main 60322, Germany. Netherlands: NGAM, Nederlands filiaal (Registration number 50774670). Registered office: World Trade Center Amsterdam, Strawinskylaan 1259, D-Tower, Floor 12, 1077 XX Amsterdam, the Netherlands. Sweden: NGAM, Nordics Filial (Registration number 516405-9601 - Swedish Companies Registration Office). Registered office: Kungsgatan 48 5tr, Stockholm 111 35, Sweden. Spain: NGAM, Sucursal en España. Registered office: Torre Colon II - Plaza Colon, 2 - 28046 Madrid, Spain. • In Switzerland: Provided by NGAM, Switzerland Sàrl, Rue du Vieux Collège 10, 1204 Geneva, Switzerland or its representative office in Zurich, Schweizergasse 6, 8001 Zürich. • In the U.K.: Provided by NGAM UK Limited which is authorised and regulated by the UK Financial Conduct Authority (register no. 190258). This material is intended to be communicated to and/or directed at persons (1) in the United Kingdom, and should not to be regarded as an offer to buy or sell, or the solicitation of any offer to buy or sell securities in any other jurisdiction than the United Kingdom; and (2) who are authorised under the Financial Services and Markets Act 2000 (FSMA 2000); or are high net worth businesses with called up share capital or net assets of at least £5 million or in the case of a trust assets of at least £10 million; or any other person to whom the material may otherwise lawfully be distributed in accordance with the FSMA 2000 (Financial Promotion) Order 2005 or the FSMA 2000 (Promotion of Collective Investment Schemes) (Exemptions) Order 2001 (the “Intended Recipients”). The fund, services or opinions referred to in this material are only available to the Intended Recipients and this material must not be relied nor acted upon by any other persons. Registered Office: NGAM UK Limited, One Carter Lane, London, EC4V 5ER. •In the DIFC: Provided in and from the DIFC financial district by NGAM Middle East, a branch of NGAM UK Limited, which is regulated by the DFSA. Related financial products or services are only available to persons who have sufficient financial experience and understanding to participate in financial markets within the DIFC, and qualify as Professional Clients as defined by the DFSA. Registered office: Office 603 - Level 6, Currency House Tower 2, PO Box 118257, DIFC, Dubai, United Arab Emirates. • In Singapore: Provided by NGAM Singapore (name registration no. 53102724D) to distributors and institutional investors only. NGAM Singapore is a division of Natixis Asset Management Asia Limited (company registration no. 199801044D). • In Hong Kong: Provided by NGAM Hong Kong Limited to institutional/ corporate professional investors only. • In Australia: Provided by NGAM Australia Pty Limited (ABN 60 088 786 289) (AFSL No. 246830) and is intended for the general information of financial advisers and wholesale clients only. • In New Zealand: This document is intended for the general information of New Zealand wholesale investors only. This is not a regulated offer for the purposes of the Financial Markets Conduct Act 2013 (FMCA) and is only available to New Zealand investors who have certified that they meet the requirements in the FMCA for wholesale investors. NGAM Australia Pty Limited is not a registered financial service provider in New Zealand. • In Latin America: Provided by NGAM S.A. • In Chile: Esta oferta privada se acoge a la Norma de Carácter General N°336 de la SVS de Chile. • In Colombia: Provided by NGAM S.A. Oficina de Representación (Colombia) to professional clients for informational purposes only as permitted under Decree 2555 of 2010. Any products, services or investments referred to herein are rendered exclusively outside of Colombia. This material does not constitute a public offering in Colombia and is addressed to less than 100 specifically identified investors. • In Mexico: Provided by NGAM Mexico, S. de R.L. de C.V., which is not a regulated financial entity with the Comisión Nacional Bancaria y de Valores or any other Mexican authority. Any products, services or investments referred to herein are rendered exclusively outside of Mexico. • In Uruguay: Provided by NGAM Uruguay S.A., a duly registered investment advisor, authorised and supervised by the Central Bank of Uruguay. Office: San Lucar 1491, oficina 102B, Montevideo, Uruguay, CP 11500. The sale or offer of any units of a fund qualifies as a private placement pursuant to section 2 of Uruguayan law 18,627. • The above referenced entities are business development units of Natixis Global Asset Management, S.A., the holding company of a diverse line-up of specialised investment management and distribution entities worldwide.
The investment management subsidiaries of Natixis Global Asset Management conduct any regulated activities only in and from the jurisdictions in which they are licensed or authorised. Their services and the products they manage are not available to all investors in all jurisdictions. It is the responsibility of each investment service provider to ensure that the offering or sale of fund shares or third party investment services to its clients complies with the relevant national law. The provision of this material and/or reference to specific securities, sectors, or markets within this material does not constitute investment advice, or a recommendation or an offer to buy or to sell any security, or an offer of any regulated financial activity. Investors should consider the investment objectives, risks and expenses of any investment carefully before investing. The analyses, opinions, and certain of the investment themes and processes referenced herein represent the views of the portfolio manager(s) as of the date indicated. These, as well as the portfolio holdings and characteristics shown, are subject to change. There can be no assurance that developments will transpire as may be forecasted in this material.
Although Natixis Global Asset Management believes the information provided in this material to be reliable, including that from third party sources, it does not guarantee the accuracy, adequacy, or completeness of such information. May not be redistributed, published, or reproduced, in whole or in part.
T-SMV03-0617
IMPORTANT INFORMATIONCFA® and Chartered Financial Analyst® are registered trademarks owned by the CFA Institute.Material produced in September 2017. All data are as of June end 2017, unless otherwise stated.This document is destined for professional and non professional clients. It may not be used for any purpose other than that for which it was conceived and may not be copied, diffused or communicated to third parties in part or in whole without the prior written authorisation of Natixis Asset Management. None of the information contained in this document should be interpreted as having any contractual value. This document is produced purely for the purposes of providing indicative information. It constitutes a presentation conceived and created by Natixis Asset Management from sources that it regards as reliable. Natixis Asset Management reserves the right to modify the information presented in this document at any time without notice and particularly the information concerning the description of the management processes which does not in any way constitute a commitment on behalf of Natixis Asset Management. Natixis Asset Management will not be held responsible for any decision taken or not taken on the basis of information contained in this document, nor in the use that a third-party may make of it. Figures mentioned refer to previous years. Past performance does not guarantee future results. Reference to a ranking and/or a price does not indicate the future performance of the UCITS or the fund manager.