Equity Research Q2/13 Viewpoint March 14, 2013 Toronto, Ontario Paul Campell Director of Canadian Equity Research This report was prepared by an analyst employed by BMO Nesbitt Burns Inc., and who is not registered as a research analyst under FINRA rules. For disclosure statements, including the Analyst’s Certification, please refer to pages 10 to 12. Drinking From the Firehose Given the volume of information that is now generated and freely available, even without really looking for it, the task of consuming this onslaught in a manageable way has become a critical element of being informed. It is obviously impossible to know everything so there must be some ef- fort to figure out what information is most important and focus on that. While these comments apply broadly to virtually all types of information, investment research has been affected in terms of both information inputs to the research process and output of research material. I have always believed that one of the value-added functions of a research analyst is to sift and sort through all relevant material and distill it down to conclusions and implications, which are then turned into actionable, money-making investment recommendations. Given the volume of information now available, the value of this function has arguably increased. Apart from this function performed at the analyst level, BMO Capital Markets Research has several tools and ways we try to make the flow of research and investment ideas more easily consumed and manageable. Specifically, we have a top-down Investment Strategy process (complete with three model portfolios), Top 15 lists that focus on our best ideas and two periodicals (Week in Review and Director’s Cut) that highlight reports and thematic research that have a somewhat longer-term perspective. Investment Strategy BMO Capital Markets Research has always considered investment/portfolio strategy research to be an important component of the research product. It allows investors to make sense of the overall investment environment and pro- vides context for individual investment recommendations. In a sense, Investment Strategy is both a priorities list and a filing system – defining what is important and how to get at what’s important. We provide a variety of Investment Strategy documents that are produced on a weekly and monthly basis. These provide ongoing research into investment strategies and themes along with recommended stocks to implement those themes. In Brian Belski’s most recent Equity Strategy Outlook, he highlights that a shift from a macro driven environment to a fundamentally driven one is under way as most economic indicators show more consistent and positive trends. This should support stock picking over macro investing and favour higher-quality stocks over lower quality. From a selfish perspective, this plays to our strengths. We believe our research product is a valuable tool to provide the stock recommendations needed to build investment portfolios.
Transcript
Equity Research
Q2/13 Viewpoint March 14, 2013Toronto, Ontario
Paul CampellDirector of Canadian Equity Research
This report was prepared by an analyst employed by BMO Nesbitt Burns Inc., and who is not registered as a research analyst under FINRA rules. For disclosure statements, including the Analyst’s Certification, please refer to pages 10 to 12.
Drinking From the Firehose
Given the volume of information that is now generated and freely available, even without really looking for it, the task of consuming this onslaught in a manageable way has become a critical element of being informed. It is obviously impossible to know everything so there must be some ef-fort to figure out what information is most important and focus on that.
While these comments apply broadly to virtually all types of information, investment research has been affected in terms of both information inputs to the research process and output of research material. I have always believed that one of the value-added functions of a research analyst is to sift and sort through all relevant material and distill it down to conclusions and implications, which are then turned into actionable, money-making investment recommendations. Given the volume of information now available, the value of this function has arguably increased.
Apart from this function performed at the analyst level, BMO Capital Markets Research has several tools and ways we try to make the flow of research and investment ideas more easily consumed and manageable. Specifically, we have a top-down Investment Strategy process (complete with three model portfolios), Top 15 lists that focus on our best ideas and two periodicals (Week in Review and Director’s Cut) that highlight reports and thematic research that have a somewhat longer-term perspective.
Investment Strategy
BMO Capital Markets Research has always considered investment/portfolio strategy research to be an important component of the research product. It allows investors to make sense of the overall investment environment and pro-vides context for individual investment recommendations. In a sense, Investment Strategy is both a priorities list and a filing system – defining what is important and how to get at what’s important.
We provide a variety of Investment Strategy documents that are produced on a weekly and monthly basis. These provide ongoing research into investment strategies and themes along with recommended stocks to implement those themes.
In Brian Belski’s most recent Equity Strategy Outlook, he highlights that a shift from a macro driven environment to a fundamentally driven one is under way as most economic indicators show more consistent and positive trends. This should support stock picking over macro investing and favour higher-quality stocks over lower quality. From a selfish perspective, this plays to our strengths. We believe our research product is a valuable tool to provide the stock recommendations needed to build investment portfolios.
BMO Capital Markets Research maintains three model portfolios in order to highlight favoured investment ideas and present them in a portfolio context.
Large Cap Canadian Model Portfolio
BMO’s Large Cap Canadian Equity Model Portfolio is a compilation of investment ideas in the Canadian Large Cap equities space provided in a portfolio context. Stocks are selected and weighted with a view of creating a balanced and well-diversified portfolio across the 10 major sectors in the S&P/TSX Composite Index. While the portfolio usu-ally contains only Outperform-rated stocks, it is sometimes necessary to include stocks that are rated Market Perform or that may not be currently rated by BMO Capital Markets in order to keep the portfolio well diversified.
Small Cap Canadian Model Portfolio
The Small Cap Canadian Equity Model Portfolio is com-prised of investment ideas in the Canadian small-cap space with a view to creating a balanced and well-diversified portfolio across the 10 major sectors. This portfolio aims to include high-quality small cap equities with attractive return potential. The maximum market cap that a stock may have to be considered for inclusion in this portfolio is 0.1% of the total market cap of the S&P/TSX Composite Index.
Refer to pages 4 to 5 for Important Disclosures, including Analyst's Certification.
Brian G. Belski Chief Investment Strategist 212-885-4151 [email protected]
Target Update and Sector Snapshot Mira Borisova, CFA
Investment Strategist212-885-4127
[email protected] Prices, Fundamentals and Macro Environment Keep Chugging Along Despite a growing number of naysayers yearning for a pullback, the S&P 500 climbed 1.3% in February. While this pales in comparison to the 5% jump in January, US stocks remain sharply higher (+12.4% to be exact), since their recent November 2012 bottom. While favorable trends in US fundamental and economic data continue to support prices, in our view, investors remain fixated on fears surrounding the looming sequestration or a potentially deepening Eurozone crisis. For instance, the median earnings surprise for S&P 500 stocks improved to 3.5% from 2.6% a month ago, while fourth quarter EPS growth came in at 6.7%. Furthermore, core capital goods, confidence, core retail sales, and a number of housing indicators have also delivered positive and or improving underlying trends. As such, our 2013 S&P 500 targets remain unchanged from last month, with the price level at 1,575 and EPS at $106.25. While the fundamental inputs to our models did not deviate meaningfully, select macro factors did change, but their net effects were neutral.
S&P 500 Full Year Target Forecasts Model Category 2013E S&P 500 Price Target Dividend Discount Model Fundamental 1,475 Fair Value Price-to-Earnings Model Valuation 1,725 EPS Revision Model Mean Reversion 1,625 Macroeconomic Regression Model Macro 1,425 Expected Return 4.0% Prior Month S&P 500 Close 1,515 Price Target 1,575 S&P 500 Earnings Per Share Target Macroeconomic Regression Model Macro $108.50 Mean Consensus Regression Model Macro $97.50 Bottom Up Mean Consensus Expectation Fundamental $112.25 Normalized EPS Mean Reversion $106.75 Expected EPS Growth** 7.3% Prior Year S&P 500 EPS** $99.00 EPS Target $106.25 Implied P/E 14.8x Source: BMO Capital Markets Investment Strategy. ** Growth rates are based on BMO Investment Strategy Group 2012 year-end forecast.
US Strategy – Recommended S&P 500 Sector Weightings Sector Opinion Tgt. Wgt. Consumer Discretionary MW 11% Consumer Staples MW 11% Energy OW 12% Financials MW 15% Health Care MW 12% Industrials OW 12.5% Information Technology OW 21% Materials MW 3.5% Telecom Services UW 1% Utilities UW 1% Source: BMO Capital Markets, BMO Capital Markets Investment Strategy Group. OW: Overweight MW: Market Weight UW: Underweight Major Market Index Performance – Year to Date
6.2%7.3%
4.7%
7.3% 7.5%
5.1%
0%
2%
4%
6%
8%
SPX INDU COMP RUT SVX SGX
Source: BMO Capital Markets, BMO Capital Markets Investment Strategy Group. Price as of 2/28/2013
This report was prepared in part by an analyst(s) employed by a Canadian affiliate, BMO Nesbitt Burns Inc., and who is (are) not registered as a research analyst(s) under FINRA rules. For disclosure statements, including the Analyst’s Certification, please refer to pages 7 to 8.
Portfolio Strategy Top 15 Fundamental Lists March 2013
March 1, 2013 Toronto, Ontario Brian G. Belski BMO Capital Markets Corp. (416) 359-5761 [email protected] Assoc: Elena Lissitsyna BMO Nesbitt Burns Inc. (416) 359-4993 [email protected]
Methodology The BMO Capital Markets Top 15 fundamental lists are designed to provide investors with BMO Equity Research best investment ideas based on the strength of our fundamental analysis. The Top 15 lists allow investors to quickly access the most relevant ideas for their investment circumstances and objectives within five specific categories:
1. Canadian Large Cap
2. Canadian Small Cap
3. U.S. Large Cap
4. U.S. Small Cap
5. Income
The Top 15 fundamental lists are drawn from across our universe of 974 stocks covered by 61 analysts. All of the stocks appearing on the lists are selected from the ranks of BMO Research’s Outperform-rated stocks. The stocks are also selected with an eye to achieving a degree of diversification
within the constraints of each list’s objectives and criteria and availability of suitable Outperform-rated stocks.
Initiated in January 2002, the Canadian Large Cap, Canadian Small Cap and Income lists have a track record approaching 11 years. The two U.S. Top 15 lists were initiated in January 2008, with a 5-year track record. Performance of each list is based on total return and is measured against the most appropriate benchmark according to the list’s inclusion criteria.
We believe the BMO Capital Markets Top 15 fundamental lists serve as ready sources of our research analysts’ investment ideas and highlight BMO Equity Research stock-picking capabilities and track record.
Please note that this report does not include the performance of Canadian and U.S. Quantitative Top 15 lists, as those are based on BMO Capital Markets Factor Models and addressed specifically in their own monthly reports.
Top 15 Lists Performance Summary (%) (for period ending February 28, 2013)
Feb-13 YTD 1YR 3YR 5YR Since
Inception Top 15 CDN Large Cap 2.17 4.31 8.32 9.36 2.61 9.18 S&P/TSX 60 1.65 3.89 6.00 5.66 1.35 7.31 Over (under) Performance 0.52 0.43 2.32 3.70 1.25 1.87 Top 15 CDN Small Cap 0.05 4.78 10.62 16.90 14.57 19.82 BMO Small Cap Index (Wtd) (2.64) 0.31 (8.09) 5.85 3.25 8.84 Over (under) Performance 2.68 4.47 18.71 11.06 11.32 10.98 Top 15 U.S. Large Cap 4.99 13.82 23.07 17.77 7.14 6.80 S&P 500 4.19 9.98 18.17 12.54 5.98 4.68 Over (under) Performance 0.80 3.84 4.90 5.24 1.16 2.12 Top 15 U.S. Small Cap 5.84 17.98 33.21 21.01 18.09 16.10 Russell 2000 3.99 10.83 18.76 13.77 8.42 6.96 Over (under) Performance 1.85 7.14 14.44 7.24 9.67 9.14 Top 15 Income 3.75 7.37 16.99 14.36 9.93 13.43 BMO Income Index 2.75 5.73 15.48 13.97 8.36 11.00 Over (under) Performance 1.00 1.64 1.51 0.38 1.57 2.43
Source: BMO Capital Markets, IHS Global Insight
Refer to pages 4 to 5 for Important Disclosures, including Analyst's Certification.
Brian G. Belski Chief Investment Strategist 416-359-5761 [email protected]
Performance is losing momentum as commodities fall While the 1.1% gain for the TSX Index roughly matched the S&P 500 in February, longer-term price, fundamental and macro trends continue to favor US stocks. For instance, Canadian stocks continue to lag their US brethren by a more than two-to-one margin so far in 2013, with the TSX posting price performance of 2.5% relative to the US at 6.5%. Furthermore, some vital macro trends tied to the Canadian market such as lower metals and crude oil prices will likely continue to provide headwinds for stocks. On a slightly positive note, fourth quarter results were mixed – somewhat encouraging for earnings but disappointing for sales. EPS surprise came in at a decent 4.2%, while sales surprise was a negative 0.7%. Also, year-over-year quarterly EPS growth was a nice 17.6%, with sales growth posting a modest gain of 1.4%. Given that our models are designed to factor in changes in commodity prices and analyst estimates, deviations were not significant enough to warrant an update to our targets. Therefore, our 2013 price and earnings targets for the S&P/TSX remain unchanged from last month at 13,275 and $912.25, respectively.
S&P/ TSX Full Year Target Forecasts Model Category 2013E S&P/TSX Price Target Dividend Discount Model Fundamental 11,875 Fair Value Price-to-Earnings Model Valuation 14,025 EPS Revision Model Mean Reversion 13,825 Macroeconomic Regression Model Macro 13,375 Expected Return 3.5% Prior Month S&P/ TSX Close 12,822 Price Target 13,275 S&P/TSX Earnings Per Share Target Macroeconomic Regression Model Macro $963.75 Mean Consensus Regression Model Macro $895.25 Bottom Up Mean Consensus Expectation Fundamental $757.75 Normalized EPS Mean Reversion $929.00 Expected EPS Growth** 9.1% Prior Year S&P/ TSX EPS** $836.00 EPS Target $912.25 Implied P/E 14.6x Source: BMO Capital Markets Investment Strategy. ** Growth rates are based on BMO Investment Strategy Group 2012 year-end forecast.
CDN Strategy – Recommended S&P/TSX Sector Weightings Sector Opinion Tgt. Wgt. Consumer Discretionary UW 2% Consumer Staples MW 3% Energy MW 26% Financials OW 35% Health Care UW 0% Industrials OW 8% Information Technology MW 1% Materials MW 19% Telecom Services MW 5% Utilities UW 1% Source: BMO Capital Markets, BMO Capital Markets Investment Strategy Group. OW: Overweight MW: Market Weight UW: Underweight Major Market Index Performance – Year to Date
3.1% 3.5%
-0.8%
6.2%7.5%
0.2%
-2%
0%
2%
4%
6%
8%
TSX TSX60
TSXSmallCap
S&P500
MSCIEAFE
MSCIEM
Source: BMO Capital Markets, BMO Capital Markets Investment Strategy Group. Price as of 2/28/2013
Large Cap Canadian PLUS Model Portfolio
The Large Cap Canadian PLUS Equity Model Portfolio contains a combination of Canadian and U.S. Equities. While the portfolio usually contains only Outperform-rated stocks, it is sometimes necessary to include stocks that are rated Market Perform or that may not be currently rated by BMO Capital Markets in order to keep the portfolio well diversified. The number of stocks in this portfolio rages from 30 to upwards of 35 stocks, in which roughly two-thirds are invested in the Canadian market and the remaining one-third invested in U.S. equities. The goal is to build a portfolio of largely Canadian equities supplemented by U.S. equities, which offer diversification into industries with limited op-portunities for investment in the Canadian market.
Top 15 Lists
BMO Capital Markets Research produces five fundamen-tally driven Top 15 Lists that highlight a selection of top investment ideas drawn from across our universe of 959 stocks covered by 60 analysts. All of the stocks appearing on these lists are selected from the ranks of BMO Research’s Outperform-rated stocks. The stocks are also selected with an eye to achieving a degree of diversification within the constraints of each list’s objectives and criteria, and avail-ability of suitable Outperform-rated stocks. As such, we believe the BMO Capital Markets Research Top 15 lists serve as ready sources of our research analysts’ investment
Equity Research – Viewpoint Page 3
ideas as well as benchmarks to measure the value-add of these ideas.
The lists are updated regularly and presented weekly in BMO Capital Markets Week in Review and daily in BMO Research Today. As a result, each list allows investors to quickly access the most relevant ideas for their investment circumstances and objectives within five specific categories:
1) Canadian Large Cap
2) Canadian Small Cap
3) U.S. Large Cap
4) U.S. Small Cap
5) Income
We also produce a Top 15 Quantitative List for each of the Canadian and U.S. markets. These lists are based on the BMO Research’s Quantitative Factor Model, which is based solely on quantitative inputs and measures that do not necessarily correspond with our analysts’ fundamentally based ratings. These two quantitative lists may also contain stocks not currently covered by BMO Capital Markets.
Periodicals
Week in Review
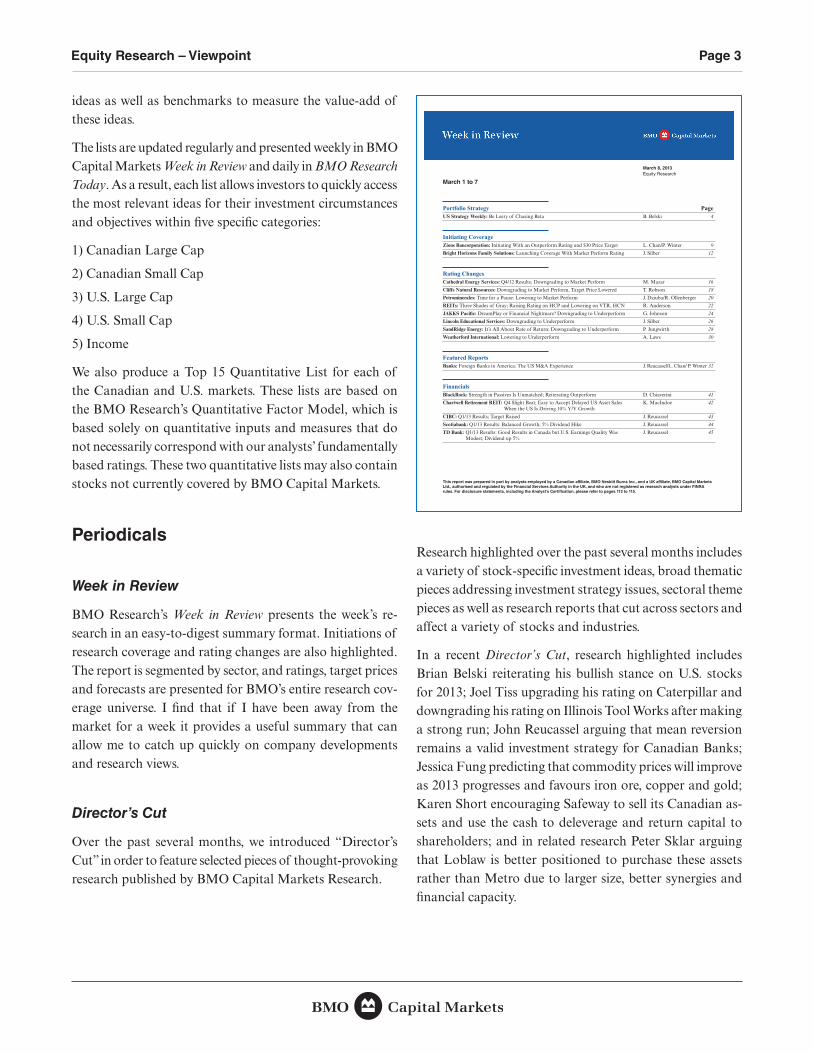
BMO Research’s Week in Review presents the week’s re-search in an easy-to-digest summary format. Initiations of research coverage and rating changes are also highlighted. The report is segmented by sector, and ratings, target prices and forecasts are presented for BMO’s entire research cov-erage universe. I find that if I have been away from the market for a week it provides a useful summary that can allow me to catch up quickly on company developments and research views.
Director’s Cut
Over the past several months, we introduced “Director’s Cut” in order to feature selected pieces of thought-provoking research published by BMO Capital Markets Research.
March 8, 2013Equity Research
March 1 to 7
Portfolio Strategy PageUS Strategy Weekly: Be Leery of Chasing Beta B. Belski 4
Initiating Coverage Zions Bancorporation: Initiating With an Outperform Rating and $30 Price Target L. Chan/P. Winter 9
Bright Horizons Family Solutions: Launching Coverage With Market Perform Rating J. Silber 12
Rating Changes Cathedral Energy Services: Q4/12 Results; Downgrading to Market Perform M. Mazar 16
Cliffs Natural Resources: Downgrading to Market Perform, Target Price Lowered T. Robson 18
Petrominerales: Time for a Pause: Lowering to Market Perform J. Dziuba/R. Ollenberger 20
REITs: Three Shades of Gray; Raising Rating on HCP and Lowering on VTR, HCN R. Anderson 22
JAKKS Pacifi c: DreamPlay or Financial Nightmare? Downgrading to Underperform G. Johnson 24
Lincoln Educational Services: Downgrading to Underperform J. Silber 26
SandRidge Energy: It’s All About Rate of Return; Downgrading to Underperform P. Jungwirth 28
Weatherford International: Lowering to Underperform A. Laws 30
Featured ReportsBanks: Foreign Banks in America: The US M&A Experience J. Reucassel/L. Chan/ P. Winter 32
Financials BlackRock: Strength in Passives Is Unmatched; Reiterating Outperform D. Chiaverini 41
Chartwell Retirement REIT: Q4 Slight Beat; Easy to Accept Delayed US Asset Sales K. MacIndoe 42 When the US Is Driving 10% Y/Y Growth
CIBC: Q1/13 Results; Target Raised J. Reucassel 43
TD Bank: Q1/13 Results: Good Results in Canada but U.S. Earnings Quality Was J. Reucassel 45 Modest; Dividend up 5%
This report was prepared in part by analysts employed by a Canadian affiliate, BMO Nesbitt Burns Inc., and a UK affiliate, BMO Capital Markets Ltd., authorised and regulated by the Financial Services Authority in the UK, and who are not registered as research analysts under FINRA rules. For disclosure statements, including the Analyst’s Certi� cation, please refer to pages 112 to 115.
Research highlighted over the past several months includes a variety of stock-specific investment ideas, broad thematic pieces addressing investment strategy issues, sectoral theme pieces as well as research reports that cut across sectors and affect a variety of stocks and industries.
In a recent Director’s Cut, research highlighted includes Brian Belski reiterating his bullish stance on U.S. stocks for 2013; Joel Tiss upgrading his rating on Caterpillar and downgrading his rating on Illinois Tool Works after making a strong run; John Reucassel arguing that mean reversion remains a valid investment strategy for Canadian Banks; Jessica Fung predicting that commodity prices will improve as 2013 progresses and favours iron ore, copper and gold; Karen Short encouraging Safeway to sell its Canadian as-sets and use the cash to deleverage and return capital to shareholders; and in related research Peter Sklar arguing that Loblaw is better positioned to purchase these assets rather than Metro due to larger size, better synergies and financial capacity.
Page 4 Equity Research – Viewpoint
This will help to ensure investment strategy and actions are suitable under the circumstances and increase the likelihood that investment objectives will be met. It will also help to filter out some of the noise and allow relevant information and investment recommendations through.
Also, investors need to recognize that tactical investment decisions are not as important as a long-term investment strategy. Trying to time the market or individual securi-ties transactions is not a likely path to investment success. Studies show that investors generally tend to be overly op-timistic about and overconfident of their trading abilities. It is better to focus on security selection as part of building a diversified equity portfolio. Companies with reasonable valuations, strong competitive positions, attractive and growing markets, strong financial positions and manage-ment teams with good track records should serve investors well over the longer term.
So while reviewing this Red Book, with its vast amounts of de-tailed sectoral and company data and investment ideas, keep in mind the bigger picture and strategic investment view.
Top 15 List and Model Portfolio Performance
We have discussed the usefulness of BMO Capital Markets Research Top 15 Lists and Model Portfolios as a means of highlighting investment ideas, but they also serve as bench-marks to measure the value added of these ideas.
We are pleased to report that we have continued to add value with our Top 15 List selections as measured against their relevant benchmarks since their initiation. The Canadian Large Cap Top 15 List and the Canadian Small Cap Top 15 List have track records of over 10 years The U.S. Top 15 Lists have shorter track records but have also managed to outperform their benchmarks. It is worth noting that these lists should not be regarded as suitably diversified invest-ment portfolios on their own. They have only 15 stocks and limited diversification due to the constraints of each list’s criteria.
Ian de VerteuilGlobal Head of ResearchBMO Nesbitt Burns Inc.
In this edition of “Director’s Cut”, we have featured selected pieces of insightful research published by BMO Capital Markets during January 2013. Ideas that caught our attention include a) strong outlook for US stocks; b) improving fortunes for Caterpillar; c) mean reversion among Canadian Banks; d) mining commodity strategy for 2013; and e) acquisition scenarios for Safeway Canada.
Brian Belski reiterates his bullish stance on US stocks in 2013. He points out that asset classes that underperform in one cycle have a tendency to outperform throughout the next cycle, with US stocks falling squarely into that category. Brian cites the ability of the US economy to deliver consistent growth for the next few years compared to slowing growth in emerging markets, and the compressed valuation multiples for domestic stocks compared to declining EPS growth for global stocks. Brian favours a) Industrials, Technology and Energy in the US; and b) Financials and Industrials in Canada.
Consistent with a positive view on Industrials, we have highlighted some changes in our recommendations among the US large caps. Joel Tiss upgraded his opinion on Caterpillar due to the number of global infrastructure projects, capital availability given the low interest rates, investment in new capacity and infrastructure to enable lower costs and margin expansion and strong global investor demand. To fund the investment in CAT, and after a strong run and a good call, Joel downgraded Illinois Tool Works. He questions whether ITW’s strategy of selling underperforming, lower multiple businesses and using proceeds to buy back expensive shares is the best way to return capital to shareholders in the near term. Joel is concerned about increased cyclicality as the company de-emphasizes opportunistic acquisitions during downturns that have historically smoothed out earnings volatility.
John Reucassel argues that mean reversion remains a valid investment strategy for Canadian Banks, which have moved as a group over time. He shows that historically, buying the worst performing bank stock had a 55% chance of outperforming the Bank Index the following year (3.6% on average). John believes that buying CIBC, last year’s laggard, is consistent with this thesis. There could be a wider gap in the performance of the banks as a group due to diverging strategies and platforms (e.g., Scotia and emerging markets), and this argues for selectivity within the group.
Jessica Fung predicts that commodity prices will improve as 2013 progresses due to continued growth from China, pent-up demand from emerging markets and greater clarity from policy makers. She favours iron ore, copper and gold as these feature a combination of favourable supply-demand fundamentals, meaningful imports from China, and a direct link between US$ weakness and the commodity price. Jessica predicts peak pricing for most commodities in 2014, but is cautious thereafter as growth in supply outpaces demand due to the large number of greenfield and brownfield projects in development.
Finally, Karen Short encourages Safeway to sell its Canadian assets and use the cash to deleverage and return capital to shareholders. In a contrarian stance, she argues that Safeway Canada could be valued as high as 10x EBITDA due to its valuable real estate and exclusive rights to the AIRMILES Rewards program in Western Canada. From a buyer’s perspective, Peter Sklar argues that Loblaw is better positioned to purchase these assets versus Metro due to its larger size, better synergies and proceeds of $500 million from the pending REIT IPO. Peter believes that in the event of a bidding war, Loblaw could bid through 10x EBITDA, although such a price would probably be viewed negatively by investors.
January 2013
Click here to view important disclosure on the stocks mentioned in this report.To view all of our research, click here for access to our website.
Recurring Affinity for International Bias Seems Tired (Periodical)Investment Strategy 2013 Looks Challenging but Longer Term Upside to Stock; Upgrading to Outperform (Comment)Machinery
Not Enough Left; Cutting to Market Perform (Comment)Machinery
Mean Reversion and Canadian Bank Stocks (Report)Banks Update From Colombia (Comment)Banks Commodity Canvas: Q1/13: Reset Complete; Positioning for the Peak (Report)Global Mining Research
Dear SWY: Sell Canada, Delever, Buy Back Stock (Comment)Food Retail
What If Loblaw Acquired Safeway Canada? (Comment)Food & Drug Retailing
February 1, 2013
Director’s Cut
Implication for Investors
Another element of a strategy to handle the volume of infor-mation flow and how to react to it is to have an investment policy/strategy that reflects asset mix targets, risk tolerance, need for income, appetite for growth, time horizon, etc.
Equity Research – Viewpoint Page 5
Chart 5BMO Capital Markets Top 15 Canadian Small Cap List
Total Return vs. BMO SCI (Weighted)
Source: BMO Capital Markets, IHS Global InsightPeriod ended February 28, 2013
Income Top 15 Index 1 Yr 17.0% 15.5% 5 Yr 9.9% 8.4% Jan 02 13.3% 11.0%
The past 12 months have seen improved equity markets, particularly large cap and U.S. stocks. Canadian small caps have been volatile and lagged in performance.
Over the 12 months ended February 28, 2013, the Large Cap Canadian Equity Portfolio posted a total return of 5.1% compared to 4.6% for the S&P/TSX Composite.
Over the 12 months ended February 28, 2013, our Large Cap Canada Plus Portfolio generated a total return of 7.1% compared to 9.0% for its blended benchmark (two-thirds S&P/TSX, one-third S&P 500 in C$).
Over the 12 months ended February 28, 2013, the Canadian Small Cap Portfolio rose 10.8% compared to the decline of 12.1% of the unweighted BMO SCI and the 8.1% loss of the weighted BMO SCI.
While not all model portfolios beat their benchmark over the past 12 months, all are ahead of their benchmarks for the past three- and five-year periods.
Equity Research – Viewpoint Page 7
Chart 11Research Track Record
(Rebalanced Semi-Annually)
Note: To March 2013; Analysis performed semi-annually based on March and September Red Book pricing dates.Source: BMO Capital Markets
0
500
1,000
1,500
2,000
2,500
3,000
1983
1985
1987
1989
1991
1993
1995
1997
1999
2001
2003
2005
2007
2009
2011
2013
0
500
1,000
1,500
2,000
2,500
3,000
Outperform
S&P/TSX
Underperform
For 30 years, BMO Capital Markets has measured the per-formance of our stock recommendations on a semi-annual basis. We track the performance of all Outperforms (5- and 4-rated stocks in our prior rating system) based on the rat-ings and prices in our September and March Red Books. This creates a transparent and verifiable database to measure the department’s value-add. This equal-weighting list of rec-ommendations has outperformed the S&P/TSX Composite Index by 5.2% per annum since March 1983.
Conclusion
For over 30 years, the BMO Capital Markets Red Book has served as our benchmark research publication and the key handbook covering Canada’s equity market. It attempts to marry a number of macro perspectives (delivered over the next few pages) with a reference document for Canadian investors, complete with single-page summaries of over 500 companies that are the de facto universe of Canadian equity alternatives. We hope that our clients find this docu-ment, and indeed all our research publications, helpful. If you have any suggestions for us, please send me an email at [email protected].
In closing, we would like to thank all of the professionals within our department that contribute to this publication.
Page 8 Equity Research – Viewpoint
Table 1BMO Capital Markets Top 15 U.S. and Canadian Large Cap and Small Cap Stocks Lists
as of February 28, 2013
Top 15 Canadian Large Cap StocksSelected from BMO Capital Markets Large Cap Coverage Universe
I, Willa Hoffmann, CFA, hereby certify that the views expressed in this report accurately reflect my personal views about the subject securities or issuers. I also certify that no part of my compensation was, is, or will be, directly or indirectly, related to the specific rec-ommendations or views expressed in this report.
Analysts who prepared this report are compensated based upon (among other factors) the overall profitability of BMO Capital Markets and their affiliates, which includes the overall profitability of investment banking services. Compensation for research is based on ef-fectiveness in generating new ideas and in communication of ideas to clients, performance of recommendations, accuracy of earnings estimates, and service to clients.
Analysts employed by BMO Nesbitt Burns Inc. and/or BMO Capital Markets Ltd. are not registered as research analysts with FINRA. These analysts may not be associated persons of BMO Capital Markets Corp. and therefore may not be subject to the NASD Rule 2711 and NYSE Rule 472 restrictions on communications with a subject company, public appearances and trading securities held by a research analyst account.
Company Specific Disclosures
For Important Disclosures on the stocks discussed in this report, please go to http://researchglobal.bmocapitalmarkets.com/Public/Company_Disclosure_Public.aspx.
Hold Market Perform 60.7% 9.6% 47.1% 57.3% 48.4% 40.6%
Sell Underperform 2.4% 0.0% 0.0% 4.2% 1.0% 5.4%
* Reflects rating distribution of all companies covered by BMO Capital Markets Corp. equity research analysts.
** Reflects rating distribution of all companies from which BMO Capital Markets Corp. has received compensation for Investment Banking services as percentage within ratings category.
*** Reflects rating distribution of all companies from which BMO Capital Markets Corp. has received compensation for Investment Banking services as percentage of Investment Banking clients.
**** Reflects rating distribution of all companies covered by BMO Capital Markets equity research analysts.
***** Reflects rating distribution of all companies from which BMO Capital Markets has received compensation for Investment Banking services as percentage of Investment Banking clients.
Ratings and Sector KeyWe use the following ratings system definitions: OP = Outperform - Forecast to outperform the market; Mkt = Market Perform - Forecast to perform roughly in line with the market; Und = Underperform - Forecast to underperform the market; (S) = speculative investment; NR = No rating at this time; R = Restricted – Dissemination of research is currently restricted.
Market performance is measured by a benchmark index such as the S&P/TSX Composite Index, S&P 500, Nasdaq Composite, as appropriate for each company. BMO Capital Markets’ seven Top 15 lists guide investors to our best ideas according to different ob-jectives (CDN Large Cap, CDN Small Cap, US Large Cap, US Small Cap, Income, CDN Quant, and US Quant) have replaced the Top Pick rating.
Other Important Disclosures For Important Disclosures on the stocks discussed in this report, please go to http://researchglobal.bmocapitalmarkets.com/Public/Company_Disclosure_Public.aspx or write to Editorial Department, BMO Capital Markets, 3 Times Square, New York, NY 10036 or Editorial Department, BMO Capital Markets, 1 First Canadian Place, Toronto, Ontario, M5X 1H3.
Prior BMO Capital Markets Ratings Systemshttp://researchglobal.bmocapitalmarkets.com/documents/2009/prior_rating_systems.pdf.
Dissemination of ResearchOur research publications are available via our web site http://bmocm.com/research. Institutional clients may also receive our research via FIRST CALL, FIRST CALL Research Direct, Reuters, Bloomberg, FactSet, Capital IQ, and TheMarkets.com. All of our research is made widely available at the same time to all BMO Capital Markets client groups entitled to our research. Additional dissemination may occur via email or regular mail. Please contact your investment advisor or institutional salesperson for more information.
Conflict StatementA general description of how BMO Financial Group identifies and manages conflicts of interest is contained in our public facing policy for managing conflicts of interest in connection with investment research which is available at http://researchglobal.bmocapitalmarkets.com/Public/Conflict_Statement_Public.aspx.
General Disclaimer“BMO Capital Markets” is a trade name used by the BMO Investment Banking Group, which includes the wholesale arm of Bank of Montreal and its subsidiaries BMO Nesbitt Burns Inc., BMO Capital Markets Ltd. in the U.K. and BMO Capital Markets Corp. in the U.S. BMO Nesbitt Burns Inc., BMO Capital Markets Ltd. and BMO Capital Markets Corp are affiliates. Bank of Montreal or its subsidiaries (“BMO Financial Group”) has lending arrangements with, or provide other remunerated services to, many issuers covered by BMO Capital Markets. The opinions, estimates and projections contained in this report are those of BMO Capital Markets as of the date of this report and are subject to change without notice. BMO Capital Markets endeavours to ensure that the contents have been compiled or derived from sources that we believe are reliable and contain information and opinions that are accurate and complete. However, BMO Capital Markets makes no representation or warranty, express or implied, in respect thereof, takes no responsibility for any errors and omissions contained herein and accepts no liability whatsoever for any loss arising from any use of, or reliance on, this report or its contents. Information may be available to BMO Capital Markets or its affiliates that is not reflected in this report. The information in this report is not intended to be used as the primary basis of investment decisions, and because of individual client objectives, should not be construed as advice designed to meet the particular investment needs of any investor. This material is for information purposes only and is not an offer to sell or the solicitation of an offer to buy any security. BMO Capital Markets or its affiliates will buy from or sell to customers the securities of issuers mentioned in this report on a principal basis. BMO Capital Markets or its affiliates, officers, directors or employees have a long or short position in many of the securities discussed herein, related securities or in options, futures or other derivative instruments based thereon. The reader should assume that BMO Capital Markets or its affiliates may have a conflict of interest and should not rely solely on this report in evaluating whether or not to buy or sell securities of issuers discussed herein.
Additional MattersTo Canadian Residents: BMO Nesbitt Burns Inc., affiliate of BMO Capital Markets Corp., furnishes this report to Canadian residents and accepts responsibility for the contents herein subject to the terms set out above. Any Canadian person wishing to effect transactions in any of the securities included in this report should do so through BMO Nesbitt Burns Inc.
The following applies if this research was prepared in whole or in part by Andrew Breichmanas, Tony Robson, or Edward Sterck: This research is not prepared subject to Canadian disclosure requirements. This research is prepared by BMO Capital Markets Limited and subject to the regulations of the Financial Services Authority (FSA) in the United Kingdom. FSA regulations require that a firm providing research disclose its ownership interest in the issuer that is the subject of the research if it and its affiliates own 5% or more of the equity of the issuer. Canadian regulations require that a firm providing research disclose its ownership interest in the issuer that is the subject of the research if it and its affiliates own 1% or more of the equity of the issuer that is the subject of the research. Therefore BMO Capital Markets Limited will only disclose its and its’ affiliates ownership interest in the subject issuer if such owner-ship exceeds 5% of the equity of the issuer.
To U.S. Residents: BMO Capital Markets Corp. and/or BMO Nesbitt Burns Securities Ltd., affiliates of BMO NB, furnish this report to U.S. residents and accept responsibility for the contents herein, except to the extent that it refers to securities of Bank of Montreal. Any U.S. person wishing to effect transactions in any security discussed herein should do so through BMO Capital Markets Corp. and/or BMO Nesbitt Burns Securities Ltd.
To U.K. Residents: In the UK this document is published by BMO Capital Markets Limited which is authorised and regulated by the Financial Services Authority. The contents hereof are intended solely for the use of, and may only be issued or passed on to, (I) persons who have professional experience in matters relating to investments falling within Article 19(5) of the Financial Services and Markets Act 2000 (Financial Promotion) Order 2005 (the “Order”) or (II) high net worth entities falling within Article 49(2)(a) to (d) of the Order (all such persons together referred to as “relevant persons”). The contents hereof are not intended for the use of and may not be issued or passed on to, retail clients.
ADDITIONAL INFORMATION IS AVAILABLE UPON REQUEST BMO Financial Group (NYSE, TSX: BMO) is an integrated financial services provider offering a range of retail banking, wealth management, and investment and corporate banking products. BMO serves Canadian retail clients through BMO Bank of Montreal and BMO Nesbitt Burns. In the United States, personal and commercial banking clients are served by BMO Harris Bank N.A., (Member FDIC). Investment and corporate banking services are provided in Canada and the US through BMO Capital Markets.
BMO Capital Markets is a trade name used by BMO Financial Group for the wholesale banking businesses of Bank of Montreal, BMO Harris Bank N.A, (Member FDIC), BMO Ireland Plc, and Bank of Montreal (China) Co. Ltd. and the institutional broker dealer businesses of BMO Capital Markets Corp. (Member SIPC), BMO Nesbitt Burns Trading Corp. S.A., BMO Nesbitt Burns Securities Limited (Member SIPC) and BMO Capital Markets GKST Inc. (Member SIPC) in the U.S., BMO Nesbitt Burns Inc. (Member Canadian Investor Protection Fund) in Canada, Europe and Asia, BMO Capital Markets Limited in Europe, Asia and Australia and BMO Advisors Private Limited in India.
“Nesbitt Burns” is a registered trademark of BMO Nesbitt Burns Corporation Limited, used under license. “BMO Capital Markets” is a trademark of Bank of Montreal, used under license. "BMO (M-Bar roundel symbol)" is a registered trademark of Bank of Montreal, used under license.
® Registered trademark of Bank of Montreal in the United States, Canada and elsewhere. TM Trademark Bank of Montreal