Equity Research Semi-Monthly Report March 17, 2016 Cameron Bean – (403) 218-6786 Erik Kuhn, CFA – (403) 213-7349 (Scotia Capital Inc. – Canada) (Scotia Capital Inc. – Canada) [email protected][email protected]For Reg AC Certification and important disclosures see Appendix A of this report. Analysts employed by non-U.S. affiliates are not registered/qualified as research analysts with FINRA in the U.S. But Top Oil & Gas Well Report (Alberta and Saskatchewan Edition) DISCUSSION JANUARY 2016 ALBERTA AND SASKATCHEWAN PRODUCTION RATES • Each month, we compile data on the top producing oil and gas wells in Alberta and Saskatchewan as disclosed in GeoScout. We rank the wells placed on production during the most recent two months (the “new wells”) and the wells placed on production over the previous 12 months by their production rates in the current month for which data are available. We also rank the top producing confidential wells, the top 90-day initial production (IP) rates, and the top cumulative production from wells placed on production during the previous 12 months. This month, we have production data for January 2016. NOTABLE ALBERTA OIL/WELLHEAD CONDENSATE RESULTS • The Canadian International Oil Corp. (private) Gold Creek Montney play delivered the top two wells by calendar day rate among both new wells and wells placed onstream over the previous 12 months (see Exhibits 2 and 4). The wells averaged 974 bbl/d (with 3.9 mmcf/d of raw associated gas) and 780 bbl/d (with 4.8 mmcf/d of raw associated gas). • The Kelt Exploration Ltd. (Kelt; KEL-T) La Glace Montney play delivered the fifth-ranked new well by calendar day rate and the third-ranked new well by producing day rate, with a producing day rate of 550 bbl/d over ~28 days onstream (see Exhibits 2 and 3). Kelt’s 8-18 Pouce Coupe Montney well ranked third by calendar day rate among wells onstream over the previous 12 months, with a rate of 666 bbl/d and 2.0 mmcf/d of associated gas (see Exhibit 4). • The Surge Energy Inc. (SGY-T) 15-6 Valhalla Doig well maintained the top-ranked 90-day IP rate and cumulative production rate among wells placed onstream over the previous 12 months, while the company’s 4-6 Valhalla Doig well ranked second in both categories (see Exhibits 6 and 7). • The Penn West Exploration (PWT-T) Willesden Green Cardium play delivered six of the top 20 wells by calendar day rate among wells onstream over the previous 12 months, with average production rates ranging from 349 bbl/d to 596 bbl/d (see Exhibit 4). • Shell Canada Ltd. (private) delivered two of the top 10 new wells by calendar day rate from its Ferrier- and Kaybob-area Duvernay plays (see Exhibit 2). The two wells averaged 643 bbl/d (with 3.1 mmcf/d of raw gas) and 341 bbl/d (with 0.2 mmcf/d of raw gas).
Transcript
Equity Research Semi-Monthly Report March 17, 2016
Cameron Bean – (403) 218-6786 Erik Kuhn, CFA – (403) 213-7349 (Scotia Capital Inc. – Canada) (Scotia Capital Inc. – Canada) [email protected][email protected] For Reg AC Certification and important disclosures see Appendix A of this report. Analysts employed by non-U.S. affiliates are not registered/qualified as research analysts with FINRA in the U.S.
But Top Oil & Gas Well Report (Alberta and Saskatchewan Edition) D I S C U S S I O N
J A N U A R Y 2 0 1 6 A L B E R T A A N D S A S K A T C H E W A N P R O D U C T I O N R A T E S
• Each month, we compile data on the top producing oil and gas wells in Alberta and Saskatchewan as disclosed in GeoScout. We rank the wells placed on production during the most recent two months (the “new wells”) and the wells placed on production over the previous 12 months by their production rates in the current month for which data are available. We also rank the top producing confidential wells, the top 90-day initial production (IP) rates, and the top cumulative production from wells placed on production during the previous 12 months. This month, we have production data for January 2016.
N O T A B L E A L B E R T A O I L / W E L L H E A D C O N D E N S A T E R E S U L T S
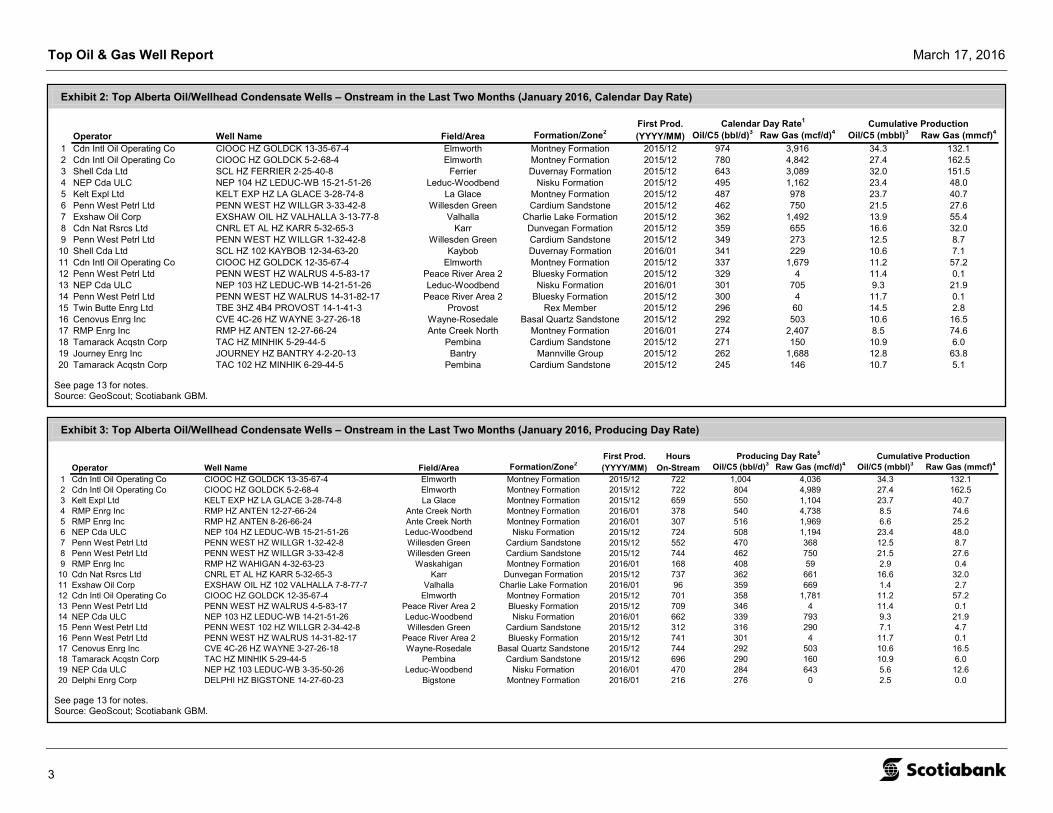
• The Canadian International Oil Corp. (private) Gold Creek Montney play delivered the top two wells by calendar day rate among both new wells and wells placed onstream over the previous 12 months (see Exhibits 2 and 4). The wells averaged 974 bbl/d (with 3.9 mmcf/d of raw associated gas) and 780 bbl/d (with 4.8 mmcf/d of raw associated gas).
• The Kelt Exploration Ltd. (Kelt; KEL-T) La Glace Montney play delivered the fifth-ranked new well by calendar day rate and the third-ranked new well by producing day rate, with a producing day rate of 550 bbl/d over ~28 days onstream (see Exhibits 2 and 3). Kelt’s 8-18 Pouce Coupe Montney well ranked third by calendar day rate among wells onstream over the previous 12 months, with a rate of 666 bbl/d and 2.0 mmcf/d of associated gas (see Exhibit 4).
• The Surge Energy Inc. (SGY-T) 15-6 Valhalla Doig well maintained the top-ranked 90-day IP rate and cumulative production rate among wells placed onstream over the previous 12 months, while the company’s 4-6 Valhalla Doig well ranked second in both categories (see Exhibits 6 and 7).
• The Penn West Exploration (PWT-T) Willesden Green Cardium play delivered six of the top 20 wells by calendar day rate among wells onstream over the previous 12 months, with average production rates ranging from 349 bbl/d to 596 bbl/d (see Exhibit 4).
• Shell Canada Ltd. (private) delivered two of the top 10 new wells by calendar day rate from its Ferrier- and Kaybob-area Duvernay plays (see Exhibit 2). The two wells averaged 643 bbl/d (with 3.1 mmcf/d of raw gas) and 341 bbl/d (with 0.2 mmcf/d of raw gas).
Top Oil & Gas Well Report March 17, 2016
2
N O T A B L E A L B E R T A R A W G A S R E S U L T S
• The Jupiter Resources Inc. (private) Kakwa Falher play delivered six of the top eight calendar day rates among wells placed onstream over the previous 12 months, with average production of 12.4 mmcf/d to 13.8 mmcf/d (see Exhibit 10). The company’s 16-18 and 16-2 Kakwa Wilrich wells ranked first and second, respectively, by cumulative production among placed wells onstream over the previous 12 months (see Exhibit 13).
• Peyto Exploration & Development Corp. (PEY-T) had six wells from its Brazeau River, Ansell, and Sundance Falher and Notikewin plays rank among the top 20 new wells by calendar day rate (see Exhibit 8). The company’s 9-32 Sundance Notikewin well ranked fifth by cumulative production among wells placed onstream over the previous 12 months (see Exhibit 13).
• The Bellatrix Exploration Ltd. (Bellatrix; BXE-T) greater Pembina Upper Mannville play delivered two of the top 12 wells by calendar day rate among wells placed onstream over the previous 12 months (see Exhibit 10), with the 13-19 well also ranking third among new wells by calendar day rate, with average production of 10.0 mmcf/d (see Exhibit 8). Another new Bellatrix greater Pembina Upper Mannville well ranked 10th by producing day rate with average production of 7.5 mmcf/d over its first 10 days onstream (see Exhibit 9).
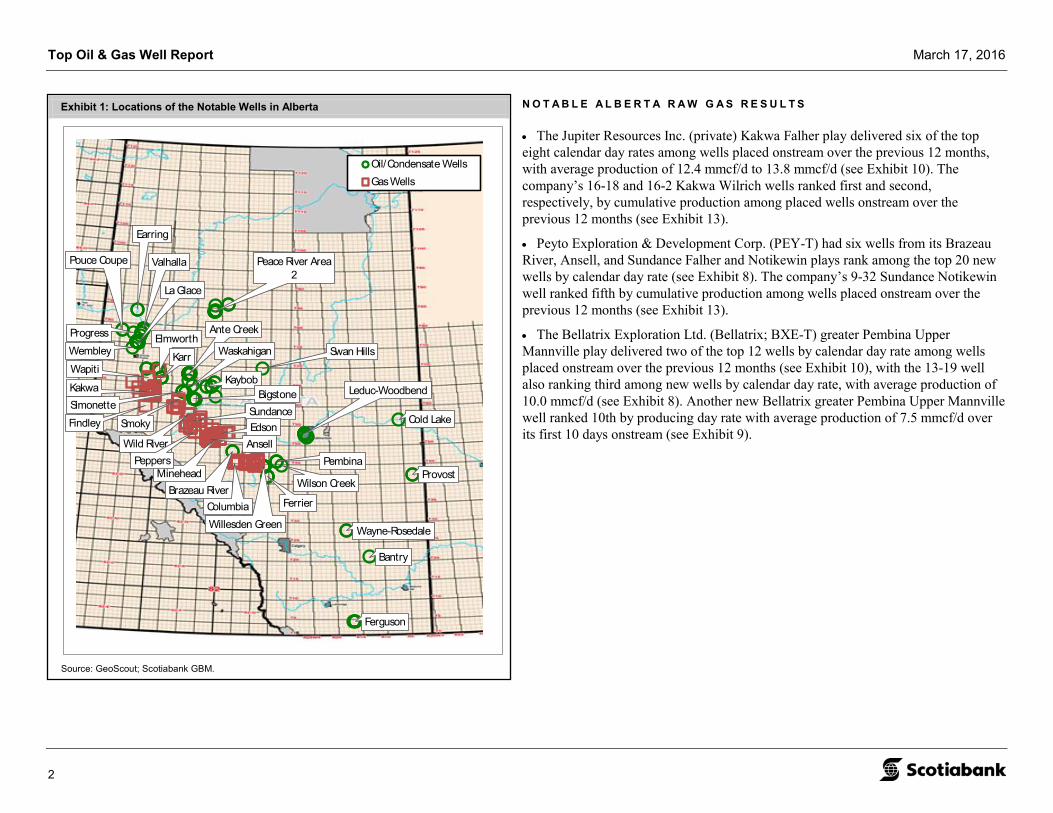
Exhibit 1: Locations of the Notable Wells in Alberta
Source: GeoScout; Scotiabank GBM.
Elmworth
Pouce Coupe
Ferrier
Willesden Green
Leduc-Woodbend
La Glace
Valhalla Peace River Area 2
Wilson Creek
Karr
Kaybob
Provost
Wayne-Rosedale
Ante Creek
Pembina
Bantry
Waskahigan
Bigstone
Earring
Ferguson
Simonette
Brazeau River
Wembley Swan Hills
Cold Lake
Kakwa
Progress
Minehead
Findley
Columbia
AnsellWild River
SundanceEdsonSmoky
Wapiti
Peppers
Oil/Condensate WellsGas Wells
Top Oil & Gas Well Report March 17, 2016
3
Exhibit 2: Top Alberta Oil/Wellhead Condensate Wells – Onstream in the Last Two Months (January 2016, Calendar Day Rate)
See page 13 for notes. Source: GeoScout; Scotiabank GBM.
First Prod. Calendar Day Rate1 Cumulative ProductionOperator Well Name Field/Area Formation/Zone2 (YYYY/MM) Oil/C5 (bbl/d)3 Raw Gas (mcf/d)4 Oil/C5 (mbbl)3 Raw Gas (mmcf)4
1 Cdn Intl Oil Operating Co CIOOC HZ GOLDCK 13-35-67-4 Elmworth Montney Formation 2015/12 974 3,916 34.3 132.12 Cdn Intl Oil Operating Co CIOOC HZ GOLDCK 5-2-68-4 Elmworth Montney Formation 2015/12 780 4,842 27.4 162.53 Shell Cda Ltd SCL HZ FERRIER 2-25-40-8 Ferrier Duvernay Formation 2015/12 643 3,089 32.0 151.54 NEP Cda ULC NEP 104 HZ LEDUC-WB 15-21-51-26 Leduc-Woodbend Nisku Formation 2015/12 495 1,162 23.4 48.05 Kelt Expl Ltd KELT EXP HZ LA GLACE 3-28-74-8 La Glace Montney Formation 2015/12 487 978 23.7 40.76 Penn West Petrl Ltd PENN WEST HZ WILLGR 3-33-42-8 Willesden Green Cardium Sandstone 2015/12 462 750 21.5 27.67 Exshaw Oil Corp EXSHAW OIL HZ VALHALLA 3-13-77-8 Valhalla Charlie Lake Formation 2015/12 362 1,492 13.9 55.48 Cdn Nat Rsrcs Ltd CNRL ET AL HZ KARR 5-32-65-3 Karr Dunvegan Formation 2015/12 359 655 16.6 32.09 Penn West Petrl Ltd PENN WEST HZ WILLGR 1-32-42-8 Willesden Green Cardium Sandstone 2015/12 349 273 12.5 8.710 Shell Cda Ltd SCL HZ 102 KAYBOB 12-34-63-20 Kaybob Duvernay Formation 2016/01 341 229 10.6 7.111 Cdn Intl Oil Operating Co CIOOC HZ GOLDCK 12-35-67-4 Elmworth Montney Formation 2015/12 337 1,679 11.2 57.212 Penn West Petrl Ltd PENN WEST HZ WALRUS 4-5-83-17 Peace River Area 2 Bluesky Formation 2015/12 329 4 11.4 0.113 NEP Cda ULC NEP 103 HZ LEDUC-WB 14-21-51-26 Leduc-Woodbend Nisku Formation 2016/01 301 705 9.3 21.914 Penn West Petrl Ltd PENN WEST HZ WALRUS 14-31-82-17 Peace River Area 2 Bluesky Formation 2015/12 300 4 11.7 0.115 Twin Butte Enrg Ltd TBE 3HZ 4B4 PROVOST 14-1-41-3 Provost Rex Member 2015/12 296 60 14.5 2.816 Cenovus Enrg Inc CVE 4C-26 HZ WAYNE 3-27-26-18 Wayne-Rosedale Basal Quartz Sandstone 2015/12 292 503 10.6 16.517 RMP Enrg Inc RMP HZ ANTEN 12-27-66-24 Ante Creek North Montney Formation 2016/01 274 2,407 8.5 74.618 Tamarack Acqstn Corp TAC HZ MINHIK 5-29-44-5 Pembina Cardium Sandstone 2015/12 271 150 10.9 6.019 Journey Enrg Inc JOURNEY HZ BANTRY 4-2-20-13 Bantry Mannville Group 2015/12 262 1,688 12.8 63.820 Tamarack Acqstn Corp TAC 102 HZ MINHIK 6-29-44-5 Pembina Cardium Sandstone 2015/12 245 146 10.7 5.1
Exhibit 3: Top Alberta Oil/Wellhead Condensate Wells – Onstream in the Last Two Months (January 2016, Producing Day Rate)
See page 13 for notes. Source: GeoScout; Scotiabank GBM.
First Prod. Hours Producing Day Rate5 Cumulative ProductionOperator Well Name Field/Area Formation/Zone2 (YYYY/MM) On-Stream Oil/C5 (bbl/d)3 Raw Gas (mcf/d)4 Oil/C5 (mbbl)3 Raw Gas (mmcf)4
1 Cdn Intl Oil Operating Co CIOOC HZ GOLDCK 13-35-67-4 Elmworth Montney Formation 2015/12 722 1,004 4,036 34.3 132.12 Cdn Intl Oil Operating Co CIOOC HZ GOLDCK 5-2-68-4 Elmworth Montney Formation 2015/12 722 804 4,989 27.4 162.53 Kelt Expl Ltd KELT EXP HZ LA GLACE 3-28-74-8 La Glace Montney Formation 2015/12 659 550 1,104 23.7 40.74 RMP Enrg Inc RMP HZ ANTEN 12-27-66-24 Ante Creek North Montney Formation 2016/01 378 540 4,738 8.5 74.65 RMP Enrg Inc RMP HZ ANTEN 8-26-66-24 Ante Creek North Montney Formation 2016/01 307 516 1,969 6.6 25.26 NEP Cda ULC NEP 104 HZ LEDUC-WB 15-21-51-26 Leduc-Woodbend Nisku Formation 2015/12 724 508 1,194 23.4 48.07 Penn West Petrl Ltd PENN WEST HZ WILLGR 1-32-42-8 Willesden Green Cardium Sandstone 2015/12 552 470 368 12.5 8.78 Penn West Petrl Ltd PENN WEST HZ WILLGR 3-33-42-8 Willesden Green Cardium Sandstone 2015/12 744 462 750 21.5 27.69 RMP Enrg Inc RMP HZ WAHIGAN 4-32-63-23 Waskahigan Montney Formation 2016/01 168 408 59 2.9 0.410 Cdn Nat Rsrcs Ltd CNRL ET AL HZ KARR 5-32-65-3 Karr Dunvegan Formation 2015/12 737 362 661 16.6 32.011 Exshaw Oil Corp EXSHAW OIL HZ 102 VALHALLA 7-8-77-7 Valhalla Charlie Lake Formation 2016/01 96 359 669 1.4 2.712 Cdn Intl Oil Operating Co CIOOC HZ GOLDCK 12-35-67-4 Elmworth Montney Formation 2015/12 701 358 1,781 11.2 57.213 Penn West Petrl Ltd PENN WEST HZ WALRUS 4-5-83-17 Peace River Area 2 Bluesky Formation 2015/12 709 346 4 11.4 0.114 NEP Cda ULC NEP 103 HZ LEDUC-WB 14-21-51-26 Leduc-Woodbend Nisku Formation 2016/01 662 339 793 9.3 21.915 Penn West Petrl Ltd PENN WEST 102 HZ WILLGR 2-34-42-8 Willesden Green Cardium Sandstone 2015/12 312 316 290 7.1 4.716 Penn West Petrl Ltd PENN WEST HZ WALRUS 14-31-82-17 Peace River Area 2 Bluesky Formation 2015/12 741 301 4 11.7 0.117 Cenovus Enrg Inc CVE 4C-26 HZ WAYNE 3-27-26-18 Wayne-Rosedale Basal Quartz Sandstone 2015/12 744 292 503 10.6 16.518 Tamarack Acqstn Corp TAC HZ MINHIK 5-29-44-5 Pembina Cardium Sandstone 2015/12 696 290 160 10.9 6.019 NEP Cda ULC NEP HZ 103 LEDUC-WB 3-35-50-26 Leduc-Woodbend Nisku Formation 2016/01 470 284 643 5.6 12.620 Delphi Enrg Corp DELPHI HZ BIGSTONE 14-27-60-23 Bigstone Montney Formation 2016/01 216 276 0 2.5 0.0
Top Oil & Gas Well Report March 17, 2016
4
Exhibit 4: Top Alberta Oil/Wellhead Condensate Wells – Onstream in the Last 12 Months (January 2016, Calendar Day Rate)
See page 13 for notes. Source: GeoScout; Scotiabank GBM.
First Prod. Calendar Day Rate1 Cumulative ProductionOperator Well Name Field/Area Formation/Zone2 (YYYY/MM) Oil/C5 (bbl/d)3 Raw Gas (mcf/d)4 Oil/C5 (mbbl)3 Raw Gas (mmcf)4
1 Cdn Intl Oil Operating Co CIOOC HZ GOLDCK 13-35-67-4 Elmworth Montney Formation 2015/12 974 3,916 34.3 132.12 Cdn Intl Oil Operating Co CIOOC HZ GOLDCK 5-2-68-4 Elmworth Montney Formation 2015/12 780 4,842 27.4 162.53 Kelt Expl Ltd KELT EXP PCOUPES 8-18-78-11 Pouce Coupe South Montney Formation 2015/11 666 2,036 39.6 111.44 Shell Cda Ltd SCL HZ FERRIER 2-25-40-8 Ferrier Duvernay Formation 2015/12 643 3,089 32.0 151.55 Penn West Petrl Ltd PENN WEST 103 HZ WILLGR 4-33-42-8 Willesden Green Cardium Sandstone 2015/11 596 586 23.2 20.46 Penn West Petrl Ltd PENN WEST HZ WILLGR 1-34-42-8 Willesden Green Cardium Sandstone 2015/11 579 267 26.8 12.07 NEP Cda ULC NEP 104 HZ LEDUC-WB 15-21-51-26 Leduc-Woodbend Nisku Formation 2015/12 495 1,162 23.4 48.08 Kelt Expl Ltd KELT EXP HZ LA GLACE 3-28-74-8 La Glace Montney Formation 2015/12 487 978 23.7 40.79 NEP Cda ULC NEP HZ 103 LEDUC-WB 2-15-50-26 Leduc-Woodbend Nisku Formation 2015/11 479 298 30.8 21.910 Penn West Petrl Ltd PENN WEST HZ WILLGR 3-33-42-8 Willesden Green Cardium Sandstone 2015/12 462 750 21.5 27.611 Penn West Petrl Ltd PENN WEST HZ WILLGR 1-33-42-8 Willesden Green Cardium Sandstone 2015/11 459 534 19.0 20.012 Exshaw Oil Corp EXSHAW OIL HZ VALHALLA 13-22-78-7 Valhalla Charlie Lake Formation 2015/10 447 1,501 51.8 128.813 Penn West Petrl Ltd PENN WEST 102 HZ WALRUS 14-35-82-18 Peace River Area 2 Bluesky Formation 2015/11 415 39 22.5 1.814 Penn West Petrl Ltd PENN WEST HZ WILLGR 4-34-42-8 Willesden Green Cardium Sandstone 2015/11 406 298 22.0 13.715 NEP Cda ULC NEP 102 HZ LEDUC-WB 1-3-51-26 Leduc-Woodbend Nisku Formation 2015/10 403 426 35.8 32.916 OMERS Enrg Inc OEI WILSONCK 15-16-43-4 Wilson Creek Cardium Sandstone 2015/06 396 213 15.3 11.017 Surge Enrg Inc SURGE ENERGY 103 VALHALLA 15-6-75-8 Valhalla Doig Formation 2015/07 391 1,557 195.0 483.818 Exshaw Oil Corp EXSHAW OIL HZ VALHALLA 3-13-77-8 Valhalla Charlie Lake Formation 2015/12 362 1,492 13.9 55.419 Cdn Nat Rsrcs Ltd CNRL ET AL HZ KARR 5-32-65-3 Karr Dunvegan Formation 2015/12 359 655 16.6 32.020 Penn West Petrl Ltd PENN WEST HZ WILLGR 1-32-42-8 Willesden Green Cardium Sandstone 2015/12 349 273 12.5 8.7
Exhibit 5: Top Alberta Confidential Oil/Wellhead Condensate Wells (January 2016, Calendar Day Rate)
See page 13 for notes. Source: GeoScout; Scotiabank GBM.
First Prod. Confidential Calendar Day Rate1 Cumulative ProductionOperator Well Name Field/Area Formation/Zone2 (YYYY/MM) Release Date Oil/C5 (bbl/d)3 Raw Gas (mcf/d)4 Oil/C5 (mbbl)3 Raw Gas (mmcf)4
Exhibit 6: Top Alberta Oil/Wellhead Condensate Wells – Onstream in the Last 12 Months (First Three Months, Calendar Day Rate)
See page 13 for notes. Source: GeoScout; Scotiabank GBM.
First Prod. Calendar Day Rate1 Cumulative ProductionOperator Well Name Field/Area Formation/Zone2 (YYYY/MM) Oil/C5 (bbl/d)3 Raw Gas (mcf/d)4 Oil/C5 (mbbl)3 Raw Gas (mmcf)4
Exhibit 7: Top Alberta Oil/Wellhead Condensate Wells – Onstream in the Last 12 Months (Cumulative Production to January 31, 2016)
See page 13 for notes. Source: GeoScout; Scotiabank GBM.
First Prod. Cumulative Production Implied Cum. Calendar Day Rate6
Operator Well Name Field/Area Formation/Zone2 (YYYY/MM) Oil/C5 (mbbl)3 Raw Gas (mmcf)4 Oil/C5 (bbl/d)3 Raw Gas (mcf/d)4
1 Surge Enrg Inc SURGE ENERGY 103 VALHALLA 15-6-75-8 Valhalla Doig Formation 2015/07 195.0 483.8 911 2,2612 Surge Enrg Inc SURGE ENERGY HZ VALHALLA 4-6-75-8 Valhalla Doig Formation 2015/04 175.6 542.1 576 1,7773 Murphy Oil Co Ltd MURPHY HZ E110 SLAVE 14-25-84-15 Peace River Area 2 Bluesky Formation 2015/03 131.1 21.3 390 634 RMP Enrg Inc RMP HZ ANTE 9-35-66-24 Ante Creek North Montney Formation 2015/02 125.0 888.6 343 2,4415 Boulder Enrg Ltd BOULDER BRAZR 4-15-47-15 Brazeau River Belly River Group 2015/02 123.2 269.5 338 7406 RMP Enrg Inc RMP HZ ANTEN 13-36-66-24 Ante Creek North Montney Formation 2015/02 110.4 440.9 303 1,2117 Penn West Petrl Ltd PENN WEST SEAL HV SOUTH 9-23-82-18 Peace River Area 2 Bluesky Formation 2015/03 93.4 4.2 278 128 Penn West Petrl Ltd PENN WEST SEAL HV SOUTH 12-24-82-18 Peace River Area 2 Bluesky Formation 2015/03 90.4 5.3 269 169 Granite Oil Corp D3EXP 15B-24 HZ FERGUSON 9-19-3-16 Ferguson Bakken Formation 2015/03 89.0 110.1 265 32810 Aspenleaf Enrg Ltd ASPENLEAF 15-4 HZ SWANH 7-3-68-8 Swan Hills Swan Hills Member 2015/02 84.5 62.7 232 17211 Delphi Enrg Corp DELPHI HZ BIGSTONE 12-27-60-23 Bigstone Montney Formation 2015/02 81.2 1,159.5 223 3,18612 Cdn Nat Rsrcs Ltd CNRL 5A LNDBRGH 5-8-55-5 Cold Lake Lower Grand Rapids 2015/05 80.6 11.0 293 4013 Jupiter Rsrcs Inc JUPITER HZ KAKWA 15-13-62-7 Kakwa Dunvegan Formation 2015/03 80.0 295.2 238 87914 Granite Oil Corp D3EXP 3B-23 HZ FERGUSON 1-24-3-17 Ferguson Bakken Formation 2015/02 76.4 186.7 210 51315 Trilogy Rsrcs Ltd TRILOGY HZ KAYBOB 11-31-64-18 Kaybob Montney Formation 2015/07 75.6 630.6 353 2,94716 Birchcliff Enrg Ltd BIRCHCLIFF ET AL PROGRESS 3-10-77-9 Progress Halfway Formation 2015/02 70.9 142.8 195 39217 Whitecap Rsrcs Inc WHITECAP SIMON 14-18-62-25 Simonette Dunvegan Formation 2015/02 68.5 343.8 188 94518 Jupiter Rsrcs Inc ECA HZ KAKWA 13-13-62-7 Kakwa Dunvegan Formation 2015/02 67.9 286.4 187 78719 RMP Enrg Inc RMP HZ ANTEN 13-34-66-24 Ante Creek North Montney Formation 2015/08 67.7 408.0 370 2,23020 Trilogy Rsrcs Ltd TRILOGY HZ KAYBOB 3-20-63-19 Kaybob Gething Formation 2015/07 66.7 611.1 311 2,856
Top Oil & Gas Well Report March 17, 2016
6
Exhibit 8: Top Alberta Gas Wells – Onstream in the Last Two Months (January 2016, Calendar Day Rate)
See page 13 for notes. Source: GeoScout; Scotiabank GBM.
First Prod. Calendar Day Rate1 Cumulative ProductionOperator Well Name Field/Area Formation/Zone2 (YYYY/MM) Raw Gas (mcf/d)4 Oil/C5 (bbl/d)3 Raw Gas (mmcf)4 Oil/C5 (mbbl)3
Exhibit 9: Top Alberta Gas Wells – Onstream in the Last Two Months (January 2016, Producing Day Rate)
See page 13 for notes. Source: GeoScout; Scotiabank GBM.
First Prod. Hours Producing Day Rate5 Cumulative ProductionOperator Well Name Field/Area Formation/Zone2 (YYYY/MM) On-Stream Raw Gas (mcf/d)4 Oil/C5 (bbl/d)3 Raw Gas (mmcf)4 Oil/C5 (mbbl)3
Exhibit 10: Top Alberta Gas Wells – Onstream in the Last 12 Months (January 2016, Calendar Day Rate)
See page 13 for notes. Source: GeoScout; Scotiabank GBM.
First Prod. Calendar Day Rate1 Cumulative ProductionOperator Well Name Field/Area Formation/Zone2 (YYYY/MM) Raw Gas (mcf/d)4 Oil/C5 (bbl/d)3 Raw Gas (mmcf)4 Oil/C5 (mbbl)3
Exhibit 11: Top Alberta Confidential Gas Wells (January 2016, Calendar Day Rate)
See page 13 for notes. Source: GeoScout; Scotiabank GBM.
First Prod. Confidential Calendar Day Rate1 Cumulative ProductionOperator Well Name Field/Area Formation/Zone2 (YYYY/MM) Release Date Raw Gas (mcf/d)4 Oil/C5 (bbl/d)3 Raw Gas (mmcf)4 Oil/C5 (mbbl)3
Exhibit 12: Top Alberta Gas Wells – Onstream in the Last 12 Months (First Three Months, Calendar Day Rate)
See page 13 for notes. Source: GeoScout; Scotiabank GBM.
First Prod. Calendar Day Rate1 Cumulative ProductionOperator Well Name Field/Area Formation/Zone2 (YYYY/MM) Raw Gas (mcf/d)4 Oil/C5 (bbl/d)3 Raw Gas (mmcf)4 Oil/C5 (mbbl)3
N O T A B L E S A S K A T C H E W A N O I L R E S U L T S
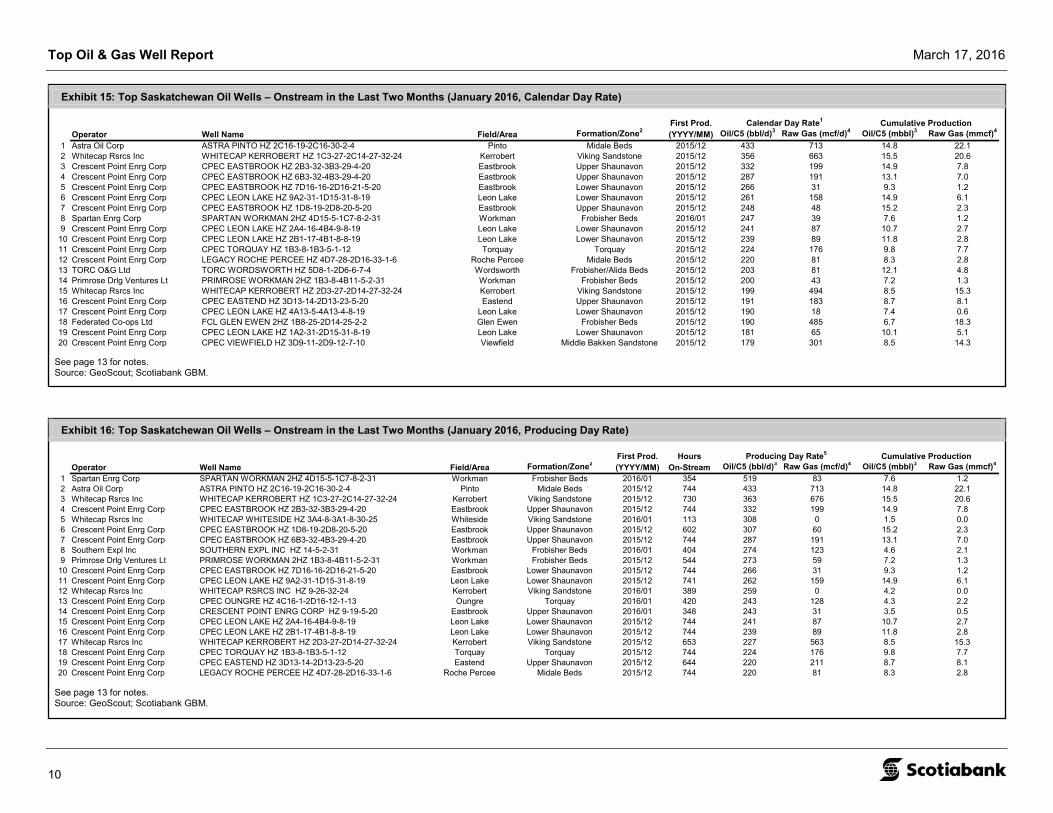
• Crescent Point Energy Corp. (CPG-T) continued to deliver some of the strongest wells in Saskatchewan from its Shaunavon, Bakken, Midale, and Torquay plays, with 13 of the top 20 new wells by calendar day rate and 12 of the top 20 new wells by producing day rate (see Exhibits 15 and 16). The company also had 10 of the top 20 wells by calendar day rate and 13 of the top 20 cumulative production rates among wells placed onstream over the previous 12 months (see Exhibits 17 and 20).
• The Spartan Energy Corp. (SPE-T) 7-8 Workman Frobisher well ranked first by producing day rate among new wells (as well as eighth by calendar day rate and third among confidential wells [see Exhibits 15 and 18]), with average production of 519 bbl/d over its first ~15 days onstream. The company’s 15-26 Winmore Frobisher well ranked sixth by calendar day rate among wells placed onstream over the previous 12 months, with average production of 293 bbl/d (see Exhibit 17).
• The Astra Oil Corp. (private) 16-30 Pinto Midale well delivered the top calendar day rate among new wells, with average production of 433 bbl/d (see Exhibit 15). The well also ranked second by calendar day rate among well placed onstream over the previous 12 months (see Exhibit 17).
• The Whitecap Resources Inc. (WCP-T) 14-27 Kerrobert Viking well ranked second among new wells and third among wells placed onstream over the previous 12 months by calendar day rate, with average production of 356 bbl/d (see Exhibits 15 and 17). The company’s Kerrorbert and Whiteside Viking plays delivered three additional wells that ranked among the top 17 new wells by producing day (see Exhibit 16).
Exhibit 14: Locations of the Notable Wells in Saskatchewan
Source: GeoScout; Scotiabank GBM.
Pinto
Kerrobert
Eastbrook
Torquay Winmore
Browning
Leon Lake
RapdanWorkman
Hastings
Lone Rock
Leitchville
Bromhead
Roche Percee
Wordsworth
Eastend
Glen Ewen
Viewfield
Whiteside
Oungre
Druid
Macoun
Flat Lake
Lashburn
Elcott
Steelman
Alida
Eagle Lake
Oil Wells
Top Oil & Gas Well Report March 17, 2016
10
Exhibit 15: Top Saskatchewan Oil Wells – Onstream in the Last Two Months (January 2016, Calendar Day Rate)
See page 13 for notes. Source: GeoScout; Scotiabank GBM.
First Prod. Calendar Day Rate1 Cumulative ProductionOperator Well Name Field/Area Formation/Zone2 (YYYY/MM) Oil/C5 (bbl/d)3 Raw Gas (mcf/d)4 Oil/C5 (mbbl)3 Raw Gas (mmcf)4
1 Astra Oil Corp ASTRA PINTO HZ 2C16-19-2C16-30-2-4 Pinto Midale Beds 2015/12 433 713 14.8 22.12 Whitecap Rsrcs Inc WHITECAP KERROBERT HZ 1C3-27-2C14-27-32-24 Kerrobert Viking Sandstone 2015/12 356 663 15.5 20.63 Crescent Point Enrg Corp CPEC EASTBROOK HZ 2B3-32-3B3-29-4-20 Eastbrook Upper Shaunavon 2015/12 332 199 14.9 7.84 Crescent Point Enrg Corp CPEC EASTBROOK HZ 6B3-32-4B3-29-4-20 Eastbrook Upper Shaunavon 2015/12 287 191 13.1 7.05 Crescent Point Enrg Corp CPEC EASTBROOK HZ 7D16-16-2D16-21-5-20 Eastbrook Lower Shaunavon 2015/12 266 31 9.3 1.26 Crescent Point Enrg Corp CPEC LEON LAKE HZ 9A2-31-1D15-31-8-19 Leon Lake Lower Shaunavon 2015/12 261 158 14.9 6.17 Crescent Point Enrg Corp CPEC EASTBROOK HZ 1D8-19-2D8-20-5-20 Eastbrook Upper Shaunavon 2015/12 248 48 15.2 2.38 Spartan Enrg Corp SPARTAN WORKMAN 2HZ 4D15-5-1C7-8-2-31 Workman Frobisher Beds 2016/01 247 39 7.6 1.29 Crescent Point Enrg Corp CPEC LEON LAKE HZ 2A4-16-4B4-9-8-19 Leon Lake Lower Shaunavon 2015/12 241 87 10.7 2.710 Crescent Point Enrg Corp CPEC LEON LAKE HZ 2B1-17-4B1-8-8-19 Leon Lake Lower Shaunavon 2015/12 239 89 11.8 2.811 Crescent Point Enrg Corp CPEC TORQUAY HZ 1B3-8-1B3-5-1-12 Torquay Torquay 2015/12 224 176 9.8 7.712 Crescent Point Enrg Corp LEGACY ROCHE PERCEE HZ 4D7-28-2D16-33-1-6 Roche Percee Midale Beds 2015/12 220 81 8.3 2.813 TORC O&G Ltd TORC WORDSWORTH HZ 5D8-1-2D6-6-7-4 Wordsworth Frobisher/Alida Beds 2015/12 203 81 12.1 4.814 Primrose Drlg Ventures Lt PRIMROSE WORKMAN 2HZ 1B3-8-4B11-5-2-31 Workman Frobisher Beds 2015/12 200 43 7.2 1.315 Whitecap Rsrcs Inc WHITECAP KERROBERT HZ 2D3-27-2D14-27-32-24 Kerrobert Viking Sandstone 2015/12 199 494 8.5 15.316 Crescent Point Enrg Corp CPEC EASTEND HZ 3D13-14-2D13-23-5-20 Eastend Upper Shaunavon 2015/12 191 183 8.7 8.117 Crescent Point Enrg Corp CPEC LEON LAKE HZ 4A13-5-4A13-4-8-19 Leon Lake Lower Shaunavon 2015/12 190 18 7.4 0.618 Federated Co-ops Ltd FCL GLEN EWEN 2HZ 1B8-25-2D14-25-2-2 Glen Ewen Frobisher Beds 2015/12 190 485 6.7 18.319 Crescent Point Enrg Corp CPEC LEON LAKE HZ 1A2-31-2D15-31-8-19 Leon Lake Lower Shaunavon 2015/12 181 65 10.1 5.120 Crescent Point Enrg Corp CPEC VIEWFIELD HZ 3D9-11-2D9-12-7-10 Viewfield Middle Bakken Sandstone 2015/12 179 301 8.5 14.3
Exhibit 16: Top Saskatchewan Oil Wells – Onstream in the Last Two Months (January 2016, Producing Day Rate)
See page 13 for notes. Source: GeoScout; Scotiabank GBM.
First Prod. Hours Producing Day Rate5 Cumulative ProductionOperator Well Name Field/Area Formation/Zone2 (YYYY/MM) On-Stream Oil/C5 (bbl/d)3 Raw Gas (mcf/d)4 Oil/C5 (mbbl)3 Raw Gas (mmcf)4
10 Crescent Point Enrg Corp CPEC EASTBROOK HZ 7D16-16-2D16-21-5-20 Eastbrook Lower Shaunavon 2015/12 744 266 31 9.3 1.211 Crescent Point Enrg Corp CPEC LEON LAKE HZ 9A2-31-1D15-31-8-19 Leon Lake Lower Shaunavon 2015/12 741 262 159 14.9 6.112 Whitecap Rsrcs Inc WHITECAP RSRCS INC HZ 9-26-32-24 Kerrobert Viking Sandstone 2016/01 389 259 0 4.2 0.013 Crescent Point Enrg Corp CPEC OUNGRE HZ 4C16-1-2D16-12-1-13 Oungre Torquay 2016/01 420 243 128 4.3 2.214 Crescent Point Enrg Corp CRESCENT POINT ENRG CORP HZ 9-19-5-20 Eastbrook Upper Shaunavon 2016/01 348 243 31 3.5 0.515 Crescent Point Enrg Corp CPEC LEON LAKE HZ 2A4-16-4B4-9-8-19 Leon Lake Lower Shaunavon 2015/12 744 241 87 10.7 2.716 Crescent Point Enrg Corp CPEC LEON LAKE HZ 2B1-17-4B1-8-8-19 Leon Lake Lower Shaunavon 2015/12 744 239 89 11.8 2.817 Whitecap Rsrcs Inc WHITECAP KERROBERT HZ 2D3-27-2D14-27-32-24 Kerrobert Viking Sandstone 2015/12 653 227 563 8.5 15.318 Crescent Point Enrg Corp CPEC TORQUAY HZ 1B3-8-1B3-5-1-12 Torquay Torquay 2015/12 744 224 176 9.8 7.719 Crescent Point Enrg Corp CPEC EASTEND HZ 3D13-14-2D13-23-5-20 Eastend Upper Shaunavon 2015/12 644 220 211 8.7 8.120 Crescent Point Enrg Corp LEGACY ROCHE PERCEE HZ 4D7-28-2D16-33-1-6 Roche Percee Midale Beds 2015/12 744 220 81 8.3 2.8
Top Oil & Gas Well Report March 17, 2016
11
Exhibit 17: Top Saskatchewan Oil Wells – Onstream in the Last 12 Months (January 2016, Calendar Day Rate)
See page 13 for notes. Source: GeoScout; Scotiabank GBM.
First Prod. Calendar Day Rate1 Cumulative ProductionOperator Well Name Field/Area Formation/Zone2 (YYYY/MM) Oil/C5 (bbl/d)3 Raw Gas (mcf/d)4 Oil/C5 (mbbl)3 Raw Gas (mmcf)4
Exhibit 18: Top Saskatchewan Confidential Oil Wells (January 2016, Calendar Day Rate)
See page 13 for notes. Source: GeoScout; Scotiabank GBM.
First Prod. Confidential Calendar Day Rate1 Cumulative ProductionOperator Well Name Field/Area Formation/Zone2 (YYYY/MM) Release Date Oil/C5 (bbl/d)3 Raw Gas (mcf/d)4 Oil/C5 (mbbl)3 Raw Gas (mmcf)4
Exhibit 19: Top Saskatchewan Oil Wells – Onstream in the Last 12 Months (First Three Months, Calendar Day Rate)
See page 13 for notes. Source: GeoScout; Scotiabank GBM.
First Prod. Calendar Day Rate1 Cumulative ProductionOperator Well Name Field/Area Formation/Zone2 (YYYY/MM) Oil/C5 (bbl/d)3 Raw Gas (mcf/d)4 Oil/C5 (mbbl)3 Raw Gas (mmcf)4
The top well lists include wells classified as producing oil, gas, or crude bitumen (but not SAGD or CSS wells).
Notes:
1. Calendar Day Rate: Calculated using the full month, regardless of when the well was placed on production.
2. Formation/Zone: The producing formation or pool (if available) or the formation at total depth/projected formation at total depth.
3. Oil/C5: Oil and wellhead condensate. The quoted rates do not include plant-extracted condensate.
4. Raw Gas: Wellhead gas volumes measured before plant processing and natural gas liquids extraction.
5. Producing Day Rate: Calculated using the well’s producing hours. The data set includes wells with a minimum of 96 hours onstream during the month.
6. Implied Cumulative Calendar Day Rate: Calculated using the first day of the first producing month and the last calendar date in the current production period.
Source: Scotiabank GBM.
Appendix A: Important Disclosures
Company Ticker Disclosures (see legend below)*
I, Cameron Bean, certify that (1) the views expressed in this report in connection with securities or issuers that I analyze accurately reflect my personal views and (2) no part of my compensation was, is, or will be directly or indirectly, related to the specific recommendations or views expressed by me in this report.
This research report was prepared by employees of Scotia Capital Inc. and/or its affiliates who have the title of Analyst.
All pricing of securities in reports is based on the closing price of the securities’ principal marketplace on the night before the publication date, unless otherwise explicitly stated.
All Equity Research Analysts report to the Head of Equity Research. The Head of Equity Research reports to the Managing Director, Head of Institutional Equity Sales, Trading and Research, who is not and does not report to the Head of the Investment Banking Department. Scotiabank, Global Banking and Markets has policies that are reasonably designed to prevent or control the sharing of material non-public information across internal information barriers, such as between Investment Banking and Research.
The compensation of the research analyst who prepared this report is based on several factors, including but not limited to, the overall profitability of Scotiabank, Global Banking and Markets and the revenues generated from its various departments, including investment banking. Furthermore, the research analyst's compensation is charged as an expense to various Scotiabank, Global Banking and Markets departments, including investment banking. Research Analysts may not receive compensation from the companies they cover.
Non-U.S. analysts may not be associated persons of Scotia Capital (USA) Inc. and therefore may not be subject to FINRA Rule 2241 restrictions on communications with subject company, public appearances and trading securities held by the analysts.
For Scotiabank, Global Banking and Markets Research analyst standards and disclosure policies, please visit http://www.gbm.scotiabank.com/disclosures
Scotiabank, Global Banking and Markets Research, 40 King Street West, 33rd Floor, Toronto, Ontario, M5H 1H1.
General Disclosures This report has been prepared by analysts who are employed by the Research Department of Scotiabank, Global Banking and Markets. Scotiabank, together with “Global Banking and Markets”, is a marketing name for the global corporate and investment banking and capital markets businesses of The Bank of Nova Scotia and certain of its affiliates in the countries where they operate, including Scotia Capital Inc.
All other trademarks are acknowledged as belonging to their respective owners and the display of such trademarks is for informational use only.
Scotiabank, Global Banking and Markets Research produces research reports under a single marketing identity referred to as “Globally-branded research” under U.S. rules. This research is produced on a single global research platform with one set of rules which meet the most stringent standards set by regulators in the various jurisdictions in which the research reports are produced. In addition, the analysts who produce the research reports, regardless of location, are subject to one set of policies designed to meet the most stringent rules established by regulators in the various jurisdictions where the research reports are produced.
Scotia Capital Inc. or an affiliate thereof owns or controls an equity interest in TMX Group Limited and in excess of 1% of the issued and outstanding equity securities thereof. In addition, an affiliate of Scotia Capital Inc. is a lender to TMX Group Limited under its credit facilities. As such, Scotia Capital Inc. may be considered to have an economic interest in TMX Group Limited.
This report is provided to you for informational purposes only. This report is not, and is not to be construed as, an offer to sell or solicitation of an offer to buy any securities and/or commodity futures contracts.
The securities mentioned in this report may neither be suitable for all investors nor eligible for sale in some jurisdictions where the report is distributed.
The information and opinions contained herein have been compiled or arrived at from sources believed reliable, however, Scotiabank, Global Banking and Markets makes no representation or warranty, express or implied, as to their accuracy or completeness.
Scotiabank, Global Banking and Markets has policies designed to make best efforts to ensure that the information contained in this report is current as of the date of this report, unless otherwise specified.
Any prices that are stated in this report are for informational purposes only. Scotiabank, Global Banking and Markets makes no representation that any transaction may be or could have been effected at those prices.
Any opinions expressed herein are those of the author(s) and are subject to change without notice and may differ or be contrary from the opinions expressed by other departments of Scotiabank, Global Banking and Markets or any of its affiliates.
Neither Scotiabank, Global Banking and Markets nor its affiliates accepts any liability whatsoever for any direct or consequential loss arising from any use of this report or its contents.
Equity research reports published by Scotiabank, Global Banking and Markets are available electronically via: Bloomberg, Thomson Financial/First Call - Research Direct, Reuters, Capital IQ, and FactSet. Institutional clients with questions regarding distribution of equity research should contact us at 1-800-208-7666.
This report and all the information, opinions, and conclusions contained in it are protected by copyright. This report may not be reproduced in whole or in part, or referred to in any manner whatsoever, nor may the information, opinions, and conclusions contained in it be referred to without the prior express consent of Scotiabank, Global Banking and Markets.
Additional Disclosures Canada: This report is distributed by Scotia Capital Inc., a subsidiary of The Bank of Nova Scotia. Scotia Capital Inc. is a member of the Canadian Investor Protection Fund and the Investment Industry Regulatory Organization of Canada.
Chile: This report is distributed by Scotia Corredora de Bolsa Chile S.A., a subsidiary of The Bank of Nova Scotia.
Colombia: This report is distributed in Colombia according to the resolutions issued by the Superintendencia Financiera, in which the regulator authorized marketing / promotion of products and services to the following foreign entities, exclusively for the approved purposes: The Bank of Nova Scotia (Canada) – Resolution 058 of 2014, The Bank of Nova Scotia (Panama) – Resolution 2137 of 2010, and Scotia Capital Inc. – Resolution 0226 of 2015.
Hong Kong: This report is distributed by The Bank of Nova Scotia Hong Kong Branch, which is authorized by the Securities and Future Commission to conduct Type 1, Type 4 and Type 6 regulated activities and regulated by the Hong Kong Monetary Authority.
Mexico: This report is distributed by Scotia Inverlat Casa de Bolsa S.A. de C.V., a subsidiary of the Bank of Nova Scotia.
Peru: This report is distributed by Scotia Sociedad Agente de Bolsa S.A., a subsidiary of The Bank of Nova Scotia.
Singapore: This report is distributed by The Bank of Nova Scotia Asia Limited, a subsidiary of The Bank of Nova Scotia. The Bank of Nova Scotia Asia Limited is authorised and regulated by the Monetary Authority of Singapore, and exempted under Section 99(1)(a),and (b), (c) and (d) of the Securities and Futures Act to conduct regulated activities.
United Kingdom and the rest of Europe: Except as otherwise specified herein, this report is distributed by Scotiabank Europe plc, a subsidiary of The Bank of Nova Scotia. Scotiabank Europe plc is authorized by the Prudential Regulation Authority (PRA) and regulated by the PRA and the Financial Conduct Authority (FCA). Scotiabank Europe plc complies with all FCA requirements concerning research and the associated disclosures and these are indicated on the research where applicable.
United States: This report is distributed by Scotia Capital (USA) Inc., a subsidiary of Scotia Capital Inc., and a registered U.S. broker-dealer. All transactions by a U.S. investor of securities mentioned in this report must be effected through Scotia Capital (USA) Inc.
Non-U.S. investors wishing to effect a transaction in the securities discussed in this report should contact a Scotiabank, Global Banking and Markets entity in their local jurisdiction unless governing law permits otherwise.
Definition of Scotiabank, Global Banking and Markets Equity Research Ratings
We have a four-tiered rating system, with ratings of Focus Stock, Sector Outperform, Sector Perform, and Sector Underperform. Each analyst assigns a rating that is relative to his or her coverage universe or an index identified by the analyst that includes, but is not limited to, stocks covered by the analyst.
The rating assigned to each security covered in this report is based on the Scotiabank, Global Banking and Markets research analyst’s 12-month view on the security. Analysts may sometimes express to traders, salespeople and certain clients their shorter-term views on these securities that differ from their 12-month view due to several factors, including but not limited to the inherent volatility of the marketplace.
Ratings
Focus Stock (FS) The stock represents an analyst’s best idea(s); stocks in this category are expected to significantly outperform the average 12-month total return of the analyst’s coverage universe or an index identified by the analyst that includes, but is not limited to, stocks covered by the analyst.
Sector Outperform (SO) The stock is expected to outperform the average 12-month total return of the analyst’s coverage universe or an index identified by the analyst that includes, but is not limited to, stocks covered by the analyst.
Sector Perform (SP) The stock is expected to perform approximately in line with the average 12-month total return of the analyst’s coverage universe or an index identified by the analyst that includes, but is not limited to, stocks covered by the analyst.
Sector Underperform (SU) The stock is expected to underperform the average 12-month total return of the analyst’s coverage universe or an index identified by the analyst that includes, but is not limited to, stocks covered by the analyst.
Other Ratings Tender – Investors are guided to tender to the terms of the takeover offer.
Under Review – The rating has been temporarily placed under review, until sufficient information has been received and assessed by the analyst.
Risk Ranking As of June 22, 2015, Scotiabank, Global Banking and Markets discontinued its Low, Medium, and High risk rankings. The Speculative risk ranking reflects exceptionally high financial and/or operational risk, exceptionally low predictability of financial results, and exceptionally high stock volatility. The Director of Research and the Supervisory Analyst jointly make the final determination of the Speculative risk ranking.
Scotiabank, Global Banking and Markets Equity Research Ratings Distribution*
Distribution by Ratings and Equity and Equity-Related Financings*
Percentage of companies covered by Scotiabank, Global Banking and Markets Equity Research within each rating category.
Percentage of companies within each rating category for which Scotiabank, Global Banking and Markets has undertaken an underwriting liability or has provided advice for a fee within the last 12 months.
Source: Scotiabank GBM.
For the purposes of the ratings distribution disclosure FINRA requires members who use a ratings system with terms different than “buy,” “hold/neutral” and “sell,” to equate their own ratings into these categories. Our Focus Stock, Sector Outperform, Sector Perform, and Sector Underperform ratings are based on the criteria above, but for this purpose could be equated to strong buy, buy, neutral and sell ratings, respectively.
www.gbm.scotiabank.com
TM Trademark of The Bank of Nova Scotia. Used under license, where applicable. Scotiabank, together with “Global Banking and Markets”, is a marketing name for the global corporate and investment banking and capital markets businesses of The Bank of Nova Scotia and certain of its affiliates in the countries where they operate, including Scotia Capital Inc. Scotia Capital Inc. is a Member of the Canadian Investor Protection Fund.