12
April 2019 Valuation Insights Equity Risk Premium in India

April 2019
Valuation InsightsEquity Risk Premium in India
Section Page
1. Foreword 03
2. Executivesummary 04
3. Backgroundandcontext 05
4. Approachandmethodology 06
Contents
About Valuation Insights
ValuationInsightsisaperiodicpublicationofGrantThorntonIndiaLLP,amemberfirmwithinGrantThorntonInternationalLtd.Itisourefforttodiscussandaddressvariousvaluationissuesusingthebestpracticesandinternationalguidelines.Ourteamofprofessionalssharestheirthoughtsonthenuancesofvaluationsandtheirstrategicandpracticalimplications.
02ValuationInsights
Disclaimer
ERPestimationinvolvestheuseofsubjectiveestimatesandmultipleapproaches.HencedifferentresearchersmaycomeoutwithdifferentERPs.Further,theERPconcludedinthisreportrepresentstheERPprevailingafterthepublicationdateandhenceshouldnotbeconsideredrepresentativeoftheERPprevailingatanyotherhistoricaldate.TheERPremainsstableforafairlylongperiodunlessthereisadrasticchangeintheeconomicandmarketconditions.Hence,theconcludedERPcouldbeconsideredeffectivetillsuchtimethecurrentanalysisisupdatedinthefutureorthereisasignificantchangeintheeconomicandmarketconditions.
Thedocumentisforinformationpurposeonly.Theanalysisisbasedongenerallyacceptedmethodologies,informationavailableinthepublicdomainaswellasinformationsourcedfrominternationaldatabases.Theinformationcontainedinthisdocumentispublishedfortheassistanceoftherecipientbutisnottoberelieduponasauthoritativeortakeninsubstitutionfortheexerciseofjudgementbyanyrecipient.
Thisdocumentisnotintendedtobeasubstituteforprofessional,technicalorlegaladvice.Wehavenoobligationtoupdatethisreport.Allopinionsexpressedinthisdocumentaresubjecttochangewithoutnotice.Whileduecarehasbeentakeninthepreparationofthisdocumentandinformationcontainedherein,GrantThorntondoesnotacceptanyliabilitywhatsoeverforanydirectorconsequentiallosshowsoeverarisingfromanyuseofthisdocumentoritscontentsorotherwisearisinginconnectionherewith.

ValuationInsights03
Foreword
Akeychallengeoftenfacedbyinvestors,advisersandcorporatefinanceprofessionalsistoquantifytheadditionalpremiumoropportunitycostthatshouldbedemandedforholdingtheequityassetclass.Giventhesubjectivityinvolvedinestimatingsuchapremium,thequestionspillsovertotheunderlyingassumptionsoftheapproachtobeused,timeperiodconsidered,marketdefinition,etc.Thisriskpremiumneedstobereassessedperiodicallyinlinewithfluctuationsinthestockmarketperformanceandforecastofeconomictrendsofthecountry.
Wearepleasedtosharewithyouourresearchontheequityriskpremium(ERP)inIndia.Inthesecondeditionofourpublicationonthistopic,wehaveanalysedtheERPforIndiafromtwoperspectives:HistoricalandForward-Looking(asofacut-offdateof31December2018).
HistoricalanalysisindicatesthattheIndianstockmarketgaveanaverageannualisedreturnof16.70%during2001-18fordifferentinvestmenthorizons,implyinganexcessreturnof8.86%overtherisk-freerate.Wefurtheradjustedthisexcessreturnforthereturngeneratedduetoexpansioninthevaluationmultiples(consideringthatthevaluationmultiplescannotkeeponexpandinginperpetuityforadeveloped/efficientequitymarket).
Onaforward-lookingbasis,weestimatedthereturnexpectationpricedinthecurrentmarketindex.Thiswasestimatedastheratewhichwhenusedtodiscountthefuture
expectedcashflows(basedonconsensusforecasts)fromconstituentcompaniesoftheNiftyindex,resultsinapresentvalueofthesecashflowswhichisequaltothemarketcapoftheNiftyindex.ThisanalysisindicatesthatdespitetheNiftyindextradingatanearall-timehighPEmultiple,theexpectedhealthygrowthinfutureearnings/cashflowsstillimpliesanexpectedreturnof15.17%witharisk-freerateof7.50%.
WhilethetwoanalysesprovidetwodifferentestimatesofERP,eachapproachhascertaininherentprosandcons.Hence,anaverageofthetwoestimates(rounded),ie6.75%,hasbeenconsideredasrepresentativeofthecurrentERPforIndia.
WehopetheERPestimatewillbeausefulinputforvaluationprofessionals,corporatesandinvestorsintheirvaluationanalysis.
Manish SaxenaPartnerGrant Thornton India LLP
Darshana KadakiaPartnerGrant Thornton India LLP
Wearepleasedtosharewithyouourresearchontheequityriskpremium(ERP)inIndia.Inthesecondeditionofourpublicationonthistopic,wehaveanalysedtheERPforIndiafromtwoperspectives:HistoricalandForward-Looking(asofacut-offdateof31December2018).

04ValuationInsights
Executive summary
Equityriskpremium(ERP)istheexcessreturnoverandabovethereturnonarisk-freeassetwhichaninvestordemandsforinvestingintheequityassetclass.ThesignificanceofERPintheworldofinvestingandpolicydecisionmakingcannotbeemphasisedenough.
WhilevarioustechniqueshaveevolvedovertimetoestimatetheERPinagivenmarket,wehaveusedtwoofthemostcommonlyandinternationallyacceptedapproaches,ieHistoricalEstimateApproachandImpliedEstimate(Forward-LookingEstimate)ApproachtoestimatetheERPfortheequitymarketsintheIndianeconomy.Ourfindingsareasfollows:
HistoricalApproach 5.68%
Forward-LookingApproach 7.67%
Equityriskpremium(rounded) 6.75%

ValuationInsights05
Equityriskpremium(ERP)isakeycomponentoftheoverallrequiredrateofreturnforequityinvestments.Equitiesareoneofthemostwidelyusedassetclassesforinvestmentpurposesforbothshortandlong-termperiods.Giventheriskinherentinequitiesstemmingfromthenatureoftheassetclassanduncertaintyoffutureexpectedcashflowsvis-à-visarisk-freeasset,investorsdemandanadditionalreturnforholdingequities.Simplyput:
ERP is the additional return that investors desire for holding investments in equities instead of a risk-free asset.
Sincetherequired/expectedrateofreturnthatarationalinvestorshoulddemandastheopportunitycostofinvestinginequitiesisseldomvisibleoridentifiablethroughproxyinstrumentstradedinthemarket,ERPbecomesanimportantelementindeterminingthisrequiredrateofreturn,whichplaysacrucialroleforaninvestortodeterminetherisk-returntrade-offforanyinvestment.
ThefollowingisabriefsummaryofthekeyareasofinvestmentandpolicydecisionmakingthatstrengthenthesignificanceofERP:
Significance of ERPAsdiscussedabove,opportunitycostiskeytoinvestmentdecision-makingforanyinvestor.TheCapitalAssetPricingModel(CAPM)isoneofthemostwidelyusedtoolsfordeterminingthisrequiredrateofreturnthattheinvestorshouldearnonequityinvestmentsandthatshouldholdinequilibriumintheequitymarket.Themodelprovidesarelativelyobjectiveapproachtowardsdeterminingtherequiredrateofreturn,andisgroundedinthesimplisticchiefassumptionthattheriskofanassetisdeterminedbasedontheasset’scontributiontosystematicriskoverandabovetherisk-freerate.
Background and context
Required rate of return = Risk free rate + ß (Equity risk premium)
Therefore,giventhewidespreadacceptanceanduseoftheCAPMworldwide,estimatingtheERPbecomescrucialtothedecision-makingprocess.
ERPplaysasignificantroleinthefollowingkeyareasofinvestmentandpolicydecisions:• Intheworldofcorporatefinance,ERPisimportantwhile
determiningthecostofequityandcostofcapitalforfirmsfortheirinternaldecision-makingprocesstooptimisethedebt-to-equityratiosanddecidinguponinvestments,buy-backandpolicies,etc.
• Inareasofvaluationsandcapitalbudgeting,itisusedtoarriveatthefairvalueofequityinvestmentsornetpresentvaluesforprojectsservingasaproxyforthediscountratetodeterminethepresentvalueofexpectedfuturecashflows.
• ERPisalsousedasagaugeofmarketsentimentfortheequitymarketsasitprovidesdirectiontowardsinvestorconfidenceasaproxyfortheopportunitycostofinvesting.
• Itisoftenusedasacheckintheindividualsavingversusinvestmentdecision-makingprocesswhileputtingasideanamountforfutureconsumptionpurposessuchasretirementorhealthcareneeds,aswellasallocationofwealthtodifferentassetclasses.

06ValuationInsights
Asdiscussedintheprevioussections,owingtotheimportanceandwidespreaduseofERP,theapproachandmethodologyfollowedtoestimateERPiscritical.Evenforlong-establishedanddevelopedequitymarkets,estimatingthemagnitudeofERPischallengingandcouldbeareasonforalteringinvestmentdecisions.
Broadly,threeapproachesexistforestimatingERP:• HistoricalEstimate• Forward-LookingEstimate• Survey-BasedEstimate
Forthepurposesofouranalysis,wehaveconsideredtheHistoricalEstimateandForward-Lookingapproaches.Underboththeapproaches,wehaveconsideredacut-offfortheestimatedateof31December2018forallmarketinputs.
Historical EstimateERPunderthisapproachisestimatedasanaverageofexcessreturnscalculatedasthedifferencebetweenthetotalreturnforanequitymarketandthereturnontherisk-freeassetsofvariousinvestmenthorizons.Thisapproachisoftenconsideredasareliablechoiceofestimation,asitisbasedontheassumptionsofhomogeneousmarketsandmarketefficiencyoveralongperiod.Averagereturnsintheequitymarketprovideasaproxyforunbiasedestimateofinvestors’expectations.
Input estimatesWhileestimatingtheERPusingthisapproach,selectionofthefollowinginputsisimportant:
• Market portfolioThemarketportfoliousedtoestimatethereturninequitymarketsisoftenbasedonabroad-basedequitymarketindexwhichservesasaproxyofthecountry’sequitymarketandisreflectiveoftheeconomicconditionsofthecountry.
WehaveusedtheTotalReturnNifty50indexastherepresentativeoftheequitymarketinIndia,basedonthefollowingfactors:
– Theindexrepresentsandisreflectiveoftheeconomicconditionsofthecountry.
– Thetotalvolumestradedontheindexreflectasignificantportionoftheliquidityintheequitymarketofthecountry.
Approach and methodology
– TheindexwaslaunchedinApril1996andhasasufficienttradinghistorytocarryouttheestimationofERPwithoutcompromisingonthetimeperiodrequiredfortheestimate.
– Thecomponentsoftheindexconstituteabroadmixofindustriesandsectorsinthecountry.
ThefollowingtableisabriefsnapshotofthecharacteristicsofNifty50:
Table 1: Sector representation of Nifty 50
Sector Weight (%)
Financialservices 37.18%
Energy 15.44%
Informationtechnology 14.82%
Consumergoods 10.80%
Automobile 6.59%
Metals 3.81%
Construction 3.69%
Pharmaceuticals 2.53%
Cementandcementproducts 1.63%
Telecommunications 1.55%
Fertilisersandpesticides 0.75%
Mediaandentertainment 0.60%
Services 0.59%
Source:NationalStockExchangeofIndia

ValuationInsights07
Closing prices of Total Return Nifty 50 Index (June 2001 to December 2018)
-
2,000
4,000
6,000
8,000
10,000
12,000
14,000
16,000
18,000
Jun-
01Ju
n-02
Jun-
03Ju
n-04
Jun-
05Ju
n-06
Jun-
07Ju
n-08
Jun-
09Ju
n-10
Jun-
11Ju
n-12
Jun-
13Ju
n-14
Jun-
15Ju
n-16
Jun-
17Ju
n-18
Risk-free rate of returnThechoicetobemadefortherisk-freerateisoftenthetenureoftheratetobeconsidered.Inthespecificcaseofanupward-slopingyieldcurve,wheretheyieldsonlongertermbondsarelargerthantheyieldsonshortertermbonds,whichisalsowitnessedinIndia,therisk-freeratebasedonlongertenuresispreferredovershortertermsforthefollowingreasons:
• Long-termyieldsarelesssusceptible/sensitivetounexpectedinflationshocks.
• BasedontheusesofERPasmentionedpreviously,themostcommonofthembeingforthedeterminationofthecostofequityunderCAPM,long-termrisk-freerateisalsosynonymouswithinvestorexpectationsoflong-termreturns.
Wehaveusedthe10-yearrisk-freerateaspublishedbyClearingCorporationofIndiaLimited(CCIL).Therisk-freeratepublishedbyCCILisbasedontheNelson-Siegel-Svenssonmodel.
Time periodForthechoiceoftimeperiodforthesampleconsideredtoestimatetheERP,wehaveconsideredthelongesttenureavailablebasedontheavailabilityofdatatoincreasetheprecisionofourestimation.Sincetherisk-freeratepublishedbyCCILwasavailablefromJune2001,wehaveconsideredtheperiodfromJune2001toDecember2018.
Duringthistimeperiod,wehaveconsideredvariousinvestmenthorizons,withtheshortestinvestmenthorizonofoneyear,andthenestimatedtheERPfortheseinvestmenthorizons.
10-year zero coupon yield (June 2001 to December 2018)
Jun-
01Ju
n-02
Jun-
03Ju
n-04
Jun-
05Ju
n-06
Jun-
07Ju
n-08
Jun-
09Ju
n-10
Jun-
11Ju
n-12
Jun-
13Ju
n-14
Jun-
15Ju
n-16
Jun-
17Ju
n-18
0.0%
2.0%
4.0%
6.0%
8.0%
10.0%
12.0%
Types of meanThechoiceofmeanusedtoestimatetheriskpremiumhasanimportantimpactontheestimate,andthechoiceremainsbetweenarithmeticandgeometricmean.WehaveusedthearithmeticmeantoestimatetheERPoveralltheinvestmenthorizonsasitbestrepresentssingle-periodholdingreturns,whicharesynchronoustothechoiceofmodel,theERPisusedwith,iemostofthemajorfinancemodelsincludingCAPMandothermulti-factormodelsaresingle-periodreturnmodels.
MethodologyToestimatetheERPundertheHistoricalEstimateapproach,wefollowedthefollowingmethodology:
WeestimatedthecompoundedannualisedgrowthintheTotalReturnNifty50Indexpricesandbondpricesbasedonthe10-yearzerocouponyieldsforvariousinvestmenthorizonsas:
Return=Index closing at n2
Index closing at n1( (365
(n2 - n1)
Wethenestimatedtheexcessreturnas:
Excess return = Return on TR Nifty 50 - Return on bond prices
Thereafter,weincorporatedaforward-lookingassumptionintheanalysisbyeliminatingthesupply-sidecomponent.Thesupply-sideadjustmenttakesintoaccounttheearningsthatcompaniesgenerate(supply).Itisestimatedbyremovingthe
08ValuationInsights
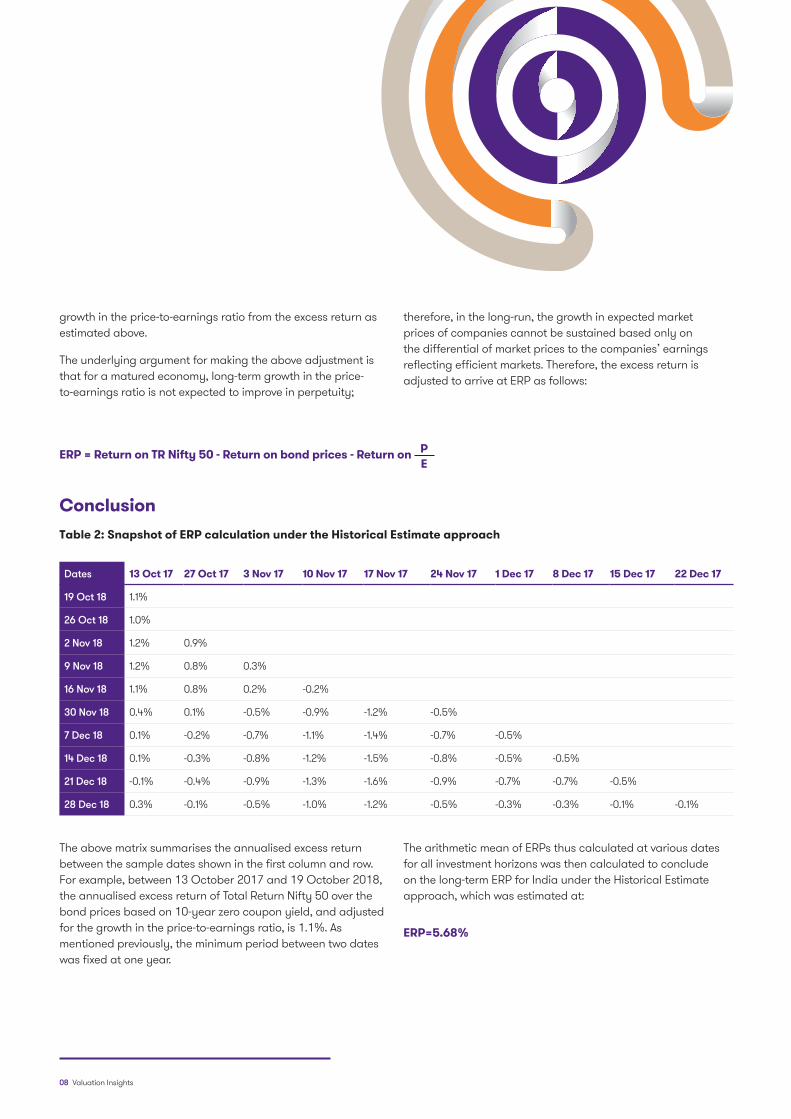
growthintheprice-to-earningsratiofromtheexcessreturnasestimatedabove.
Theunderlyingargumentformakingtheaboveadjustmentisthatforamaturedeconomy,long-termgrowthintheprice-to-earningsratioisnotexpectedtoimproveinperpetuity;
Theabovematrixsummarisestheannualisedexcessreturnbetweenthesampledatesshowninthefirstcolumnandrow.Forexample,between13October2017and19October2018,theannualisedexcessreturnofTotalReturnNifty50overthebondpricesbasedon10-yearzerocouponyield,andadjustedforthegrowthintheprice-to-earningsratio,is1.1%.Asmentionedpreviously,theminimumperiodbetweentwodateswasfixedatoneyear.
ConclusionTable 2: Snapshot of ERP calculation under the Historical Estimate approach
Dates 13 Oct 17 27 Oct 17 3 Nov 17 10 Nov 17 17 Nov 17 24 Nov 17 1 Dec 17 8 Dec 17 15 Dec 17 22 Dec 17
19 Oct 18 1.1%
26 Oct 18 1.0%
2 Nov 18 1.2% 0.9%
9 Nov 18 1.2% 0.8% 0.3%
16 Nov 18 1.1% 0.8% 0.2% -0.2%
30 Nov 18 0.4% 0.1% -0.5% -0.9% -1.2% -0.5%
7 Dec 18 0.1% -0.2% -0.7% -1.1% -1.4% -0.7% -0.5%
14 Dec 18 0.1% -0.3% -0.8% -1.2% -1.5% -0.8% -0.5% -0.5%
21 Dec 18 -0.1% -0.4% -0.9% -1.3% -1.6% -0.9% -0.7% -0.7% -0.5%
28 Dec 18 0.3% -0.1% -0.5% -1.0% -1.2% -0.5% -0.3% -0.3% -0.1% -0.1%
ThearithmeticmeanofERPsthuscalculatedatvariousdatesforallinvestmenthorizonswasthencalculatedtoconcludeonthelong-termERPforIndiaundertheHistoricalEstimateapproach,whichwasestimatedat:
therefore,inthelong-run,thegrowthinexpectedmarketpricesofcompaniescannotbesustainedbasedonlyonthedifferentialofmarketpricestothecompanies’earningsreflectingefficientmarkets.Therefore,theexcessreturnisadjustedtoarriveatERPasfollows:
ERP = Return on TR Nifty 50 - Return on bond prices - Return on PE
ERP=5.68%

ValuationInsights09
Forward-Looking EstimateForward-lookingestimatestocalculatetheimpliedERPprevalentintheeconomy,indirectlycapturedinthecurrentmarketvalueoftheequitymarket,isanotherimportantapproachtoestimatetheERP.TheimportanceofthisapproachstemsfromthefactthatERPtoalargeextentisbasedoninvestorexpectationsofeconomicandfinancialmetricsgoingforward.Theseestimatesarelesssubjectivetoissuesofnon-stationarityanddatabiasesascomparedtohistoricalestimates,andthereforehistoricalestimatesandforward-lookingestimatesareoftenusedinconjunction.
Theapproachofforward-lookingestimatestoarriveattheERPisgroundedintherealitythatthetotalvalueoftheequitymarketasrepresentedbyabroadequityindex,reflectedinitsmarketcapitalisation,isthepresentvalueofallthefuturecashflowsexpectedtobeearnedintheequitymarketwhichareinturnrepresentedbytheexpectedfuturecashflowsoftheconstituentsoftheequityindex.
Thediscountratewhichequatesthepresentvalueofexpectedfuturecashflowstothetotalmarketcapitalisationofalltheconstituentsoftheindexrepresentsthetotalmarketreturnexpectationbyinvestorsintheequitymarket.Thereafter,ERPisestimatedasthedifferencebetweenthetotalmarketreturnandtherisk-freerate.
ERP = Market return - Risk free rate
MethodologyUnderthisapproach,weconsideredthefollowingmethodologytoestimatetheERP:
• WeusedtheFreeCashFlowstoEquity(FCFE)approachtoestimatetheexpectedfuturecashflowsforeachoftheconstituentsoftheNifty50Index.
FCFE = Cash flows from operations-Interest expense-Capital expenditure + Increase (Decrease) in net borrowings
• Weconsideredamulti-stagegrowthmodeltoestimatetheexpectedfuturecashflowsforeachoftheconstituentsofNifty50fromFY2019throughFY2028,andthereafterconsideredaterminalperiodwhichrepresentstheexpectedfreecashflowsinperpetuity.
– ToestimatetheFCFEfortheperiodFY2019throughFY2021,wereliedonconsensusanalystestimatesforeachcomponentofFCFE.
– Thereafter,futurefreecashflowsfromtheperiodFY2022toFY2028wereextrapolatedtoreachanormalisedgrowthrateof7.50%intheterminalperiod,whichisbasedon10-yearzerocouponyieldasof31December2018aspublishedbyCCIL.
• TheFCFEfortheindexwasthencalculatedbyweighingtheFCFEsofeachoftheindexconstituentsbytheweightsofeachconstituentintheindexasof31December2018.
• TheFCFEfortheterminalperiodwasthencapitalisedusingtheGordonGrowthModeltoarriveattheterminalvalueasof31March2028.Thepresentvalueunderthismodelisestimatedas:
Terminal value=(Market return-g)
(FCFE(n-1) )*(1+g)
where
(n-1) is the period ending 31 March 2028
g is the long-term sustainable growth rate of 7.5%
(based on 10-year zero coupon yield as of 31 December 2018 as published by CCIL)
• Basedontheabove-estimatedcashflows,weestimatedtheimpliedmarketreturn,whichequatesthepresentvaluesofsuchcashflowstotheadjustedmarketcapitalisationoftheindex,asfollows:
Market capitalisation of Nifty 50
Present value of terminal value
= +(1+Market return)n
∑FCFEn
where
Market capitalisation of Nifty 50 as of 31 December 2018 was adjusted for non-operating assets such as cash and cash equivalents, long-term investments, etc.

10ValuationInsights
ConclusionBasedontheaboveestimates,wearrivedatamarketreturnof15.17%,whichwasthenusedtoarriveattheimpliedERPunderCAPMasfollows:
ERP=Beta
Market return - Risk free rate
Therisk-freerateconsideredasof31December2018was7.50%,whichisbasedonthe10-yearzerocouponyieldaspublishedbyCCIL.Abetaof1.0xforthemarketportfoliowasthenconsideredtoconcludeonthelong-termERPforIndiaundertheForward-Lookingapproach,whichwasestimatedas:
ERP=7.67%
PleasenotethattheERPasestimatedundertheForwardEstimateApproachisbasedontherisk-freerateprevailingasoftheestimateddateof31December2018.Whileaminorchangeintherisk-freerateshouldnotimpactthefundamentalexpectationasarrivedatunderthisapproach,anysignificantchangeintherisk-freeratemayleadtoamaterialchangeintheERPexpectation,andtherebyrequirere-estimation.
Conclusion – ERPBasedonthearithmeticmeanofERPsestimatedunderboththeapproachesasdescribedabove,webelievethatanERP (rounded) of 6.75%canbeconsideredasareasonablepremiumforinvestingintheequitymarketsintheIndianeconomy.

ValuationInsights11
• ClearingCorporationofIndiaLimited
• ThomsonReutersDatabase
• CapitalIQDatabase
• NationalStockExchangeofIndia
Acknowledgements
Sources
Editorial review Design
TanmayMathur GurpreetSingh
Authors
ManishSaxena
AmitBora
PriyankaJain
PranjalKapoor
VibhorSinghal
For media queries, please contact:
Spriha Jayati E:[email protected]:+919323744249

12ValuationInsights
Contact us
For more information or for any queries, write to us at [email protected]
To know more, please visit www.grantthornton.in or contact any of our offices as mentioned below:
Follow us @GrantThorntonIN
©2019GrantThorntonIndiaLLP.Allrightsreserved.
“GrantThorntoninIndia”meansGrantThorntonIndiaLLP,amemberfirmwithinGrantThorntonInternationalLtd,andthoselegalentitieswhichareitsrelatedpartiesasdefinedbytheCompaniesAct,2013.
GrantThorntonIndiaLLPisregisteredwithlimitedliabilitywithidentitynumberAAA-7677andhasitsregisteredofficeatL-41ConnaughtCircus,NewDelhi,110001.
ReferencestoGrantThorntonaretoGrantThorntonInternationalLtd(GrantThorntonInternational)oritsmemberfirms.GrantThorntonInternationalandthememberfirmsarenotaworldwidepartnership.Servicesaredeliveredindependentlybythememberfirms.
NEW DELHINationalOfficeOuterCircleL41ConnaughtCircusNewDelhi110001T+911142787070
NEW DELHI6thfloorWorldmark2AerocityNewDelhi110037T+911149527400
AHMEDABAD7thFloor,HeritageChambers,Nr.AzadSociety,NehruNagar,Ahmedabad-380015
BENGALURU5thFloor,65/2,BlockA,BagmaneTridib,BagmaneTechPark,CVRamanNagar,Bengaluru-560093T+918042430700
CHANDIGARHB-406A,4thFloorL&TElanteOfficeBuildingIndustrialAreaPhaseIChandigarh160002T+911724338000
CHENNAI7thFloor,PrestigePolygon471,AnnaSalai,TeynampetChennai-600018T+914442940000
DEHRADUNSuiteno.2211,2ndfloorBuilding2000,MichiganAvenue,DoonExpressBusinessParkSubhashNagar,Dehradun-248002T+911352646500
GURGAON21stFloor,DLFSquareJacarandaMargDLFPhaseIIGurgaon122002T+911244628000
HYDERABAD7thFloor,BlockIIIWhiteHouseKundanBagh,BegumpetHyderabad500016T+914066308200
KOCHI6thFloor,ModayilCentrepointWarriamroadjunctionM.G.RoadKochi682016T+914844064541
KOLKATA10CHungerfordStreet5thFloorKolkata700017T+913340508000
MUMBAI16thFloor,TowerIIIndiabullsFinanceCentreSBMarg,Elphinstone(W)Mumbai400013T+912266262600
MUMBAI9thFloor,ClassicPentagonNrBislerifactory,WesternExpressHighway,Andheri(E)Mumbai400099T+912261767800
NOIDAPlotNo.19A,7thFloorSector–16ANoida201301T+911204855900
PUNE3rdFloor,UnitNo309to312WestWing,NyatiUnitreeNagarRoad,YerwadaPune-411006T+912067448800


