50
Erasmus Platform for Sustainable Value Creation Working paper The impact of ESG factor materiality on stock performance of firms Kelly van Heijningen

Erasmus Platform for Sustainable Value Creation
Working paper
The impact of ESG factor materiality on stock performance of firms
Kelly van Heijningen

Working paper
The impact of ESG factor materiality on stock performance of firms
June 2019
Kelly van Heijningen Erasmus Platform for Sustainable Value Creation

| Erasmus Platform for Sustainable Value Creation3
Introduction 4
Literature review 8
Methodology and data 15
Results 21
Conclusions and implications 32
References 34
Appendices 38

Firms, investors and other stakeholders have come to understand the importance of social, environmental and governance (ESG) issues in the world. This has led to a boom in the number of sustainable funds, investors integrating ESG factors in their analyses and UNPRI signatories. Currently, the UNPRI has more than 1800 signatories that together accumulate approximately $70 trillion in Assets under Management (AuM). According to Morningstar (2018), portfolios that use an approach to sustainable investing have $23 trillion of AuM in 2017. The compound annual growth rate of all ESG assets as a share of global AuM is currently growing even faster than passives, which have seen a huge boost over the past few years (Pictet AM, 2018). The academic world has seen a similar explosion with more than 2000 papers investigating the relationship between ESG factors and corporate financial performance (CFP) by 2015 (Friede et al., 2015). Despite this, no clear conclusions have been drawn regarding this relationship, though most studies do find a non-negative relationship (Friede et al., 2015; Mattingly, 2017). Khan et al. (2016) propose that a reason for this is that academia is not distinguishing which ESG factors have material impacts on firms and thus are finding inconsistent and insignificant results. In this sense, information is rendered material if a reasonable stakeholder sees it as important or if omitting this information would change the choices made by the relevant stakeholders (GRI, 2016). So far though, there has been limited academic research regarding which ESG factors have material impacts on firms. This is conflicting as investors state that the prime reason for considering ESG factors is that they believe it has a material financial impact on investment performance (Amel-Zadeh & Serafeim, 2017). Additionally, many corporations are publishing materiality matrixes within their sustainability reports, because this information gives insight into the risks and opportunities that the firm faces. As these material factors are presumably influencing firm performance, it is key for investors to gain a better understanding of these factors and their impacts.
Research question and dataset
Based on the diverging developments between the academic world and practitioners, there is a need to further investigate the materiality of ESG factors and their impact on the financial performance of firms. Therefore, the central research question that will be investigated is:
Does the materiality of ESG indicators positively influence the relationship between ESG and stock price returns on a global basis?
1 Introduction
| Erasmus Platform for Sustainable Value Creation4

This is analysed by testing the effect of material ESG scores on stock returns. Material ESG scores are defined as the scores that firms have on ESG indicators that are deemed material in their industry. Also, the effect of total ESG scores, which don’t adjust for materiality, and immaterial scores on stock performance is assessed. Both the level as well as the changes in the scores are analysed.
This research will be based on a uniquely created database that incorporates detailed industry knowledge and thus improves the practical relevance of the results. The materiality of ESG issues will be derived from Robeco’s and 1
RobecoSAM’s internal research. This research concentrates on issues which they 2
believe influence long-term company value and a major part of this is their top-down industry and mega-trend analysis. For each of the 60 industries, RobecoSAM determines the key value drivers and estimates how sustainability trends would impact these industry drivers. Consequently, these insights are visualised in materiality matrices, which plot the issues in terms of their likelihood of impact and magnitude of impact. This research thus determines what ESG issues are regarded to be material for that industry.
Next, these industry-level ESG topics (e.g. water management or corporate governance) are linked to firm-specific scores through a manual process. An example can be found in Appendix I, where one can see how the topics are connected to the most relevant indicators on which the firms are scored. The scores on these factors are based on RobecoSAM’s Corporate Sustainability Assessment (CSA). Each year, this research is performed by asking 3,400 globally-listed firms about 80-120 industry specific questions. These questions target environmental, social and governance aspects that are usually disregarded in traditional financial analyses. The firms that fill in this questionnaire make up the ‘company-assessed’ (CA) group within the dataset and their scores are thus based on a mix of public information and information that is less transparent or widely available. This second type of information is called ‘private’ information. Next to that, RobecoSAM also performs their own company assessments, which are only based on public information, such as information published in sustainability reports. These firms are referred to as ‘self-assessed’ (SA) firms. Having this discrepancy in the data, provides a unique opportunity to test the value of these different types of sustainability information.
Using this data, materiality and immateriality scores are created for each firm and used to form portfolios. These portfolios are consequently tested on their stock price performance, as will be discussed in more detail in a later section.
Robeco is a Dutch asset manager that was founded in 1929, offers a large range of active strategies from equities to bonds and has 1
accumulated approximately €161 billion in AuM (December 2017).
RobecoSAM is a sister company of Robeco that is exclusively focussed on sustainability investing, and thus performs the majority of 2
sustainability-related research for Robeco. Next to that, RobecoSAM’s research forms the backbone for the construction of the Dow Jones Sustainability Indices.
| Erasmus Platform for Sustainable Value Creation5

Academic and practical relevance This research has a high level of both academic and practical relevance. In a broad sense, this paper adds to the understanding of the relationship between ESG performance and financial performance, as it touches upon a new and hardly researched aspect of this relationship: materiality. Materiality offers a potential reason for why there have been such diverging results in previous ESG research. Therefore, it is an important characteristic that must be further investigated. This paper extends the limited amount of existing research on materiality, such as that of Khan et al. (2016), in various dimensions, including a global, more extensive dataset and unique tests for pollutive and human capital intensive industries. Another new aspect of this paper stems from an interesting manner in which RobecoSAM’s data is set up. Namely, part of the company scores are based on a detailed questionnaire, which thus also includes information that is less openly available or transparent, called ‘private’ in this paper. The other part is purely based on public information that is thus widely available. This makes it possible to test whether detailed ‘private’ ESG firm information is a better predictor of financial performance than general public information. Until now, this has not been tested with respect to ESG information and therefore this paper will provide some initial insights regarding this relationship.
On an industry level, this research also has a high degree of practical relevance. Materiality is playing an increasingly important role for investors, firms and asset managers. For many of these players materiality has been assumed to be an important factor to predict financial performance and has been given a foundational position in a lot of ESG analyses. This assumption, however, has not been widely supported in literature. Therefore, it is highly important that this factor is further researched. Based on the findings of this paper, investors and professional asset managers, will be able to make a more knowledgeable consideration regarding which firms to invest in and how they can incorporate materiality in their investment analyses. For instance, Robeco assumes that materiality plays an important role in performance expectations, without having strong academic support for this claim. Thus, this research could test the robustness of the relationship between materiality and performance. This could consequently improve Robeco’s internal research and portfolio creation methodology. On the other hand, many sustainable funds currently invest in firms that have high ESG score in general without making purposeful decisions regarding which ESG factors have a material impact on performance. As concluded from previous literature, investing superficially in firms that have high overall ESG scores has led to mixed results in terms of performance. Hence, this research aims to improve the positive screening potential of investors. Additionally, by performing industry specific tests, this research could potentially find whether traditionally pollutive or human capital intensive industries can offer financial outperformance due to investments in material ESG issues.
| Erasmus Platform for Sustainable Value Creation6

This paper offers some promising findings in support of the concept of materiality within ESG research. Portfolios ranked on their scores on material indicators show consistent patterns in terms of performance. For instance, the top portfolio in terms of materiality score consistently outperforms the bottom portfolio, in the sense that the top portfolio achieves significant risk-adjusted alpha whereas the bottom portfolio does not. The excess returns of the portfolios also differ significantly, when basing it on average material ESG scores. This finding is consistent with the belief that material ESG information is currently not incorporated correctly in the share price and thus offers a potential to achieve alpha. On the other hand, no such relationship is found for portfolios ranked on immaterial ESG factors, thus indicating that this data is less relevant for the integration of ESG information in fundamental analysis. Interestingly though, the relationship between material ESG performance and financial performance is not linear for score levels. Instead it appears to be positive until a certain threshold and then flattens off. The relevancy of material information is found to be stronger for pollutive industries.
For material ESG score changes, a U-shaped relationship between the scores and abnormal returns has been discovered. This can indicate that positive ESG changes are currently not incorporated correctly in the prices and thus can provide improved investment strategies. On the other hand, the outperformance of firms with large negative changes may be consistent with the belief that large ESG deterioration is perceived as higher risk by investors.
Although this non-linearity makes drawing strong conclusions about the relationship more difficult, materiality in itself does show some promising consistency that should be further investigated. Moreover, the differentiation between company-assessed (CA) and self-assessed (SA) firms have shown some novel insights into how relatively private and less transparent ESG information can have different impacts on investors and financial returns than pure, widely-available public information. The information that RobecoSAM collects through its questionnaire provides a higher predictive ability of financial returns, as the detailed information forms a more accurate picture of the firm’s material ESG performance.
The rest of the paper is set up in the following manner. In Section 2 a brief overview is provided of the most relevant literature about sustainability and its impact on financial performance. Section 3 explains what method is used to answer the hypotheses and the unique dataset that is created for this and its sources. Section 4 describes the results of the research, which are consequently discussed and concluded in Section 5.
| Erasmus Platform for Sustainable Value Creation7

Prominent streams within the literature on ESG-CFP
The term ‘sustainability’ was first coined in The Brundtland Report of 1987. Here it defined sustainable development as “development that meets the needs of the present without compromising the ability of future generations to meet their own needs”. Following this report many different definitions came into play, as both the academic world and practitioners gained interest in the field. There are two main streams that have been formed within the research on the impact of sustainability on financial performance. The older and more ‘neoclassical’ view stems from Friedman (1970), in which the goal of the company was argued to be increasing shareholder wealth and ESG policy implementations was expected to destroy shareholder wealth. The reason for this is that sustainability investments are expected to increase the cost of the firm without improving profitability (Jensen, 2001; Barnett, 2007; Scherer & Palazzo, 2011).
The other side of the spectrum argues that investing in sustainable practices can lead to various benefits to the firm under the mantra of “doing well by doing good”. By meeting the needs of other stakeholders, the firm’s shareholders will also benefit (Freeman, 1984; McGuire et al., 1988; Freeman et al., 2010). This view has been gaining acceptance world-wide, though the real understanding and proof of how it affects performance is still being developed. One reason for this is that many of the researchers often implicitly assume that this relationship holds, as they for instance argue that complying with the needs of stakeholders improves legitimacy, lowers transaction costs and sustains firms in harder times (Jones, 1995; Perrini et al., 2011).
Many papers have also tried to test and understand this relationship. As mentioned, the amount of research on this field has been growing exponentially, with over 2000 studies investigating links between ESG and performance (Friede et al., 2015). Even though many different methods and datasets have been used, almost 90% of studies find a non-negative relationship between ESG and performance. This provides solid support against the negative neoclassical view. Most importantly, Friede et al. (2015) find that the large majority of papers have significant positive results. This finding was also robust when using various approaches and when splitting the data set into subsets, such as by region and by asset class.
Channels that link ESG to financial performance Perrini et al. (2011) argue that the relationship between ESG performance and
2 Literature review
| Erasmus Platform for Sustainable Value Creation8

financial performance is very complex, ambiguous and nuanced. This is because improved performance on ESG issues can enhance a firm’s various key value drivers: growth, profitability, capital efficiency and risk exposure (Schramade, 2016). From a stakeholder perspective, there is evidence that ESG improvements lead to stronger external relationships, better risk management, lower cost of capital, sustained competitiveness and human capital in the future, as it prepares firms for market transitions (Donaldson & Preston, 1995; Jones, 1995; Orlitzky et al., 2003; Lo & Sheu, 2007). On the operational side, it also leads to more resilient organisational processes, information systems, efficiency and less waste in the production processes (Russo & Fouts, 1997; Konar & Cohen, 2001; Orlitzky et al., 2003; Eccles et al., 2014). Finally, reputation and the advertising impact of ESG can boost sales growth, lower idiosyncratic risk of firms and attract better employees (Fombrun & Shanley, 1990; Bhattacharya & Sen, 2003; Orlitzky et al., 2003; Luo & Bhattacharya, 2006). Although the individual links have been hard to isolate, the combined influence is expected to have a positive impact on firm value despite the higher need for investment.
ESG factor returns within Modern Portfolio Theory
The proposed outperformance is to some extent opposite to what would be expected by Modern Portfolio Theory. This asset pricing theory is based on the efficient market hypothesis that asserts that the return of a portfolio is proportional to its associated risk and that the optimal portfolio is diversified (Derwall et al., 2005). Additionally, the efficiency of the market is expected to be high enough so that all new relevant information is immediately incorporated into the stock prices. Within this theory, portfolios should thus not make a risk-adjusted abnormal return when for instance being sorted on ESG performance. There are three scenarios that can unfold in terms of the relation between ESG performance and stock returns (Manescu, 2010). The first scenario could be called the “no-effect scenario” in which no difference is found between the top and bottom performing firms in terms of ESG. This finding would be consistent with the efficient market hypothesis. It would come into play if either ESG information is not relevant for stock performance, or if all the information is publicly available and correctly priced into the value of the stocks (Manescu, 2010). In this case, no performance difference would be expected based on ESG-level scores. Though ESG score changes could lead to movements in stock prices, as the investors incorporate the new information into their stock valuation.
The second and third scenario apply if differences are found between the stock returns of the top and bottom portfolios. The “risk-factor scenario” would be visible if the low-scoring ESG firms would achieve higher risk-adjusted returns (Manescu, 2010). This is as the level of risk is expected to be lower for firms with high ESG performance, and therefore these firms should achieve lower financial returns. Risks that relate to this are, for instance, environmental risk, litigation risk, product risk or lower investor trust (Manescu, 2010). However, as was discovered in a wide range of articles, ESG sorting and screening often leads to financial outperformance. This finding supports the “mispricing scenario”, which states that
| Erasmus Platform for Sustainable Value Creation9

ESG performance does affect a firm’s cash flows, though investors do not incorporate this correctly in their valuations (Manescu, 2010). This could be caused by the fact that not enough high-quality information is available. Besides that, Lo (2017) argues that the extent to which ESG information is incorporated in the stock prices depends on an adaptive process that is dependent on the number of fundamental analysts and the manner in which they learn to incorporate the information. According to proponents of SRI, improvements in terms of ESG performance affects the long-term performance of firms. However, due to short-term thinking within the financial industry, this long-term value is often mispriced and thus corrected for at a later stage (Derwall et al., 2005). According to Derwall et al. (2005), this is because investors underestimate the benefits and overestimate the costs.
ESG level and ESG momentum
There have been wide-scaled discussions regarding the impact of ESG performance on portfolios and how ESG integration can be used as a method of enhancing portfolios (e.g. Nagy et al., 2016, Davis et al., 2017). One of the more practical discrepancies that was noted has been regarding the fact that in most papers, ESG levels are taken as the signal to form the portfolios, whereas some argue that ESG level changes would theoretically have more predictive power, if the current ESG levels would be valued correctly (Davis et al., 2017). NN Investment Partners and ECCE (2017) found evidence for this, as portfolios that were sorted on ESG score momentum lead to a higher performance than those sorted on ESG levels. Interestingly, changes in governance measures had the greatest impact on performance.
Additionally, the differential between the portfolio of stocks with the highest changes and those with the smallest changes was largest for firms with medium ESG levels. This indicates that both changes and levels of ESG scores are relevant in creating portfolios. This has also been argued in Nagy et al. (2016), who investigate both ESG tilt portfolios (portfolios sorted on ESG score levels) and ESG momentum strategies (portfolios sorted based on ESG changes). Nagy et al. (2016) discover that both strategies outperform its benchmark. The momentum strategy allows the investor to benefit from expected market reactions following an ESG score change within a short time period. On the other hand, an ESG tilt strategy benefits over a longer term, as a better-rated portfolio is argued to be more resilient. Additionally, Nagy et al. (2016) find that these results are robust even when style and industry effects are excluded.
Materiality of ESG issues
Despite a huge amount of literature describing the link between a wide range of ESG issues and financial performance, the materiality of these ESG issues has received little attention. This creates a gap between academic literature and the industry, as both companies, institutions and professional investors are looking at
| Erasmus Platform for Sustainable Value Creation10

the materiality of issues in order to value their impact on financial performance. This is because material issues are expected to influence the key value drivers of a firm: growth, profitability, capital efficiency and risk exposure (RobecoSAM, 2018, Schramade, 2016). These material ESG indicators are thus the ones that have the potential to carry alpha (Giese et al., 2016).
The concept of materiality forms the foundation of today’s financial reporting standards, including both quantitative and qualitative aspects (Eccles, 2012). It is used by companies and auditors on a daily basis. The following definitions of materiality are regarded as the most important, particularly in the US. The Financial Accounting Standards Board (FASB) states that “information is material if omitting or misstating it could influence decisions that users make on the basis of the financial information of a specific reporting entity” (Eccles et al., 2012). Thus, as materiality is regarded as something that is firm-specific, no universal quantitative measures are assigned. The US Supreme Court’s definition states that information is material if there is “a substantial likelihood that the disclosure of the omitted fact would have been viewed by the reasonable investor as having significantly altered the ‘total mix’ of information made available”.
The definition of materiality for non-financial information, such as environmental, social and governance indicators, has been based on the definition for financial information. Its focus is whether the information would change the decision making by the relevant stakeholders, which is visible in definitions by several institutions, such as the United Nations and the Global Reporting Initiative (GRI). Though instead of an entity-specific materiality definition, GRI defined materiality by sector (GRI, 2016). This sector level definition has made it easier to compare firms on their ESG performance and to integrate guidelines into financial reporting. The US-based Sustainability Accounting Standards Board (SASB) takes an investors perspective to identify which sustainability metrics are expected to have a material impact on the financial condition or operating performance of firms. The issues that SASB has defined as material per industry and sector have become reference points for many industry papers and company reports.
On the investor side materiality is also playing a larger role. Robeco integrates the materiality of ESG issues within their fundamental analysis as well as their quant investing strategies (Robeco, 2018). On the fundamental side, Robeco uses its Value Driver Adjustment approach (VDA), as laid out in the paper by Schramade (2016). This approach fully incorporates ESG into the traditional valuation techniques, by adjusting the company value dependent on how certain material ESG issues are expected to change the company’s value drivers through its impact on business models and competitive positions (Schramade, 2016). On the quant side, Robeco requires minimum standards on industry-wide material ESG issues within its portfolios.
Despite that the subject of materiality has been gaining momentum, the current academic literature on the impact of material ESG issues is still minimal. The paper by Khan et al. (2016), as self-acclaimed, provided the first evidence on the effect of
| Erasmus Platform for Sustainable Value Creation11

materiality on financial firm performance in the US. The authors define which factors are material by using the industry-level materiality maps of SASB and linking these to the data points provided by the MSCI KLD database. Using these definitions, firm-level scores on material issues and immaterial issues are created for 2,307 US firms in the period 1991-2012. Though, instead of forming portfolios based on these level scores, the authors sort portfolios based on the amount of unexplained (by firm characteristics) changes in the materiality score. These portfolios are then held for a year and tested on abnormal stock returns. Khan et al. (2016) find that firms with high performance on material issues outperform firms with low performance on these factors. High performance on non-material issues does not lead to underperformance compared to those with low performance on these factors, despite the higher investment costs by the firm. Interestingly, firms that perform well on material issues and low on immaterial issues have the best performance. This implies that investments into ESG issues need to be made wisely, as only the material issues have a significant impact on performance.
Hypotheses and propositions
This paper aims to fill the gap between the research on ESG materiality and the novel steps taken by practitioners. Based on the literature that has been discussed above, this paper will address the following hypotheses:
Hypothesis 1: ESG score levels and changes on material issues are positively related to financial performance
This hypothesis is based on two primary arguments. The first stems from the definition of materiality itself, as materiality is defined as those points of information that are expected to have a significant impact on financial performance. Additionally, this is substantiated by the wide range of research that supports the impact of ESG on financial performance. Second are the findings by Khan et al. (2016) that find support for this hypothesis in the US. As these dynamics, are expected to hold globally, we also expect to find a positive relationship for RobecoSAM’s global dataset.
Hypothesis 2: ESG score levels and changes on immaterial issues are insignificantly related to financial performance
Building on the wide range of articles and meta analyses, such as Friede et al. (2015) and Orlitzky et al. (2003), high scores on immaterial ESG indicators are expected to have an insignificant effect on financial performance. This is because even though the investment in immaterial factors requires funding, it is likely to have some positive impact on various channels that will cover its costs.
| Erasmus Platform for Sustainable Value Creation12

Hypothesis 3: Firms scoring high on material factors (both levels and changes) and low on immaterial factors outperform firms scoring low on materiality and high on immateriality
In order to optimise the use of corporate funds, the most productive means would be to invest in material ESG issues and invest minimally in immaterial issues. If it is true that high performance on material issues leads to positive financial returns, and high performance on immaterial issues leads to insignificant effects, optimising the net present value of all CSR investments would be to only invest in material issues.
Hypothesis 4: The return differentials between the HMLI and LMHI portfolios are larger for traditionally pollutive industries than for the portfolios that include all industries
Traditionally pollutive industries are more sensitive to new environmental legislation, environmental disasters, reputation risk, price changes, and others (Konar & Cohen, 2001; Derwall et al., 2005). Thus, high performers on the material issues are expected to be less affected by negative external hits. Additionally, the efficiency that can be attained by scoring high on environmental issues is expected to be more directly related to operational performance than other factors, as the eco-efficiency often moves in line with cost-efficiency (Derwall et al., 2005). Due to these dynamics, we expect that the difference between the high performing and low performing portfolios in terms of materiality score in the pollutive industries will be larger than for the entire universe of industries.
Hypothesis 5: The return differentials between the HMLI and LMHI portfolios are larger for industries that rely heavily on human capital than for the portfolios that include all industries
Higher performance on ESG factors has been related to higher level of human resources, human capital management, recruitment and retainment (Fombrun & Shanley, 1990; Russo & Fouts, 1997; Orlitzky et al., 2003; Lo & Sheu, 2007). In industries that are dependent on human capital, such as knowledge and creativity, this relationship is argued to be stronger. Therefore, based on these arguments we expect that the return differential between the best and worst performing portfolios will be larger than for the entire universe of industries.
Hypothesis 6: The return differentials between the HMLI and LMHI portfolios are larger for firms that are company-assessed than those that are self-assessed
As previously mentioned, the company sustainability data of RobecoSAM is made up of two main segments: self-assessed (SA) firms and company-assessed (CA) firms. The SA score is based on widely-available public information, whereas the CA also incorporates a lot of information that is not published in, for instance, the
| Erasmus Platform for Sustainable Value Creation13

firm’s sustainability reports. Therefore, the CA information is less transparent and less widely incorporated by investors. Public, widely available, information should, according the Efficient Market Hypothesis, be largely incorporated into the current price, and should thus not lead to an outperformance. On the other hand, information that is less transparent, might not be fully absorbed into the stock price, dependent on the efficiency of the market (Finnerty, 1976). More important is the fact that the information filled in the questionnaire by the CA firms is more detailed and shows a more realistic picture of the firm’s sustainability performance. Due to this, the scores that are based on this information may also be more accurate. Therefore, we expect that the difference between the high and low performing portfolios will be greater for the CA firms, as their scores are also based on relatively detailed and less transparent information. Still, for simplicity we will be referring to the CA information as a mixture of private and public information, though the information is strictly speaking not private. 3
To note, once the scores of CA firms are created, these are available for public distribution and are thus not only held internally. 3
However, these scores are not as widely used as the ESG scores of other databases, such as MSCI.
| Erasmus Platform for Sustainable Value Creation14

Method
Construction of materiality and immateriality scores
When constructing the materiality and immateriality scores, the industry-level information, which defines what factors are material, and the firm-specific scores on various relevant indicators are combined. See Appendix I for an example of how industry-level material issues are linked to company specific indicators.
The materiality score of a firm is the weighted average score that the firm has on each aspect that is determined to be material. In order to form the overall score, the E, S and G weights are based on the number of data points that make up the E, S and G aspect scores. For instance, if the environment score is based on only one ‘material’ indicator, whereas the government score is based on five ‘material’ indicators, this method will overweight governance.
This ensures that the overall score leans towards the aspect that is most relevant, and that it is not biased by an aspect score that is made up of a low number of indicators. This looks as follows.
(1)
(2)
SMatE,it indicates the score on material environmental criteria i at time t. nMatE
indicates the number of material environmental indicators. Similarly, SMatS,it
indicates the score on material social indicator i at time t, and so on. For the immaterial score, the same method is used, as can be seen in equation 2. As mentioned, the base case uses WE, WS and WG weights that are determined by the number of indicators that make up each aspect. Next, the use of an average score, instead of an weighted average score, is also tested, as this can provide a balanced view of a firms ESG performance.
Portfolio creation method
Formula 1-2 lead to static materiality and immateriality scores per company per year. From this point onwards, two different methods are tested: both the impact of ESG score levels as well as score changes will be investigated. This is done as
3 Methodology and data
| Erasmus Platform for Sustainable Value Creation15
generally most research uses ESG levels to test the link with financial performance, while on the other hand Khan et al. (2016) and other papers uses changes. They argue that the reason for using ESG changes, instead of ESG levels, is that changes in ESG scores are more relevant than levels of ESG scores, and have a higher chance of predicting future financial return changes (NNIP & ECCE, 2017). The authors argue that the level of a firm’s ESG score is built up from past improvements and decays, and is therefore most likely already incorporated in current stock prices. However, others argue that score levels are more related to long-term performance, which is in line with the notion of long-term value creation (Nagy et al., 2016, Schoenmaker & Schramade, 2018). This is expected to lead to abnormal returns, if investors misprice this long-term value (Derwall et al., 2005). As Khan et al. (2016) were one of the first to identify this materiality characteristic, it is interesting to check if his idea holds globally, and if it also holds if one uses levels. This finding would obviously be most robust and thus more relevant for both academia and practitioners.
Both methods follow a similar method to Khan et al. (2016), the materiality and immateriality scores are regressed on the log of firm size, market-to-book ratio (MTB), profitability (ROA) and financial leverage . These characteristics are chosen 4
as they have the highest correlation with such ESG scores. Additionally, sector fixed effects (fs) and dummies for movement to the company-assessed (CA) bucket and for the movement to the self-assessed (SA) bucket are added to the regression . These CA and SA buckets are explained in more detail in the data 5
section. Equation 3 and 4 indicate the regressions that are performed based on ESG score levels and equations 5 and 6 indicate the regressions on ESG changes . 6
Materialit = b1 + b2 Sizeit + b3 MTBit + b4 ROAit + b5 Leverageit + b6 CA + b7
SA+ fs + eit (3)
Immaterialit = b1 + b2 Sizeit + b3 MTBit + b4 ROAit + b5 Leverageit + b6 CA + b7 SA+ fs + eit (4)
ΔMaterialit = b1 + b2 ΔSizeit + b3 ΔMTBit + b4 ΔROAit + b5 ΔLeverageit + b6
CA + b7 SA+ fs + eit (5)
ΔImmaterialit = b1 + b2 ΔSizeit + b3 ΔMTBit + b4 ΔROAit + b5 ΔLeverageit + b6 CA + b7 SA + fs + eit (6)
The regressions are run using sector fixed effects (fs). This is done as performance differences are expected to be much higher between sectors than between
Firm characteristics are sourced from Bloomberg as of 1st January, and are denominated in USD. 4
The CA dummy is equal to one when a firm has moved from the SA bucket to the CA bucket in that year, and vice versa for the SA 5
dummy. If the firm stays with the same bucket, both dummies are equal to zero.
Changes (Δ) is defined as the value of the variable at time t minus the value of the variable at time t-1. Thus, the absolute change in 6
the variable.
| Erasmus Platform for Sustainable Value Creation16

industries. The residuals from these equations (eit) are consequently used as a signal to form portfolios. This is because the residuals indicate what level or changes in the ESG factors are not explained by correlated characteristics and thus reduces the biases caused by these characteristics. Based on these residuals, the firms are ranked and the top (bottom) quintile is put into the top (bottom) portfolio of that year. This is done similarly for the immaterial portfolios. The base model uses equal-weighted portfolios. This has been chosen because equal-weighted portfolios give us insight into how materiality affects performance for the average firm, which thus gives us a more unbiased view.
Testing for financial outperformance
In order to test the performances of these portfolios, the portfolios are held for one year: from the beginning of May to the end of April the following year. 7
In order to minimise the impact of factor biases on the results, the abnormal returns of the portfolios are estimated based on the Fama and French (1993) 8
methodology. This entails monthly regressions on global market (MKT), size (SMB), book-to-market (HML), momentum (MOM) (Carhart, 1997), quality (QLY) (Asness et al., 2013) and liquidity (LIQ) (Pastor & Stambaugh, 2003) factors as follows . The 9
returns are based on monthly stock price returns adjusted for dividends, and are reduced by the risk free rate to form excess returns.
Returnsi,t = b1 + b2 MKTt + b3 SMB t + b4 HML t + b5 MOM t + b5 QLY t + b6 LIQ t + eit (7)
Khan et al. (2016) do not include the quality factor, however we believe that it is a relevant factor and should be included. It has become a common factor that is included in many portfolio performance analysis papers as well as in factor investing strategies, such as those of Robeco (NBIM, 2015; Robeco, 2017). Additionally, there is evidence that quality factors can correlate with various risk factors that are related to ESG performance, such as certain characteristics of sin-stocks (Blitz & Fabozzi, 2017; Melas, 2018). Therefore, it is interesting to see what the impact is of this factor.
This is chosen because RobecoSAM sends out the questionnaire at the beginning of the year and usually receives all information by 7
September. This information has been tested and the scores have been updated by the end of April, the following year. It is important to form portfolios based on when RobecoSAM issues the updated scores and when financial data is available, in order to make an implementable strategy. By this time, most financial statement data is also available.
Throughout the paper abnormal returns will refer to the excess returns that have been corrected for the risk factors, thus the alphas 8
(b1) following from formula 7. Excess returns itself indicates the raw returns minus the risk free rate.
The market, size, book-to-market and momentum (Fama & French, 1993; Carhart, 1997) factors are sourced from the Kenneth 9
French database. These are based on the global factor returns. This data is skewed towards developed markets, though this is in line with the distribution of firms in RobecoSAM’s database. Monthly returns on the liquidity factor of Pastor and Stambaugh (2003) are sourced from the University of Chicago Booth database. The monthly quality factor returns (Asness et al., 2013) can be downloaded from the AQR database. The authors define quality through various measures of profitability, growth, safety and pay-out level, which they combine into one quality score. The quality factor indicates the monthly excess returns of a quality-minus-junk portfolio, which is based on a global investment universe.
| Erasmus Platform for Sustainable Value Creation17

Stepwise method to testing the hypotheses
The methodology explained above lays out the basis of how the various portfolios are formed and tested. In order to specifically test the six hypotheses, the following steps are taken.
Hypothesis 1 is tested by comparing the abnormal returns (the constant in formula 7) for the top and bottom portfolios ranked on materiality score. The constants (abnormal returns) are tested for significance using a t-test. Consequently, the difference in the excess returns between the top and bottom portfolios is also analysed with a t-test, by testing whether the 5-minus-1 returns are significantly different from zero. Hypothesis 2 is tested in a similar way for the portfolios ranked on the immateriality score.
Hypothesis 3 is tested by performing a double-sorts on both materiality as well as immateriality score. This double-sorting is performed in an unconditional manner and thus each portfolio consists of approximately the same number of firms. Consequently, the abnormal returns of the portfolio with the firms with a high materiality score and low immateriality score (HMLI) are compared to the other portfolios in a similar fashion as Hypothesis 1 and 2.
Hypothesis 4 and 5 aim to test whether these return differentials are larger for traditionally pollutive firms and for firms that are human capital intensive (HCI), compared to the return differentials found for other industries. Appendix II indicates which industries have been classified as pollutive or HCI. This has been based on a variety of industry reports. Firstly, materiality and immateriality ranked portfolios are created separately for firms that belong to the pollutive industries, such as mining, and for human capital intensive firms, such as biotechnology and professional services. This hypothesis is firstly tested by comparing the excess return differential between the best and worst portfolios in terms of materiality score using a t-test. If this difference is significant and larger than that of the average industry, the hypothesis is supported. Secondly, by performing the same double-sorts the difference in excess returns between the HMLI and LMHI portfolios is calculated and tested, similar to Hypothesis 3 that tests the entire universe of industries. In order to analyse whether the relationship is significantly stronger for these industries, the difference between the excess returns of these portfolios is compared using their t-test results.
Hypothesis 6 gauges whether the relationship between ESG and financial performance is relatively stronger for company-assessed (CA) scores than for self-assessed (CA) scores. This is done by splitting the data points dependent on whether they are CA or SA, and then following the same steps to forming the materiality, immateriality and double-sorted portfolios. Similar to the method behind Hypothesis 4 and 5, the difference in the excess returns of the worst and best materiality portfolios are calculated and tested with a t-test. Additionally, LMHI is deducted from the HMLI returns for both CA and SA. Consequently, the difference in these returns is tested with a t-test (zero-mean).
| Erasmus Platform for Sustainable Value Creation18

The results of these hypotheses have also been checked for their robustness through various tests. These include using average aspect scores, using value-weighted portfolios, testing subsets of the data, including varying combinations of firm characteristics as control variables, regressing on different factor models, using decile portfolios, and making geographic splits.
Data
Industry-level Materiality Data
In order to define what issues are material on an industry level, RobecoSAM’s materiality reports are used as source. Specific materiality reports have been created for most industries (approximately 60), as classified by the Global Industrial Classification System. For each industry , a financial materiality analysis is 10
performed to identify what are the key industry value drivers, and which ESG factors affect business value and influence long-term value assumptions in financial analysis, such as risk profile (Schramade, 2016; RobecoSAM, 2017). This research mainly draws upon the experience and knowledge of the industry analysts. In addition to that, it is based on discussions with firms in each industry and technical analysis of materiality.
Company-level Sustainability Data
The investment universe that has been chosen for this paper is the entire set of companies that RobecoSAM analyses. Concerns about the comparability of the data between different regions has also been accounted for through RobecoSAM’s normalisation process, as described by Giese et al. (2016). The exact number of firms that have been covered by RobecoSAM has grown exponentially. In 2006, the dataset that is used counts circa 1000 companies, in 2010 circa 2000 and 4600 as of 2017, which includes companies that do the company-assessment (CA) and firms that RobecoSAM self-assesses based on public information (SA). CA firms make up about 33% of the data points, and the SA firms about 67%. See Appendix III and IV for further details on the size, geographic split and summary statistics of the dataset.
Each year RobecoSAM invites 3,400 of the world’s largest publicly traded companies to participate in their annual corporaete sustainability assessment (RobecoSAM, 2017). This CSA is made up of an industry-specific questionnaire with approximately 80-120 questions on various ESG factors that are seen as relevant to financial performance. Using specific weights, 2-10 questions are combined into one criteria score. As the questions and the risks differ per industry, these weights thus also differ for each of them. The criteria scores are normalized across groups sorted on industry and region in order to reduce biases.
Due to the lack of certain industry specific research, the diversified financials matrix is based on that of the banks industry and the 10
insurance materiality matrix has been based on SASB.
| Erasmus Platform for Sustainable Value Creation19

One caveat in the data is that some companies have been assessed by RobecoSAM itself, mainly using public data, and others have been based on the questionnaire filled in by the company, as described above. Without an adjustment, this would lead to higher scores for the CA (company-assessed) scores compared to the SA (self/Robeco-assessed) scores. This is mainly because the CA scores are based on more information, and this transparency is valued by analysts. RobecoSAM makes adjustments for this and tries to account for this discrepancy. The method that is used to do so is the normalisation process described by Giese et al. (2016).
Additionally, issues occur when firms drop out from doing the assessments themselves, and thus are only based on public data going forward. RobecoSAM adjusts for this by keeping the companies that switch to SA in the CA bucket for an additional two years. Still, in order to make sure that the impact of the CA or SA characteristics do not influence the results, this characteristic has been incorporated in regressions 3 - 6 above. This is in the form of dummy variables, which account for when a firm moves from the CA to SA bucket and one, which accounts for when it moves from SA to CA, as both the movements are expected to have different impacts on the score
| Erasmus Platform for Sustainable Value Creation20

ESG score levels
From a high-level perspective, there is evidence that the concept of materiality is relevant to investors and firms. In particular, the worst performing firms in terms of materiality score feel the largest impact of these workings, as their abnormal financial returns are below those of the other firms. Based on average ESG scores, the difference in their excess returns is found to be significant at 5% (p=0.0387) (see Table 1A below). Thus, ESG performance on material issues seems to reduce the risk of lower financial returns. Though, a large part of this performance differential is absorbed by already priced risk factors. This can be seen in Table 2 below, which analyses the impacts of firm characteristics and risk factors on the portfolios in a stepwise manner. After the excess returns of the portfolios are controlled for the well-known risk factors (market, size, value, momentum, liquidity and quality), these annualized excess/abnormal returns drop from 10.48% to 2.69% for the top materiality portfolio. Due to this, the difference between the top and bottom materiality portfolios also decreases. Though despite this drop, there is still evidence that materiality has the better ability to differentiate between portfolios than immateriality and total ESG scores, as indicated by the positive alpha differential.
The found relationship between materiality score and financial performance does, however, not relate linearly to each other, as the best ranked portfolio is not usually the best performing portfolio (see Table 1). Instead, it appears as if there is a certain threshold until which the relationship is positive, and over this threshold the relationship flattens out or even turns slightly negative. This could indicate that following this threshold, the potential additional value has been achieved and further investments in material ESG issues do not lead to significantly positive Net Present Values. This is portrayed in the results, as the middle-ranked portfolio based on materiality score often outperforms the others. A reason for this outperformance can be that investors misprice the value of their ESG performance, and thus its true value is not incorporated in the current stock prices. Another potential reason for the flattening of the relationship might be that investors have been valuing firms that rank highly on material ESG information more positively, thus already incorporating some of the value that ESG can generate. As this information would already be integrated in their prices, the room for mispricing is smaller and thus the abnormal returns are lower. These patterns are robust for value-weighted portfolios, various factor models, the control of different firm characteristics, and the use of random subsets of the sample. For weighted scores, the patterns were also the same, however, the results are slightly less significant (p = 0.1124) (see Table 1B). This could be caused by the fact that, on average, the weighted scores were skewed towards governance factors, as many of these indicators are material to most industries. In previous research,
4 Results
| Erasmus Platform for Sustainable Value Creation21

environmental factors have been found to have a stronger impact on financial performance. Thus, when equally weighting the three aspects, the environmental score received a higher weighting than previously, which might improve the strength of the relationship. The implication of this is that all three aspects should be considered equally by analysts, whilst continuing to focus on the material issues within these aspects. This could be further analysed by testing more weighting methods, and the individual impact of each aspect.
Consistent with Hypothesis 2, no relationship is found between the alphas of the portfolios and the immateriality score (see Table 1). The relative importance of materiality over immateriality is also confirmed by the finding that the HMLI portfolios consistently achieve higher alphas than the LMHI and HMHI portfolios, although the difference is not always significant (see Table 3 and Appendix V). Additionally, the HMLI portfolio is not always the top performing portfolio, as this, similar to before, is sometimes the middle portfolios.
To conclude, with respect to score levels, the results support Hypotheses 1-3, though with varied strength. The message that this finding could express is that, in order to optimally use firm resources, firms should invest in material ESG issues over immaterial issues, as this has a larger influence on firm value. Besides that, fundamental analysts should focus their research on material ESG issues and incorporate this into their valuation. Further research is required to test the value that is found within the medium portfolios.
TABLE 1 – ALPHAS FOR PORTFOLIOS RANKED ON LEVEL SCORES
The values indicate monthly alpha’s (abnormal returns) in percentages. These are estimated using a factor model including global market, size, value, momentum, liquidity and quality factors. The score level portfolios are tested over the period 2005-2017. The score changes portfolios are tested over the period 2006-2017. Portfolio 5 indicates the best ranked portfolio. The portfolios are equal-weighted and rebalanced yearly in April. ***, **, and * indicate p-values of less than 1, 5 and 10% respectively. The 5M1 indicates the p-value of a t-test testing whether the excess returns of a portfolio long portfolio 5 and short portfolio 1 is different to zero.
A.. driverAverage level scores
1 2 3 4 5 5M1Total ESG alphas 0.1918* 0.2420** 0.2056* 0.2554** 0.2283* p = 0.0835
Materiality Alphas
0.1427 0.2171* 0.2753** 0.2605** 0.2161* p = 0.0387
Immateriality Alphas 0.2300** 0.1730 0.2495** 0.2677** 0.1965 p = 0.1624
B.. driverWeighted level scores
1 2 3 4 5 5M1Total ESG alphas
0.1918* 0.2420** 0.2056* 0.2554** 0.2283* p = 0.0835
Materiality Alphas 0.1467 0.2176* 0.2912*** 0.2363** 0.2215* p = 0.1124
Immateriality Alphas 0.2315** 0.2128** 0.2090* 0.2364** 0.2281* p = 0.1182
| Erasmus Platform for Sustainable Value Creation22

TABLE 2 – ANNUALIZED EXCESS RETURNS
This table shows the annualized excess returns and alphas over the period 2005-2017. Excess returns are the portfolio returns minus the ‘global’ risk-free rate, and is calculated without controlling for factors. Alpha’s indicate the annualized abnormal returns after
A: Excluding control of firm characteristics
Top Bottom Difference T-Test
Total ESG portfolios 10.21% 9.00% 1.21% p = 0.1949
Materiality portfolios 10.26% 8.26% 2.00% p = 0.0378
Immateriality portfolios 10.15% 9.11% 1.04% p = 0.3029
HMLI and LMHI portfolios 11.31% 9.69% 1.62% p = 0.3464
B: Including the control of firm characteristics
Top Bottom Difference T-Test
Total ESG portfolios 10.59% 8.80% 1.80% p = 0.0835
Materiality portfolios 10.48% 8.56% 1.92% p = 0.1124
Immateriality portfolios 10.50% 9.12% 1.38% p = 0.1182
HMLI and LMHI portfolios 10.10% 9.66% 0.43% p = 0.7800
C: Including the control of firm characteristics and factors
Top Bottom Difference T-Test
Total ESG portfolios: annualized alpha 2.77% 2.33% 0.45% p = 0.6784
Materiality portfolios: annualized alpha 2.69% 1.77% 0.92% p = 0.4226
Immateriality portfolios: annualized alpha 2.77% 2.81% -0.04% p = 0.9651
HMLI and LMHI portfolios: annualized alpha 3.33% 1.70% 1.62% p = 0.4261
| Erasmus Platform for Sustainable Value Creation23

controlling for the market, SMB, HML, MOM, LIQ and QLTY factors. The values have been calculated using an arithmetic mean . The 11
t-test results indicate the p-values of a two-tailed paired test of the excess returns for panel A and B. The panel C t-test indicates the significance of the alpha of a top-minus-bottom portfolio, which is also corrected for the factors.
TABLE 3 – PORTFOLIOS DOUBLE-SORTED ON MATERIALITY AND IMMATERIALITY SCORE LEVELS
The values indicate monthly alpha’s (abnormal returns) in percentages. These are estimated using a factor model including global market, size, value, momentum, liquidity and quality factors. These score level portfolios are tested over the period 2005-2017. Portfolio 5 indicates the best ranked portfolio. The portfolios are equal-weighted and rebalanced yearly in April. ***, **, and * indicate p-values of less than 1, 5 and 10% respectively. The 5M1 indicates the p-value of a t-test testing whether the excess returns of a portfolio long portfolio 5 and short portfolio 1 is different to zero. The p-value of the HMLI-LMHI portfolio is p = 0.7800.
ESG score changes
ESG score changes yield very different results. The relationship between materiality score and financial performance seems to have a U-shaped form in which both the top and bottom portfolios outperform in terms of abnormal risk-adjusted returns (see Table 4). Interestingly, the lowest portfolio outperformed the top portfolio for both the analyses using weighted aspect scores and average aspect scores.
The positive changes (top portfolio) support the proffered hypothesis (1). The negative changes (bottom portfolios), on the other hand, do not and need to be discussed in
Double-sorted portfolio
Immateriality score
1 2 3 4 5 5M1
1 LMLI: 0.1401 0.1009 0.0921 0.2374 LMHI: 0.1408
p = 0.5111
(0.2941) (0.4883) (0.5302) (0.1007) (0.2557)
2 0.2303 -0.0163 0.2234 0.2779* 0.3831**
p = 0.7120
(0.1374) (0.9083) (0.2026) (0.0721) (0.0206)
3 0.3333** 0.3125** 0.3222** 0.2963** 0.1988
p = 0.2558
(0.0146) (0.0303) (0.0273) (0.0439) (0.2158)
4 0.1684 0.1062 0.1589 0.5117*** 0.2592*
p = 0.8957
(232) (0.4986) (0.2579) (0.0005) (0.0954)
5 HMLI: 0.2731* 0.4267** 0.1638 0.0660 HMHI: 0.2098
p = 0.2491
(0.0854) (0.0061) (0.2802) (703) (0.2014)
5M1 p = 0.3104 p = 0.0984 p = 0.3128 p = 0.6966 p = 0.2424
The values have been based on an arithmetic average, as this is the standard within performance comparisons. However, the use of 11
geometric averages does not alter the conclusions.
| Erasmus Platform for Sustainable Value Creation24
Mat
eria
lity
sco
re

more detail. Different dynamics are seen here and these can possibly be related to the ‘risk-factor scenario’ and the ‘mispricing scenario’. Firstly, the ‘risk-factor scenario’ expects that the low-performing ESG firms will require higher abnormal returns from investors, as they have higher exposures to various risks, such as environmental risk, litigation risk, product risk or lower investor trust (Manescu, 2010). Relating this to our findings, it could be concluded that when firms make large negative jumps in their materiality score, investors perceive the firms as riskier and thus demand a higher return in the following year. As investors are risk-averse, it would imply that investors react more strongly to negative changes than to positive changes. This relationship might not be as strong for private or less transparent information, as a change in this information is not immediately picked up by investors. To some extent, this is also what has been discovered in the CA/SA segmentation (see Table 8 below), which is further explained in a following section. In the SA firm segment (widely-held information) the low-ranked portfolios outperformed, this is consistent with the ‘risk-factor scenario’ and with the risk-averseness of investors. Additionally, this relationship is found for both the materiality- and immateriality-ranked portfolios, which means that investors do not differentiate between the two as strongly. On the other hand, in the CA segment (less transparent information) the top-ranked materiality portfolios performed best. The reason for this could be that negative changes in the CA information might not become widely available and thus will not significantly affect the level of riskiness that the investors perceive. The outperformance of the firms with positive changes is consistent with the ‘mispricing scenario’, as investors do not value these positive changes correctly. This is similar to what is found in the score level results. Thus, the results that are found for CA firms support hypothesis 1, but the results for SA (and the combined results) do not.
Finally, it should be noted that the portfolio with large negative changes has a relatively negative exposure to the quality factor (Appendix VI). If one does not control for the quality factor, the abnormal returns of this portfolio disappear, because the quality factor has achieved positive returns over the 2005-2017 period. The implication of this is that, if one would invest in this portfolio, one would not achieve significant returns.
Another finding that stood out for the ESG changes, is that the top performing portfolio in terms of both materiality and immateriality consistently outperforms all other portfolios in the double-sorts by a significant amount (Table 5). This could indicate that for a time period of more than a year, firms that make exceedingly positive changes in both material as immaterial indicators can benefit from additional interest from investors. Reasons for this could be an improved image and brand awareness, which generally benefits firms for a longer period in time. As argued by Orlitzky et al. (2003), CSR reputation is one of the most important moderators of the ESG-financial performance relationship and such a reputation can be influenced by having an outstanding level of ESG momentum. This finding, thus, does not support Hypothesis 3 with respect to score changes. However, this finding could possibly be of use for quant strategies investing in ESG momentum.
| Erasmus Platform for Sustainable Value Creation25

TABLE 4 – ALPHAS FOR PORTFOLIOS RANKED ON SCORE CHANGES
The values indicate monthly alphas (abnormal returns) in percentages. These are estimated using a factor model including global market, size, value, momentum, liquidity and quality factors. The score level portfolios are tested over the period 2005-2017. The score changes portfolios are tested over the period 2006-2017. Portfolio 5 indicates the best ranked portfolio. The portfolios are equal-weighted and rebalanced yearly in April. ***, **, and * indicate p-values of less than 1, 5 and 10% respectively. The 5M1 indicates the p-value of a t-test testing whether the excess returns of a portfolio long portfolio 5 and short portfolio 1 is different to zero.
A.Average score changes
1 2 3 4 5 5M1Total ESG alphas 0.1968 0.2674** 0.2240* 0.2867** 0.1689 p = 0.5210
Materiality Alphas
0.2854** 0.2319** 0.1711 0.1617 0.2880** p = 0.1445
Immateriality Alphas 0.1363 0.2949** 0.2820** 0.2284** 0.2014 p = 0.3662
B.Weighted score changes
1 2 3 4 5 5M1Total ESG alphas
0.1968 0.2674** 0.2240* 0.2867** 0.1689 p = 0.5210
Materiality Alphas 0.3065** 0.2254* 0.2441** 0.1411 0.2359* p = 0.3292
Immateriality Alphas 0.1928 0.1755 0.3002** 0.2293* 0.2300* p = 0.6216
| Erasmus Platform for Sustainable Value Creation26

TABLE 5 – ALPHA’S OF DOUBLE-SORTED PORTFOLIOS ON MATERIALITY AND IMMATERIALITY SCORE CHANGES
The values indicate monthly alpha’s (abnormal returns) in percentages. These are estimated using a factor model including global market, size, value, momentum, liquidity and quality factors. These score changes portfolios are tested over the period 2006-2017. Portfolio 5 indicates the best ranked portfolio. The portfolios are equal-weighted and rebalanced yearly in April. ***, **, and * indicate p-values of less than 1, 5 and 10% respectively. The 5M1 indicates the p-value of a t-test testing whether the excess returns of a portfolio long portfolio 5 and short portfolio 1 is different to zero.
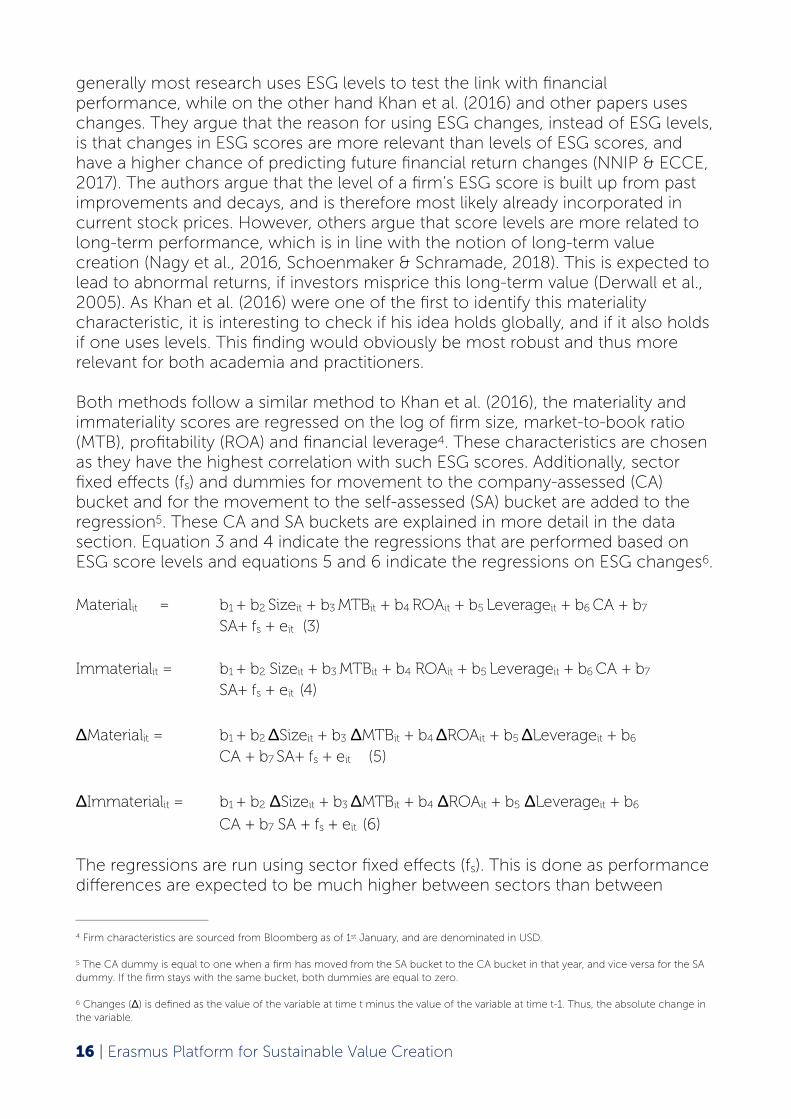
Pollutive and HCI industries
Regarding the pollutive industries, evidence is found that material ESG score levels have a stronger influence on performance than in the average industry, as especially the performance of the bottom portfolio is significantly lower (see Table 6). For the average industry we find that, although there is a difference between the excess returns of portfolio 5 and 1, this difference is not strongly significant (for the weighted scores). For the pollutive industries this is the case (p =0.0352). When basing the test on average, instead of weighted ESG scores, the results are even stronger. The top and bottom materiality portfolios have a larger difference in their alphas, and the 5M1 portfolio is also significant (p = 0.0315). Additionally, the difference between the HMLI and the LMHI is significant (p = 0.0861), as well as the difference between HMLI and LMLI (p = 0.0331). This can indicate that for the pollutive industries, the lowest ranked firms are hit harder in terms of financial
Double-sorted portfolio
Immateriality score
1 2 3 4 5 5M1
1 LMLI: 0.2484 0.3391** 0.2601 0.4669*** LMHI: 0.1998
p = 0.7397
(0.1433) (0.0401) (0.1057) (0.0056) (0.2319)
2 0.2082 0.2209 0.3745** 0.0908 0.2237
p = 0.5160
(0.1565) (0.1012) (0.0125) (0.5773) (0.2859)
3 0.3141** 219 0.2643 0.3171** 0.1112
p = 0.2350
(0.0249) (0.1611) (0.1291) (0.0209) (0.4753)
4 0.1871 0.0867 -0.0183 0.3331** 0.1398
p = 0.5118
(0.2686) (0.5662) (0.9147) (0.0368) (0.3541)
5 HMLI: -0.0091 0.2554* 0.0423 0.3598** HMHI: 0.5863***
p = 0.1820
(0.9556) (0.0965) (0.8007) (0.0242) (0.0032)
5M1 p = 0.8987 p = 0.7693 p = 0.6690 p = 0.4322 p = 0.1721
Mat
eria
lity
sco
re
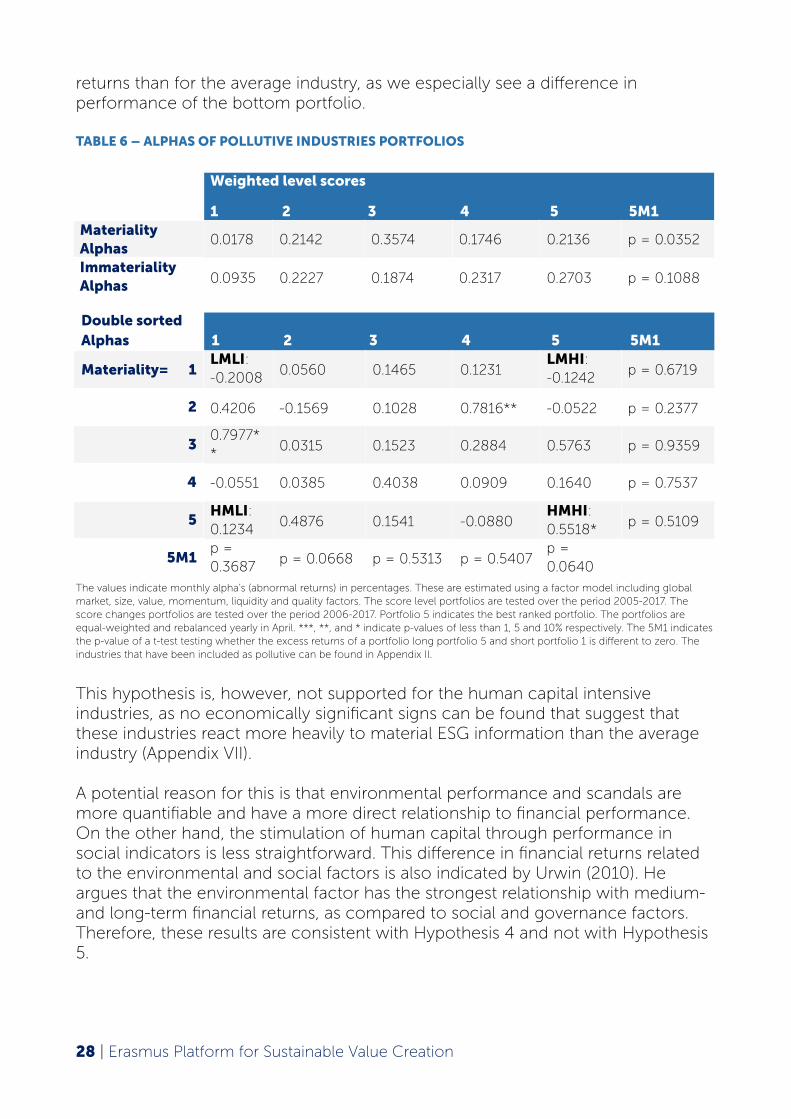
returns than for the average industry, as we especially see a difference in performance of the bottom portfolio.
TABLE 6 – ALPHAS OF POLLUTIVE INDUSTRIES PORTFOLIOS
The values indicate monthly alpha’s (abnormal returns) in percentages. These are estimated using a factor model including global market, size, value, momentum, liquidity and quality factors. The score level portfolios are tested over the period 2005-2017. The score changes portfolios are tested over the period 2006-2017. Portfolio 5 indicates the best ranked portfolio. The portfolios are equal-weighted and rebalanced yearly in April. ***, **, and * indicate p-values of less than 1, 5 and 10% respectively. The 5M1 indicates the p-value of a t-test testing whether the excess returns of a portfolio long portfolio 5 and short portfolio 1 is different to zero. The industries that have been included as pollutive can be found in Appendix II.
This hypothesis is, however, not supported for the human capital intensive industries, as no economically significant signs can be found that suggest that these industries react more heavily to material ESG information than the average industry (Appendix VII).
A potential reason for this is that environmental performance and scandals are more quantifiable and have a more direct relationship to financial performance. On the other hand, the stimulation of human capital through performance in social indicators is less straightforward. This difference in financial returns related to the environmental and social factors is also indicated by Urwin (2010). He argues that the environmental factor has the strongest relationship with medium- and long-term financial returns, as compared to social and governance factors. Therefore, these results are consistent with Hypothesis 4 and not with Hypothesis 5.
| Erasmus Platform for Sustainable Value Creation28
Double sorted Alphas 1 2 3 4 5 5M1
Materiality= 1LMLI: -0.2008
0.0560 0.1465 0.1231LMHI: -0.1242
p = 0.6719
2 0.4206 -0.1569 0.1028 0.7816** -0.0522 p = 0.2377
30.7977**
0.0315 0.1523 0.2884 0.5763 p = 0.9359
4 -0.0551 0.0385 0.4038 0.0909 0.1640 p = 0.7537
5HMLI: 0.1234
0.4876 0.1541 -0.0880HMHI: 0.5518*
p = 0.5109
5M1p = 0.3687
p = 0.0668 p = 0.5313 p = 0.5407p = 0.0640
Weighted level scores
1 2 3 4 5 5M1Materiality Alphas
0.0178 0.2142 0.3574 0.1746 0.2136 p = 0.0352
Immateriality Alphas 0.0935 0.2227 0.1874 0.2317 0.2703 p = 0.1088

Private and public information 12
When considering score levels, the more detailed and less transparent ESG information that makes up the CA company scores seems to have a better predictive power, as a clear difference is found between the dynamics of CA and SA companies. This can be found in Table 7. Considering the materiality alphas, it can be seen that the lowest performing portfolio (1) has a much lower alpha in the CA firms compared to SA firms. The difference in excess returns between portfolio 1 and the others is significant for portfolio 3 (p = 0.019), 4 (p = 0.056) and 5 (p = 0.038). The same holds for the second lowest ranked portfolio. Additionally, these alpha’s of the low portfolios are much lower than for the average industries. On the other hand, the top portfolio does not receive significantly higher returns. For the SA firms these trends are not visible. A potential reason for this differential on the negative side is that SA firm scores have only been based on widely-held public information, and thus there is a larger possibility that negative information has not been reported and therefore not integrated in the score. This has the effect that some firms, which actually should be placed into a lower portfolio, are put into a higher portfolio. Therefore, the relationship between the scores and financial performance of SA firms is weaker, because the scores likely show a less accurate picture of the firm, as compared to the CA firms. Thus, this result supports Hypothesis 6 for score levels. Regarding score changes, the hypothesis has not been supported (see Table 8). Instead, it is found that the lowest two portfolios of the SA firms have much higher alphas, whereas the top portfolio of the CA firms (insignificantly) outperforms [the SA firms]. As explained above, this insight that large negative changes in public information can increase the perceived risk of the firms is interesting and should be further investigated. RobecoSAM’s dataset provides a unique opportunity to test this difference and thus should be analysed more thoroughly in future research.
TABLE 7 – PORTFOLIO ALPHAS FOR CA AND SA FIRMS FOR SCORE LEVELS
In this section private information refers to the relatively less transparent and less publicly available ESG information, relative to 12
widely-held public information, such as information that is published in ESG reports.
| Erasmus Platform for Sustainable Value Creation29
Company-assessed (private + public)
1 2 3 4 5 5M1Materiality Alphas 0.0493 0.0626 0.2780** 0.3195** 0.1948 p = 0.0381
Immateriality Alphas
0.1181 0.1751 0.1153 0.2265* 0.2542 p = 0.0027
Self-assessed (public)
1 2 3 4 5 5M1Materiality Alphas 0.1403 0.3308** 0.3080** 0.2296* 0.2493 p = 0.1518
Immateriality Alphas
0.2056 0.2473* 0.2921** 0.2332 0.2665* p = 0.1185

The values indicate monthly alpha’s (abnormal returns) in percentages. These are estimated using a factor model including global market, size, value, momentum, liquidity and quality factors. The score level portfolios are tested over the period 2005-2017. The score changes portfolios are tested over the period 2006-2017. Portfolio 5 indicates the best ranked portfolio. The portfolios are equal-weighted and rebalanced yearly in April. ***, **, and * indicate p-values of less than 1, 5 and 10% respectively. The 5M1 indicates the p-value of a t-test testing whether the excess returns of a portfolio long portfolio 5 and short portfolio 1 is different to zero.
TABLE 8 - PORTFOLIO ALPHAS FOR CA AND SA FIRMS FOR SCORE CHANGES
The values indicate monthly alpha’s (abnormal returns) in percentages. These are estimated using a factor model including global market, size, value, momentum, liquidity and quality factors. The score level portfolios are tested over the period 2005-2017. The score changes portfolios are tested over the period 2006-2017. Portfolio 5 indicates the best ranked portfolio. The portfolios are equal-weighted and rebalanced yearly in April. ***, **, and * indicate p-values of less than 1, 5 and 10% respectively. The 5M1 indicates the p-value of a t-test testing whether the excess returns of a portfolio long portfolio 5 and short portfolio 1 is different to zero.
The quality factor
Various factor models are tested in order to assess the influence of multiple risk factors on ESG portfolio performance and assess the robustness to these models (see Appendix VIII and IX. A few interesting things came to light, mainly relating to the quality factor. As discussed before, the firms with the largest negative changes have outperformed other portfolios and have achieved high alphas. In Appendix IX, it can be seen that after adding quality to the Fama-French (1993) three factor model plus momentum, the alphas of the portfolios increase by a large amount, especially for the lowest portfolio. The difference is that this portfolio has a very large negative coefficient on the quality factor. This implies that this portfolio is made up of relatively more ‘junk’ stocks. After controlling for quality, it seems as if these firms are performing well, however it does mean that the firms that make up this portfolio usually make a much lower return due to their low quality. This is because the quality factor has achieved high positive returns over the period 2005-2017.
This finding is very important when comparing our results to those of Khan et al. (2016), as the authors have chosen to exclude the quality factor. Indeed, when the quality factor is excluded, our results are in line with that of the Khan et al. paper. It thus seems that the relationship that the authors have found might be caused by the relative exposures these portfolios have to the quality factor.
| Erasmus Platform for Sustainable Value Creation30
Company-assessed (private + public)
1 2 3 4 5 5M1Materiality Alphas 0.1484 0.0394 0.2032* 0.0609 0.2546* p = 0.2600
Immateriality Alphas
0.0621 0.0935 0.2426** 0.1755 0.1268 p = 0.7922
Self-assessed (public)
1 2 3 4 5 5M1Materiality Alphas 0.1484 0.0394 0.2032* 0.0609 0.2546* p = 0.2600
Immateriality Alphas
0.0621 0.0935 0.2426** 0.1755 0.1268 p = 0.7922

When considering the portfolios formed on materiality score levels, we continue to see the importance of the quality factor, as well as the momentum factor. This is seen by the fact that after adding these factors to the model, the excess returns of the portfolios change significantly. However, compared to the score changes portfolios, the differences in factors loadings between the top and the bottom portfolios are not as substantial. Therefore, the quality of a firms is found to be related particularly to changes in material ESG factors, not to their overall level nor to the changes in immaterial factors.
| Erasmus Platform for Sustainable Value Creation31

Despite that there are some interesting differences in the results of Khan et al. (2016) and this paper, the main take away is the same: within the field of ESG the concept of materiality is important and should be considered by investors, asset managers and firms. Materiality is shown to improve predictions of financial performance in comparison to total ESG scores or immateriality scores. This finding has been particularly true for score levels, as opposed to ESG changes, which is in line with the long-term value creation aspect of ESG performance. Score levels are argued to be a more accurate predictor of longer-term firm performance, whereas score changes are driven by short-term events and thus have a larger impact on short-term performance (Nagy et al., 2016).
This also supports the hypothesis that long-term material ESG issues are currently mispriced by investors. Therefore, by having a more qualitative integration of material ESG information in the valuation process, one can benefit from this mispricing. As not all ESG information is currently transparently available, the quality of the information is generally low and the number of fundamental analysts that use this information is small, this mispricing is expected to continue for a longer period as the markets slowly adapt (Lo, 2017). The conclusions with respect to material ESG score changes possibly indicate that investors respond differently to negative changes in public information. It seems as if investors increase the perceived risk level for firms with large negative changes, and consequently require higher returns. This thus led to risk-adjusted outperformance by these firms. However, due to the low quality of the stocks in this portfolio, investors are unable to reap benefits from this strategy. Changes in material ESG scores are also argued to be a proxy for similar aspects of a firm that the quality factor indicates.
An important finding is that the impact of ESG materiality differs depending on the industry and the type of information. Pollutive industries are found to be affected more significantly by their material ESG performance. Therefore, industry specific adjustments should be made when assessing the impact of ESG performance on a firm’s valuation.
For both score levels and score changes, the immateriality scores were unable to differentiate the top and bottom portfolios in terms of performance. Therefore, although the discovered relationships between ESG and financial performance have not indicated linearity as initially suggested, materiality is proven to be a valuable distinction to make within ESG research.
These results have implications for both professional investors and firms. As materiality scores are shown to be more relevant to stock performance than immateriality scores, it is important that fundamental analysts continue to focus
5 Conclusions and implications
| Erasmus Platform for Sustainable Value Creation32

on the issues that are material to the specific industry that the firm belongs to. This incorporation of material issues is particularly important for firms that belong to pollutive industries. Within this analysis, low scores should be weighted more heavily, as it has been found that the valuations of the lowest ranked firms are hit relatively more than the firms with a strong positive ESG performance. Score levels are found to be more relevant and have led to more consistent results than score changes. This supports the notion of long-term value creation, which is a fundamental belief of long-term investments strategies, as held by Robeco.
Finally, this paper confirms that the information that companies provide in the company sustainability assessment questionnaire is more relevant as a predictor of financial returns than widely available public information. Therefore, the questionnaire is able to add value as it can reveal important ESG information before it is published, for instance in ESG reports. Also, this will allow these topics to come to light earlier and be discussed between the firm and its investors, in order to make progress. Firms are suggested to implement the conclusions of this study by making more strategic ESG investments into the industry-specific material ESG issues, as opposed to general or immaterial issues. This is particularly important when the firms currently belong to the bottom end in terms of material ESG score performance. Moving away from this segment has the largest impact on financial returns.
| Erasmus Platform for Sustainable Value Creation33

Asness, C.S., Frazzini, A. & Pedersen L.H. (2013). Quality Minus Junk. Working paper, AQR Capital Management.
Bhattacharya, C. B., & Sen, S. (2003). Consumer-company identification: A framework for understanding consumers’ relationships with companies. Journal of marketing, 67(2), 76-88.
Barnett, M. L. (2007). Stakeholder influence capacity and the variability of financial returns to corporate social responsibility. Academy of Management Review, 32(3), 794–816.
Blitz, D., & Fabozzi, F. J. (2017). Sin Stocks Revisited: Resolving the Sin Stock Anomaly. Journal of Portfolio Management, 44(1), 105-111.
Brundtland, G. H. (1987). Report of the World Commission on Environment and Development: Our Common Future. United Nations.
Carhart, M. M. (1997). On persistence in mutual fund performance. The Journal of Finance, 52(1), 57-82.
Davis, B., Balkissoon, K., & Heaps, T. (2017). Performance and Impact: Can ESG Equity Portfolios Generate Healthier Financial Returns? Journal of Environmental Investing, 8(1), 252-272.
Derwall, J., Guenster, N., Bauer, R., & Koedijk, K. (2005). The eco-efficiency premium puzzle. Financial Analysts Journal, 61(2), 51-63.
Donaldson, T. and L. E. Preston. (1995). The Stakeholder Theory of the Corporation: Concepts, Evidence, and Implications. Academy of Management Review 20(1), 65–91.
Eccles, R. G., Krzus, M. P., Rogers, J., & Serafeim, G. (2012). The need for sector-specific materiality and sustainability reporting standards. Journal of Applied Corporate Finance, 24(2), 65-71.
Eccles, R. G., Ioannou, I., & Serafeim, G. (2014). The impact of corporate sustainability on organizational processes and performance. Management Science, 60(11), 2835-2857.
Fama, E. F., & French, K. R. (1992). The cross-section of expected stock returns. The Journal of Finance, 47(2), 427-465.
Fama, E. F., & French, K. R. (1993). Common risk factors in the returns on stocks and bonds. Journal of Financial Economics, 33(1), 3-56.
6 References
| Erasmus Platform for Sustainable Value Creation34

Finnerty, J. E. (1976). Insiders and market efficiency. The Journal of Finance, 31(4), 1141-1148.
Fombrun, C., and Shanley, M. (1990). What’s in a name? Reputation building and corporate strategy. Academy of Management Journal, 33 (1), 233–258.
Freeman, R.E. (1984). Strategic management: A stakeholder perspective. Englewood Cliffs, NJ: Prentice-Hall.
Freeman, R.E., Harrison, J.S., Wicks, A.C., Parmar, B.L., de Colle, S. (2010). Stakeholder Theory: The State of the Art. Cambridge University Press: Cambridge, UK.
Friede, G., Busch, T., & Bassen, A. (2015). ESG and financial performance: aggregated evidence from more than 2000 empirical studies. Journal of Sustainable Finance & Investment, 5(4), 210-233.
Friedman, M. (1970). The social responsibility of business is to increase its profits. New York Times Magazine 32(33):122–126.
Giese, G., Ossen, A., & Bacon, S. (2016). ESG as a Performance Factor for Smart Beta Indexes. The Journal of Index Investing, 7(3), 7-20.
GRI (2016). Defining What Matters: Do companies and Investors Agree On What Is Material? Retrieved from: https://www.globalreporting.org/resourcelibrary/GRI-DefiningMateriality2016.pdf
Jensen, M. C. (2001). Value maximization, stakeholder theory, and the corporate objective function. Journal of Applied Corporate Finance, 14(3), 8–21.
Jones, T. (1995). Instrumental stakeholder theory: A synthesis of ethics and economics. Academy of Management Review, 20: 404-437.
Khan, M., Serafeim, G., & Yoon, A. (2016). Corporate sustainability: First evidence on materiality. The accounting review, 91(6), 1697-1724.
Konar, S., & Cohen, M. A. (2001). Does the market value environmental performance? Review of economics and statistics, 83(2), 281-289.
Lo, S. F., & Sheu, H. J. (2007). Is corporate sustainability a value-increasing strategy for business? Corporate Governance: An International Review, 15(2), 345-358.
Lo, A. (2017). Adaptive Markets: Financial Evolution at the Speed of Thought. Princeton University Press: Princeton.
Luo, X., & Bhattacharya, C. B. (2006). Corporate social responsibility, customer satisfaction, and market value. Journal of marketing, 70(4), 1-18.
Mǎnescu, C. (2011). Stock returns in relation to environmental, social and governance performance: Mispricing or compensation for risk?. Sustainable development, 19(2), 95-118.
| Erasmus Platform for Sustainable Value Creation35

Melas, D., Nagy, Z., & Kulkarni, P. (2018). Factor investing and ESG integration. In Factor Investing (pp. 389-413).
McGuire, J.B.., Sundgren, A., & Schneeweis, T. (1988). Corporate social responsibility and firm financial performance. Academy of Management Journal, 3/(4), 854-87.
Morningstar (2018). Sustainable Funds US Landscape Report. Retrieved from: http://www.morningstar.com/content/dam/morningstar-corporate/pdfs/Research/Sustainable_Funds_Landscape.pdf
NBIM (2015). The Quality Factor. Retrieved from: https://www.nbim.no/contentassets/0660d8c611f94980ab0d33930cb2534e/nbim_discussionnotes_3-15.pdf
NN Investment Partners, ECCE (2017). The materiality of ESG factors for equity investment decisions: academic evidence.
Nagy, Z., Kassam, A., & Lee, L. E. (2016). Can ESG Add Alpha? An Analysis of ESG Tilt and Momentum Strategies. The Journal of Investing, 25(2), 113-124.
Pástor, Ľ., & Stambaugh, R. F. (2003). Liquidity risk and expected stock returns. Journal of Political economy, 111(3), 642-685.
Perrini, F., Russo, A., Tencati, A., & Vurro, C. (2011). Deconstructing the relationship between corporate social and financial performance. Journal of Business Ethics, 102(1), 59-76.
Pictet (2018). A Secular Outlook: learn to love risk. Retrieved from: https://www.am.pictet/en/belgium/global-articles/2018/market-views/secular-outlook
Orlitzky, M., Schmidt, F. L., & Rynes, S. L. (2003). Corporate social and financial performance: A meta-analysis. Organization studies, 24(3), 403-441.
Robeco (2017). The Quality Factor. Retrieved from: https://www.robeco.com/en/insights/2017/07/the-quality-factor.html
Robeco (2018). First-rate ESG integration across asset classes. Retrieved from: https://www.robeco.com/en/key-strengths/sustainability-investing/
RobecoSAM (2015). Smart ESG Integration: Factoring in Sustainability. Retrieved from: http://www.robecosam.com/images/Smart_ESG_integration_factoring_in_sustainability.pdf
RobecoSAM (2017). Measuring Intangibles: RobecoSAM’s Corporate sustainability assessment methodology. Retrieved from: http://www.robecosam.com/images/Measuring_Intangibles_CSA_methodology.pdf
RobecoSAM (2018). Focus on Financial Materiality. Retrieved from: http://www.robecosam.com/en/sustainability-insights/about-sustainability/financial-materiality.jsp Russo, M. V., & Fouts, P. A. (1997). A resource-based perspective on corporate environmental performance and profitability. Academy of Management Journal, 40: 534-559.
| Erasmus Platform for Sustainable Value Creation36

Schoenmaker, D. (2018). A Framework for Sustainable Finance. CEPR Discussion Paper, DP12603.
Schoenmaker, D., & Schramade, W. (2018). Investing for Long-Term Value Creation. Working Paper.
Schramade, W. (2016). Integrating ESG into valuation models and investment decisions: the value-driver adjustment approach. Journal of Sustainable Finance & Investment, 6(2), 95-111.
Scherer, A. G., & Palazzo, G. (2011). The new political role of business in a globalized world: A review of a new perspective on CSR and its implications for the firm, governance, and democracy. Journal of Management Studies, 48(4), 899–931.
Urwin, R. (2010). Allocations to Sustainable Investing. Towers Watson Technical Paper No. 1656955. Retrieved from: https://ssrn.com/abstract=1656955
| Erasmus Platform for Sustainable Value Creation37

APPENDIX I - EXAMPLE OF LINKING INDUSTRY MATERIALITY MATRIX TO COMPANY SCORES PHARMACEUTICAL INDUSTRY MATERIALITY ANALYSIS 13
7 Appendices
Company Level IndicatorsRobeco Material Industry Issues
SASB Material Industry Issues
Economic Dimension
Codes of Business Conduct Business Ethics (1) Business Ethics and Transparency of Payments
Corporate Governance Corporate Governance -
Impact Measurement & Valuation - -
Innovation Management Innovation Management -
Marketing PracticesBusiness Ethics (2) / customer relationship management Fair Marketing and Advertising
Materiality - -
Policy Influence - -
Product Quality and Recall Man. Product Quality & Safety Customer Welfare/Product Quality and Safety
Risk & Crisis Management -
Supply Chain Management Supply Chain Management Supply Chain Management
Tax Strategy
Source: RobecoSAM (2018). Retrieved from: http://www.robecosam.com/en/sustainability-insights/about-sustainability/financial-13
materiality.jsp
| Erasmus Platform for Sustainable Value Creation38

Notes: Bold issues are seen as having most impact and are thus defined as material in this study; Cash & capital management is not covered within the available Indicators
Environmental Dimension
Climate Strategy -Lifecycle Impacts of Products and Services
Environmental Policy & Management Systems
Environmental Management & Product Stewardship
Water and wastewater Mgmt/ Energy Mgmt /Waste and Hazardous Materials Mgmt
Environmental Reporting - -
Operational Eco-Efficiency - -
Social Dimension
Addressing Cost Burden Market Access Strategy (1) -
Corporate Citizenship and Philanthropy
- -
Health Outcome ContributionMarket Access Strategy (2) / customer relationship management
-
Human Capital Development Human Capital Management (1) -
Human Rights - Human rights and community
Labor Practice Indicators - -
Occupational Health and Safety -Employee Health, Safety and Wellbeing
Social Reporting - -
Strategy to Improve Access to Drugs or Products
Strategy to improve access to healthcare
Access and Affordability
Talent Attraction & RetentionHuman Capital Management (2)
Recruitment, Development and Retention
| Erasmus Platform for Sustainable Value Creation39
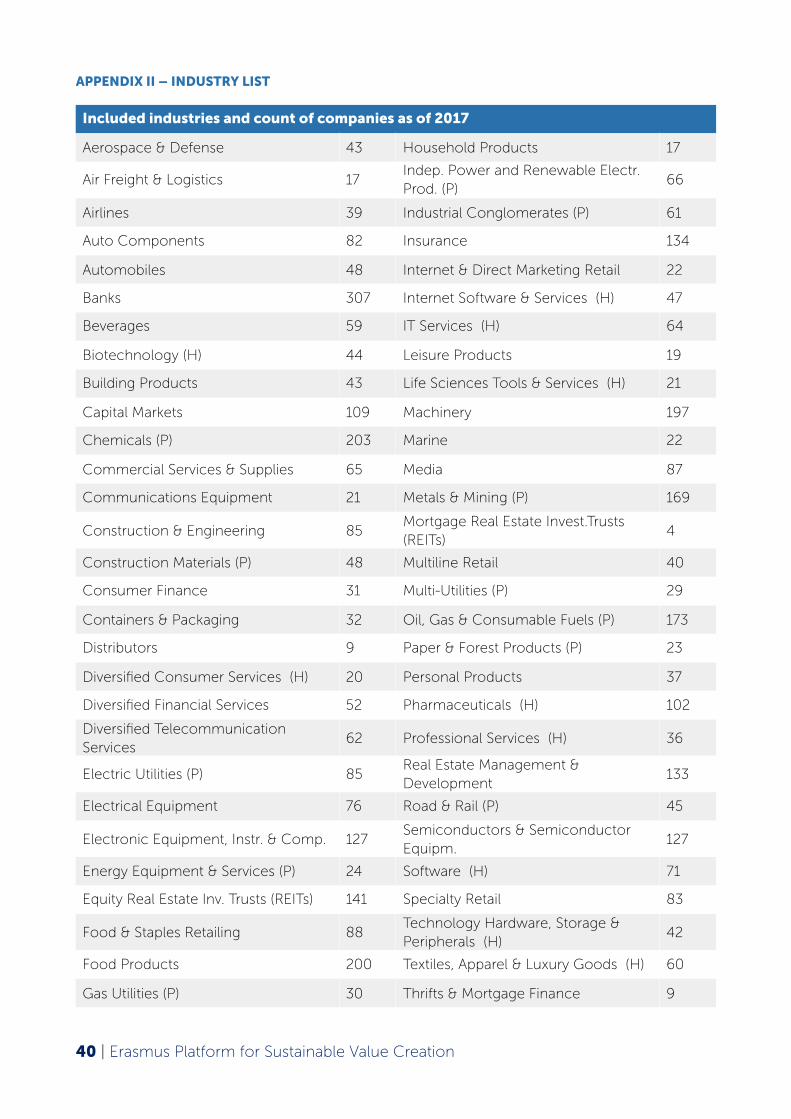
APPENDIX II – INDUSTRY LIST
Included industries and count of companies as of 2017
Aerospace & Defense 43 Household Products 17
Air Freight & Logistics 17Indep. Power and Renewable Electr. Prod. (P)
66
Airlines 39 Industrial Conglomerates (P) 61
Auto Components 82 Insurance 134
Automobiles 48 Internet & Direct Marketing Retail 22
Banks 307 Internet Software & Services (H) 47
Beverages 59 IT Services (H) 64
Biotechnology (H) 44 Leisure Products 19
Building Products 43 Life Sciences Tools & Services (H) 21
Capital Markets 109 Machinery 197
Chemicals (P) 203 Marine 22
Commercial Services & Supplies 65 Media 87
Communications Equipment 21 Metals & Mining (P) 169
Construction & Engineering 85Mortgage Real Estate Invest.Trusts (REITs)
4
Construction Materials (P) 48 Multiline Retail 40
Consumer Finance 31 Multi-Utilities (P) 29
Containers & Packaging 32 Oil, Gas & Consumable Fuels (P) 173
Distributors 9 Paper & Forest Products (P) 23
Diversified Consumer Services (H) 20 Personal Products 37
Diversified Financial Services 52 Pharmaceuticals (H) 102
Diversified Telecommunication Services
62 Professional Services (H) 36
Electric Utilities (P) 85Real Estate Management & Development
133
Electrical Equipment 76 Road & Rail (P) 45
Electronic Equipment, Instr. & Comp. 127Semiconductors & Semiconductor Equipm.
127
Energy Equipment & Services (P) 24 Software (H) 71
Equity Real Estate Inv. Trusts (REITs) 141 Specialty Retail 83
Food & Staples Retailing 88Technology Hardware, Storage & Peripherals (H)
42
Food Products 200 Textiles, Apparel & Luxury Goods (H) 60
Gas Utilities (P) 30 Thrifts & Mortgage Finance 9
| Erasmus Platform for Sustainable Value Creation40

P indicates that the industry has been included as a ‘pollutive’ industry. H indicates that the industry has been included as a ‘Human Capital Intensive’ industry.
APPENDIX III – DATASET REGIONAL SPLIT AND COUNT PER YEAR
The table indicates the arithmetic mean and standard deviation of various variables.
CORRELATION MATRIX
Health Care Equipment & Supplies 79 Tobacco 13
Health Care Providers & Services (H) 72 Trading Companies & Distributors 48
Health Care Technology (H) 13 Transportation Infrastructure 46
Hotels, Restaurants & Leisure (H) 94 Water Utilities 29
Household Durables 58 Wireless Telecommunication Services 40
Summary statistics Mean STD
Average materiality score 48.6890 16.3766
Average immateriality score 48.2655 16.0646
Weighted materiality score 48.9057 15.8741
Weighted immateriality score 48.4038 15.7646
Size (Ln) 3.7211 0.7241
Price-to-Book 3.4646 17.8104
Return-on-assets (Yearly, %) 5.3118 8.6643
Leverage (Debt-to-assets, %) 24.7600 18.2019
Returns (Monthly, %) 1.1678 17.4939
Av. Mat.
Av. Immat.
Weigh. Mat
Weigh. Immat.
Size PTB ROALeverage
Av. Mat. 1.0000
Av. Immat.
0.5578 1.0000
Weigh. Mat
0.9615 0.5625 1.0000
Weigh. Immat.
0.5768 0.9730 0.5818 1.0000
Size 0.1252 0.1419 0.1305 0.1498 1.0000
PTB -0.0010 -0.0039 -0.0004 -0.0030 0.0239 1.0000
ROA -0.0021 -0.0226 0.0020 -0.0201 -0.0226 0.1249 1.0000
Leverage -0.0210 0.0240 -0.0266 0.0223 0.0240 0.0385 -0.1856 1.0000
| Erasmus Platform for Sustainable Value Creation41

The values indicate the pairwise correlations between the various data points. These data points are on a yearly basis. Size indicates the log of market capitalization. PTB is the price-to-book ratio, ROA is the return-on-assets (%) and leverage is the debt-to-assets (%).
APPENDIX IV – DATASET REGIONAL SPLIT AND COUNT PER YEAR
NUMBER OF FIRMS IN THE DATASET PER YEAR
Years denoted with * are not included in the dataset
APPENDIX V– PORTFOLIO ABNORMAL RETURNS BASED ON AVERAGE SCORE LEVEL
The values indicate monthly alpha’s (abnormal returns) in percentages. These are estimated using a factor model including global market, size, value, momentum, liquidity and quality factors. The values in parentheses indicate the p-values of these coefficients. The score level portfolios are tested over the period 2005-2017. Portfolio 5 indicates the best ranked portfolio. The portfolios are equal-weighted and rebalanced yearly in April. ***, **, and * indicate p-values of less than 1, 5 and 10% respectively. The double-sorting is done in an unconditional manner, thus each portfolio consists of approximately the same number of firms.
RegionTotal number of unique firm-years
Percentage split
Americas (US & Canada) 8174 28%
Europe 6586 23%
Asia-Pacific 8413 29%
2002* 456 2006 1164 2010 1942 2014 2726
2003* 588 2007 1203 2011 2200 2015 3693
2004* 1006 2008 1304 2012 2510 2016 3923
2005 1074 2009 2080 2013 2756 2017 4632
Double-sorted portfolio
Immateriality score
1 2 3 4 5
1 LMLI: 0.1277 0.0739 0.1770 0.0618 LMHI:0.2351*
(0.3142) (0.6722) (0.2099) (0.6637) (0.0912)
2 0.1421 0.0491 0.2817* 0.2948** 0.3131**
(0.3796) (0.7434) (0.0513) (0.0346) (0.0423)
3 0.4127*** 0.0947 0.3972*** 0.1735** 0.2843*
(0.0089) (0.4972) (0.0053) (308) (0.0551)
4 0.1797 0.4016 0.1823 0.3327 0.1951
(0.2032) (18) (0.2739) (0.0302) (0.1767)
5 HMLI:0.3934** 0.1549* 0.2801* -0.0241 HMHI:0.2476
(0.0191) (0.2620) (0.0652) (0.8782) (0.1489)
| Erasmus Platform for Sustainable Value Creation42
Mat
eria
lity
sco
re

APPENDIX VI– PORTFOLIO ABNORMAL RETURNS AND COEFFICIENTS BASED ON ESG SCORE CHANGES
Alpha indicates monthly alpha’s (abnormal returns) in percentages. The other non-italic values indicate the regression coefficients of the factors. These are estimated using a Fama-French style factor model including global market, size, value, momentum, liquidity and quality factors. The italic values indicate the p-values. These score changes portfolios are tested over the period 2006-2017. Portfolio 5 indicates the best ranked portfolio. The portfolios are equal-weighted and rebalanced yearly in April. ***, **, and * indicate p-value of less than 1, 5 and 10% respectively. In this test, beta is compared to zero. However, in order to draw effective conclusions from beta, one would have to compare beta to 1. Though this is not relevant for this paper.
Materiality score
Portfolio 1 2 3 4 5
Alpha0.3065** 0.2254* 0.2441** 0.1411 0.2359*
(11) (0.0623) (0.0199) (0.2385) (0.0625)
Beta0.9996*** 1.0338*** 1.0338*** 1.0410*** 1.0736***
0 0 0 0 0
SMB0.1145 0.1730** 0.2005*** 0.2186*** 0.2198***
(147) (0.0306) (4) (0.0063) (9)
HML-0.1639** -0.1040 -0.0226 -0.0744 -0.0432
(0.0225) (0.1487) (0.7156) (0.2981) (0.5658)
MOM-0.1136*** -0.1930*** -0.1273*** -0.1555*** -0.1548***
(0.0011) 0 0 0 0
LIQ-0.0303 -0.0448 -0.0064 -0.0127 0.0102
(0.2977) (128) (0.8001) (0.6617) (0.7405)
QLTY-0.2886*** -0.1566 -0.0924 -0.0809 -0.0698
(0.0048) (0.1257) (0.2946) (0.4249) (0.5128)
| Erasmus Platform for Sustainable Value Creation43

Alpha indicates monthly alpha’s (abnormal returns) in percentages. The other non-italic values indicate the regression coefficients of the factors. These are estimated using a Fama-French style factor model including global market, size, value, momentum, liquidity and quality factors. The italic values indicate the p-values. These score changes portfolios are tested over the period 2006-2017. Portfolio 5 indicates the best ranked portfolio. The portfolios are equal-weighted and rebalanced yearly in April. ***, **, and * indicate p-value of less than 1, 5 and 10% respectively. In this test, beta is compared to zero. However, in order to draw effective conclusions from beta, one would have to compare beta to 1. Though this is not relevant for this paper.
Immateriality score
Portfolio 1 2 3 4 5
Alpha0.1928 0.1755 0.3002** 0.2293* 0.2300*
(0.1076) (0.1177) (0.0109) (0.0541) (0.0573)
Beta1.049*** 1.0333*** 1.029*** 1.0397*** 1.042***
0 0 0 0 0
SMB0.1834** 0.2259*** 0.2179*** 0.1577** 0.1548*
(0.0211) (0.0026) (0.0053) -45 (0.0527)
HML-0.0949 -0.0954 -0.1022 -0.0681 -0.0423
(0.1845) -154 (0.1436) (0.3355) -556
MOM-0.1251*** -0.1718*** -0.1581*** -0.1978*** -0.0907***
(0.0004) 0 0 0 (0.0094)
LIQ-0.0067 -0.0402 -0.0144 -0.0332 0.0075
(0.8183) (0.1419) (0.6131) (0.2501) (0.7982)
QLTY-0.1217 -0.1353 -0.1705* -0.0978 -0.1428
(0.2299) (0.1544) -86 (0.3302) (0.1626)
| Erasmus Platform for Sustainable Value Creation44

APPENDIX VII – ALPHAS OF HCI INDUSTRIES PORTFOLIOS
Level scores
1 2 3 4 5 5M1
Materiality alphas
0.3270** 0.5751*** 0.4818*** 0.6430*** 0.4950*** p = 0.2749
Immateriality alphas
0.5870*** 0.4844*** 0.4689*** 0.4945*** 0.4215*** p = 0.6718
Double sorted alphas 1 2 3 4 5 5M1
Materiality 1 -0.0616 0.2846 0.7524 0.1197 0.3979 p = 0.5392
2 0.4404 0.7113** 0.2808 0.3569 0.8602***p = 0.6695
3 0.1170 0.5064 0.5139 0.8167** 0.3410 p = 0.7047
4 0.6213* 0.6885** 0.3775 0.4357 0.9596***p = 0.0955
5 0.5386** 0.5458 0.8051*** 0.2415 0.1570p = 0.3035
5M1 0.2010 0.2524 0.4195 0.9782 0.5861
Score changes
1 2 3 4 5 5M1
Materiality alphas
0.6585*** 0.3597*** 0.6767*** 0.4811*** 0.4854*** p = 0.9353
Immateriality alphas
0.2045 0.6427*** 0.6622*** 0.6387*** 0.5638*** p = 0.0791
Double sorted alphas 1 2 3 4 5 5M1
Materiality 1 0.3150 0.5729 1.0024*** 0.6911* 0.6565** p = 0.7845
2 0.6467 0.1193 0.8824*** 0.6356* -0.5635 p = 0.1459
3 0.3861 0.6797 0.8856*** 0.9556** 0.5777 p = 0.7700
4 0.7480** 0.3559 0.3090 0.3636 0.3390 p = 0.9748
| Erasmus Platform for Sustainable Value Creation45

The values indicate monthly alpha’s (abnormal returns) in percentages. These are estimated using a factor model including global market, size, value, momentum, liquidity and quality factors. The score level portfolios are tested over the period 2005-2017. The score changes portfolios are tested over the period 2006-2017. Portfolio 5 indicates the best ranked portfolio. The portfolios are equal-weighted and rebalanced yearly in April. ***, **, and * indicate p-values of less than 1, 5 and 10% respectively. The 5M1 indicates the p-value of a t-test testing whether the excess returns of a portfolio long portfolio 5 and short portfolio 1 is different to zero. The industries that have been included as HCI can be found in Appendix II.
5 -0.0803 0.5792* 0.3507 0.8817** 0.6515** p = 0.2461
5M1 p = 0.2010 p = 0.4267 p = 0.9511 p = 0.7085 p = 0.7707
| Erasmus Platform for Sustainable Value Creation46

APPENDIX VIII – FACTOR MODEL SPECIFICATIONS AND COEFFICIENTS SCORE LEVELS
Fama-French 3-factor model + MOM + LIQ + QLTY Fama-French 3-factor model + MOM + LIQ+ QLTY
Alpha 0.1467 0.2176*0.2912***
0.2363**
0.2215** 0.2315**0.2128**
0.209* 0.2364*0.2281**
Beta0.9885***
1.0329***
1.0165***
1.0879***
1.1203***
1.0179***
1.0431***
1.0379***
1.0608***
1.0907***
| Erasmus Platform for Sustainable Value Creation47
Fama-French 3-factor model + MOM Fama-French 3-factor model + MOM
Alpha 0.0583 0.0734 0.1868* 0.1533 0.1451 0.0674 0.1351 0.1090 0.1746* 0.1306
Beta1.0112***
1.0841***
1.0711***
1.1214***
1.1484***
1.0866***
1.0730***
1.0828***
1.0699***
1.1295***
SMB0.3038***
0.2916***
0.3179***
0.2624***
0.2575***
0.2792***
0.3107***
0.3102***
0.2939***
0.2306***
HML-0.0633
-0.0839 -0.1139* -0.0838 -0.0183-0.1300*
-0.0470 -0.1176* -0.0631 -0.0037
MOM-0.1636***
-0.2059***
-0.1485***
-0.1177***
-0.1942***
-0.1876***
-0.1696***
-0.1720***
-0.1643***
-0.1380***
Fama-French 3-factor model + MOM + QLTY Fama-French 3-factor model + MOM + QLTY
Alpha 0.1132 0.19250.2969**
0.2075* 0.2105 0.2086* 0.2009* 0.2041 0.1950* 0.2150
Beta0.9850***
1.0271***
1.0184***
1.0956***
1.1171***
1.0190***
1.0415***
1.0373***
1.0602***
1.0892***
SMB0.2712***
0.2207***
0.2523***
0.2302***
0.2185**
0.1951**0.2716***
0.2536***
0.2818***
0.1804
HML-0.0860
-0.1332*-0.1595**
-0.1062 -0.0454-0.1884***
-0.0743-0.1569**
-0.0715 -0.0386
MOM-0.1541***
-0.1853***
-0.1294***
-0.1083***
-0.1829***
-0.1632***
-0.1582***
-0.1556***
-0.1607***
-0.1235***
QLTY-0.0820
-0.1780* -0.1647* -0.0809 -0.0978-0.2112**
-0.0984 -0.1422 -0.0305 -0.1262
Materiality score level Immateriality score
1 2 3 4 5 1 2 3 4 5
Fama-French 3-factor model Fama-French 3-factor model
Alpha-0.0075
-0.0094 0.1270 0.1060 0.0670 -0.0081 0.0668 0.0397 0.1086 0.0750
Beta1.0483***
1.1307***
1.1047***
1.1481***
1.1924***
1.1291***
1.1114***
1.1217***
1.1071***
1.1608***
SMB0.3196***
0.3114***
0.3322***
0.2737***
0.2761***
0.2972***
0.3270***
0.3267***
0.3097***
0.2439***
HML 0.0561 0.0663 -0.0055 0.0021 0.1235* 0.0070 0.0768 0.0081 0.0568 0.0971

Alpha indicate monthly alpha’s (abnormal returns) in percentages. Following alpha are the regression coefficients of the other factors. These are estimated using a Fama-French style factor model including varying combinations of global market, size, value, momentum, liquidity and quality factors. These score level portfolios are tested over the period 2005-2017. Portfolio 5 indicates the best ranked portfolio. The portfolios are equal-weighted and rebalanced yearly in April. ***, **, and * indicate p-value of less than 1, 5 and 10% respectively.
SMB0.2874***
0.234***
0.2351***
0.2105***
0.2177***
0.1924**
0.2704***
0.2506***
0.2845***
0.1778**
HML -97 -113-0.1513**
-0.0835 -0.0472-0.1822***
-0.0566-0.1556**
-0.0669 -0.0299
MOM-0.1329***
-0.1722***
-0.1331***
-0.1047***
-0.1705***
-0.156***
-0.1486***
-0.1497***
-0.1404***
-0.1187***
LIQ-0.0422*
0.0001 0.0145 0.0240 -0.0169 -0.0045 0.0092 -0.0163 -0.0128 0.0041
QLTY -0.1129-0.1804*
-0.1624* -0.0936 -0.1134-0.2238**
-0.1040 -0.1515 -0.0597 -0.1299
| Erasmus Platform for Sustainable Value Creation48

APPENDIX IX – FACTOR MODEL SPECIFICATIONS AND COEFFICIENTS SCORE CHANGES
Fama-French 3-factor model + MOM + LIQ + QLTY Fama-French 3-factor model + MOM + LIQ+ QLTY
Alpha0.3065**
0.2254*0.2441**
0.1411 0.2359* 0.1928 0.17550.3002**
0.2293* 0.2300*
Beta0.9996***
1.0338***
1.0338***
1.0410***
1.0736***
1.0490***
1.0333***
1.0290***
1.0397***
1.0420***
SMB 0.11450.1730**
0.2005***
0.2186***
0.2198***
0.1834**
0.2259***
0.2179***
0.1577** 0.1548*
| Erasmus Platform for Sustainable Value Creation49
Materiality score level Immateriality score
1 2 3 4 5 1 2 3 4 5
Fama-French 3-factor model Fama-French 3-factor model
Alpha 0.0562 0.0386 0.1272 0.0215 0.1230 0.0558 0.0122 0.1155 0.0819 0.0908
Beta1.1205***
1.1247***
1.0936***
1.1021***
1.1345***
1.1184***
1.1127***
1.1215***
1.1131***
1.1132***
SMB0.2334***
0.2408***
0.2484***
0.262***4
0.2666***
0.2430***
0.2844***
0.2981***
0.2057***
0.2245***
HML 0.0417 0.1205* 0.1076* 0.0761 0.0889 0.0445 0.1032 0.0835 0.1317* 0.0710
Fama-French 3-factor model + MOM Fama-French 3-factor model + MOM
Alpha 0.1174 0.1264 0.1831** 0.0887 0.1878* 0.1123 0.0902 0.1879 0.1682* 0.1335
Beta1.0861***
1.0752***
1.0621***
1.0644***
1.0980***
1.0866***
1.0688***
1.0807***
1.0645***
1.0892***
SMB0.2188***
0.2198***
0.2350***
0.2463***
0.2511***
0.2295***
0.2658***
0.2808***
0.1851***
0.2143***
HML-0.0692
-0.0389 0.0061 -0.0458 -0.0288 -0.0579 -0.0385 -0.0480 -0.0249 -0.0064
MOM-0.1519***
-0.2184***
-0.1390***
-0.1669***
-0.1612***
-0.1403***
-0.1940***
-0.1801***
-0.2145***
-0.1060***
Fama-French 3-factor model + MOM + QLTY Fama-French 3-factor model + MOM + QLTY
Alpha0.3008**
0.2170*0.2429**
0.1387 0.2378* 0.1916 0.16800.2975**
0.2231* 0.2314*
Beta0.9983***
1.0319***
1.0336***
1.0404***
1.0741***
1.0487***
1.0316***
1.0283***
1.0382***
1.0424***
SMB 0.1097 0.1659*0.1995***
0.2165***
0.2214***
0.1823**
0.2195***
0.2156***
0.1524*0.1560**
HML-0.1452**
-0.0764 -0.0186 -0.0665 -0.0494 -0.0907 -0.0707 -0.0933 -0.0476 -0.0469
MOM-0.1202***
-0.2027***
-0.1287***
-0.1583***
-0.1526***
-0.1266***
-0.1805***
-0.1612***
-0.2050***
-0.0891***
QLTY-0.2742***
-0.1354 -0.0894 -0.0748 -0.0747 -0.1185 -0.1163 -0.1637* -0.0820 -0.1464

Alpha indicate monthly alpha’s (abnormal returns) in percentages. Following alpha are the regression coefficients of the other factors. These are estimated using a Fama-French style factor model including varying combinations of global market, size, value, momentum, liquidity and quality factors. These score changes portfolios are tested over the period 2006-2017. Portfolio 5 indicates the best ranked portfolio. The portfolios are equal-weighted and rebalanced yearly in April. ***, **, and * indicate p-value of less than 1, 5 and 10% respectively.
HML-0.1639**
-0.1040 -0.0226 -0.0744 -0.0432 -0.0949 -0.0954 -0.1022 -0.0681 -0.0423
MOM-0.1136***
-0.1930***
-0.1273***
-0.1555***
-0.1548***
-0.1251***
-0.1718***
-0.1581***
-0.1978***
-0.0907***
LIQ-0.0303
-0.0448 -0.0064 -0.0127 0.0102 -0.0067 -0.0402 -0.0144 -0.0332 0.0075
QLTY-0.2886***
-0.1566 -0.0924 -0.0809 -0.0698 -0.1217 -0.1353 -0.1705* -0.0978 -0.1428
| Erasmus Platform for Sustainable Value Creation50


