41
Cluster Analysis and the LEP Growth Dashboard ERC and GrowthAccelerator LEP Presentation – London 29 th October 2014
| Date post: | 12-Jul-2015 |
| Category: |
Business |
| Upload: | enterpriseresearchcentre |
| View: | 51 times |
| Download: | 0 times |

Cluster Analysis and the LEP Growth Dashboard
ERC and GrowthAccelerator
LEP Presentation – London 29th October 2014

State of Small Business Britain
http://enterpriseresearch.ac.uk/home-8/report-back-state-small-business-britain-conference-2014/

Structure
• Background – developing policy context
• LEP Cluster Analysis
• LEP Growth Dashboard
• Discussion

Background
• BIS commissioned the Enterprise Research Centre (ERC) to undertake an analysis of industrial clusters in the UK – Anyadike-Danes et al (2013) “Localisation of Industrial Activity across England’s LEPs: 2008 & 2012”
• Local Enterprise Partnerships (LEPs) the sub-national spatial frame in England.
• ERC working with the BIS Local Growth team, the What Works Centre and Grant Thornton/Growth Accelerator to provide analysis on the LEPs and Growth Hubs.

Developing Policy Agenda around Growth
• LEP SEPs and ESIFs submitted and funding allocated
• Growth Hubs – initial pathfinders; Wave 2 Cities (Lancaster University RGF Programme)
• BIS - Simplifying the Local Business Support Landscape - a guide for Cities and LEPs – 3 pilots: EM3 LEP; Northamptonshire LEP; Sheffield City Region LEP
Clusters
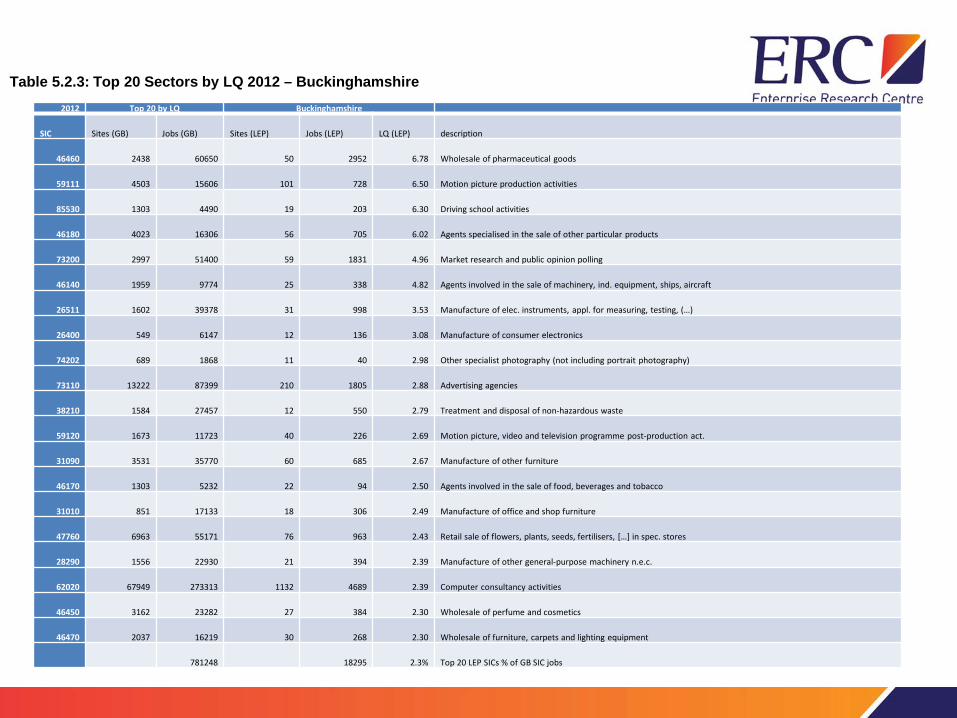
2012 Top 20 by LQ Buckinghamshire
SIC Sites (GB) Jobs (GB) Sites (LEP) Jobs (LEP) LQ (LEP) description
46460 2438 60650 50 2952 6.78 Wholesale of pharmaceutical goods
59111 4503 15606 101 728 6.50 Motion picture production activities
85530 1303 4490 19 203 6.30 Driving school activities
46180 4023 16306 56 705 6.02 Agents specialised in the sale of other particular products
73200 2997 51400 59 1831 4.96 Market research and public opinion polling
46140 1959 9774 25 338 4.82 Agents involved in the sale of machinery, ind. equipment, ships, aircraft
26511 1602 39378 31 998 3.53 Manufacture of elec. instruments, appl. for measuring, testing, (…)
26400 549 6147 12 136 3.08 Manufacture of consumer electronics
74202 689 1868 11 40 2.98 Other specialist photography (not including portrait photography)
73110 13222 87399 210 1805 2.88 Advertising agencies
38210 1584 27457 12 550 2.79 Treatment and disposal of non-hazardous waste
59120 1673 11723 40 226 2.69 Motion picture, video and television programme post-production act.
31090 3531 35770 60 685 2.67 Manufacture of other furniture
46170 1303 5232 22 94 2.50 Agents involved in the sale of food, beverages and tobacco
31010 851 17133 18 306 2.49 Manufacture of office and shop furniture
47760 6963 55171 76 963 2.43 Retail sale of flowers, plants, seeds, fertilisers, […] in spec. stores
28290 1556 22930 21 394 2.39 Manufacture of other general-purpose machinery n.e.c.
62020 67949 273313 1132 4689 2.39 Computer consultancy activities
46450 3162 23282 27 384 2.30 Wholesale of perfume and cosmetics
46470 2037 16219 30 268 2.30 Wholesale of furniture, carpets and lighting equipment
781248 18295 2.3% Top 20 LEP SICs % of GB SIC jobs
Table 5.2.3: Top 20 Sectors by LQ 2012 – Buckinghamshire

2012 Top 20 by LQ Coast to Capital
SIC Sites (GB) Jobs (GB) Sites (LEP) Jobs (LEP) LQ (LEP) SIC description
51102 430 12853 42 2629 7.30 Non-scheduled passenger air transport
46491 156 1093 11 162 5.29 Wholesale of musical instruments
51101 441 57429 28 7881 4.90 Scheduled passenger air transport
52230 958 44027 86 5875 4.76 Service activities incidental to air transportation
1190 513 5347 27 689 4.60 Growing of other non-perennial crops
58141 168 2473 10 284 4.10 Publishing of learned journals
23320 200 4911 19 525 3.81 Manufacture of bricks, tiles and construction products, in baked clay
85530 1303 4490 43 460 3.65 Driving school activities
65110 899 46550 38 4542 3.48 Life insurance
77291 389 2068 23 182 3.14 Renting and leasing of media entertainment equipment
79120 1745 25537 121 2125 2.97 Tour operator activities
64910 541 4744 28 392 2.95 Financial leasing
26400 549 6147 34 499 2.90 Manufacture of consumer electronics
77351 140 474 11 36 2.71 Renting and leasing of passenger air transport equipment
26301 1115 12880 62 955 2.65 Manufacture of telegraph and telephone apparatus and equipment
46370 375 2290 23 168 2.62 Wholesale of coffee, tea, cocoa and spices
1300 445 3906 22 276 2.52 Plant propagation
55201 714 21003 14 1435 2.44 Holiday centres and villages
35130 307 39745 15 2581 2.32 Distribution of electricity
81221 1390 5056 55 319 2.25 Window cleaning services
303023 32015 10.6% Top 20 LEP SICs % of GB SIC jobs
Table 5.5.3: Top 20 Sectors by LQ 2012 – Coast to Capital

2012 Top 20 by LQ Greater Cambridge and Greater Peterborough
SIC Sites (GB) Jobs (GB) Sites (LEP) Jobs (LEP) LQ (LEP) SIC description
27510 199 8477 10 1987 10.30 Manufacture of electric domestic appliances
74300 723 3401 26 604 7.80 Translation and interpretation activities
93191 421 1766 41 234 5.82 Activities of racehorse owners
28302 260 4971 18 601 5.31 Manufacture of agricultural and forestry machinery (other than agric. tractors)
10390 356 20001 19 2373 5.21 Other processing and preserving of fruit and vegetables
82920 1261 26068 69 3052 5.14 Packaging activities
62011 891 7134 23 800 4.93 Ready-made interactive leisure and entertainment software development
28990 514 9085 13 1002 4.85 Manufacture of other special-purpose machinery n.e.c.
1110 9040 40346 928 4039 4.40 Growing of cereals (except rice), leguminous crops and oil seeds
51210 291 2082 11 195 4.12 Freight air transport
26512 269 4288 11 401 4.11 Manufacture of electronic industrial process control equipment
1130 5246 38162 453 3536 4.07 Growing of vegetables and melons, roots and tubers
10910 271 6796 15 627 4.05 Manufacture of prepared feeds for farm animals
10130 663 31593 18 2852 3.97 Production of meat and poultry meat products
72190 3464 98848 270 8659 3.85 Other research and experimental development on natural sciences and eng’ing
26400 549 6147 28 521 3.72 Manufacture of consumer electronics
53202 5386 65561 111 5521 3.70 Unlicensed Carriers
22220 489 21274 15 1765 3.65 Manufacture of plastic packing goods
1190 513 5347 30 420 3.45 Growing of other non-perennial crops
1160 476 2015 49 157 3.42 Growing of fibre crops
403362 39346 9.8% Top 20 LEP SICs % of GB SIC jobs
Table 5.3.3: Top 20 Sectors by LQ 2012 – Greater Cambridge and Greater Peterborough
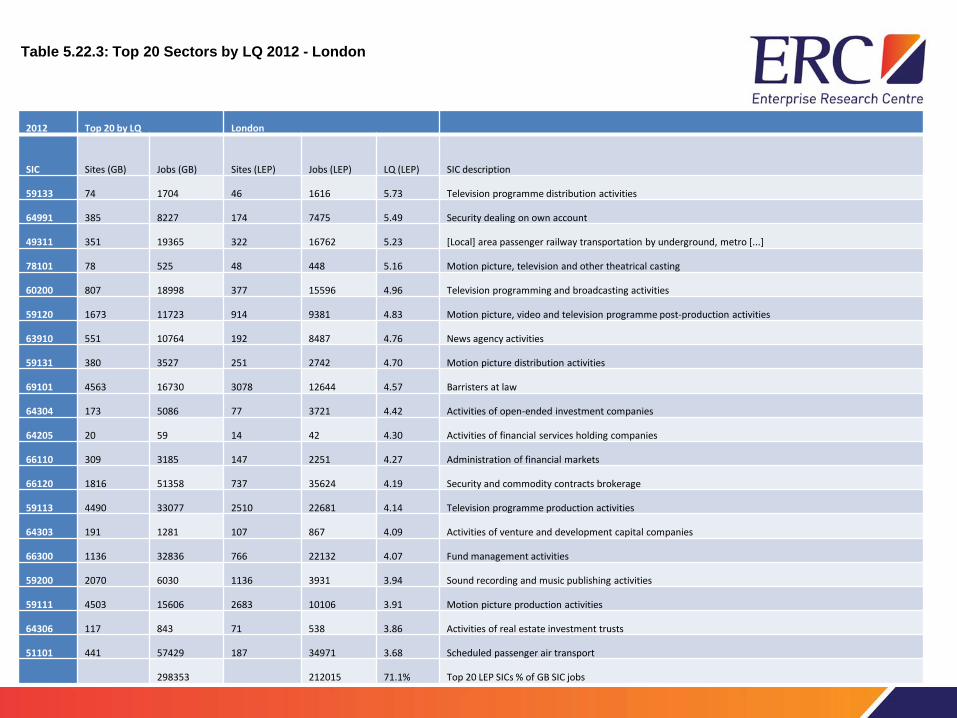
2012 Top 20 by LQ London
SIC Sites (GB) Jobs (GB) Sites (LEP) Jobs (LEP) LQ (LEP) SIC description
59133 74 1704 46 1616 5.73 Television programme distribution activities
64991 385 8227 174 7475 5.49 Security dealing on own account
49311 351 19365 322 16762 5.23 [Local] area passenger railway transportation by underground, metro [...]
78101 78 525 48 448 5.16 Motion picture, television and other theatrical casting
60200 807 18998 377 15596 4.96 Television programming and broadcasting activities
59120 1673 11723 914 9381 4.83 Motion picture, video and television programme post-production activities
63910 551 10764 192 8487 4.76 News agency activities
59131 380 3527 251 2742 4.70 Motion picture distribution activities
69101 4563 16730 3078 12644 4.57 Barristers at law
64304 173 5086 77 3721 4.42 Activities of open-ended investment companies
64205 20 59 14 42 4.30 Activities of financial services holding companies
66110 309 3185 147 2251 4.27 Administration of financial markets
66120 1816 51358 737 35624 4.19 Security and commodity contracts brokerage
59113 4490 33077 2510 22681 4.14 Television programme production activities
64303 191 1281 107 867 4.09 Activities of venture and development capital companies
66300 1136 32836 766 22132 4.07 Fund management activities
59200 2070 6030 1136 3931 3.94 Sound recording and music publishing activities
59111 4503 15606 2683 10106 3.91 Motion picture production activities
64306 117 843 71 538 3.86 Activities of real estate investment trusts
51101 441 57429 187 34971 3.68 Scheduled passenger air transport
298353 212015 71.1% Top 20 LEP SICs % of GB SIC jobs
Table 5.22.3: Top 20 Sectors by LQ 2012 - London

2012 Top 20 by LQ New Anglia
SIC Sites (GB) Jobs (GB) Sites (LEP) Jobs (LEP) LQ (LEP) SIC description
28302 260 4971 27 1320 11.08 Manufacture of agricultural and forestry machinery ([not] agric. tractors)
1460 759 3656 139 755 8.62 Raising of swine/pigs
10130 663 31593 26 5284 6.98 Production of meat and poultry meat products
10120 145 17980 15 2939 6.82 Processing and preserving of poultry meat
1621 436 2385 33 361 6.32 Farm animal boarding and care
52220 967 21838 55 3138 6.00 Service activities incidental to water transportation
55201 714 21003 55 3006 5.97 Holiday centres and villages
93191 421 1766 39 231 5.46 Activities of racehorse owners
1110 9040 40346 1082 5026 5.20 Growing of cereals (except rice), leguminous crops and oil seeds
10840 123 6665 11 810 5.07 Manufacture of condiments and seasonings
1470 1707 12318 150 1409 4.78 Raising of poultry
10910 271 6796 20 750 4.61 Manufacture of prepared feeds for farm animals
10920 157 4946 10 528 4.46 Manufacture of prepared pet foods
1160 476 2015 54 200 4.14 Growing of fibre crops
1130 5246 38162 552 3661 4.00 Growing of vegetables and melons, roots and tubers
1629 851 3352 53 301 3.75 Support activities for animal production (other than [...]) n.e.c.
20412 202 4068 11 362 3.71 Manufacture of cleaning and polishing preparations
66220 4142 104776 129 9224 3.68 Activities of insurance agents and brokers
1610 1374 7271 87 588 3.38 Support activities for crop production
46210 1112 9950 65 800 3.36 Wholesale of grain, unmanufactured tobacco, seeds and animal feeds
345857 40693 11.8% Top 20 LEP SICs % of GB SIC jobs
Table 5.24.3: Top 20 Sectors by LQ 2012 – New Anglia

2012 Top 20 by LQ Oxfordshire
SIC Sites (GB) Jobs (GB) Sites (LEP) Jobs (LEP) LQ (LEP) SIC description
26200 785 9094 13 1311 12.18 Manufacture of computers and peripheral equipment
58110 2002 24591 67 3040 10.45 Book publishing
85422 405 5269 11 499 8.00 Post-graduate level higher education
20590 555 14308 11 1011 5.97 Manufacture of other chemical products n.e.c.
1470 1707 12318 28 780 5.35 Raising of poultry
73200 2997 51400 80 3138 5.16 Market research and public opinion polling
72190 3464 98848 171 5362 4.58 Other research and experimental development on sciences and eng’ing
69203 950 3126 18 163 4.41 Tax consultancy
85421 1586 388819 61 20042 4.36 First-degree level higher education
26301 1115 12880 17 563 3.69 Manufacture of telegraph and telephone apparatus and equipment
28960 798 5121 12 222 3.66 Manufacture of plastics and rubber machinery
47591 446 2116 11 91 3.63 Retail sale of musical instruments and scores in specialised stores
73110 13222 87399 179 3432 3.32 Advertising agencies
82110 2231 14306 30 532 3.14 Combined office administrative service activities
46610 1508 14779 24 513 2.93 Wholesale of agricultural machinery, equipment and supplies
58290 1712 8204 39 274 2.82 Other software publishing
32500 1977 35151 40 1137 2.73 Manufacture of medical and dental instruments and supplies
46750 1625 15797 22 509 2.72 Wholesale of chemical products
72200 523 4440 22 143 2.72 Research and experimental development on social sciences and humanities
77210 823 4908 16 153 2.63 Renting and leasing of recreational and sports goods
812874 42915 5.3% Top 20 LEP SICs % of GB SIC jobs
Table 5.27.3: Top 20 Sectors by LQ 2012 - Oxfordshire
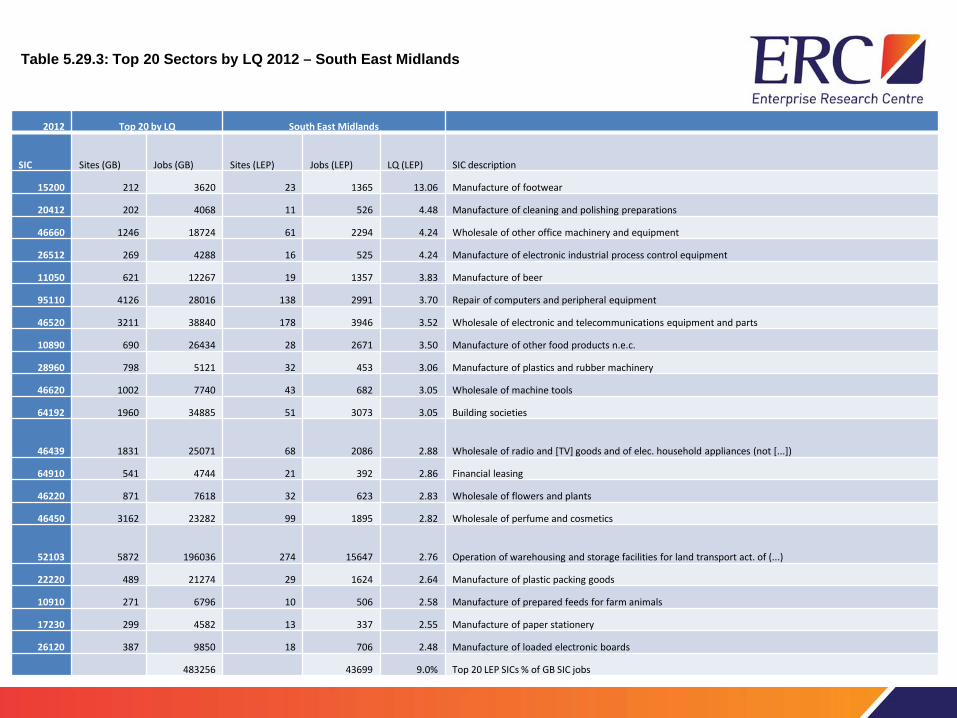
2012 Top 20 by LQ South East Midlands
SIC Sites (GB) Jobs (GB) Sites (LEP) Jobs (LEP) LQ (LEP) SIC description
15200 212 3620 23 1365 13.06 Manufacture of footwear
20412 202 4068 11 526 4.48 Manufacture of cleaning and polishing preparations
46660 1246 18724 61 2294 4.24 Wholesale of other office machinery and equipment
26512 269 4288 16 525 4.24 Manufacture of electronic industrial process control equipment
11050 621 12267 19 1357 3.83 Manufacture of beer
95110 4126 28016 138 2991 3.70 Repair of computers and peripheral equipment
46520 3211 38840 178 3946 3.52 Wholesale of electronic and telecommunications equipment and parts
10890 690 26434 28 2671 3.50 Manufacture of other food products n.e.c.
28960 798 5121 32 453 3.06 Manufacture of plastics and rubber machinery
46620 1002 7740 43 682 3.05 Wholesale of machine tools
64192 1960 34885 51 3073 3.05 Building societies
46439 1831 25071 68 2086 2.88 Wholesale of radio and [TV] goods and of elec. household appliances (not [...])
64910 541 4744 21 392 2.86 Financial leasing
46220 871 7618 32 623 2.83 Wholesale of flowers and plants
46450 3162 23282 99 1895 2.82 Wholesale of perfume and cosmetics
52103 5872 196036 274 15647 2.76 Operation of warehousing and storage facilities for land transport act. of (...)
22220 489 21274 29 1624 2.64 Manufacture of plastic packing goods
10910 271 6796 10 506 2.58 Manufacture of prepared feeds for farm animals
17230 299 4582 13 337 2.55 Manufacture of paper stationery
26120 387 9850 18 706 2.48 Manufacture of loaded electronic boards
483256 43699 9.0% Top 20 LEP SICs % of GB SIC jobs
Table 5.29.3: Top 20 Sectors by LQ 2012 – South East Midlands
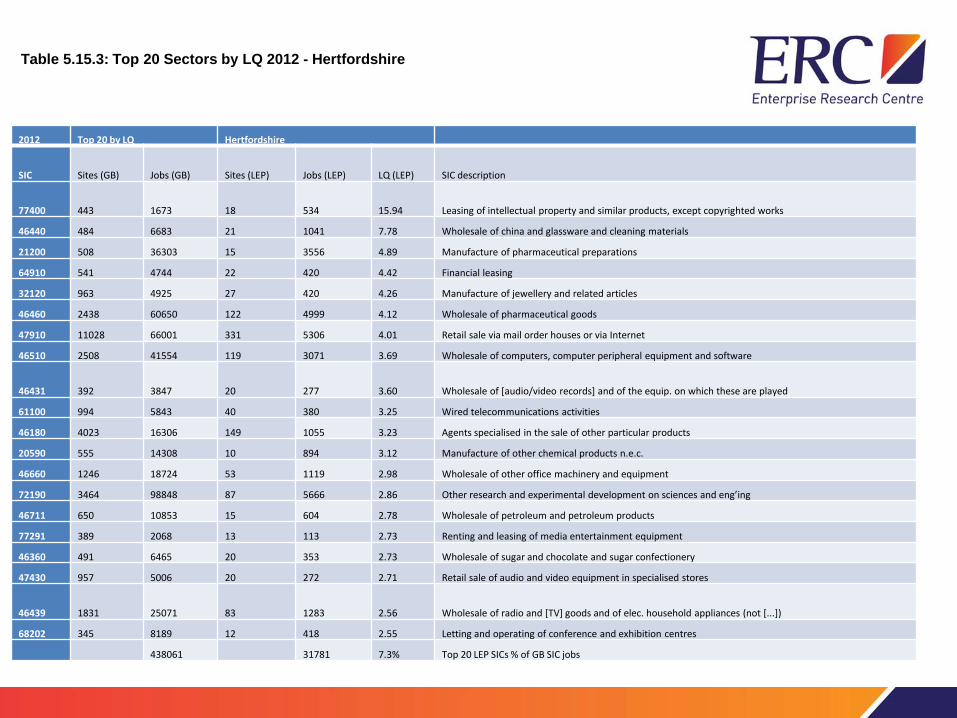
2012 Top 20 by LQ Hertfordshire
SIC Sites (GB) Jobs (GB) Sites (LEP) Jobs (LEP) LQ (LEP) SIC description
77400 443 1673 18 534 15.94 Leasing of intellectual property and similar products, except copyrighted works
46440 484 6683 21 1041 7.78 Wholesale of china and glassware and cleaning materials
21200 508 36303 15 3556 4.89 Manufacture of pharmaceutical preparations
64910 541 4744 22 420 4.42 Financial leasing
32120 963 4925 27 420 4.26 Manufacture of jewellery and related articles
46460 2438 60650 122 4999 4.12 Wholesale of pharmaceutical goods
47910 11028 66001 331 5306 4.01 Retail sale via mail order houses or via Internet
46510 2508 41554 119 3071 3.69 Wholesale of computers, computer peripheral equipment and software
46431 392 3847 20 277 3.60 Wholesale of [audio/video records] and of the equip. on which these are played
61100 994 5843 40 380 3.25 Wired telecommunications activities
46180 4023 16306 149 1055 3.23 Agents specialised in the sale of other particular products
20590 555 14308 10 894 3.12 Manufacture of other chemical products n.e.c.
46660 1246 18724 53 1119 2.98 Wholesale of other office machinery and equipment
72190 3464 98848 87 5666 2.86 Other research and experimental development on sciences and eng’ing
46711 650 10853 15 604 2.78 Wholesale of petroleum and petroleum products
77291 389 2068 13 113 2.73 Renting and leasing of media entertainment equipment
46360 491 6465 20 353 2.73 Wholesale of sugar and chocolate and sugar confectionery
47430 957 5006 20 272 2.71 Retail sale of audio and video equipment in specialised stores
46439 1831 25071 83 1283 2.56 Wholesale of radio and [TV] goods and of elec. household appliances (not [...])
68202 345 8189 12 418 2.55 Letting and operating of conference and exhibition centres
438061 31781 7.3% Top 20 LEP SICs % of GB SIC jobs
Table 5.15.3: Top 20 Sectors by LQ 2012 - Hertfordshire
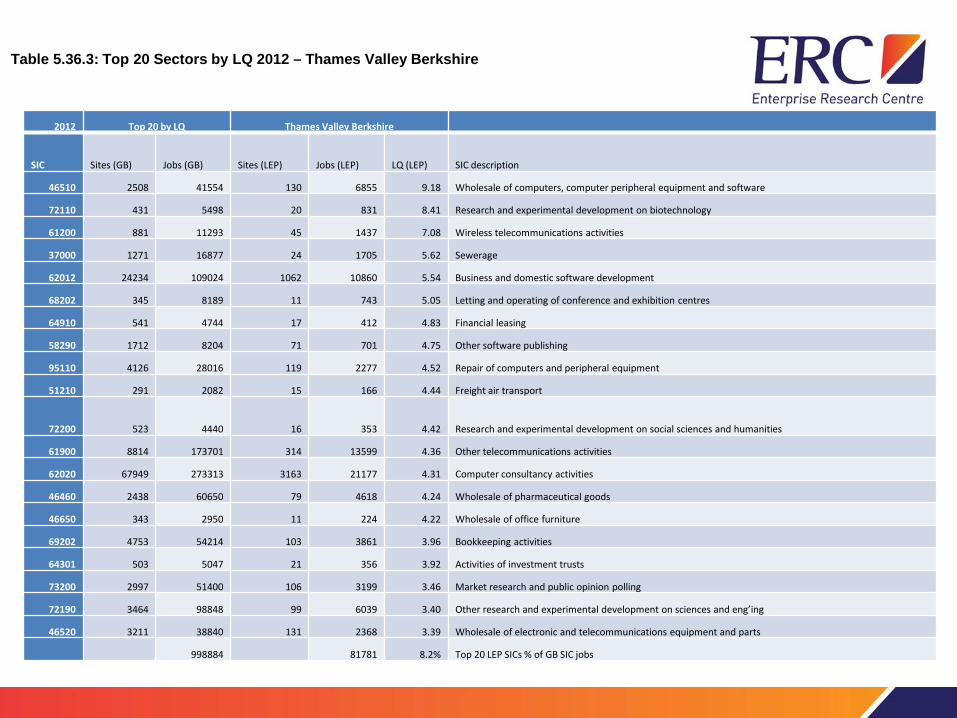
2012 Top 20 by LQ Thames Valley Berkshire
SIC Sites (GB) Jobs (GB) Sites (LEP) Jobs (LEP) LQ (LEP) SIC description
46510 2508 41554 130 6855 9.18 Wholesale of computers, computer peripheral equipment and software
72110 431 5498 20 831 8.41 Research and experimental development on biotechnology
61200 881 11293 45 1437 7.08 Wireless telecommunications activities
37000 1271 16877 24 1705 5.62 Sewerage
62012 24234 109024 1062 10860 5.54 Business and domestic software development
68202 345 8189 11 743 5.05 Letting and operating of conference and exhibition centres
64910 541 4744 17 412 4.83 Financial leasing
58290 1712 8204 71 701 4.75 Other software publishing
95110 4126 28016 119 2277 4.52 Repair of computers and peripheral equipment
51210 291 2082 15 166 4.44 Freight air transport
72200 523 4440 16 353 4.42 Research and experimental development on social sciences and humanities
61900 8814 173701 314 13599 4.36 Other telecommunications activities
62020 67949 273313 3163 21177 4.31 Computer consultancy activities
46460 2438 60650 79 4618 4.24 Wholesale of pharmaceutical goods
46650 343 2950 11 224 4.22 Wholesale of office furniture
69202 4753 54214 103 3861 3.96 Bookkeeping activities
64301 503 5047 21 356 3.92 Activities of investment trusts
73200 2997 51400 106 3199 3.46 Market research and public opinion polling
72190 3464 98848 99 6039 3.40 Other research and experimental development on sciences and eng’ing
46520 3211 38840 131 2368 3.39 Wholesale of electronic and telecommunications equipment and parts
998884 81781 8.2% Top 20 LEP SICs % of GB SIC jobs
Table 5.36.3: Top 20 Sectors by LQ 2012 – Thames Valley Berkshire

Industrial Sectors Analysis • Witty Review sought to examine ways in which universities
can support economic growth working in conjunction with organisations such as Local Enterprise Partnerships (LEPs).
• Two main hypotheses: – strongest basis for regional economic growth is based on a
comprehensive understanding of a locality’s comparative economic advantage;
– much of the UK’s comparative economic advantage could be derived from its universities and research in fields relevant to the Industrial Strategy sectors and technologies.
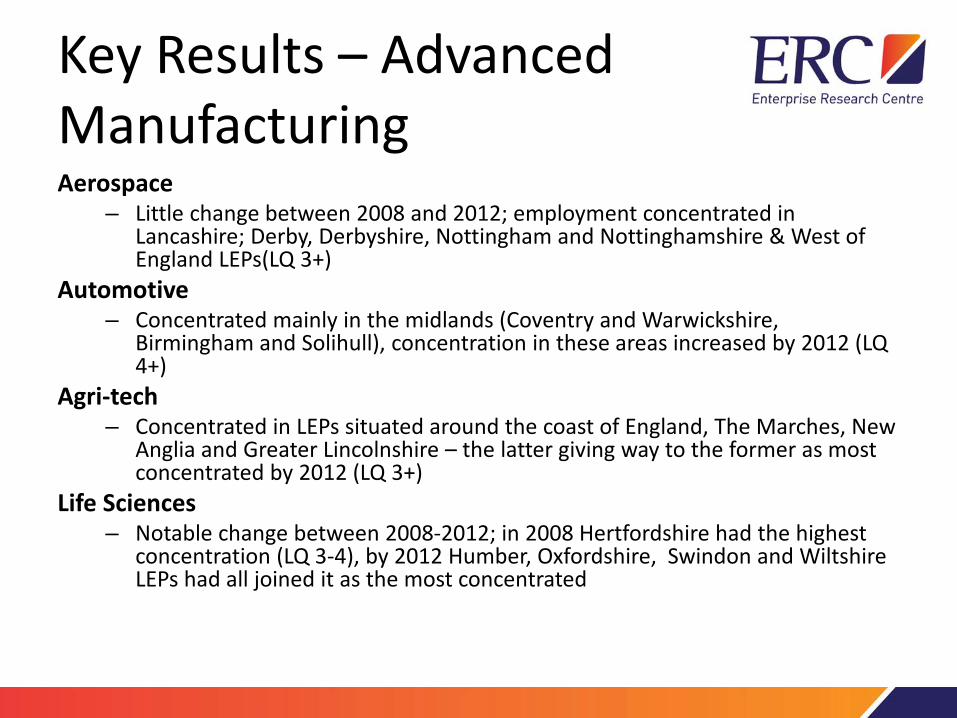
Key Results – Advanced Manufacturing Aerospace
– Little change between 2008 and 2012; employment concentrated in Lancashire; Derby, Derbyshire, Nottingham and Nottinghamshire & West of England LEPs(LQ 3+)
Automotive – Concentrated mainly in the midlands (Coventry and Warwickshire,
Birmingham and Solihull), concentration in these areas increased by 2012 (LQ 4+)
Agri-tech – Concentrated in LEPs situated around the coast of England, The Marches, New
Anglia and Greater Lincolnshire – the latter giving way to the former as most concentrated by 2012 (LQ 3+)
Life Sciences – Notable change between 2008-2012; in 2008 Hertfordshire had the highest
concentration (LQ 3-4), by 2012 Humber, Oxfordshire, Swindon and Wiltshire LEPs had all joined it as the most concentrated
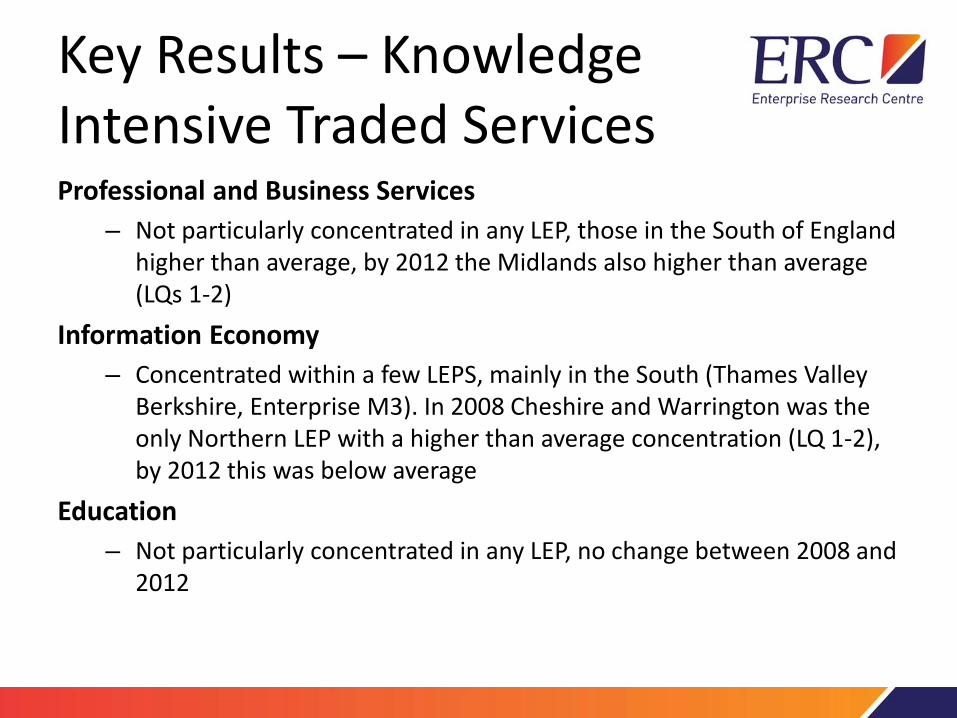
Key Results – Knowledge Intensive Traded Services Professional and Business Services
– Not particularly concentrated in any LEP, those in the South of England higher than average, by 2012 the Midlands also higher than average (LQs 1-2)
Information Economy – Concentrated within a few LEPS, mainly in the South (Thames Valley
Berkshire, Enterprise M3). In 2008 Cheshire and Warrington was the only Northern LEP with a higher than average concentration (LQ 1-2), by 2012 this was below average
Education – Not particularly concentrated in any LEP, no change between 2008 and
2012

Key Results – Enabling Sectors
Nuclear – Concentrated within a few mainly coastal LEPs (heaviest in Cumbria,
Derbyshire & Nottinghamshire LQ 4+). By 2012 Tees Valley had dropped below average (previously LQ 3-4), Lancashire and Gloucestershire had increased.
Offshore Wind – LQs unavailable but industry largely concentrated around North East,
North West and Eastern coasts Oil and Gas
– Concentrated within 3 LEPs: Humber (LQ 4+), Cheshire and Warrington (LQ 3-4) and Greater Lincolnshire (LQ 2-3). By 2012 same 3 but LQs all now 2-3
Construction – No particularly heavy concentrations, although central England LEPs below
average. By 2012 similar pattern although several northern LEPs also below average

UK Industrial Sectors - Summary • Overall, few changes between 2008-2012 • Increase in Life Sciences amongst Oxfordshire, Swindon and
Wiltshire and Humber LEPs • Majority of industry concentrated largely where it has been
historically: – Heavy advanced manufacturing concentrated in the
midlands area – Information and Professional Services skewed towards
Southern areas – Enabling sectors situated in Northern coastal areas

LEP Growth Dashboard
Joint venture between ERC and GrowthAccelerator

What is it?
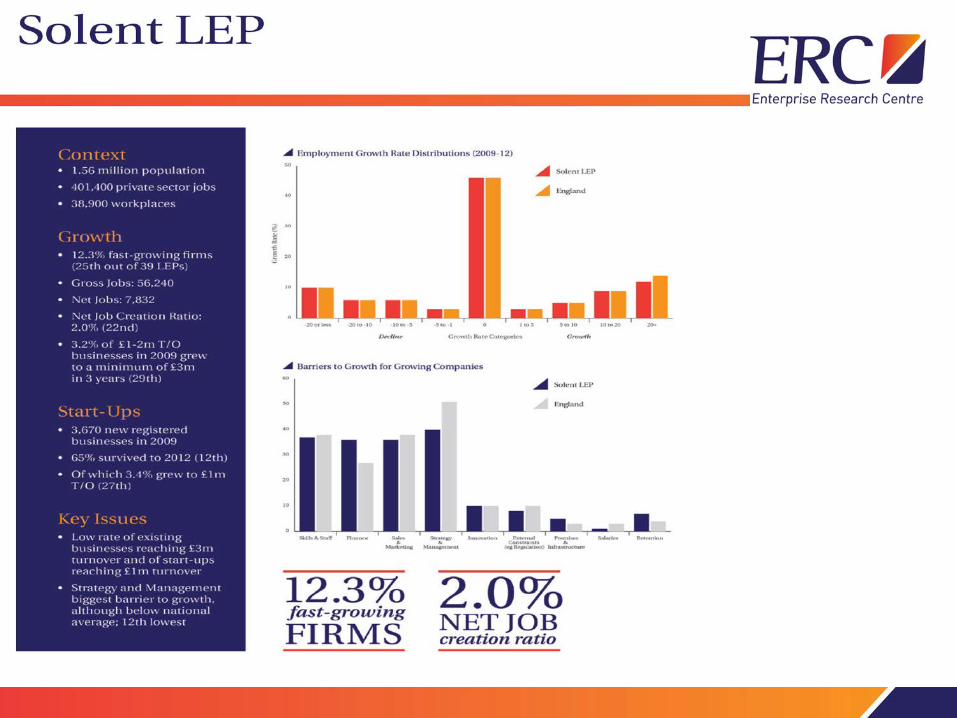
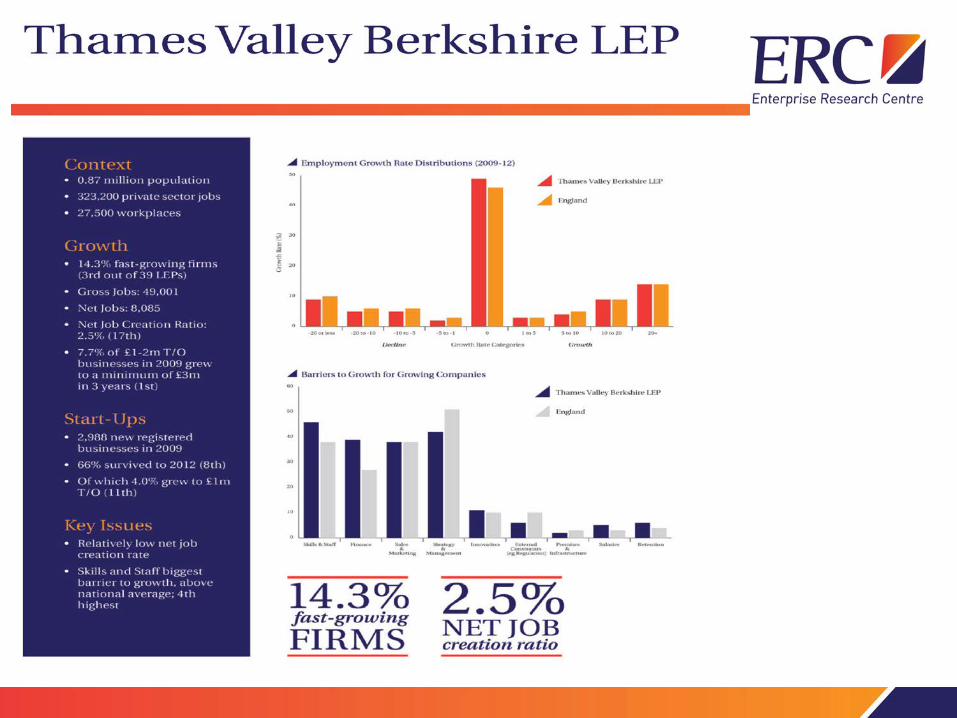
• Its purpose is to provide each LEP with a set of simple metrics on the growth of existing firms and start-ups in the LEP area.
• Set alongside the key barriers to growth flagged by businesses
who are seeking to grow and have become a participant in the GrowthAccelerator programme.
• The Dashboard, based primarily on ONS data, can be used as
a source of evidence to inform discussions on priorities in business support and includes easily understood metrics which can be readily updated on an annual basis.
Metrics
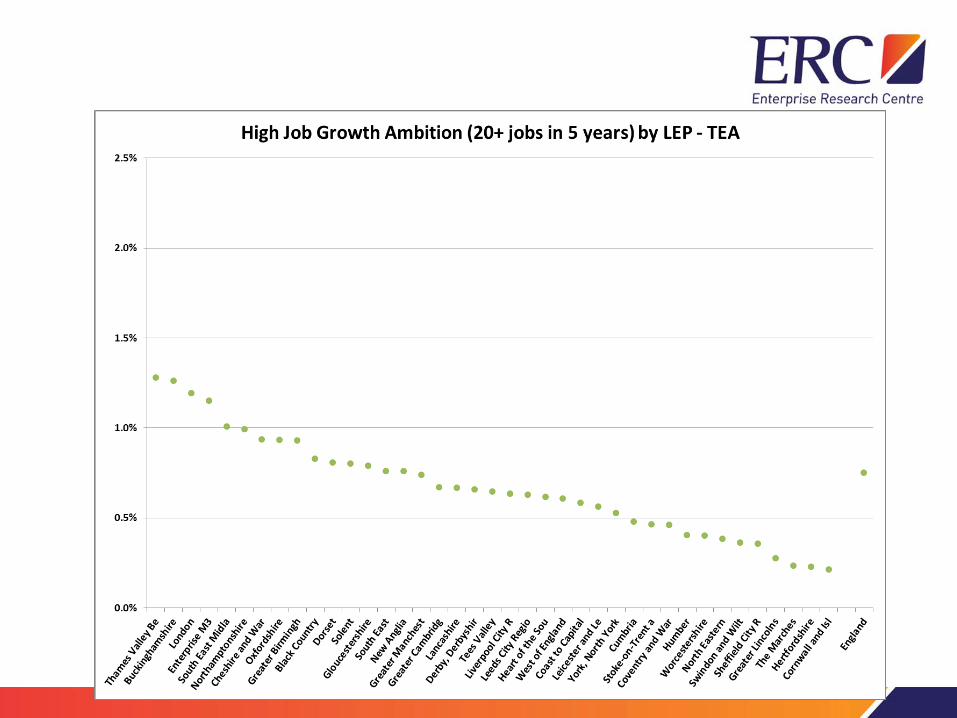
• Proportion of fast-growing firms (jobs) in the business population (2009-12)
• Net job creation ratios for 2011-12 • 3-year survival rates of start-ups (2009-12) • Proportion of surviving start-ups that reach £1m T/O
(2009-12_ • Proportion of existing £1-2m T/O businesses which
grow to £3m T/O (2009-12)


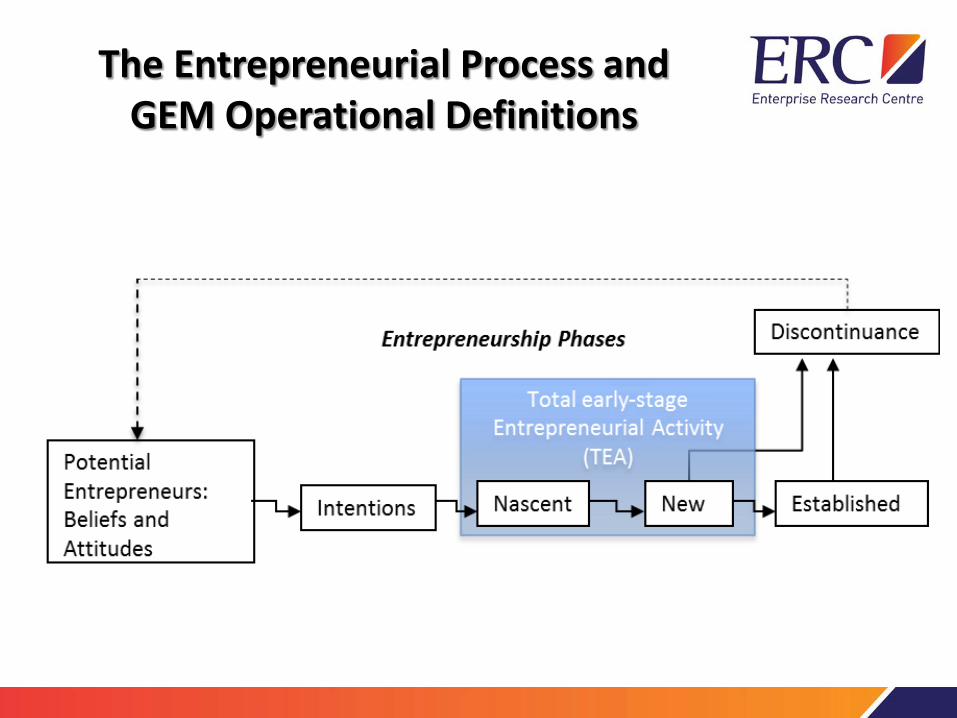
The Entrepreneurial Process and GEM Operational Definitions

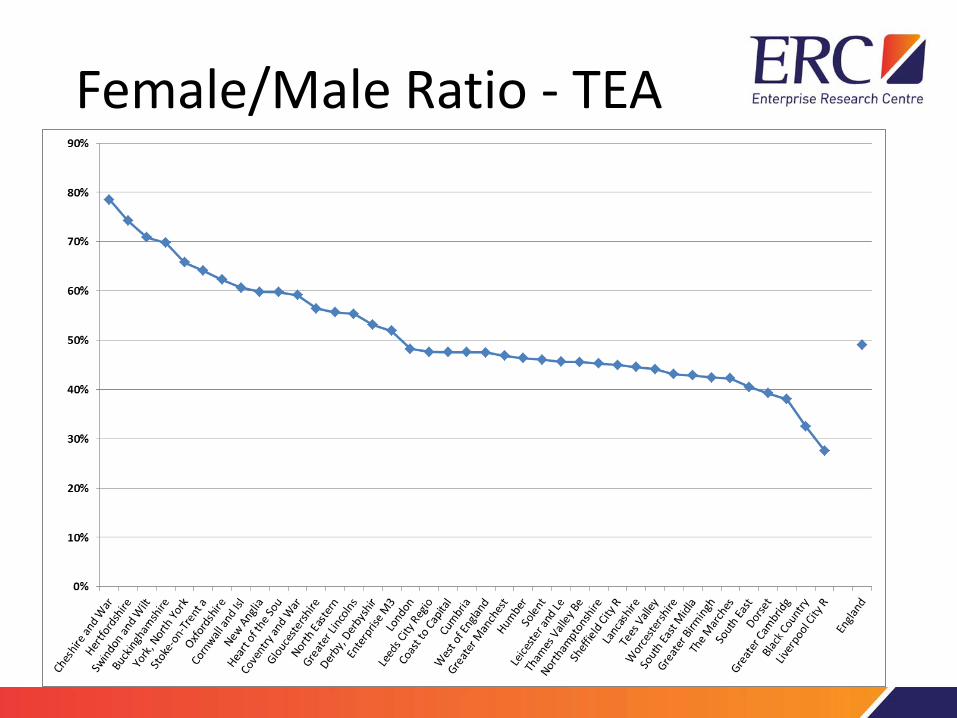
Female/Male Ratio - TEA

Summary
• Clusters: connecting cluster analysis to policy – the art of the possible? - there is no simple 'read-through' from a ‘cluster’ identified by high LQs to a strategy.
• LEP Dashboard: a complex LEP geography which provides a challenge to some of the preconceptions held about the ‘hotspots’ of growth across England while confirming others.

Discussion
• Building a robust evidence base for effective policy design – how can ERC assist
• Connecting metrics to LEP strategy and policy
initiatives? • What other metrics would be useful?

Contact us:
If you would like any more information about the ERC and any of its activities please contact the Theme Lead, Mark Hart at [email protected]
More details about the activities of the ERC and our latest events can be
found at: www.enterpriseresearch.ac.uk


