26
ERES Conference 2010 External shocks on property markets & implications for asset allocation Anthony De Francesco, IPD AUS/NZ Saturday 26 June 2010
| Date post: | 18-Dec-2015 |
| Category: |
Documents |
| Upload: | rhoda-davis |
| View: | 214 times |
| Download: | 1 times |

ERES Conference 2010 External shocks on property markets & implications for asset allocationAnthony De Francesco, IPD AUS/NZSaturday 26 June 2010
© IPD 20102www.ipd.com/australia
Introduction
External shocks and property markets
Modelling approach and preliminary results
Implications for asset allocation
Summary remarks
Outline

© IPD 20103www.ipd.com/australia
Introduction
External shocks and property markets
Modelling approach and preliminary results
Implications for asset allocations
Summary remarks
Outline
© IPD 20104www.ipd.com/australia
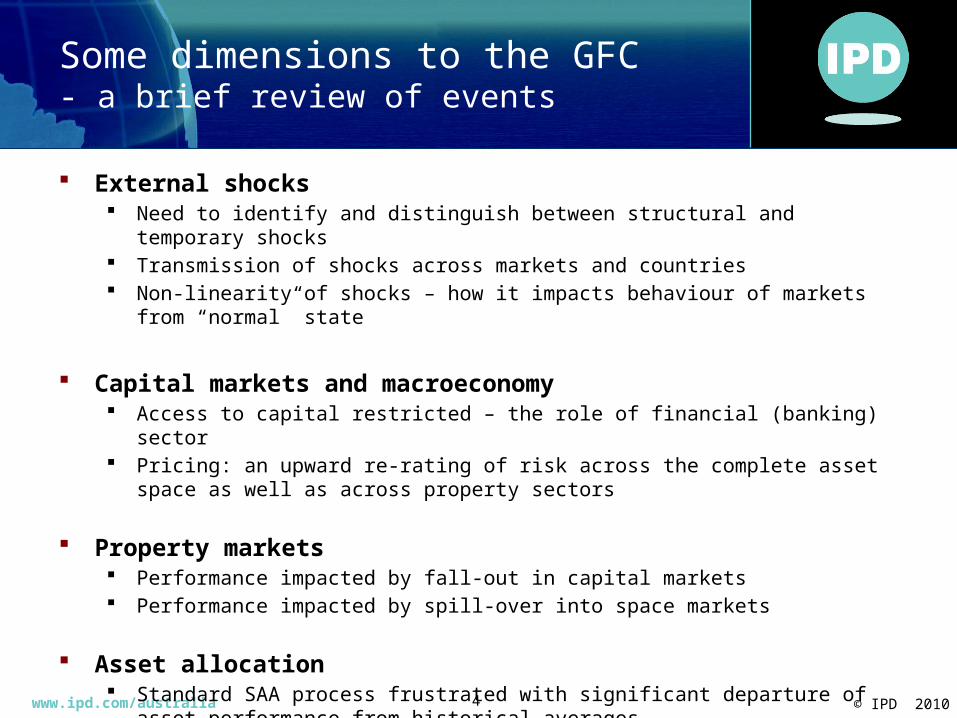
Some dimensions to the GFC- a brief review of events
External shocks Need to identify and distinguish between structural and temporary shocks Transmission of shocks across markets and countries Non-linearity of shocks – how it impacts behaviour of markets from “normal” state
Capital markets and macroeconomy Access to capital restricted – the role of financial (banking) sector Pricing: an upward re-rating of risk across the complete asset space as well as across
property sectors
Property markets Performance impacted by fall-out in capital markets Performance impacted by spill-over into space markets
Asset allocation Standard SAA process frustrated with significant departure of asset performance from
historical averages Conventional models not robust to shocks

© IPD 20105www.ipd.com/australia
Objective of study
Gauge and assess the nature and influence of shocks on property markets Examine the nature of the shocks Explore the influence of shocks on the asset markets
Use econometric modelling to explore the interplay between shocks and asset markets Indentify key drivers on return performance Quantify relationships
Implications for asset allocation Consider other dimensions which makes the framework more robust

© IPD 20106www.ipd.com/australia
Introduction
External shocks and property markets
Modelling approach and preliminary results
Implications for asset allocations
Summary remarks
Outline

© IPD 20107www.ipd.com/australia
The influence of global shocks - understanding the transmission mechanism across markets
DIRECT PROPERTY
CAPITAL MARKETSFINANCIAL (BANKING)
SECTOR
MACROECONOMY
LABOUR MARKETS
EQUITY MARKETS
LISTED PROPERTY
DEBT MARKETS
Valuation multiplier
B/S impacts
Liquidity run
Leverage
Non-linear effects arise due to shocks between Balance Sheet (B/S) and real economy.

© IPD 20108www.ipd.com/australia
-10.0%
-7.5%
-5.0%
-2.5%
0.0%
2.5%
5.0%
7.5%
10.0%
12.5%
15.0%
Mar-00 Sep-01 Mar-03 Sep-04 Mar-06 Sep-07 Mar-09
Economic activity for selected economiesannualised real GDP growth ending March 2010
Euro AUS UK JPN
US CHN NZ
Source: RBA and IPD Research.
The influence of global shocks - the interplay between various markets: display high correlations
25
50
75
100
125
150
175
200
225
250
Jan-05 Oct-05 Jul-06 Apr-07 Jan-08 Oct-08 Jul-09 Apr-10
Performance in selected listed share marketsprice indices (100=January 2005) ending May 2010
AUS S&P200NZ NZSE50US DJIAUK FTSE100SGP StraitsTimesJapan TOPIXHK Hang Seng
Source: RBA and IPD Research.
GFC (Global financial crisis)
SDC (Sovereign debt crisis)
-30%-25%-20%-15%-10%
-5%0%5%
10%15%20%25%30%35%40%
Dec 85 Dec 88 Dec 91 Dec 94 Dec 97 Dec 00 Dec 03 Dec 06 Dec 09
Property returns for selected global markets annual nominal total return on quarterly periods
JPN UK US AUS NZ
Source: IPD Research.
Binding leverage constraints impacts the financial transmission channels which results in high correlation among macroeconomic aggregates.
© IPD 20109www.ipd.com/australia
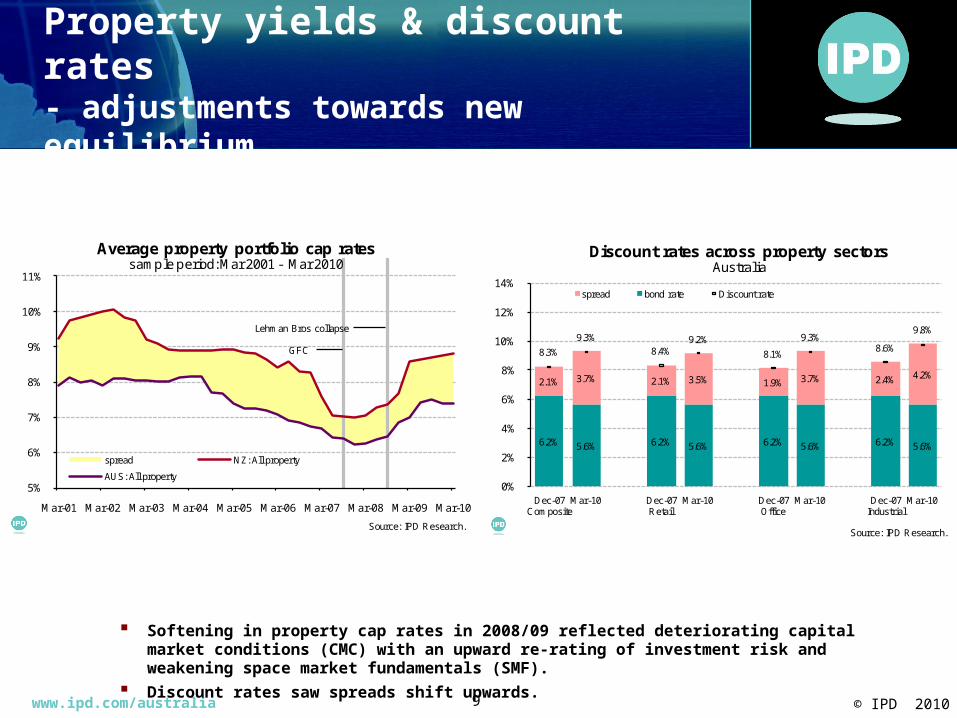
Softening in property cap rates in 2008/09 reflected deteriorating capital market conditions (CMC) with an upward re-rating of investment risk and weakening space market fundamentals (SMF).
Discount rates saw spreads shift upwards.
Property yields & discount rates- adjustments towards new equilibrium
5%
6%
7%
8%
9%
10%
11%
Mar-01 Mar-02 Mar-03 Mar-04 Mar-05 Mar-06 Mar-07 Mar-08 Mar-09 Mar-10
Average property portfolio cap ratessample period: Mar 2001 - Mar 2010
spread NZ: All property
AUS: All property
Source: IPD Research.
GFC
Lehman Bros collapse
6.2% 5.6% 6.2% 5.6% 6.2% 5.6% 6.2% 5.6%
2.1% 3.7% 2.1% 3.5% 1.9% 3.7% 2.4% 4.2%
8.3%
9.3%
8.4%9.2%
8.1%
9.3%8.6%
9.8%
0%
2%
4%
6%
8%
10%
12%
14%
Dec-07Composite
Mar-10 Dec-07Retail
Mar-10 Dec-07Office
Mar-10 Dec-07Industrial
Mar-10
Discount rates across property sectorsAustralia
spread bond rate Discount rate
Source: IPD Research.

© IPD 201010www.ipd.com/australia
1. Comparing downturns - synchronised downturn with variation
A synchronised downturn was experienced in many property markets around the world due to common factor risks.
However, the nature of the downturns vary across country, reflecting country-specific risk.
-30%-25%-20%-15%-10%
-5%0%5%
10%15%20%25%30%35%40%
Dec 85 Dec 88 Dec 91 Dec 94 Dec 97 Dec 00 Dec 03 Dec 06 Dec 09
Property returns for selected global markets annual nominal total return on quarterly periods
JPN UK US AUS NZ
Source: IPD Research.
© IPD 201011www.ipd.com/australia
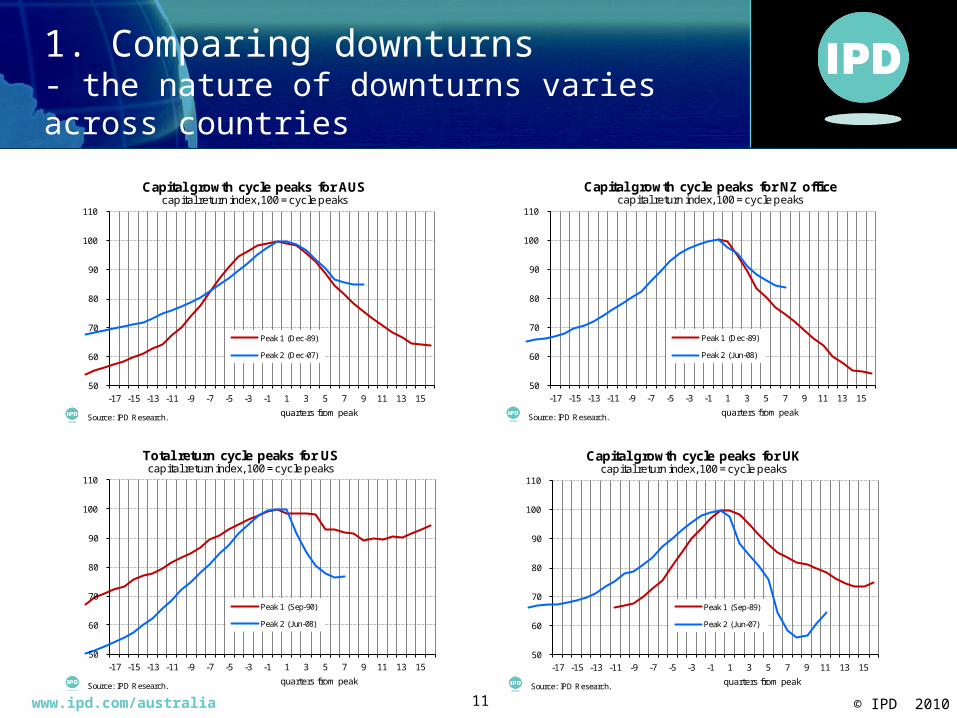
1. Comparing downturns- the nature of downturns varies across countries
50
60
70
80
90
100
110
-17 -15 -13 -11 -9 -7 -5 -3 -1 1 3 5 7 9 11 13 15
quarters from peak
Capital growth cycle peaks for AUScapital return index, 100 = cycle peaks
Peak 1 (Dec-89)
Peak 2 (Dec-07)
Source: IPD Research.
50
60
70
80
90
100
110
-17 -15 -13 -11 -9 -7 -5 -3 -1 1 3 5 7 9 11 13 15
quarters from peak
Capital growth cycle peaks for NZ officecapital return index, 100 = cycle peaks
Peak 1 (Dec-89)
Peak 2 (Jun-08)
Source: IPD Research.
50
60
70
80
90
100
110
-17 -15 -13 -11 -9 -7 -5 -3 -1 1 3 5 7 9 11 13 15
quarters from peak
Total return cycle peaks for UScapital return index, 100 = cycle peaks
Peak 1 (Sep-90)
Peak 2 (Jun-08)
Source: IPD Research.
50
60
70
80
90
100
110
-17 -15 -13 -11 -9 -7 -5 -3 -1 1 3 5 7 9 11 13 15
quarters from peak
Capital growth cycle peaks for UKcapital return index, 100 = cycle peaks
Peak 1 (Sep-89)
Peak 2 (Jun-07)
Source: IPD Research.

© IPD 201012www.ipd.com/australia
2. Synchronicity of property cycles- asymmetry between downturns and recovery
A synchronised downturn was experienced in many property markets around the world due to common factor risks.
However, the nature of the downturns vary across country, reflecting country-specific risk. Consider that Australia experienced a relatively sharp rise in capital return and now experiencing a relatively shallow downturn.
55
65
75
85
95
105
-15-14-13-12-11-10 -9 -8 -7 -6 -5 -4 -3 -2 -1 0 1 2 3 4 5 6 7 8 9 10 11
quarters from peak
Capital growth profiles for selected markets capital return index, 100=current cycle peak
CAN JPN UK
US AUS NZ
Source: IPD Research.
-35%
-30%
-25%
-20%
-15%
-10%
-5%
0%
5%
10%
15%
20%
Dec 03 Dec 04 Dec 05 Dec 06 Dec 07 Dec 08 Dec 09
Capital growth cycles for selected markets annual nominal capital return on quarterly periods
CAN
JPN
UK
US
AUS
NZ
Source: IPD Research.Note: direct property returns based on global IPD indices.

© IPD 201013www.ipd.com/australia
3. Various “states” of return profile- stable versus unstable periods
Downturns linked to changing macroeconomic conditions.
Occur with significant departure of markets from fundamentals (associated with shocks).
-20%
-15%
-10%
-5%
0%
5%
10%
15%
20%
25%
30%
35%
40%
Mar-86 Nov-89 Jul-93 Mar-97 Nov-00 Jul-04 Mar-08
Direct property total returns annualised returns on quarterly rests using PCA/IPD Index
TotalRetailIndustrialOffice
Source: IPD Research.
recession: 1990/91 high interest rates deregulation of capital markets
GFC: 2007/08 low interest rates
excess capital
Pronounced cycles Period of stability Pronouncedcycles

© IPD 201014www.ipd.com/australia
Overview
External shocks and property markets
Modelling approach and preliminary results
Implications for asset allocations
Summary remarks
Outline
© IPD 201015www.ipd.com/australia
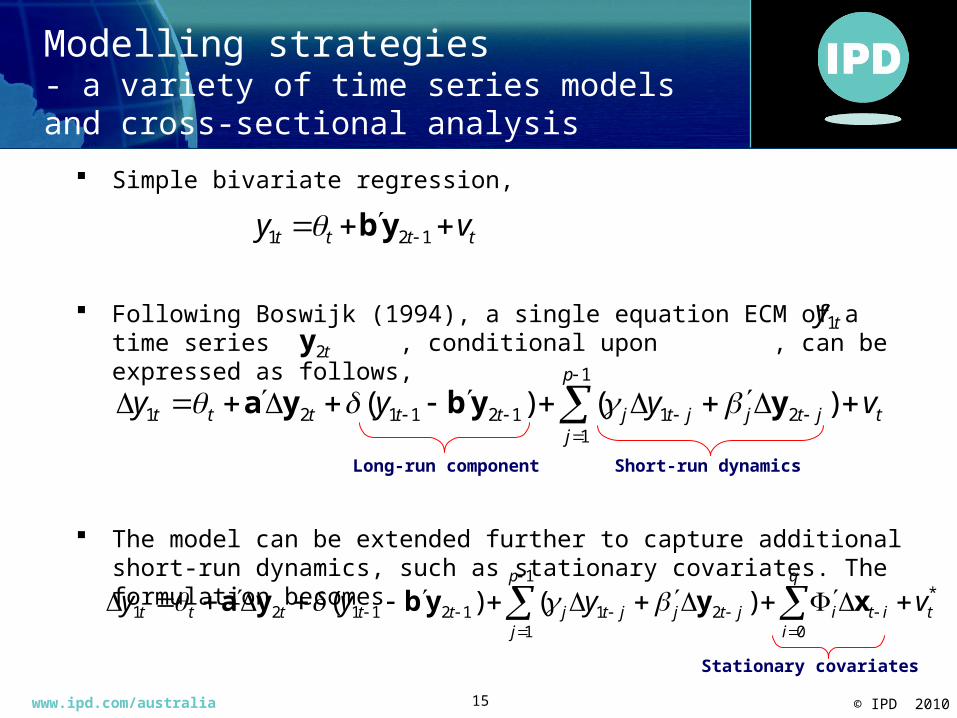
Simple bivariate regression,
Following Boswijk (1994), a single equation ECM of a time series , conditional upon , can be expressed as follows,
The model can be extended further to capture additional short-run dynamics, such as stationary covariates. The formulation becomes
t
p
jjtjjtjttttt vyyy
1
121121121 )()( yybya
*
0
1
121121121 )()( tit
q
ii
p
jjtjjtjttttt vyyy
xyybya
t2yty1
Long-run component Short-run dynamics
Stationary covariates
tttt vy 121 yb
Modelling strategies- a variety of time series models and cross-sectional analysis
© IPD 201016www.ipd.com/australia
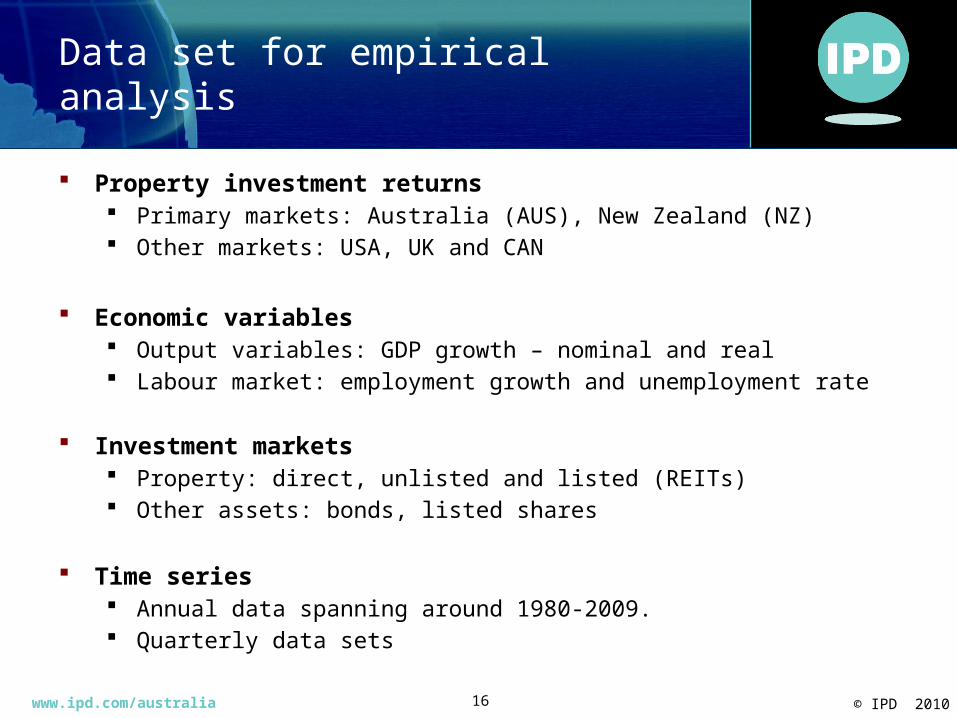
Data set for empirical analysis
Property investment returns Primary markets: Australia (AUS), New Zealand (NZ) Other markets: USA, UK and CAN
Economic variables Output variables: GDP growth – nominal and real Labour market: employment growth and unemployment rate
Investment markets
Property: direct, unlisted and listed (REITs) Other assets: bonds, listed shares
Time series Annual data spanning around 1980-2009. Quarterly data sets

© IPD 201017www.ipd.com/australia
Macro-property investment - the interplay between labour markets and real economy driving return
There is a strong link between the real economy, labour markets and property markets.
Correlation between nominal GDP growth and property returns: 0.81.
Correlation between employment growth and real property return: 0.74.
-4%
-3%
-2%
-1%
0%
1%
2%
3%
4%
-15%
-10%
-5%
0%
5%
10%
15%
20%
25%
Dec-85 Jan-89 Feb-92 Mar-95 Apr-98 May-01 Jun-04 Jul-07
AUS direct property and employment annualised returns versus employment growth, quarterly rests
Total property (lhs)
Employment (rhs)
Source: IPD Research.Note: return and growth rates expresed in real terms.
0%
2%
4%
6%
8%
10%
12%
14%
16%
-15%
-10%
-5%
0%
5%
10%
15%
20%
25%
30%
35%
Dec-85 Jan-89 Feb-92 Mar-95 Apr-98 May-01 Jun-04 Jul-07
AUS direct property and the macroeconomy annualised returns versus economic growth, quarterly rests
Total property (lhs)
GDP (rhs)
Source: IPD Research.Note: return and growth rates expresed in nominal terms.

© IPD 201018www.ipd.com/australia
The influence of macroeconomy - the impact of real economy varies across country property markets
R² = 0.65
-15%
-10%
-5%
0%
5%
10%
15%
20%
25%
30%
35%
0.0% 2.5% 5.0% 7.5% 10.0% 12.5% 15.0%
Pro
pert
y re
turn
GDP growth
AUS: direct property and the macroeconomy annual observations: 1985-2009
Source: IPD Research.
Correlation: 0.81
Source: IPD Research.
R² = 0.38
-30%
-25%
-20%
-15%
-10%
-5%
0%
5%
10%
15%
20%
25%
30%
35%
-5.0% -2.5% 0.0% 2.5% 5.0% 7.5% 10.0%12.5%15.0%
prop
erty
retu
rn
GDP growth
UK: direct property and the macroeconomy annual observations: 1987-2009
Source: IPD Research.
Correlation: 0.61
R² = 0.28
-15%
-10%
-5%
0%
5%
10%
15%
20%
25%
30%
-2.5% 0.0% 2.5% 5.0% 7.5% 10.0%
prop
erty
retu
rn
GDP growth
NZ: direct property and the macroeconomy annual observations: 1990-2009
Source: IPD Research.
Correlation: 0.53
R² = 0.40
-20%
-15%
-10%
-5%
0%
5%
10%
15%
20%
25%
0.0% 2.5% 5.0% 7.5% 10.0% 12.5%
prop
erty
retu
rn
GDP growth
US: direct property and the macroeconomy annual observations: 1980-2009
Source: IPD Research.
Correlation: 0.63
The variable impact on property markets is reflected with varying degree of positive correlation values.
This provides some support for a diversification strategy.

© IPD 201019www.ipd.com/australia
The influence of macroeconomy - cycles have significant influence on relationship
Moderate correlation values between GDP growth and property returns.
Single equation results for various countries Single equation results for various countriesnominal total returns versus nominal GDP nominal total returns versus nominal GDP
annual observations ending 2009 annual observations (sample excludes tw o cycles)
Country
AUS NZ USA CAN UK
intercept -0.064 -0.032 -0.040 0.026 -0.046
slope 2.340 2.071 2.119 1.229 2.451
sample 25 20 30 25 23
R2 0.65 0.35 0.40 0.26 0.38
correlation 0.81 0.59 0.63 0.51 0.61
Diagnostics
Single equation results for various countriesnominal total returns versus nominal GDP
annual observations (sample excludes tw o cycles)
Country
AUS NZ USA CAN UK
intercept -0.011 0.099 0.008 0.069 0.026
slope 1.977 0.150 1.943 0.683 1.639
sample 14 15 15 15 15
R2 0.46 0.00 0.21 0.07 0.06
correlation 0.68 0.04 0.46 0.26 0.24
Diagnostics
Correlations fall away with the purging form the sample period.

© IPD 201020www.ipd.com/australia
Property cycles and real economy- the relationship between capital growth and labour markets
Countries with steep declines in capital growth have experienced a rapid deterioration in labour markets.
R² = 0.31
-25%
-20%
-15%
-10%
-5%
0%
0.0% 1.0% 2.0% 3.0% 4.0% 5.0% 6.0%
Cap
ital r
etur
n (r
eal)
Change in unemployment rate (ppts)
Direct property versus labour markets annualised values for 2008-2009 across selected countries
Source: IPD Research.
Correlation: -0.56
AUS
US
UK
CAN
NZJPN
R² = 0.013
-20%
-18%
-16%
-14%
-12%
-10%
-8%
-6%
-4%
-2%
0%
-4.0% -2.0% 0.0% 2.0% 4.0% 6.0%
Cap
ital r
etur
n (n
omin
al)
GDP growth (nominal)
Direct property versus GDP growth annualised values for 2008-2009 across selected countries
Source: IPD Research.
Correlation: 0.11
AUS
US
UK
CAN
NZJPN

© IPD 201021www.ipd.com/australia
Overview
External shocks and property markets
Modelling approach and preliminary results
Implications for asset allocations
Summary remarks
Outline
© IPD 201022www.ipd.com/australia
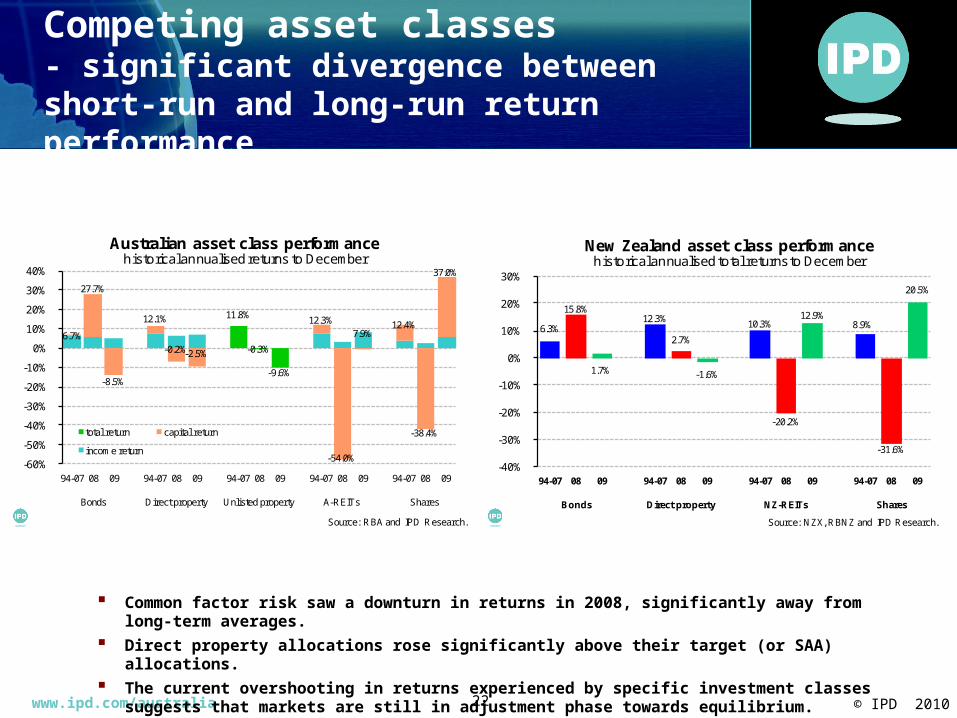
Competing asset classes- significant divergence between short-run and long-run return performance
Common factor risk saw a downturn in returns in 2008, significantly away from long-term averages.
Direct property allocations rose significantly above their target (or SAA) allocations.
The current overshooting in returns experienced by specific investment classes suggests that markets are still in adjustment phase towards equilibrium.
11.8%
-0.3%
-9.6%
6.7%
27.7%
-8.5%
12.1%
-0.2%-2.5%
12.3%
-54.0%
7.9%12.4%
-38.4%
37.0%
-60%
-50%
-40%
-30%
-20%
-10%
0%
10%
20%
30%
40%
94-07 08 09 94-07 08 09 94-07 08 09 94-07 08 09 94-07 08 09
Bonds Direct property Unlisted property A-REITs Shares
Australian asset class performancehistorical annualised returns to December
total return capital return
income return
Source: RBA and IPD Research.
6.3%
15.8%
1.7%
12.3%
2.7%
-1.6%
10.3%
-20.2%
12.9%8.9%
-31.6%
20.5%
-40%
-30%
-20%
-10%
0%
10%
20%
30%
94-07 08 09 94-07 08 09 94-07 08 09 94-07 08 09
Bonds Direct property NZ-REITs Shares
New Zealand asset class performancehistorical annualised total returns to December
Source: NZX, RBNZ and IPD Research.

© IPD 201023www.ipd.com/australia
State-space and risk-reward- current market dynamics highlight that markets are in transition phase
Different “state” environments reflect significant movements in volatility.
The distinctly different states of the world require different strategies for asset allocation.
-35%
-25%
-15%
-5%
5%
15%
25%
35%
0% 5% 10% 15% 20% 25% 30% 35%
actu
al re
turn
annual volatility
Risk-reward trade-off for various investments annualised observations
Shares
A-REITs
Unlisted property
Direct property
Bonds
DUMMY
Shares
A-REITs
Unlisted property
Bonds
Direct property
lower risk
Source: IPD Research.
Stable "state" (1994-2007)
Unstable "state" (2007-10:Q1)
-10%
-5%
0%
5%
10%
15%
0% 5% 10% 15% 20%
actu
al re
turn
annual volatility
Risk-reward trade-off for NZ investments annualised observations
Shares
NZ-REITs
Direct property
Bonds
DUMMY
Shares
NZ-REITs
Unlisted property
Bonds
Direct property
lower risk
Source: IPD Research.
Stable "state" (1994-2007)
Unstable "state" (2007-10:Q1)
© IPD 201024www.ipd.com/australia
Introduction
External shocks and property markets
Modelling approach and preliminary results
Implications for asset allocations
Summary remarks
Outline

© IPD 201025www.ipd.com/australia
Summary results
Direct property returns Influenced by a variety of macroeconomic aggregates, but highly contingent
on cycle profile Importance of labour markets Property cycle patterns vary across country due to varying influence of
financial sector
Asset allocation Distinction between permanent and transitory shocks Need to consider different “states” when formulating target asset allocations
Research
Expand research to include more countries Explore the impact of shocks across both direct and listed property markets

© IPD 201026www.ipd.com/australia
Intellectual Property Rights and use of IPD statistics as benchmarksWhether in the public domain or otherwise, IPD's statistics are the intellectual property of Investment Property Databank Limited.It is not permissible to use data drawn from this presentation as benchmarks.
© Investment Property Databank Limited (IPD) 2010. Database Right, Investment Property Databank Limited (IPD) 2010. All rights conferred by law of copyright and by virtue of international conventions are reserved by IPD
Contact
Anthony De FrancescoManaging DirectorTelephone: +61 2 9248 1901
Mobile: +61 (0) 405 506 284
Email: [email protected]
IPD – AUS/NZAddress: Suite 3, Level 3, 275 George Street, Sydney NSW 2000, AustraliaWeb: www.ipd.com/newzealand
IPD - UK1 St. John’s LaneLondon, EC1M 4BLUnited KingdomTel: +44 (0)20 7336 9200Email: [email protected]: www.ipd.com


![IPD/Bim Thesis Proposal - engr.psu.edu · [IPD/BIM THESIS PROPOSAL] Jason Brognano, Michael Gilroy, Stephen Kijak, David Maser December 6, 2010 KGB Maser KGB Maser| BIM/IPD Thesis](https://static.documents.pub/doc/80x56/605d339025f9181d960e06e8/ipdbim-thesis-proposal-engrpsuedu-ipdbim-thesis-proposal-jason-brognano.jpg)

![IPD/Bim Thesis Proposal - Penn State College of Engineering€¦ · [IPD/BIM THESIS PROPOSAL] Jason Brognano, Michael Gilroy, Stephen Kijak, David Maser December 6, 2010 KGB Maser](https://static.documents.pub/doc/80x56/605d339025f9181d960e06e9/ipdbim-thesis-proposal-penn-state-college-of-engineering-ipdbim-thesis-proposal.jpg)


