1 Ericsson SECOND QUARTER report July 18, 2012 Sales increased 1% YoY and showed a good performance QoQ, +9%. Networks sales decreased YoY due to the expected decline in CDMA equipment sales as well as weaker sales in China and Russia. Global Services and Support Solutions showed strong performance YoY and QoQ. The underlying business mix, with higher share of coverage projects than capacity projects, was unchanged in the quarter and is expected to prevail short-term. The negative gross margin impact from the network modernization projects in Europe will start to gradually decline end 2012. Cash flow from operations SEK -1.4 b. impacted by high working capital mainly due to late invoicing. Net income SEK 1.2 b., down from SEK 3.2 b. YoY, impacted by lower profitability in Network and increased loss in ST-Ericsson. EPS diluted SEK 0.34 (0.96). EPS Non-IFRS SEK 0.78 (1.60). SEK b. Q2 2012 Q2 2011 YoY Change Q1 2012 QoQ Change Six m. 2012 Six m. 2011 Net sales 55.3 54.8 1% 51.0 9% 106.3 107.7 Of which Networks 27.8 33.4 -17% 27.3 2% 55.1 66.6 Of which Global Services 24.1 19.0 26% 20.6 17% 44.7 36.5 Of which Support Solutions 3.5 2.4 47% 3.0 15% 6.5 4.7 Gross margin 32.0% 37.8% - 33.3% - 32.6% 38.1% EBITA margin excl JVs and Sony Ericsson sale 8.0% 11.4% - 7.7% - 7.9% 12.7% Operating income excl JVs and Sony Ericsson sale 3.3 5.0 -35% 2.8 17% 6.1 11.3 Operating margin excl JVs and Sony Ericsson sale 5.9% 9.2% - 5.5% - 5.7% 10.5% EBITA margin excl JVs 8.0% 11.4% - 22.8% - 15.2% 12.7% Operating income excl JVs 3.3 5.0 -35% 10.5 - 13.8 11.3 Operating margin excl JVs 5.9% 9.2% - 20.6% - 13.0% 10.5% Of which Networks 5% 14% - 6% - 5% 16% Of which Global Services 6% 5% - 6% - 6% 6% Of which Support Solutions 12% -11% - -1% - 6% -13% Operating income incl JVs 2.1 4.3 -51% 9.1 - 11.2 10.1 Income after financial items 1.8 4.6 - 9.1 - 10.8 10.4 Net income 1.2 3.2 -63% 8.8 - 10.0 7.3 EPS diluted, SEK 0.34 0.96 -65% 2.76 -88% 3.10 2.23 EPS (Non-IFRS), SEK 1) 0.78 1.60 -51% 3.14 -75% 3.91 3.21 Cash flow from operations -1.4 5.8 - 0.7 - -0.6 2.9 Cash conversion -43% 115% - 17% - -9% 25% Net cash, end of period - - - 37.1 - 25.9 42.6 1) EPS, diluted, excl. amortizations, write-downs of acquired intangible assets and restructuring. Q112 includes a gain from the divestment of Sony Ericsson of SEK 7.7 b. COMMENTS FROM HANS VESTBERG, PRESIDENT AND CEO “In the quarter, demand for Global Services and Support Solutions was strong, while Networks sales decreased YoY mainly due to the expected decline in CDMA equipment sales as well as lower business activity in China, including weaker sales of GSM and lower 3G sales in Russia,” says Hans Vestberg, President and CEO of Ericsson (NASDAQ:ERIC). “In Global Services all areas showed good growth in the quarter due to operators’ focus on operational efficiency and high project activities. The strong development for Support Solutions was driven by billing systems and TV solutions. Global Services and Support Solutions together represented about half of the Group’s revenues. The growing Global Services business has a dilutive impact on gross margin. CONTENTS Financial Highlights .......... 2 Segment Results .............. 5 Regional Overview ........... 8 Market Data ..................... 9 Parent Company Information ..................... 10 Other Information ........... 10 Auditors’ Review Report ............................ 13 Editor’s Note .................. 14 Financial Statements and Additional Information ..................... 16
Transcript
1
Ericsson SECOND QUARTER report July 18, 2012 Sales increased 1% YoY and showed a good performance QoQ, +9%. Networks sales decreased YoY due to the expected decline in CDMA equipment sales
as well as weaker sales in China and Russia. Global Services and Support Solutions showed strong performance YoY and QoQ. The underlying business mix, with higher share of coverage projects than capacity projects, was
unchanged in the quarter and is expected to prevail short-term. The negative gross margin impact from the network modernization projects in Europe will start to gradually decline end 2012.
Cash flow from operations SEK -1.4 b. impacted by high working capital mainly due to late invoicing.
Net income SEK 1.2 b., down from SEK 3.2 b. YoY, impacted by lower profitability in Network and increased loss in ST-Ericsson.
Of which Networks 27.8 33.4 -17% 27.3 2% 55.1 66.6 Of which Global Services 24.1 19.0 26% 20.6 17% 44.7 36.5 Of which Support Solutions 3.5 2.4 47% 3.0 15% 6.5 4.7
Gross margin 32.0% 37.8% - 33.3% - 32.6% 38.1% EBITA margin excl JVs and Sony Ericsson sale 8.0% 11.4% - 7.7% - 7.9% 12.7% Operating income excl JVs and Sony Ericsson sale 3.3 5.0 -35% 2.8 17% 6.1 11.3 Operating margin excl JVs and Sony Ericsson sale 5.9% 9.2% - 5.5% - 5.7% 10.5% EBITA margin excl JVs 8.0% 11.4% - 22.8% - 15.2% 12.7% Operating income excl JVs 3.3 5.0 -35% 10.5 - 13.8 11.3 Operating margin excl JVs 5.9% 9.2% - 20.6% - 13.0% 10.5%
Of which Networks 5% 14% - 6% - 5% 16% Of which Global Services 6% 5% - 6% - 6% 6% Of which Support Solutions 12% -11% - -1% - 6% -13%
Operating income incl JVs 2.1 4.3 -51% 9.1 - 11.2 10.1 Income after financial items 1.8 4.6 - 9.1 - 10.8 10.4 Net income 1.2 3.2 -63% 8.8 - 10.0 7.3 EPS diluted, SEK 0.34 0.96 -65% 2.76 -88% 3.10 2.23 EPS (Non-IFRS), SEK1) 0.78 1.60 -51% 3.14 -75% 3.91 3.21 Cash flow from operations -1.4 5.8 - 0.7 - -0.6 2.9 Cash conversion -43% 115% - 17% - -9% 25% Net cash, end of period - - - 37.1 - 25.9 42.6 1) EPS, diluted, excl. amortizations, write-downs of acquired intangible assets and restructuring. Q112 includes a gain from the divestment of Sony Ericsson of SEK 7.7 b.
COMMENTS FROM HANS VESTBERG, PRESIDENT AND CEO
“In the quarter, demand for Global Services and Support Solutions was strong, while Networks sales decreased YoY mainly due to the expected decline in CDMA equipment sales as well as lower business activity in China, including weaker sales of GSM and lower 3G sales in Russia,” says Hans Vestberg, President and CEO of Ericsson (NASDAQ:ERIC). “In Global Services all areas showed good growth in the quarter due to operators’ focus on operational efficiency and high project activities. The strong development for Support Solutions was driven by billing systems and TV solutions. Global Services and Support Solutions together represented about half of the Group’s revenues. The growing Global Services business has a dilutive impact on gross margin.
CONTENTS
Financial Highlights .......... 2 Segment Results .............. 5 Regional Overview ........... 8 Market Data ..................... 9 Parent Company Information ..................... 10 Other Information ........... 10 Auditors’ Review Report ............................ 13 Editor’s Note .................. 14 Financial Statements and Additional Information ..................... 16
Ericsson Second Quarter Report 2012 2
We continue to stay close to our customers to monitor the impacts of macroeconomic development and political uncertainty in certain regions on their investments. In customer conversations it is clear that the fundamental drivers for increased data traffic are unchanged. Today there are more than 700 million smartphone subscriptions and according to our estimates this number will increase to three billion in 2017. Based on these drivers, we see an increasing focus from our customers on network performance and quality of service. This will require continuous operator investments in hardware, software and services.
Our joint venture ST-Ericsson is still in a challenging situation due to a significant drop in sales of new products to one of the largest customers and continued decline in legacy products. The company continues to focus on securing the successful execution and delivery of its NovaThor ModAp platforms and Thor modems to customers while executing on company transformation aiming at lowering its break-even point.
In 2010 we made a conscious decision to gain market share and increase technology and services leadership, well aware of the short-term profitability pressure. Our focus is now on translating these gains into sustainable profitable growth,” concludes Vestberg.
Financial Highlights
INCOME STATEMENT AND CASH FLOW
Sales in the quarter increased 1% YoY and 9% QoQ. Sales for comparable units, adjusted for FX and hedging, decreased -6% YoY. The acquired Telcordia operation added sales of SEK 1.1 b. in the quarter, split 50/50 between segments Global Services and Support Solutions.
Networks sales decreased -17% YoY primarily due to the expected decline in CDMA equipment sales as well as weaker development for GSM sales in China and slower operator investments in Russia. Networks sales increased 2% QoQ. CDMA equipment sales declined close to -50% YoY to SEK 2 b. and are expected to continue its rapid decline in H212.
Global Services continued to show strong momentum with growth of 26% YoY and 17% QoQ and all areas grew. Global Services represented 44% (35%) of total sales in the quarter compared to 40% in Q112. Support Solutions sales were strong with 47% growth YoY and 15% QoQ driven by strong demand for billing systems and TV solutions. Both Global Services and Support Solutions were positively impacted by the added sales from the acquired Telcordia.
Ericsson restructuring charges amounted to SEK 0.6 (1.7) b., mainly related to execution of the service delivery strategy through transformation from local to global resource centers. As previously communicated, restructuring charges are estimated to approximately SEK 4 b. for the FY12.
Gross margin was down YoY to 32.0% (37.8%), and from 33.3% QoQ. The YoY decrease is due to the increased Global Services share as well as a higher proportion of coverage projects and network modernization projects in Europe. Approximately half of the YoY gross margin percentage decline is related to the increased services mix. The QoQ gross margin reduction is due to a higher Global Services share and lower sales of mobile broadband capacity than in Q112.
The underlying business mix, with higher share of coverage projects, was unchanged in the quarter and is expected to prevail short-term. The negative gross margin impact from the network modernization projects in Europe will start to gradually decline end 2012.
NET SALES, SEK b.
OPERATING INCOME INCL. JVs, SEK b.
*excl SEK 7.7 b. gain from Sony Ericsson divestment
NET INCOME, SEK b.
*excl SEK 7.7 b. gain from Sony Ericsson divestment CASH FLOW FROM OPERATIONS, SEK b.
Ericsson Second Quarter Report 2012 3
The modernization of networks in Europe became an opportunity for us mid-2010 when operators in Europe started to evaluate potential swaps of older 2G and 3G equipment to new multi-standard radio equipment. Ericsson, who had lost out on market share in the 3G race compared to its strong 2G position, identified this as an opportunity to regain footprint. Competition for new footprint is always tough and a strategic decision was taken to accept short-term pressure on margins to increase market share. As a result, market share has increased and the Company has restored its leading market position in Europe. Average project duration for these modernization projects are 18-24 months and the margin effects will start to gradually decline late 2012. In Q411, all projects were up to full speed.
Total operating expenses amounted to SEK 15.0 (15.8) b. R&D expenses amounted to SEK 8.1 (8.1) b. and increased slightly QoQ due to restructuring. Full year R&D expenses is now expected to be SEK 30-32 b. compared to previous estimate of SEK 29-31 b. The increase is due to selective investments in key radio technology areas to extend technology leadership and FX. Selling and general administrative expenses (SG&A) amounted to SEK 6.9 (7.7) b. SG&A is down -8% YTD, excluding restructuring charges and the impact from the acquisition of Telcordia. In Q211, SG&A was impacted by restructuring charges of SEK 1.2 b. vs. restructuring charges of SEK 0.1 b. in Q212.
Other operating income and expenses was SEK 0.5 (0.2) b. and decreased SEK -7.2 b. QoQ due to the gain of SEK 7.7 b. from the divestment of Sony Ericsson that was reported in Q112. The SEK 0.3 b. in segment Sony Ericsson relates to a resolved dispute from a litigation process with a third party.
Operating income, excluding JVs, decreased to SEK 3.3 (5.0) b. due to lower profitability in Networks but with a positive impact from lower restructuring costs. Operating margin was 5.9% (9.2%) compared to 5.5% (excl. gain from divestment of Sony Ericsson) in Q112.
Ericsson’s share in ST-Ericsson’s income before tax was SEK -1.3 (-0.7) b.
Financial net amounted to SEK -0.3 (0.3) b. and decreased QoQ from SEK 0.0 b. mainly related to negative currency exchange revaluation effects.
Net income decreased to SEK 1.2 (3.2) b. due to lower profitability in Networks and increased loss in ST-Ericsson.
EPS diluted was SEK 0.34 (0.96). EPS Non-IFRS, excluding restructuring, was SEK 0.78 (1.60).
Cash flow from operations was negative SEK -1.4 (5.8) b., mainly due to late invoicing in the quarter. Cash conversion year to date is -9%. Cash outlays for restructuring amounted to SEK 0.3 (1.2) b. Cash outlays of SEK 1.0 b. remain to be made from the restructuring provision.
Ericsson Second Quarter Report 2012 4
BALANCE SHEET AND OTHER PERFORMANCE INDICATORS
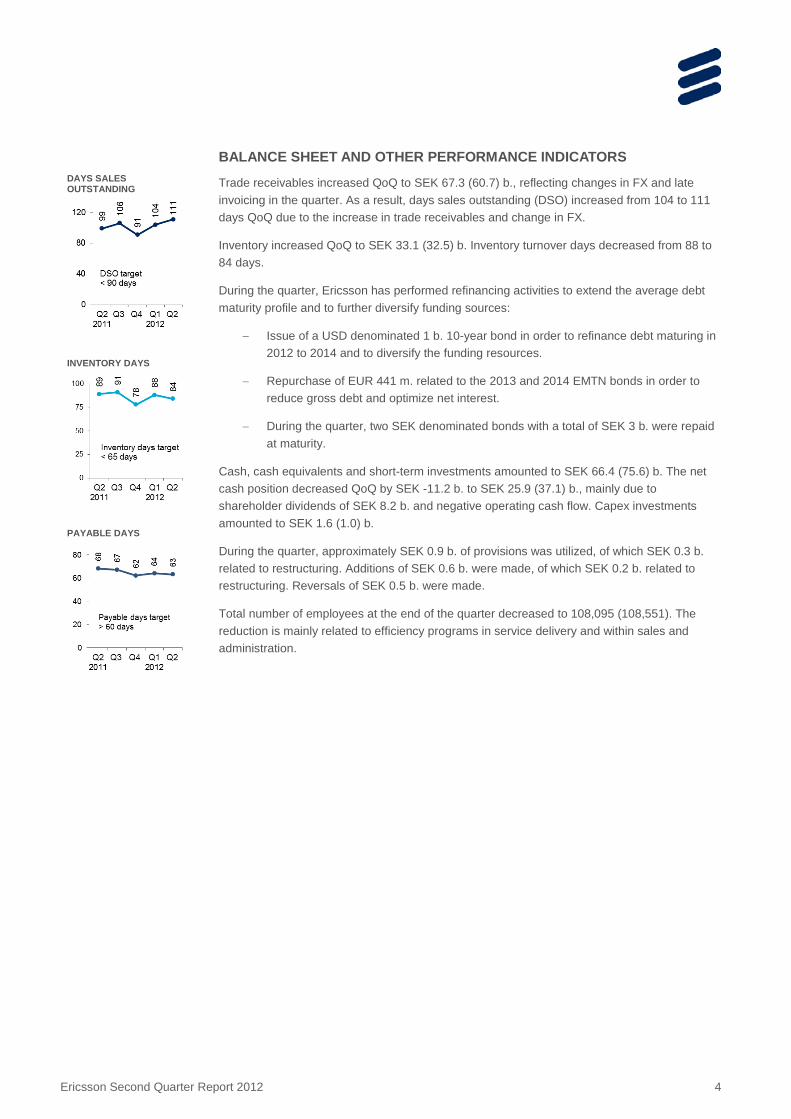
Trade receivables increased QoQ to SEK 67.3 (60.7) b., reflecting changes in FX and late invoicing in the quarter. As a result, days sales outstanding (DSO) increased from 104 to 111 days QoQ due to the increase in trade receivables and change in FX.
Inventory increased QoQ to SEK 33.1 (32.5) b. Inventory turnover days decreased from 88 to 84 days.
During the quarter, Ericsson has performed refinancing activities to extend the average debt maturity profile and to further diversify funding sources:
− Issue of a USD denominated 1 b. 10-year bond in order to refinance debt maturing in 2012 to 2014 and to diversify the funding resources.
− Repurchase of EUR 441 m. related to the 2013 and 2014 EMTN bonds in order to reduce gross debt and optimize net interest.
− During the quarter, two SEK denominated bonds with a total of SEK 3 b. were repaid at maturity.
Cash, cash equivalents and short-term investments amounted to SEK 66.4 (75.6) b. The net cash position decreased QoQ by SEK -11.2 b. to SEK 25.9 (37.1) b., mainly due to shareholder dividends of SEK 8.2 b. and negative operating cash flow. Capex investments amounted to SEK 1.6 (1.0) b.
During the quarter, approximately SEK 0.9 b. of provisions was utilized, of which SEK 0.3 b. related to restructuring. Additions of SEK 0.6 b. were made, of which SEK 0.2 b. related to restructuring. Reversals of SEK 0.5 b. were made.
Total number of employees at the end of the quarter decreased to 108,095 (108,551). The reduction is mainly related to efficiency programs in service delivery and within sales and administration.
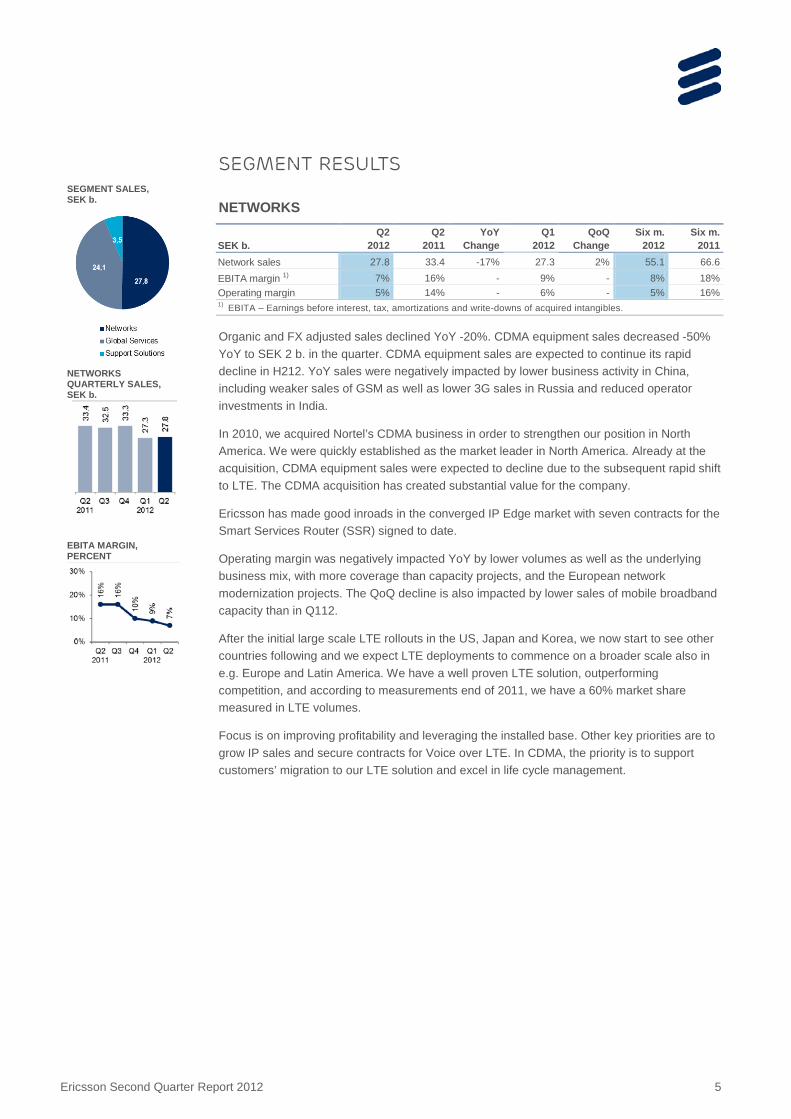
Organic and FX adjusted sales declined YoY -20%. CDMA equipment sales decreased -50% YoY to SEK 2 b. in the quarter. CDMA equipment sales are expected to continue its rapid decline in H212. YoY sales were negatively impacted by lower business activity in China, including weaker sales of GSM as well as lower 3G sales in Russia and reduced operator investments in India.
In 2010, we acquired Nortel’s CDMA business in order to strengthen our position in North America. We were quickly established as the market leader in North America. Already at the acquisition, CDMA equipment sales were expected to decline due to the subsequent rapid shift to LTE. The CDMA acquisition has created substantial value for the company.
Ericsson has made good inroads in the converged IP Edge market with seven contracts for the Smart Services Router (SSR) signed to date.
Operating margin was negatively impacted YoY by lower volumes as well as the underlying business mix, with more coverage than capacity projects, and the European network modernization projects. The QoQ decline is also impacted by lower sales of mobile broadband capacity than in Q112.
After the initial large scale LTE rollouts in the US, Japan and Korea, we now start to see other countries following and we expect LTE deployments to commence on a broader scale also in e.g. Europe and Latin America. We have a well proven LTE solution, outperforming competition, and according to measurements end of 2011, we have a 60% market share measured in LTE volumes.
Focus is on improving profitability and leveraging the installed base. Other key priorities are to grow IP sales and secure contracts for Voice over LTE. In CDMA, the priority is to support customers’ migration to our LTE solution and excel in life cycle management.
Of which Professional Services 14% 13% - 14% - 14% 13% Of which Network Rollout -10% -11% - -11% - -10% -9%
Operating margin 6% 5% - 6% - 6% 6% Of which Professional Services 13% 12% - 13% - 13% 12% Of which Network Rollout -11% -11% - -11% - -11% -9%
1) EBITA – Earnings before interest, tax, amortizations and write-downs of acquired intangibles.
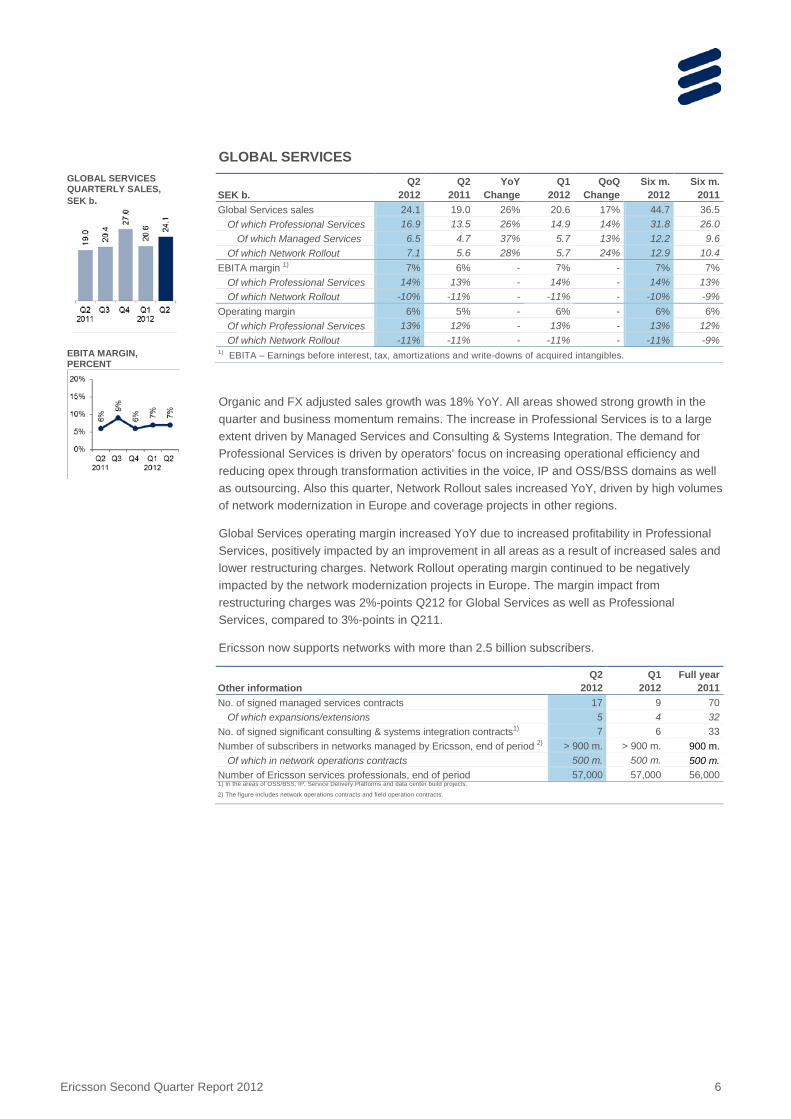
Organic and FX adjusted sales growth was 18% YoY. All areas showed strong growth in the quarter and business momentum remains. The increase in Professional Services is to a large extent driven by Managed Services and Consulting & Systems Integration. The demand for Professional Services is driven by operators’ focus on increasing operational efficiency and reducing opex through transformation activities in the voice, IP and OSS/BSS domains as well as outsourcing. Also this quarter, Network Rollout sales increased YoY, driven by high volumes of network modernization in Europe and coverage projects in other regions.
Global Services operating margin increased YoY due to increased profitability in Professional Services, positively impacted by an improvement in all areas as a result of increased sales and lower restructuring charges. Network Rollout operating margin continued to be negatively impacted by the network modernization projects in Europe. The margin impact from restructuring charges was 2%-points Q212 for Global Services as well as Professional Services, compared to 3%-points in Q211.
Ericsson now supports networks with more than 2.5 billion subscribers.
Other information Q2
2012 Q1
2012 Full year
2011 No. of signed managed services contracts 17 9 70
Of which expansions/extensions 5 4 32 No. of signed significant consulting & systems integration contracts1) 7 6 33 Number of subscribers in networks managed by Ericsson, end of period 2) > 900 m. > 900 m. 900 m.
Of which in network operations contracts 500 m. 500 m. 500 m. Number of Ericsson services professionals, end of period 57,000 57,000 56,000 1) In the areas of OSS/BSS, IP, Service Delivery Platforms and data center build projects.
2) The figure includes network operations contracts and field operation contracts.
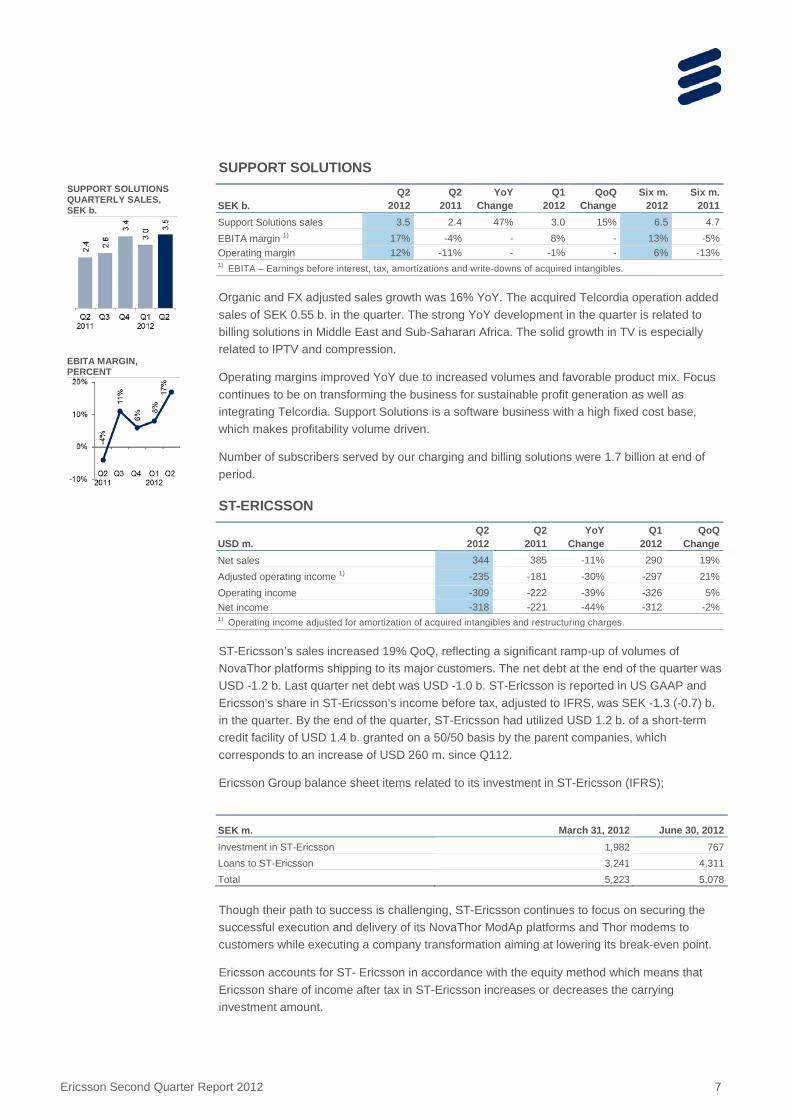
Organic and FX adjusted sales growth was 16% YoY. The acquired Telcordia operation added sales of SEK 0.55 b. in the quarter. The strong YoY development in the quarter is related to billing solutions in Middle East and Sub-Saharan Africa. The solid growth in TV is especially related to IPTV and compression.
Operating margins improved YoY due to increased volumes and favorable product mix. Focus continues to be on transforming the business for sustainable profit generation as well as integrating Telcordia. Support Solutions is a software business with a high fixed cost base, which makes profitability volume driven.
Number of subscribers served by our charging and billing solutions were 1.7 billion at end of period.
ST-ERICSSON
USD m. Q2
2012 Q2
2011 YoY
Change Q1
2012 QoQ
Change Net sales 344 385 -11% 290 19% Adjusted operating income 1) -235 -181 -30% -297 21% Operating income -309 -222 -39% -326 5% Net income -318 -221 -44% -312 -2% 1) Operating income adjusted for amortization of acquired intangibles and restructuring charges.
ST-Ericsson’s sales increased 19% QoQ, reflecting a significant ramp-up of volumes of NovaThor platforms shipping to its major customers. The net debt at the end of the quarter was USD -1.2 b. Last quarter net debt was USD -1.0 b. ST-Ericsson is reported in US GAAP and Ericsson’s share in ST-Ericsson’s income before tax, adjusted to IFRS, was SEK -1.3 (-0.7) b. in the quarter. By the end of the quarter, ST-Ericsson had utilized USD 1.2 b. of a short-term credit facility of USD 1.4 b. granted on a 50/50 basis by the parent companies, which corresponds to an increase of USD 260 m. since Q112.
Ericsson Group balance sheet items related to its investment in ST-Ericsson (IFRS);
SEK m. March 31, 2012 June 30, 2012 Investment in ST-Ericsson 1,982 767 Loans to ST-Ericsson 3,241 4,311 Total 5,223 5,078 Though their path to success is challenging, ST-Ericsson continues to focus on securing the successful execution and delivery of its NovaThor ModAp platforms and Thor modems to customers while executing a company transformation aiming at lowering its break-even point.
Ericsson accounts for ST- Ericsson in accordance with the equity method which means that Ericsson share of income after tax in ST-Ericsson increases or decreases the carrying investment amount.
SUPPORT SOLUTIONS QUARTERLY SALES, SEK b.
EBITA MARGIN, PERCENT
Ericsson Second Quarter Report 2012 8
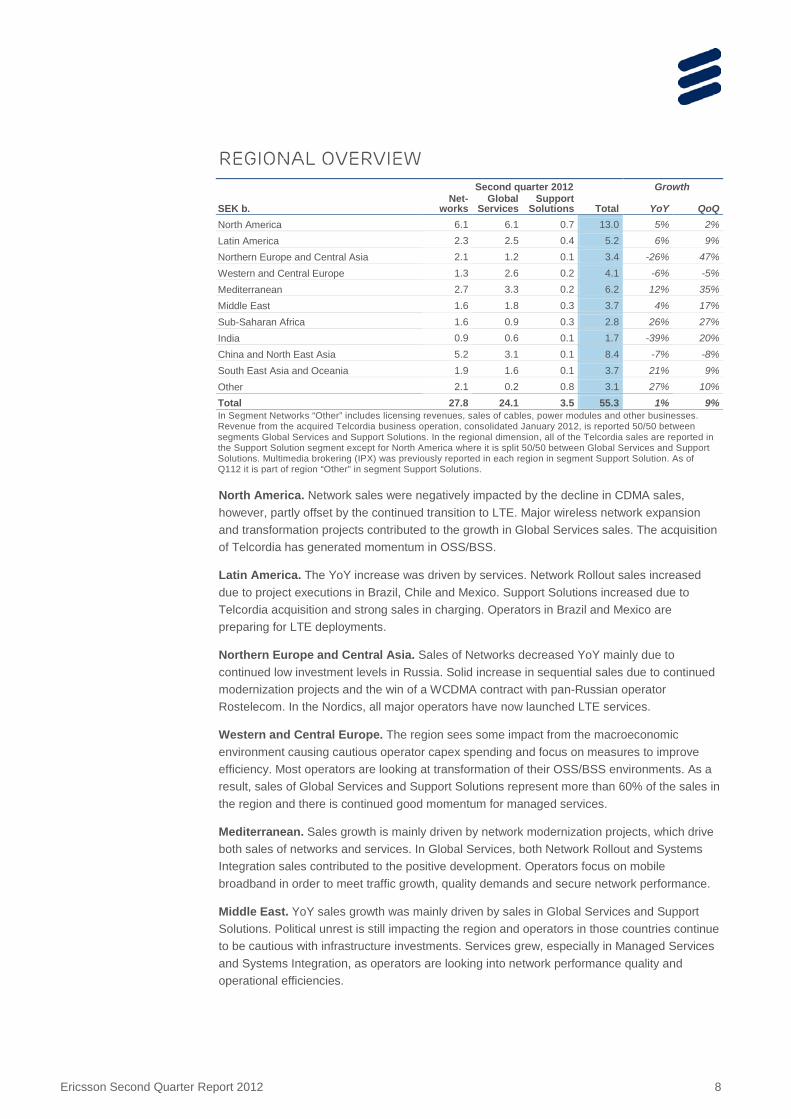
Regional Overview Second quarter 2012 Growth
SEK b. Net-
works Global
Services Support
Solutions Total YoY QoQ North America 6.1 6.1 0.7 13.0 5% 2% Latin America 2.3 2.5 0.4 5.2 6% 9% Northern Europe and Central Asia 2.1 1.2 0.1 3.4 -26% 47% Western and Central Europe 1.3 2.6 0.2 4.1 -6% -5% Mediterranean 2.7 3.3 0.2 6.2 12% 35% Middle East 1.6 1.8 0.3 3.7 4% 17% Sub-Saharan Africa 1.6 0.9 0.3 2.8 26% 27% India 0.9 0.6 0.1 1.7 -39% 20% China and North East Asia 5.2 3.1 0.1 8.4 -7% -8% South East Asia and Oceania 1.9 1.6 0.1 3.7 21% 9% Other 2.1 0.2 0.8 3.1 27% 10% Total 27.8 24.1 3.5 55.3 1% 9% In Segment Networks “Other” includes licensing revenues, sales of cables, power modules and other businesses. Revenue from the acquired Telcordia business operation, consolidated January 2012, is reported 50/50 between segments Global Services and Support Solutions. In the regional dimension, all of the Telcordia sales are reported in the Support Solution segment except for North America where it is split 50/50 between Global Services and Support Solutions. Multimedia brokering (IPX) was previously reported in each region in segment Support Solution. As of Q112 it is part of region “Other” in segment Support Solutions.
North America. Network sales were negatively impacted by the decline in CDMA sales, however, partly offset by the continued transition to LTE. Major wireless network expansion and transformation projects contributed to the growth in Global Services sales. The acquisition of Telcordia has generated momentum in OSS/BSS.
Latin America. The YoY increase was driven by services. Network Rollout sales increased due to project executions in Brazil, Chile and Mexico. Support Solutions increased due to Telcordia acquisition and strong sales in charging. Operators in Brazil and Mexico are preparing for LTE deployments.
Northern Europe and Central Asia. Sales of Networks decreased YoY mainly due to continued low investment levels in Russia. Solid increase in sequential sales due to continued modernization projects and the win of a WCDMA contract with pan-Russian operator Rostelecom. In the Nordics, all major operators have now launched LTE services.
Western and Central Europe. The region sees some impact from the macroeconomic environment causing cautious operator capex spending and focus on measures to improve efficiency. Most operators are looking at transformation of their OSS/BSS environments. As a result, sales of Global Services and Support Solutions represent more than 60% of the sales in the region and there is continued good momentum for managed services.
Mediterranean. Sales growth is mainly driven by network modernization projects, which drive both sales of networks and services. In Global Services, both Network Rollout and Systems Integration sales contributed to the positive development. Operators focus on mobile broadband in order to meet traffic growth, quality demands and secure network performance.
Middle East. YoY sales growth was mainly driven by sales in Global Services and Support Solutions. Political unrest is still impacting the region and operators in those countries continue to be cautious with infrastructure investments. Services grew, especially in Managed Services and Systems Integration, as operators are looking into network performance quality and operational efficiencies.
Ericsson Second Quarter Report 2012 9
Sub-Saharan Africa. Sales increased YoY and QoQ, driven by increased investments in 2G. 2G investments are expected to level out, while 3G will increase. Mobile broadband penetration is slowly expanding from its low level of 4% today, as low cost smartphones enter the market and the internet connectivity is improving.
India. Some recovery in network capex spend as operators have started focused investments in areas where data traffic is growing. YoY sales decreased due to the strong H111, when the initial 3G deployments peaked. Regulatory uncertainties continue in India.
China and North East Asia. The YoY decrease in Networks is mainly related to lower sales of GSM and generally lower business activity in China, as well as continued transition to LTE in Korea, impacting 3G sales. Services sales were driven by more turnkey projects in Japan. The product mix is rapidly changing towards more of initial LTE deployments and a larger share of services.
South East Asia and Oceania. Networks sales increased YoY in several countries, driven by 3G investments and initial LTE deployments. The QoQ increase is due to capacity investments in Indonesia and deployments in other markets. Global Services reported an increase YoY driven by network rollout and support services aligned with infrastructure investments.
Other. Licensing revenues continued to show a stable development YoY. Also sales of cables, power modules and other businesses are included in “Other”. Multimedia brokering (IPX) was previously reported in each region, but from Q112 it is part of “Other”, under Support Solutions.
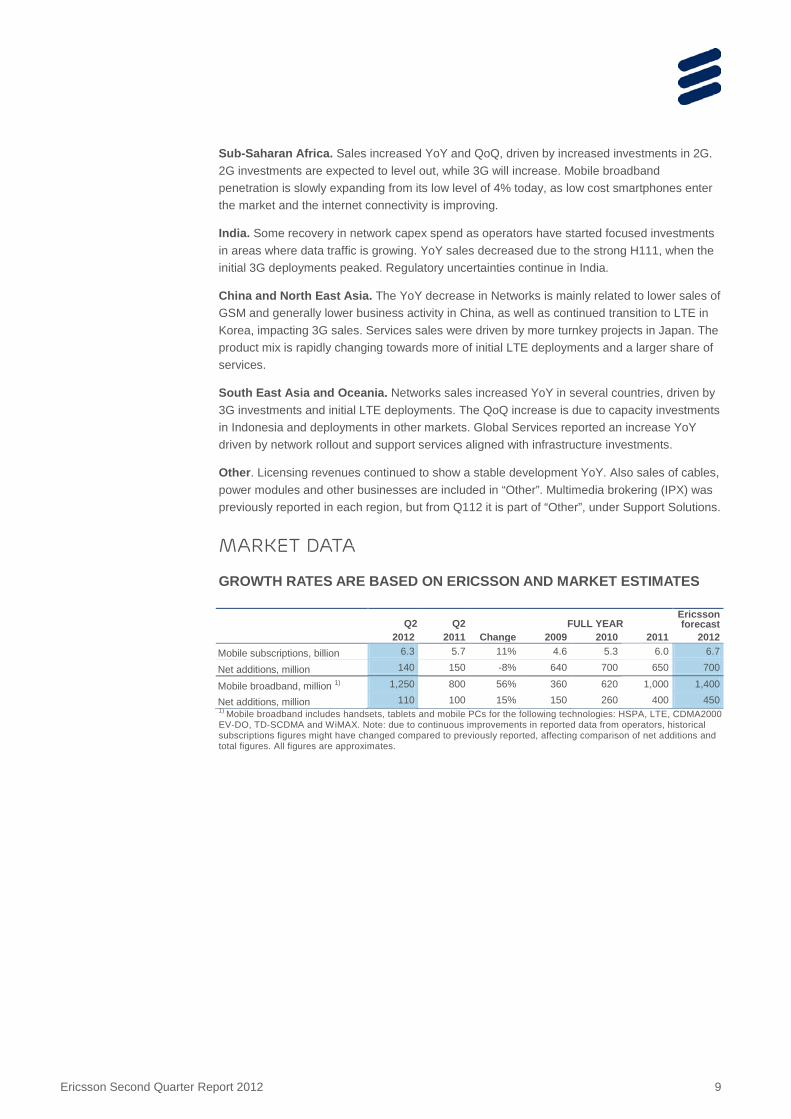
Market data
GROWTH RATES ARE BASED ON ERICSSON AND MARKET ESTIMATES
Net additions, million 140 150 -8% 640 700 650 700
Mobile broadband, million 1) 1,250 800 56% 360 620 1,000 1,400
Net additions, million 110 100 15% 150 260 400 450 1) Mobile broadband includes handsets, tablets and mobile PCs for the following technologies: HSPA, LTE, CDMA2000 EV-DO, TD-SCDMA and WiMAX. Note: due to continuous improvements in reported data from operators, historical subscriptions figures might have changed compared to previously reported, affecting comparison of net additions and total figures. All figures are approximates.
Ericsson Second Quarter Report 2012 10
Parent Company Information Income after financial items was SEK 7.0 (4.7) b. Major changes in the Parent Company’s financial position for the six month period; decreased cash, cash equivalents and short-term investments of SEK 12.8 b., and increased current and non-current receivables from subsidiaries of SEK 10.6 b. During the quarter, the dividend payment of SEK 8.0 b., as decided by the Annual General Meeting, was made. At the end of the quarter, cash, cash equivalents and short-term investments amounted to SEK 43.3 (56.1) b. In the quarter, the Parent Company Telefonaktiebolaget LM Ericsson, borrowed USD 1.0 b. through a SEC-registered bond. Two loans of SEK 1.0 b. and SEK 2.0 b. matured in the quarter. The Parent Company also repurchased two EMTN bonds of EUR 441 m. The net change in gross debt is close to zero. By the end of the quarter, ST-Ericsson had utilized USD 619 million of a short-term credit facility.
In accordance with the conditions of the long-term variable compensation program (LTV) for Ericsson employees, 2,483,350 shares from treasury stock were sold or distributed to employees during the second quarter. The holding of treasury stock at June 30, 2012, was 89,695,956 Class B shares. During the quarter, a stock issue of SEK 0.2 b. and a subsequent repurchase was made for the share-based employee remuneration program. 31.7 million Class C shares were issued and later repurchased as treasury stock. The shares were converted into Class B shares.
Other Information ERICSSON’S NOMINATION COMMITTEE APPOINTED
On June 27, 2012, Ericsson announced the appointment of the Nomination Committee for the Annual General Meeting 2013, in accordance with the Instruction for the Nomination Committee resolved by the Annual General Meeting 2012.
ERICSSON RESOLVES ON AN ACQUISITION OFFER FOR C-SHARES FOR LTV 2012
On May 18, 2012, Ericsson announced that, in accordance with the resolution by the Annual General Meeting 2012, the company would expand its treasury stock in order to provide shares for the Long-Term variable Remuneration Program (LTV) 2012 for employees in Ericsson.
COMPOSITION OF THE BOARD OF DIRECTORS
On May 3, 2012, Ericsson announced that in accordance with the proposal of the Nomination Committee, the Annual General Meeting resolved to re-elect Leif Johansson as Chairman of the Board of Directors and Roxanne S. Austin, Sir Peter L. Bonfield, Börje Ekholm, Ulf J Johansson, Sverker Martin-Löf, Nancy McKinstry, Anders Nyrén, Hans Vestberg, Michelangelo Volpi and Jacob Wallenberg were re-elected as members of the Board of Directors. Alexander Izosimov was elected new member of the Board of Directors. Board members appointed by the unions are Pehr Claesson, Kristina Davidsson and Karin Åberg. Deputy board members appointed by the unions are Rickard Fredriksson, Karin Lennartsson and Roger Svensson.
POST-CLOSING EVENT: CLOSING OF TECHNICOLOR ACQUISITION
On July 3, 2012 Ericsson announced the closing of the acquisition of Technicolor’s Broadcast Services Division. The acquisition brings leading broadcast customers, approximately 900 highly skilled professionals and playout services in France, UK and Netherlands. Purchase price amounted to EUR 19 million and a potential earn-out based on 2015 revenues of the Broadcast Services activity up to EUR 9 million.
Ericsson Second Quarter Report 2012 11
ASSESSMENT OF RISK ENVIRONMENT
Ericsson’s operational and financial risk factors and uncertainties along with our strategies and tactics to mitigate risk exposures or limit unfavorable outcomes are described in our Annual Report 2011. Compared to the risks described in the Annual Report 2011, no material, new or changed risk factors or uncertainties have been identified in the quarter.
Risk factors and uncertainties in focus during the forthcoming nine-month period for the Parent Company and the Ericsson Group include:
• Potential negative effects on operators’ willingness to invest in network development due to a increased uncertainty in the financial markets and a weak economic business environment as well as uncertainty regarding the financial stability of suppliers, for example due to lack of financing, or reduced consumer telecom spending, or increased pressure on us to provide financing;
• Effects on gross margins and/or working capital of the product mix in the Networks segment between sales of upgrades and expansions (mainly software) and new buildouts of coverage (mainly hardware);
• Effects on gross margins of the product mix in the Global Services segment including proportion of new network build-outs and share of new managed services deals with initial transition costs;
• A continued volatile sales pattern in the Support Solutions segment or variability in our overall sales seasonality could make it more difficult to forecast future sales;
• Effects of the ongoing industry consolidation among our customers as well as between our largest competitors, e.g. with postponed investments and intensified price competition as a consequence;
• Execution of the business plan and related capital need of our joint venture ST-Ericsson;
• Changes in foreign exchange rates, in particular USD and EUR;
• Political unrest or instability in certain markets;
• Effects on production and sales from restrictions with respect to timely and adequate supply of materials, components and production capacity and other vital services on competitive terms;
• Natural disasters and other events, affecting business, production, supply and transportation.
Ericsson conducts business in certain countries which are subject to trade restrictions or which are focused on by certain investors. We stringently monitor the compliance with all relevant regulations and trade embargos applicable to us in our dealings with customers operating in such countries. Moreover, Ericsson operates globally in accordance with Group level policies and directives for business ethics and conduct. In no way should our business activities in these countries be construed as supporting a particular political agenda or regime.
Stockholm, July 18, 2012
Telefonaktiebolaget LM Ericsson (publ)
Hans Vestberg, President and CEO
Date for next report: October 26, 2012
Ericsson Second Quarter Report 2012 12
BOARD ASSURANCE The Board of Directors and the CEO certify that the financial report for the six months gives a fair view of the performance of the business, position and profit or loss of the Company and the Group, and describes the principal risks and uncertainties that the Company and the companies in the Group face.
Stockholm, July 18, 2012
Telefonaktiebolaget LM Ericsson (publ)
Org. Nr. 556016-0680
Sverker Martin-Löf Deputy chairman
Leif Johansson Chairman
Jacob Wallenberg Deputy chairman
Roxanne S. Austin Member of the board
Sir Peter L. Bonfield Member of the board
Anders Nyrén Member of the board
Börje Ekholm Member of the board
Ulf J. Johansson Member of the board
Nancy McKinstry Member of the board
Alexander Izosimov Member of the board
Michelangelo Volpi Member of the board
Pehr Claesson Member of the board
Kristina Davidsson Member of the board
Karin Åberg Member of the board
Hans Vestberg Member of the board and
President and CEO
Ericsson Second Quarter Report 2012 13
Auditors’ Review Report We have reviewed this report for the period April 1, 2012, to June 30, 2012, for Telefonaktiebolaget LM Ericsson (publ). The board of directors and the CEO are responsible for the preparation and presentation of this financial information in accordance with IAS 34 and the Swedish Annual Accounts Act. Our responsibility is to express a conclusion on this financial information based on our review.
We conducted our review in accordance with the Swedish Standard on Review Engagements SÖG 2410, Review of Interim Report Performed by the Independent Auditor of the Entity. A review consists of making inquiries, primarily of persons responsible for financial and accounting matters, and applying analytical and other review procedures. A review is substantially less in scope than an audit conducted in accordance with International Standards on Auditing (ISA) and other generally accepted auditing standards in Sweden. The procedures performed in a review do not enable us to obtain assurance that we would become aware of all significant matters that might be identified in an audit. Accordingly, we do not express an audit opinion.
Based on our review, nothing has come to our attention that causes us to believe that the interim report is not prepared, in all material respects, in accordance with IAS 34 and the Swedish Annual Accounts Act, regarding the Group, and with the Swedish Annual Accounts Act, regarding the Parent Company.
Stockholm, July 18, 2012
PricewaterhouseCoopers AB
Peter Nyllinge Johan Engstam Authorized Public Accountant Authorized Public Accountant Auditor in Charge
Ericsson Second Quarter Report 2012 14
Editor’s Note To read the complete report with tables, please go to: www.ericsson.com/res/investors/docs/q-reports/2012/6month12-en.pdf
Ericsson invites media, investors and analysts to a press conference at the Ericsson Studio, Grönlandsgången 4, Stockholm, at 09.00 (CET), July 18, 2012. An analysts, investors and media conference call will begin at 14.00 (CET).
Live webcast of the press conference and conference call as well as supporting slides will be available at www.ericsson.com/press and www.ericsson.com/investors
Video material will be published during the day on www.ericsson.com/broadcast_room
Safe Harbor Statement of Ericsson under the US Private Securities Litigation Reform Act of 1995;
All statements made or incorporated by reference in this release, other than statements or characterizations of historical facts, are forward-looking statements. These forward-looking statements are based on our current expectations, estimates and projections about our industry, management’s beliefs and certain assumptions made by us. Forward-looking statements can often be identified by words such as “anticipates”, “expects”, “intends”, “plans”, “predicts”, “believes”, “seeks”, “estimates”, “may”, “will”, “should”, “would”, “potential”, “continue”, and variations or negatives of these words, and include, among others, statements regarding: (i) strategies, outlook and growth prospects; (ii) positioning to deliver future plans and to realize potential for future growth; (iii) liquidity and capital resources and expenditure, and our credit ratings; (iv) growth in demand for our products and services; (v) our joint venture activities; (vi) economic outlook and industry trends; (vii) developments of our markets; (viii) the impact of regulatory initiatives; (ix) research and development expenditures; (x) the strength of our competitors; (xi) future cost savings; (xii) plans to launch new products and services; (xiii) assessments of risks; (xiv) integration of acquired businesses; (xv) compliance with rules and regulations and (xvi) infringements of intellectual property rights of others.
In addition, any statements that refer to expectations, projections or other characterizations of future events or circumstances, including any underlying assumptions, are forward-looking statements. These forward-looking statements speak only as of the date hereof and are based upon the information available to us at this time. Such information is subject to change, and we will not necessarily inform you of such changes. These statements are not guarantees of future performance and are subject to risks, uncertainties and assumptions that are difficult to predict. Therefore, our actual results could differ materially and adversely from those expressed in any forward-looking statements as a result of various factors. Important factors that may cause such a difference for Ericsson include, but are not limited to: (i) material adverse changes in the markets in which we operate or in global economic conditions; (ii) increased product and price competition; (iii) reductions in capital expenditure by network operators; (iv) the cost of technological innovation and increased expenditure to improve quality of service; (v) significant changes in market share for our principal products and services; (vi) foreign exchange rate or interest rate fluctuations; and (vii) the successful implementation of our business and operational initiatives.
Ericsson Second Quarter Report 2012 16
Financial Statements and Additional Information Financial statements Page Consolidated income statement 17 Statement of comprehensive income 17 Consolidated balance sheet 18 Consolidated statement of cash flows 19 Consolidated statement of changes in equity 20 Consolidated income statement - isolated quarters 21 Consolidated statement of cash flows - isolated quarters 22 Parent Company income statement 23 Parent Company balance sheet 23 Additional information Page Accounting policies 24 Net sales by segment by quarter 25 Sales growth for comparable units, adjusted for currency effects and hedging 25 Operating income by segment by quarter 26 Operating margin by segment by quarter 26 EBITA by segment by quarter 27 EBITA margin by segment by quarter 27 Net sales by region by quarter 28 Net sales by region by quarter (cont.) 29 Top 5 countries in sales 29 Net sales by region by segment 30 Provisions 31 Number of employees 31 Information on investments in assets subject to depreciation, amortization and impairment and write-downs 31 Other information 32 Ericsson planning assumptions for year 2012 32 Restructuring charges by function 33 Restructuring charges by segment 33
Ericsson Second Quarter Report 2012 17
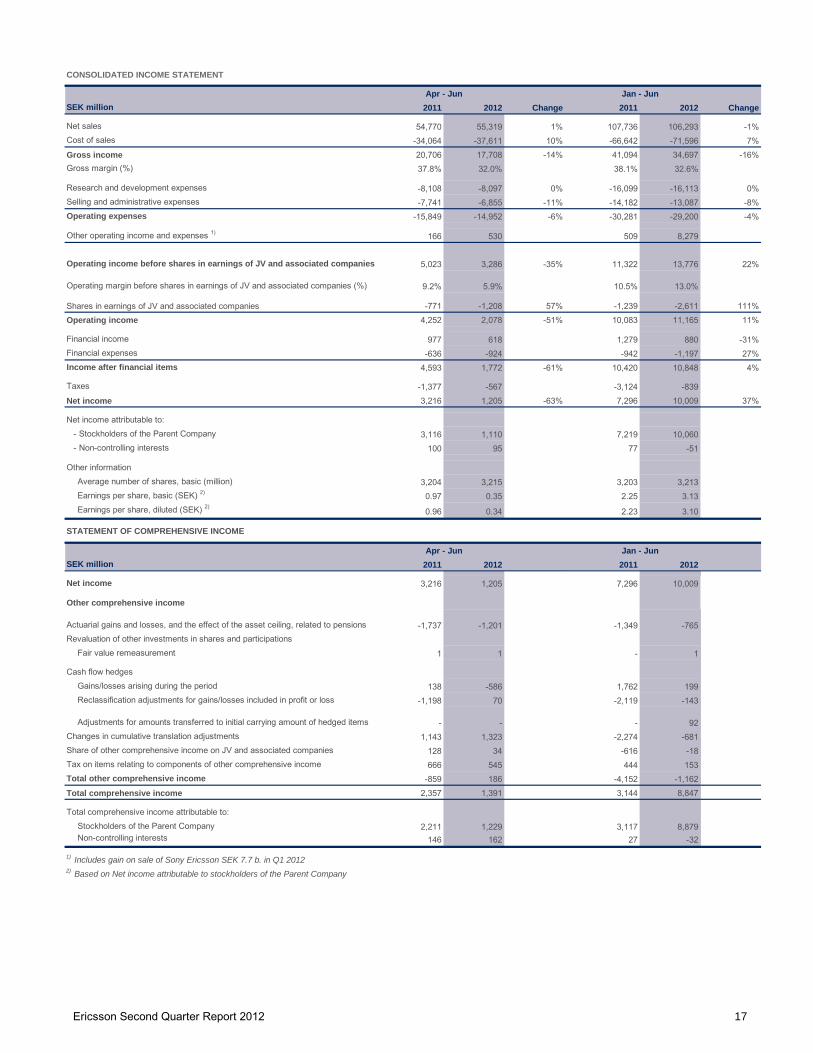
SEK million 2011 2012 Change 2011 2012 Change
Net sales 54,770 55,319 1% 107,736 106,293 -1%Cost of sales -34,064 -37,611 10% -66,642 -71,596 7%Gross income 20,706 17,708 -14% 41,094 34,697 -16%Gross margin (%) 37.8% 32.0% 38.1% 32.6%
Research and development expenses -8,108 -8,097 0% -16,099 -16,113 0%Selling and administrative expenses -7,741 -6,855 -11% -14,182 -13,087 -8%Operating expenses -15,849 -14,952 -6% -30,281 -29,200 -4%
Other operating income and expenses 1) 166 530 509 8,279
Operating income before shares in earnings of JV and associated companies 5,023 3,286 -35% 11,322 13,776 22%
Operating margin before shares in earnings of JV and associated companies (%) 9.2% 5.9% 10.5% 13.0%
Shares in earnings of JV and associated companies -771 -1,208 57% -1,239 -2,611 111%Operating income 4,252 2,078 -51% 10,083 11,165 11%
Net income attributable to: - Stockholders of the Parent Company 3,116 1,110 7,219 10,060 - Non-controlling interests 100 95 77 -51
Other informationAverage number of shares, basic (million) 3,204 3,215 3,203 3,213Earnings per share, basic (SEK) 2) 0.97 0.35 2.25 3.13Earnings per share, diluted (SEK) 2)
0.96 0.34 2.23 3.10
STATEMENT OF COMPREHENSIVE INCOME
SEK million 2011 2012 2011 2012
Net income 3,216 1,205 7,296 10,009
Other comprehensive income
Actuarial gains and losses, and the effect of the asset ceiling, related to pensions -1,737 -1,201 -1,349 -765Revaluation of other investments in shares and participations
Fair value remeasurement 1 1 - 1
Cash flow hedges Gains/losses arising during the period 138 -586 1,762 199Reclassification adjustments for gains/losses included in profit or loss -1,198 70 -2,119 -143
Adjustments for amounts transferred to initial carrying amount of hedged items - - - 92Changes in cumulative translation adjustments 1,143 1,323 -2,274 -681Share of other comprehensive income on JV and associated companies 128 34 -616 -18Tax on items relating to components of other comprehensive income 666 545 444 153Total other comprehensive income -859 186 -4,152 -1,162Total comprehensive income 2,357 1,391 3,144 8,847
Total comprehensive income attributable to:Stockholders of the Parent Company 2,211 1,229 3,117 8,879Non-controlling interests 146 162 27 -32
1) Includes gain on sale of Sony Ericsson SEK 7.7 b. in Q1 2012
CONSOLIDATED INCOME STATEMENT
Apr - Jun
Apr - Jun
2) Based on Net income attributable to stockholders of the Parent Company
Jan - Jun
Jan - Jun
Ericsson Second Quarter Report 2012 18
CONSOLIDATED BALANCE SHEET
Dec 31 Mar 31 Jun 30SEK million 2011 2012 2012
ASSETSNon-current assets Intangible assets
Capitalized development expenses 3,523 3,529 3,795Goodwill 27,438 31,245 31,342Intellectual property rights, brands and other intangible assets 13,083 17,263 17,616
Property, plant and equipment 10,788 11,268 11,435
Financial assetsEquity in JV and associated companies 5,965 3,271 2,110Other investments in shares and participations 2,199 2,122 2,207Customer financing, non-current 1,400 1,139 1,340Other financial assets, non-current 4,117 5,747 4,932
Current liabilitiesProvisions, current 5,985 5,722 5,113Borrowings, current 7,765 6,229 7,583Trade payables 25,309 22,283 24,410Other current liabilities 57,970 55,260 55,462
97,029 89,494 92,568
Total equity and liabilities 280,349 280,817 277,678
Of which interest-bearing liabilities and post-employment benefits 41,037 38,537 40,475
1) Including loan to ST-Ericsson of SEK 4,311 million as of June 30, 2012(SEK 3,241 million as of March 31, 2012, SEK 2,759 million as of December 31, 2011)
Ericsson Second Quarter Report 2012 19
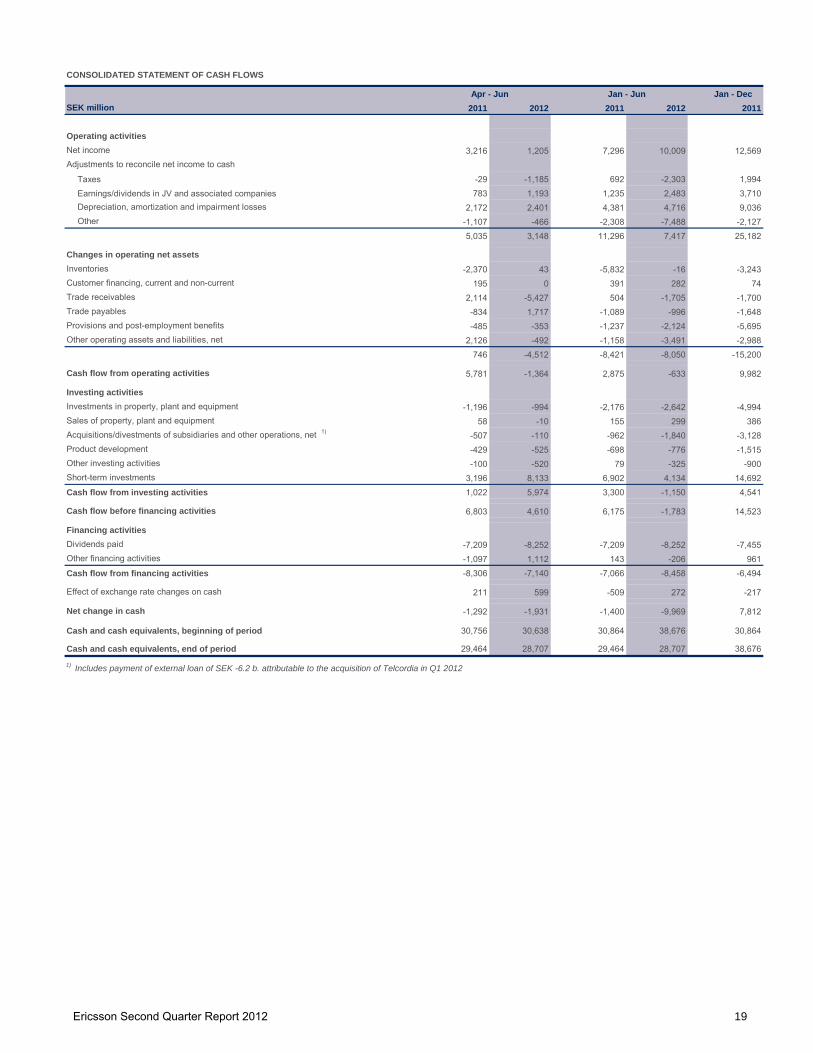
Jan - DecSEK million 2011 2012 2011 2012 2011
Operating activitiesNet income 3,216 1,205 7,296 10,009 12,569Adjustments to reconcile net income to cash
Taxes -29 -1,185 692 -2,303 1,994Earnings/dividends in JV and associated companies 783 1,193 1,235 2,483 3,710Depreciation, amortization and impairment losses 2,172 2,401 4,381 4,716 9,036Other -1,107 -466 -2,308 -7,488 -2,127
5,035 3,148 11,296 7,417 25,182
Changes in operating net assetsInventories -2,370 43 -5,832 -16 -3,243Customer financing, current and non-current 195 0 391 282 74Trade receivables 2,114 -5,427 504 -1,705 -1,700Trade payables -834 1,717 -1,089 -996 -1,648Provisions and post-employment benefits -485 -353 -1,237 -2,124 -5,695Other operating assets and liabilities, net 2,126 -492 -1,158 -3,491 -2,988
746 -4,512 -8,421 -8,050 -15,200
Cash flow from operating activities 5,781 -1,364 2,875 -633 9,982
Investing activitiesInvestments in property, plant and equipment -1,196 -994 -2,176 -2,642 -4,994Sales of property, plant and equipment 58 -10 155 299 386Acquisitions/divestments of subsidiaries and other operations, net 1) -507 -110 -962 -1,840 -3,128Product development -429 -525 -698 -776 -1,515Other investing activities -100 -520 79 -325 -900Short-term investments 3,196 8,133 6,902 4,134 14,692Cash flow from investing activities 1,022 5,974 3,300 -1,150 4,541
Cash flow before financing activities 6,803 4,610 6,175 -1,783 14,523
Net income attributable to: - Stockholders of the Parent Company 4,103 3,116 3,821 1,154 8,950 1,110 - Non-controlling interests -23 100 -39 337 -146 95
Other informationAverage number of shares, basic (million) 3,202 3,204 3,207 3,209 3,212 3,215Earnings per share, basic (SEK) 2) 1.28 0.97 1.19 0.36 2.79 0.35Earnings per share, diluted (SEK) 2)
1.27 0.96 1.18 0.36 2.76 0.34
1) Includes gain on sale of Sony Ericsson SEK 7.7 b. in Q1 2012
CONSOLIDATED INCOME STATEMENT – ISOLATED QUARTERS
2012
2) Based on Net income attributable to stockholders of the Parent Company
2011
Ericsson Second Quarter Report 2012 22
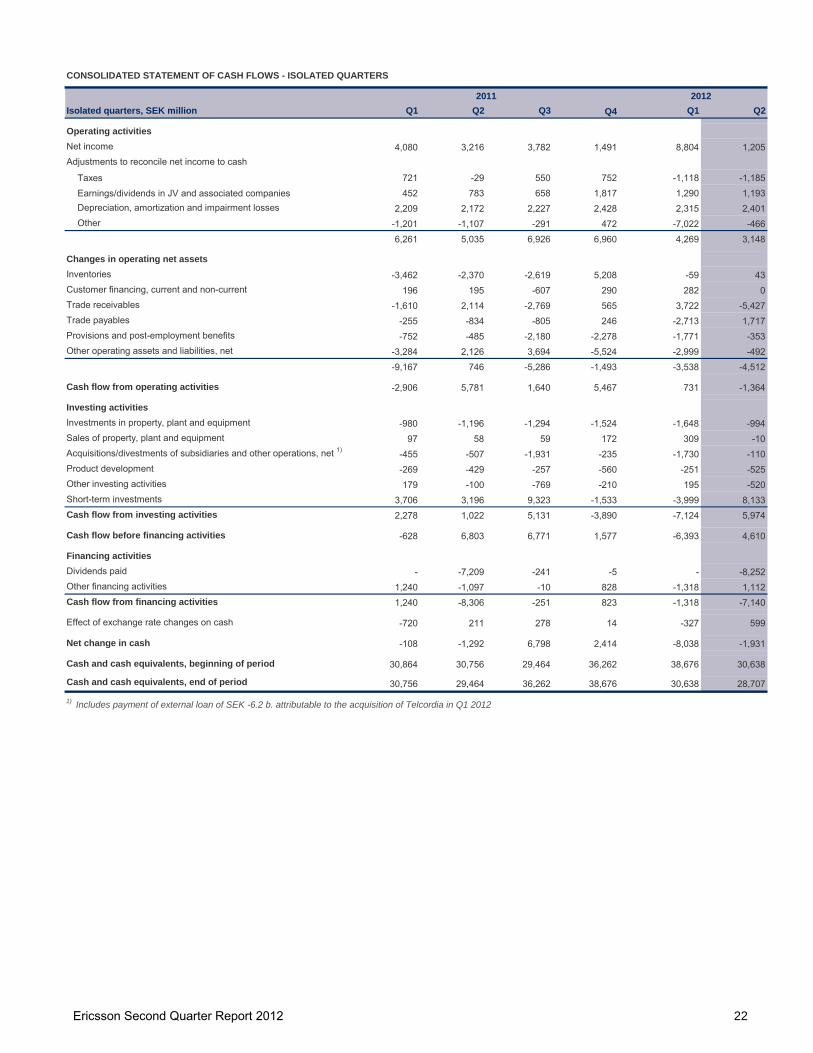
Isolated quarters, SEK million Q1 Q2 Q3 Q4 Q1 Q2
Operating activitiesNet income 4,080 3,216 3,782 1,491 8,804 1,205Adjustments to reconcile net income to cash
Effect of exchange rate changes on cash -720 211 278 14 -327 599
Net change in cash -108 -1,292 6,798 2,414 -8,038 -1,931
Cash and cash equivalents, beginning of period 30,864 30,756 29,464 36,262 38,676 30,638
Cash and cash equivalents, end of period 30,756 29,464 36,262 38,676 30,638 28,707
1) Includes payment of external loan of SEK -6.2 b. attributable to the acquisition of Telcordia in Q1 2012
CONSOLIDATED STATEMENT OF CASH FLOWS - ISOLATED QUARTERS
20122011
Ericsson Second Quarter Report 2012 23
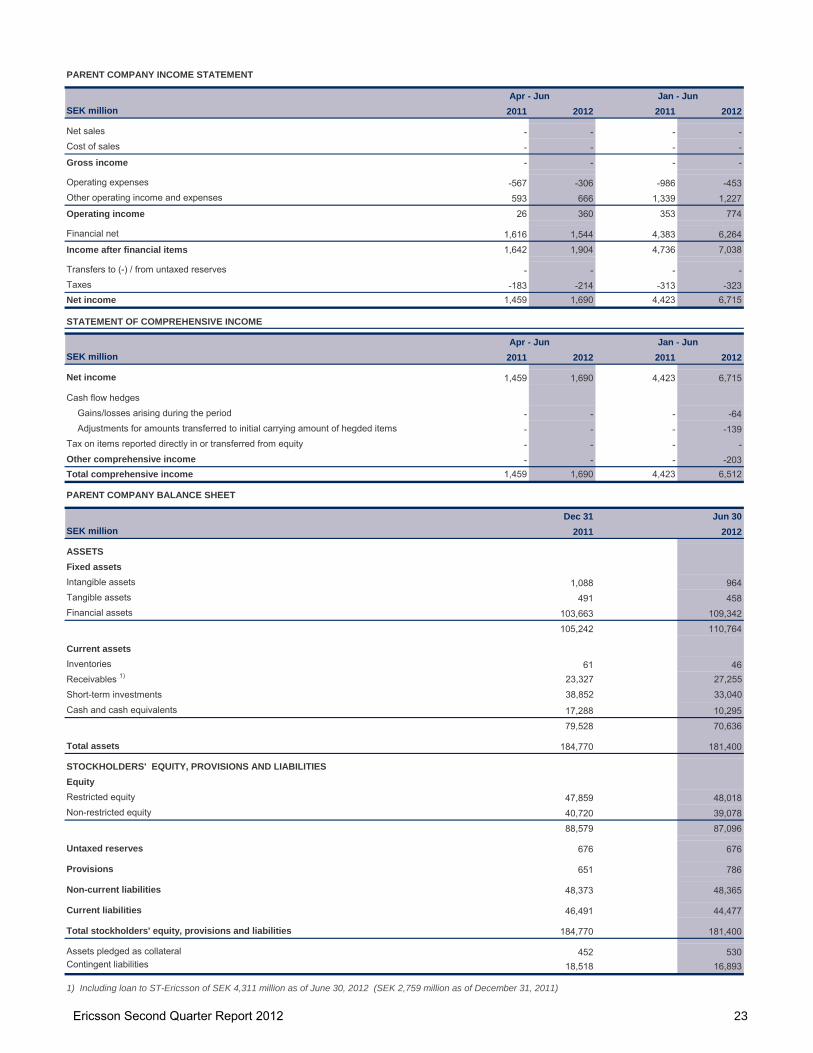
PARENT COMPANY INCOME STATEMENT
SEK million 2011 2012 2011 2012
Net sales - - - -Cost of sales - - - -Gross income - - - -
Operating expenses -567 -306 -986 -453Other operating income and expenses 593 666 1,339 1,227Operating income 26 360 353 774
Financial net 1,616 1,544 4,383 6,264Income after financial items 1,642 1,904 4,736 7,038
Transfers to (-) / from untaxed reserves - - - -Taxes -183 -214 -313 -323Net income 1,459 1,690 4,423 6,715
SEK million 2011 2012 2011 2012
Net income 1,459 1,690 4,423 6,715
Cash flow hedges Gains/losses arising during the period - - - -64Adjustments for amounts transferred to initial carrying amount of hegded items - - - -139
Tax on items reported directly in or transferred from equity - - - -Other comprehensive income - - - -203Total comprehensive income 1,459 1,690 4,423 6,512
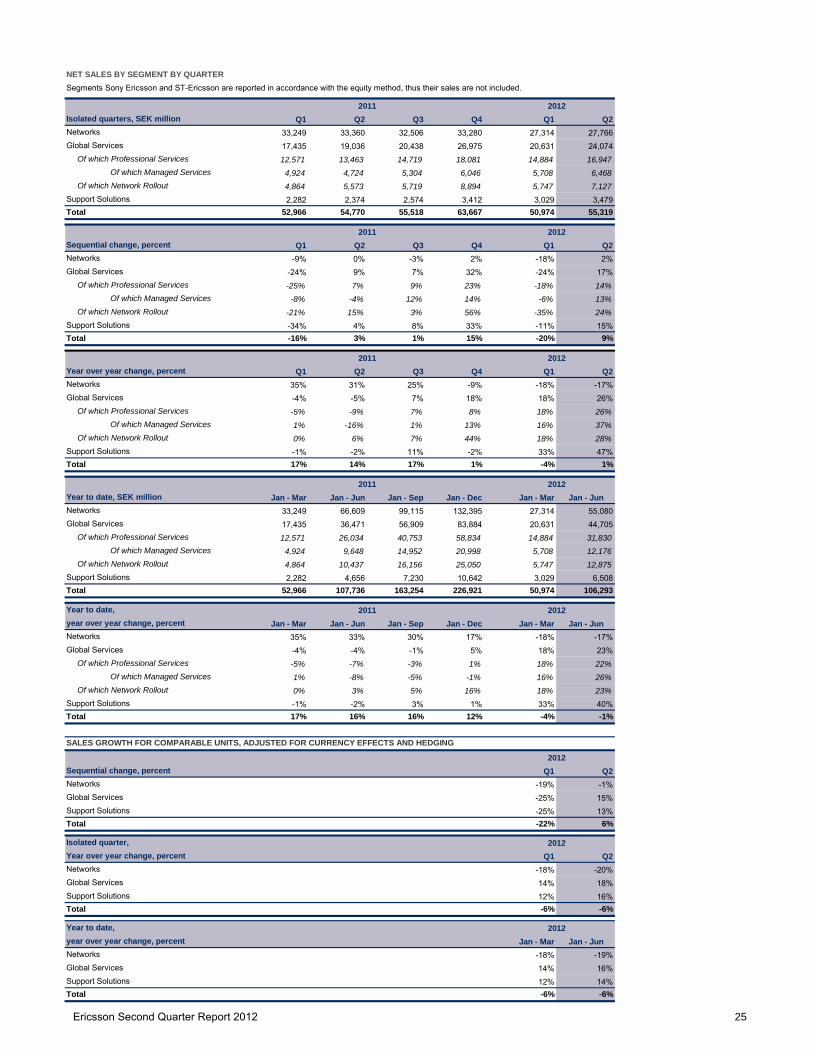
Year to date, SEK million Jan - Mar Jan - Jun Jan - Sep Jan - Dec Jan - Mar Jan - JunNetworks 33,249 66,609 99,115 132,395 27,314 55,080Global Services 17,435 36,471 56,909 83,884 20,631 44,705
Of which Professional Services 12,571 26,034 40,753 58,834 14,884 31,830Of which Managed Services 4,924 9,648 14,952 20,998 5,708 12,176
Year to date,year over year change, percent Jan - Mar Jan - Jun Jan - Sep Jan - Dec Jan - Mar Jan - JunNetworks 35% 33% 30% 17% -18% -17%Global Services -4% -4% -1% 5% 18% 23%
Of which Professional Services -5% -7% -3% 1% 18% 22%Of which Managed Services 1% -8% -5% -1% 16% 26%
Isolated quarter,Year over year change, percent Q1 Q2Networks -18% -20%Global Services 14% 18%Support Solutions 12% 16%Total -6% -6%
Year to date,year over year change, percent Jan - Mar Jan - JunNetworks -18% -19%Global Services 14% 16%Support Solutions 12% 14%Total -6% -6%
2012
2012
2012
2011
NET SALES BY SEGMENT BY QUARTERSegments Sony Ericsson and ST-Ericsson are reported in accordance with the equity method, thus their sales are not included.
2011 2012
2011 2012
2011
2012
SALES GROWTH FOR COMPARABLE UNITS, ADJUSTED FOR CURRENCY EFFECTS AND HEDGING
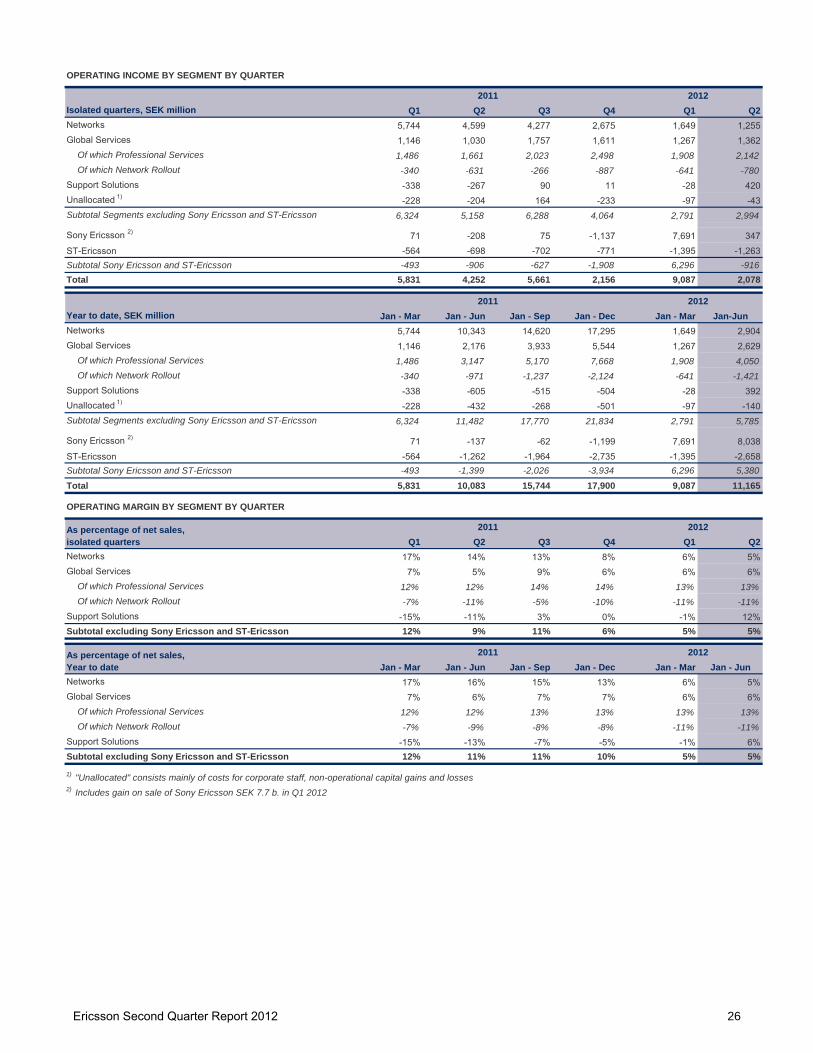
Of which Professional Services 1,486 1,661 2,023 2,498 1,908 2,142Of which Network Rollout -340 -631 -266 -887 -641 -780
Support Solutions -338 -267 90 11 -28 420Unallocated 1) -228 -204 164 -233 -97 -43Subtotal Segments excluding Sony Ericsson and ST-Ericsson 6,324 5,158 6,288 4,064 2,791 2,994
Sony Ericsson 2) 71 -208 75 -1,137 7,691 347ST-Ericsson -564 -698 -702 -771 -1,395 -1,263Subtotal Sony Ericsson and ST-Ericsson -493 -906 -627 -1,908 6,296 -916Total 5,831 4,252 5,661 2,156 9,087 2,078
Year to date, SEK million Jan - Mar Jan - Jun Jan - Sep Jan - Dec Jan - Mar Jan-JunNetworks 5,744 10,343 14,620 17,295 1,649 2,904Global Services 1,146 2,176 3,933 5,544 1,267 2,629
Of which Professional Services 1,486 3,147 5,170 7,668 1,908 4,050Of which Network Rollout -340 -971 -1,237 -2,124 -641 -1,421
Support Solutions -338 -605 -515 -504 -28 392Unallocated 1) -228 -432 -268 -501 -97 -140Subtotal Segments excluding Sony Ericsson and ST-Ericsson 6,324 11,482 17,770 21,834 2,791 5,785
Sony Ericsson 2) 71 -137 -62 -1,199 7,691 8,038ST-Ericsson -564 -1,262 -1,964 -2,735 -1,395 -2,658Subtotal Sony Ericsson and ST-Ericsson -493 -1,399 -2,026 -3,934 6,296 5,380
Of which Professional Services 1,597 1,760 2,111 2,583 2,086 2,320Of which Network Rollout -319 -610 -244 -863 -622 -726
Support Solutions -163 -93 270 195 236 608Unallocated 1) -226 -204 165 -203 -96 -42Subtotal Segments excluding Sony Ericsson and ST-Ericsson 7,460 6,270 7,425 5,149 3,947 4,154
Sony Ericsson 2) 71 -208 75 -1,137 7,691 347ST-Ericsson -564 -698 -702 -771 -1,395 -1,263Subtotal Sony Ericsson and ST-Ericsson -493 -906 -627 -1,908 6,296 -916Total 6,967 5,364 6,798 3,241 10,243 3,238
Year to date, SEK million Jan - Mar Jan - Jun Jan - Sep Jan - Dec Jan - Mar Jan - JunNetworks 6,571 11,988 17,111 20,548 2,343 4,337Global Services 1,278 2,428 4,295 6,015 1,464 3,058
Of which Professional Services 1,597 3,357 5,468 8,051 2,086 4,406Of which Network Rollout -319 -929 -1,173 -2,036 -622 -1,348
Support Solutions -163 -256 14 209 236 844Unallocated 1) -226 -430 -265 -468 -96 -138Subtotal Segments excluding Sony Ericsson and ST-Ericsson 7,460 13,730 21,155 26,304 3,947 8,101
Sony Ericsson 2) 71 -137 -62 -1,199 7,691 8,038ST-Ericsson -564 -1,262 -1,964 -2,735 -1,395 -2,658Subtotal Sony Ericsson and ST-Ericsson -493 -1,399 -2,026 -3,934 6,296 5,380Total 6,967 12,331 19,129 22,370 10,243 13,481
Of which Professional Services 13% 13% 14% 14% 14% 14%Of which Network Rollout -7% -11% -4% -10% -11% -10%
Support Solutions -7% -4% 11% 6% 8% 17%Subtotal excluding Sony Ericsson and ST-Ericsson 14% 11% 13% 8% 8% 8%
Jan - Mar Jan - Jun Jan - Sep Jan - Dec Jan - Mar Jan - JunNetworks 20% 18% 17% 16% 9% 8%Global Services 7% 7% 8% 7% 7% 7%
Of which Professional Services 13% 13% 13% 14% 14% 14%Of which Network Rollout -7% -9% -7% -8% -11% -10%
Support Solutions -7% -5% 0% 2% 8% 13%Subtotal excluding Sony Ericsson and ST-Ericsson 14% 13% 13% 12% 8% 8%
EBITA BY SEGMENT BY QUARTER
2011
2011
2012
2012
EBITA MARGIN BY SEGMENT BY QUARTER
As percentage of net sales, isolated quarters
2011
2011
2) Includes gain on sale of Sony Ericsson SEK 7.7 b. in Q1 2012
As percentage of net sales, Year to date
1) "Unallocated" consists mainly of costs for corporate staff, non-operational capital gains and losses
2012
2012
Ericsson Second Quarter Report 2012 28
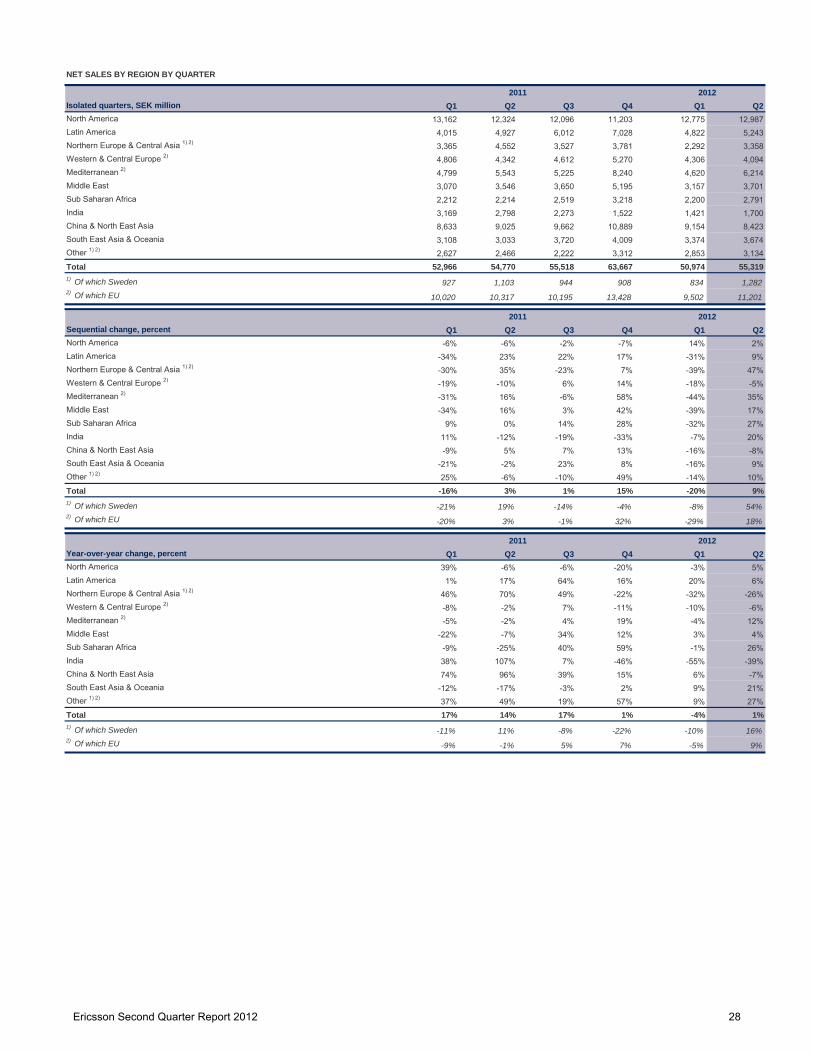
Isolated quarters, SEK million Q1 Q2 Q3 Q4 Q1 Q2North America 13,162 12,324 12,096 11,203 12,775 12,987Latin America 4,015 4,927 6,012 7,028 4,822 5,243Northern Europe & Central Asia 1) 2) 3,365 4,552 3,527 3,781 2,292 3,358Western & Central Europe 2) 4,806 4,342 4,612 5,270 4,306 4,094Mediterranean 2) 4,799 5,543 5,225 8,240 4,620 6,214Middle East 3,070 3,546 3,650 5,195 3,157 3,701Sub Saharan Africa 2,212 2,214 2,519 3,218 2,200 2,791India 3,169 2,798 2,273 1,522 1,421 1,700China & North East Asia 8,633 9,025 9,662 10,889 9,154 8,423South East Asia & Oceania 3,108 3,033 3,720 4,009 3,374 3,674Other 1) 2) 2,627 2,466 2,222 3,312 2,853 3,134Total 52,966 54,770 55,518 63,667 50,974 55,3191) Of which Sweden 927 1,103 944 908 834 1,2822) Of which EU 10,020 10,317 10,195 13,428 9,502 11,201
Sequential change, percent Q1 Q2 Q3 Q4 Q1 Q2North America -6% -6% -2% -7% 14% 2%Latin America -34% 23% 22% 17% -31% 9%Northern Europe & Central Asia 1) 2) -30% 35% -23% 7% -39% 47%Western & Central Europe 2) -19% -10% 6% 14% -18% -5%Mediterranean 2) -31% 16% -6% 58% -44% 35%Middle East -34% 16% 3% 42% -39% 17%Sub Saharan Africa 9% 0% 14% 28% -32% 27%India 11% -12% -19% -33% -7% 20%China & North East Asia -9% 5% 7% 13% -16% -8%South East Asia & Oceania -21% -2% 23% 8% -16% 9%Other 1) 2) 25% -6% -10% 49% -14% 10%Total -16% 3% 1% 15% -20% 9%1) Of which Sweden -21% 19% -14% -4% -8% 54%2) Of which EU -20% 3% -1% 32% -29% 18%
Year-over-year change, percent Q1 Q2 Q3 Q4 Q1 Q2North America 39% -6% -6% -20% -3% 5%Latin America 1% 17% 64% 16% 20% 6%Northern Europe & Central Asia 1) 2) 46% 70% 49% -22% -32% -26%Western & Central Europe 2) -8% -2% 7% -11% -10% -6%Mediterranean 2) -5% -2% 4% 19% -4% 12%Middle East -22% -7% 34% 12% 3% 4%Sub Saharan Africa -9% -25% 40% 59% -1% 26%India 38% 107% 7% -46% -55% -39%China & North East Asia 74% 96% 39% 15% 6% -7%South East Asia & Oceania -12% -17% -3% 2% 9% 21%Other 1) 2) 37% 49% 19% 57% 9% 27%Total 17% 14% 17% 1% -4% 1%1) Of which Sweden -11% 11% -8% -22% -10% 16%2) Of which EU -9% -1% 5% 7% -5% 9%
NET SALES BY REGION BY QUARTER
2011 2012
2011 2012
20122011
Ericsson Second Quarter Report 2012 29
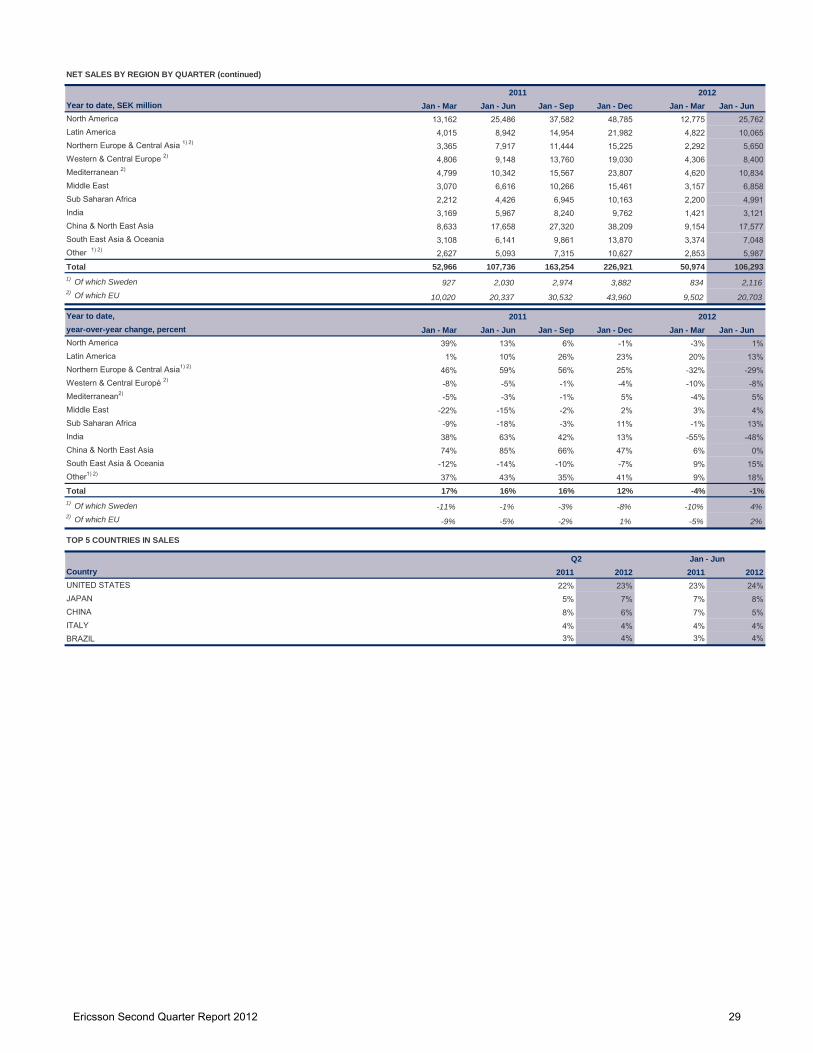
Year to date, SEK million Jan - Mar Jan - Jun Jan - Sep Jan - Dec Jan - Mar Jan - JunNorth America 13,162 25,486 37,582 48,785 12,775 25,762Latin America 4,015 8,942 14,954 21,982 4,822 10,065Northern Europe & Central Asia 1) 2) 3,365 7,917 11,444 15,225 2,292 5,650Western & Central Europe 2) 4,806 9,148 13,760 19,030 4,306 8,400Mediterranean 2) 4,799 10,342 15,567 23,807 4,620 10,834Middle East 3,070 6,616 10,266 15,461 3,157 6,858Sub Saharan Africa 2,212 4,426 6,945 10,163 2,200 4,991India 3,169 5,967 8,240 9,762 1,421 3,121China & North East Asia 8,633 17,658 27,320 38,209 9,154 17,577South East Asia & Oceania 3,108 6,141 9,861 13,870 3,374 7,048Other 1) 2) 2,627 5,093 7,315 10,627 2,853 5,987Total 52,966 107,736 163,254 226,921 50,974 106,2931) Of which Sweden 927 2,030 2,974 3,882 834 2,1162) Of which EU 10,020 20,337 30,532 43,960 9,502 20,703
Year to date, year-over-year change, percent Jan - Mar Jan - Jun Jan - Sep Jan - Dec Jan - Mar Jan - JunNorth America 39% 13% 6% -1% -3% 1%Latin America 1% 10% 26% 23% 20% 13%Northern Europe & Central Asia1) 2) 46% 59% 56% 25% -32% -29%Western & Central Europé 2) -8% -5% -1% -4% -10% -8%Mediterranean2) -5% -3% -1% 5% -4% 5%Middle East -22% -15% -2% 2% 3% 4%Sub Saharan Africa -9% -18% -3% 11% -1% 13%India 38% 63% 42% 13% -55% -48%China & North East Asia 74% 85% 66% 47% 6% 0%South East Asia & Oceania -12% -14% -10% -7% 9% 15%Other1) 2) 37% 43% 35% 41% 9% 18%Total 17% 16% 16% 12% -4% -1%1) Of which Sweden -11% -1% -3% -8% -10% 4%2) Of which EU -9% -5% -2% 1% -5% 2%
North America 6,122 6,131 734 12,987 13,607 10,833 1,322 25,762Latin America 2,293 2,505 445 5,243 4,357 5,029 679 10,065Northern Europe & Central Asia 2,059 1,208 91 3,358 3,251 2,228 171 5,650Western & Central Europe 1,346 2,579 169 4,094 2,881 5,155 364 8,400Mediterranean 2,737 3,308 169 6,214 4,763 5,732 339 10,834Middle East 1,561 1,796 344 3,701 2,878 3,448 532 6,858Sub Saharan Africa 1,555 939 297 2,791 2,812 1,732 447 4,991India 936 645 119 1,700 1,596 1,268 257 3,121China & North East Asia 5,154 3,132 137 8,423 11,434 5,884 259 17,577South East Asia & Oceania 1,885 1,650 139 3,674 3,705 3,068 275 7,048Other 2,118 181 835 3,134 3,796 328 1,863 5,987Total 27,766 24,074 3,479 55,319 55,080 44,705 6,508 106,293Share of Total 50% 44% 6% 100% 52% 42% 6% 100%
North America -18% 30% 25% 2%Latin America 11% -1% 90% 9%Northern Europe & Central Asia 73% 18% 14% 47%Western & Central Europe -12% 0% -13% -5%Mediterranean 35% 36% -1% 35%Middle East 19% 9% 83% 17%Sub Saharan Africa 24% 18% 98% 27%India 42% 4% -14% 20%China & North East Asia -18% 14% 12% -8%South East Asia & Oceania 4% 16% 2% 9%Other 26% 23% -19% 10%Total 2% 17% 15% 9%
Year over year change, percentNet-
worksGlobal
ServicesSupport
Solutions TotalNorth America -22% 47% 170% 5%Latin America -19% 33% 100% 6%Northern Europe & Central Asia -36% 0% -33% -26%Western & Central Europe -21% 7% -25% -6%Mediterranean 10% 18% -35% 12%Middle East -4% 6% 60% 4%Sub Saharan Africa 31% 7% 95% 26%India -46% -21% -52% -39%China & North East Asia -25% 49% 104% -7%South East Asia & Oceania 11% 40% -5% 21%Other -2% -234% 94% 27%Total -17% 26% 47% 1%
Year over year change, percentNet-
worksGlobal
ServicesSupport
Solutions TotalNorth America -20% 35% 154% 1%Latin America -10% 37% 56% 13%Northern Europe & Central Asia -42% 9% -35% -29%Western & Central Europe -25% 7% -18% -8%Mediterranean 0% 13% -37% 5%Middle East -13% 16% 56% 4%Sub Saharan Africa 18% 1% 37% 13%India -60% -17% -40% -48%China & North East Asia -14% 42% 45% 0%South East Asia & Oceania 8% 27% -10% 15%Other -9% 865% 114% 18%Total -17% 23% 40% -1%
NET SALES BY REGION BY SEGMENT
Since the segment ST-Ericsson is reported in accordance with the equity method, their sales are not included below. Net sales related to these segments are disclosed under SEGMENT RESULTS. Net sales related to other segments are set out below.
Revenue from Telcordia is reported 50/50 between Segments Global Services and Support Solutions. In the regional dimension, all of Telcordia sales is reported in Support Solutions, except for North America where it is split 50/50. Multimedia brokering (IPX) was previously reported in each region in Segment Support Solutions, from Q112 it is part of region "Other" in Segment Support Solutions.
Sequential change, percentNet-
worksGlobal
ServicesSupport
Solutions
Q2 2012
Accumulated Jan - Jun 2012
Q2 2012, SEK million Accumulated Jan - Jun 2012, SEK million
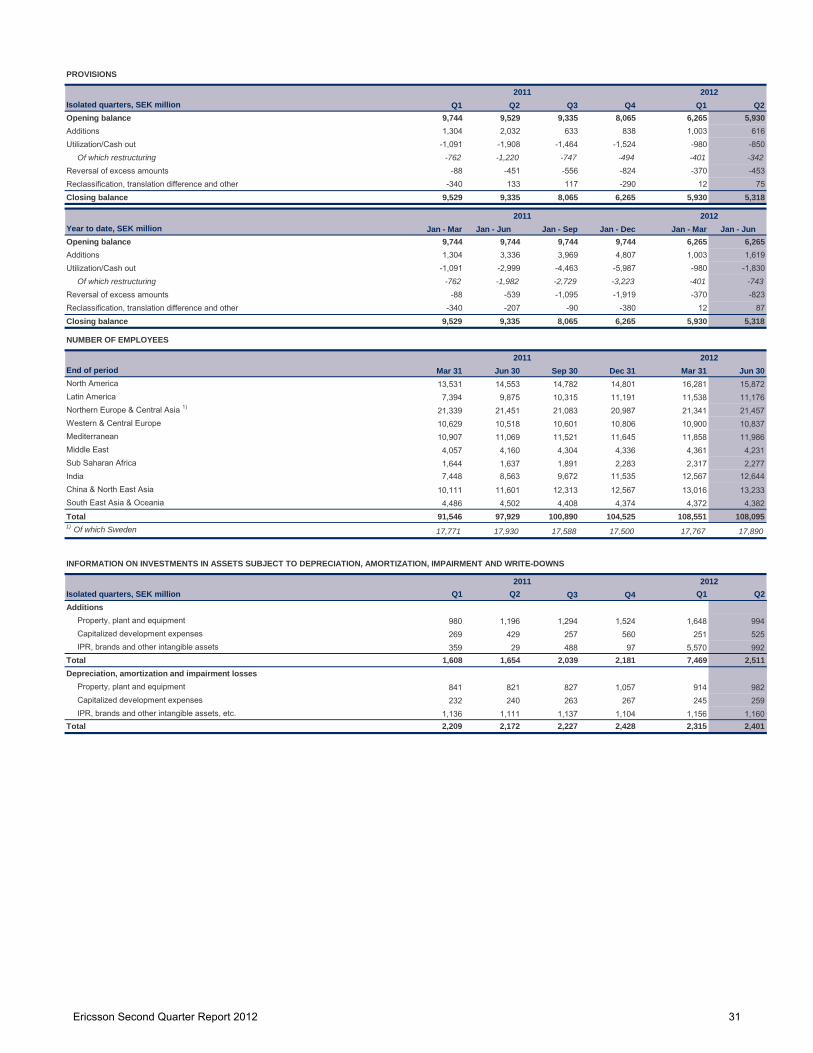
Of which restructuring -762 -1,220 -747 -494 -401 -342Reversal of excess amounts -88 -451 -556 -824 -370 -453Reclassification, translation difference and other -340 133 117 -290 12 75Closing balance 9,529 9,335 8,065 6,265 5,930 5,318
Year to date, SEK million Jan - Mar Jan - Jun Jan - Sep Jan - Dec Jan - Mar Jan - JunOpening balance 9,744 9,744 9,744 9,744 6,265 6,265Additions 1,304 3,336 3,969 4,807 1,003 1,619Utilization/Cash out -1,091 -2,999 -4,463 -5,987 -980 -1,830
Of which restructuring -762 -1,982 -2,729 -3,223 -401 -743Reversal of excess amounts -88 -539 -1,095 -1,919 -370 -823Reclassification, translation difference and other -340 -207 -90 -380 12 87Closing balance 9,529 9,335 8,065 6,265 5,930 5,318
End of period Mar 31 Jun 30 Sep 30 Dec 31 Mar 31 Jun 30North America 13,531 14,553 14,782 14,801 16,281 15,872Latin America 7,394 9,875 10,315 11,191 11,538 11,176Northern Europe & Central Asia 1) 21,339 21,451 21,083 20,987 21,341 21,457Western & Central Europe 10,629 10,518 10,601 10,806 10,900 10,837Mediterranean 10,907 11,069 11,521 11,645 11,858 11,986Middle East 4,057 4,160 4,304 4,336 4,361 4,231Sub Saharan Africa 1,644 1,637 1,891 2,283 2,317 2,277India 7,448 8,563 9,672 11,535 12,567 12,644China & North East Asia 10,111 11,601 12,313 12,567 13,016 13,233South East Asia & Oceania 4,486 4,502 4,408 4,374 4,372 4,382Total 91,546 97,929 100,890 104,525 108,551 108,0951) Of which Sweden 17,771 17,930 17,588 17,500 17,767 17,890
Isolated quarters, SEK million Q1 Q2 Q3 Q4 Q1 Q2Additions
Property, plant and equipment 980 1,196 1,294 1,524 1,648 994Capitalized development expenses 269 429 257 560 251 525IPR, brands and other intangible assets 359 29 488 97 5,570 992
Total 1,608 1,654 2,039 2,181 7,469 2,511Depreciation, amortization and impairment losses
Property, plant and equipment 841 821 827 1,057 914 982Capitalized development expenses 232 240 263 267 245 259IPR, brands and other intangible assets, etc. 1,136 1,111 1,137 1,104 1,156 1,160
Total 2,209 2,172 2,227 2,428 2,315 2,401
PROVISIONS
2011
2012
2012
NUMBER OF EMPLOYEES
2011
INFORMATION ON INVESTMENTS IN ASSETS SUBJECT TO DEPRECIATION, AMORTIZATION, IMPAIRMENT AND WRITE-DOWNS
2012
2011
2011
2012
Ericsson Second Quarter Report 2012 32
OTHER INFORMATION
Jan - Dec2011 2012 2011 2012 2011
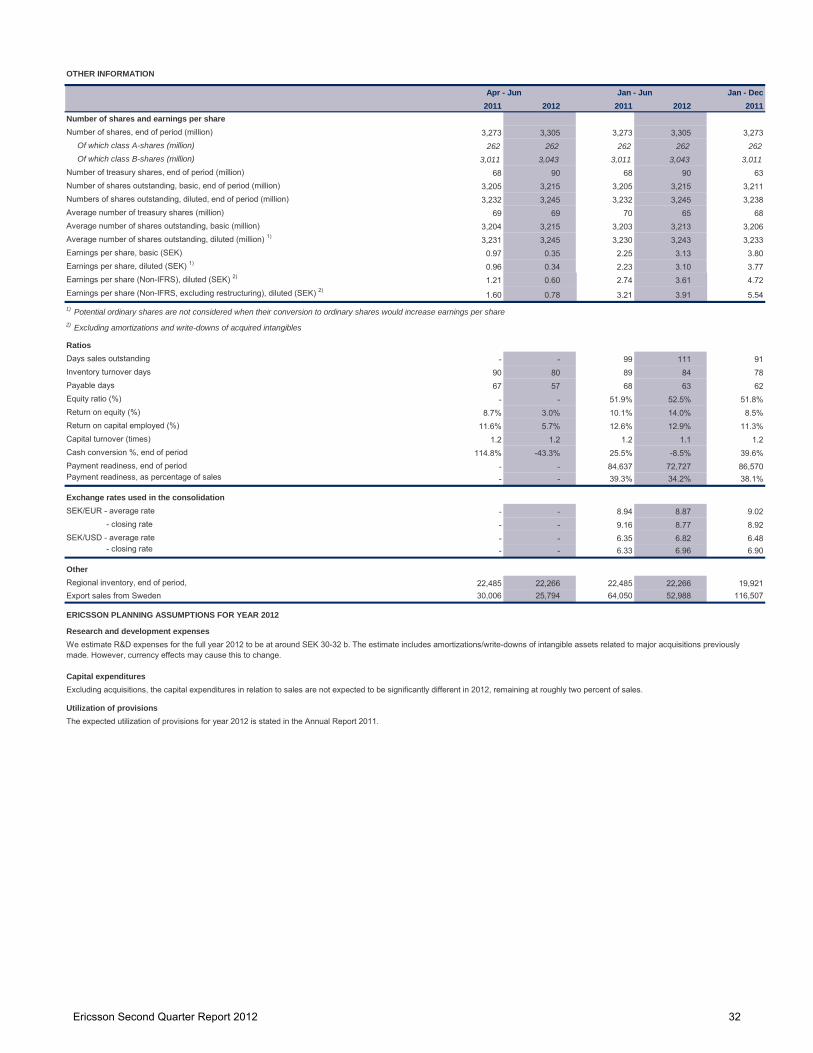
Number of shares and earnings per shareNumber of shares, end of period (million) 3,273 3,305 3,273 3,305 3,273
Of which class A-shares (million) 262 262 262 262 262Of which class B-shares (million) 3,011 3,043 3,011 3,043 3,011
Number of treasury shares, end of period (million) 68 90 68 90 63Number of shares outstanding, basic, end of period (million) 3,205 3,215 3,205 3,215 3,211Numbers of shares outstanding, diluted, end of period (million) 3,232 3,245 3,232 3,245 3,238Average number of treasury shares (million) 69 69 70 65 68Average number of shares outstanding, basic (million) 3,204 3,215 3,203 3,213 3,206Average number of shares outstanding, diluted (million) 1) 3,231 3,245 3,230 3,243 3,233Earnings per share, basic (SEK) 0.97 0.35 2.25 3.13 3.80Earnings per share, diluted (SEK) 1) 0.96 0.34 2.23 3.10 3.77Earnings per share (Non-IFRS), diluted (SEK) 2) 1.21 0.60 2.74 3.61 4.72Earnings per share (Non-IFRS, excluding restructuring), diluted (SEK) 2)
1.60 0.78 3.21 3.91 5.54
RatiosDays sales outstanding - - 99 111 91Inventory turnover days 90 80 89 84 78Payable days 67 57 68 63 62Equity ratio (%) - - 51.9% 52.5% 51.8%Return on equity (%) 8.7% 3.0% 10.1% 14.0% 8.5%Return on capital employed (%) 11.6% 5.7% 12.6% 12.9% 11.3%Capital turnover (times) 1.2 1.2 1.2 1.1 1.2Cash conversion %, end of period 114.8% -43.3% 25.5% -8.5% 39.6%Payment readiness, end of period - - 84,637 72,727 86,570Payment readiness, as percentage of sales - - 39.3% 34.2% 38.1%
Exchange rates used in the consolidationSEK/EUR - average rate - - 8.94 8.87 9.02
OtherRegional inventory, end of period, 22,485 22,266 22,485 22,266 19,921Export sales from Sweden 30,006 25,794 64,050 52,988 116,507
Research and development expenses
Capital expenditures
Utilization of provisions
Jan - JunApr - Jun
1) Potential ordinary shares are not considered when their conversion to ordinary shares would increase earnings per share2) Excluding amortizations and write-downs of acquired intangibles
The expected utilization of provisions for year 2012 is stated in the Annual Report 2011.
ERICSSON PLANNING ASSUMPTIONS FOR YEAR 2012
We estimate R&D expenses for the full year 2012 to be at around SEK 30-32 b. The estimate includes amortizations/write-downs of intangible assets related to major acquisitions previously made. However, currency effects may cause this to change.
Excluding acquisitions, the capital expenditures in relation to sales are not expected to be significantly different in 2012, remaining at roughly two percent of sales.
Ericsson Second Quarter Report 2012 33
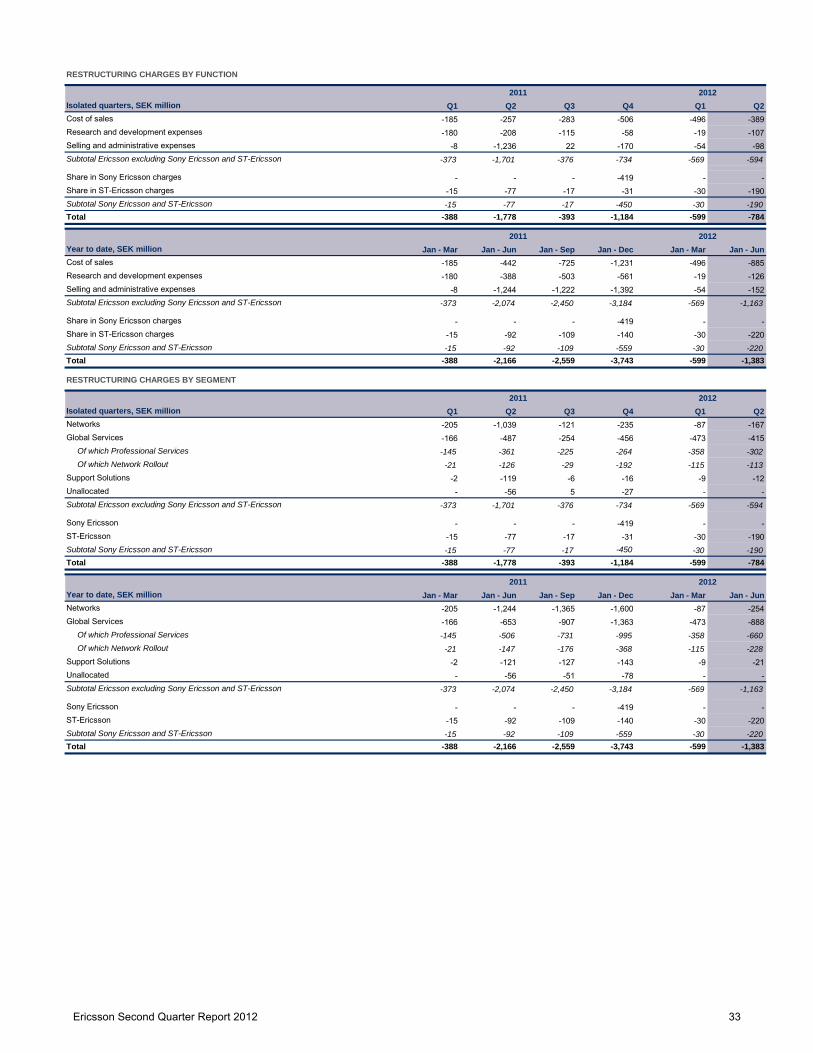
Isolated quarters, SEK million Q1 Q2 Q3 Q4 Q1 Q2Cost of sales -185 -257 -283 -506 -496 -389Research and development expenses -180 -208 -115 -58 -19 -107Selling and administrative expenses -8 -1,236 22 -170 -54 -98Subtotal Ericsson excluding Sony Ericsson and ST-Ericsson -373 -1,701 -376 -734 -569 -594
Share in Sony Ericsson charges - - - -419 - -Share in ST-Ericsson charges -15 -77 -17 -31 -30 -190Subtotal Sony Ericsson and ST-Ericsson -15 -77 -17 -450 -30 -190Total -388 -1,778 -393 -1,184 -599 -784
Year to date, SEK million Jan - Mar Jan - Jun Jan - Sep Jan - Dec Jan - Mar Jan - JunCost of sales -185 -442 -725 -1,231 -496 -885Research and development expenses -180 -388 -503 -561 -19 -126Selling and administrative expenses -8 -1,244 -1,222 -1,392 -54 -152Subtotal Ericsson excluding Sony Ericsson and ST-Ericsson -373 -2,074 -2,450 -3,184 -569 -1,163
Share in Sony Ericsson charges - - - -419 - -Share in ST-Ericsson charges -15 -92 -109 -140 -30 -220Subtotal Sony Ericsson and ST-Ericsson -15 -92 -109 -559 -30 -220Total -388 -2,166 -2,559 -3,743 -599 -1,383
Of which Professional Services -145 -361 -225 -264 -358 -302Of which Network Rollout -21 -126 -29 -192 -115 -113
Support Solutions -2 -119 -6 -16 -9 -12Unallocated - -56 5 -27 - -Subtotal Ericsson excluding Sony Ericsson and ST-Ericsson -373 -1,701 -376 -734 -569 -594
Sony Ericsson - - - -419 - -ST-Ericsson -15 -77 -17 -31 -30 -190Subtotal Sony Ericsson and ST-Ericsson -15 -77 -17 -450 -30 -190Total -388 -1,778 -393 -1,184 -599 -784
Year to date, SEK million Jan - Mar Jan - Jun Jan - Sep Jan - Dec Jan - Mar Jan - JunNetworks -205 -1,244 -1,365 -1,600 -87 -254Global Services -166 -653 -907 -1,363 -473 -888
Of which Professional Services -145 -506 -731 -995 -358 -660Of which Network Rollout -21 -147 -176 -368 -115 -228
Support Solutions -2 -121 -127 -143 -9 -21Unallocated - -56 -51 -78 - -Subtotal Ericsson excluding Sony Ericsson and ST-Ericsson -373 -2,074 -2,450 -3,184 -569 -1,163
Sony Ericsson - - - -419 - -ST-Ericsson -15 -92 -109 -140 -30 -220Subtotal Sony Ericsson and ST-Ericsson -15 -92 -109 -559 -30 -220Total -388 -2,166 -2,559 -3,743 -599 -1,383