Page 1
Under consideration for publication in J. Fluid Mech. 1
Erosion of a granular bed driven
by laminar fluid flow
By ALEXANDER E. LOBKOVSKY1,ASHISH V. ORPE2,
RYAN MOLLOY2, ARSHAD KUDROLLI2
AND DANIEL H. ROTHMAN1
1Department of Earth, Atmospheric, and Planetary Sciences, Massachusetts Institute of
Technology, Cambridge, MA 02139
2Physics Department, Clark University, Worcester, MA 01610
(Received 18 January 2008)
Motivated by examples of erosive incision of channels in sand, we investigate the motion
of individual grains in a granular bed driven by a laminar fluid to give us new insights
into the relationship between hydrodynamic stress and surface granular flow. A closed
cell of rectangular cross-section is partially filled with glass beads and a constant fluid
flux Q flows through the cell. The refractive indices of the fluid and the glass beads are
matched and the cell is illuminated with a laser sheet, allowing us to image individual
beads. The bed erodes to a rest height hr which depends on Q. The Shields threshold
criterion assumes that the non-dimensional ratio θ of the viscous stress on the bed to
the hydrostatic pressure difference across a grain is sufficient to predict the granular
flux. Furthermore, the Shields criterion states that the granular flux is non-zero only for
θ > θc. We find that the Shields criterion describes the observed relationship hr ∝ Q1/2
when the bed height is offset by approximately half a grain diameter. Introducing this
offset in the estimation of θ yields a collapse of the measured Einstein number q∗ to a
power-law function of θ− θc with exponent 1.75± 0.25. The dynamics of the bed height
Page 2
2 A. E. Lobkovsky, A. V. Orpe, R. Molloy, A. Kudrolli and D. H. Rothman
relaxation are well described by the power law relationship between the granular flux
and the bed stress.
1. Introduction
The response of a granular bed to forcing by a fluid which flows through and over the
bed has been the subject of continuous inquiry for over a century (see, for example Graf
(1971); Yalin (1977)). This phenomenon is at the centre of a wide range of practical and
fundamental problems. Predicting the granular flux for a known fluid flow is important
in understanding how beaches (Bailard, 1981; Komar, 1998), rivers (Murray & Paola,
1994) and deltas (Kenyon & Turcotte, 1985; Parker et al., 1998) evolve, mountains erode
(Burbank et al., 1996) and landscapes form (Howard, 1994). Sedimentary records cannot
be deciphered without a working understanding of the combined fluid/granular (two-
phase) flow (Blum & Tornqvist, 2000). The microscopic details of the bed’s response to
forcing by a fluid raise important fundamental questions about the nature of fluid flow
near a rough (Grass, 1971; Jimenez, 2004) and/or permeable (Brinkman, 1949; Beavers
& Joseph, 1967) wall, the motion of a grain on a rough surface (Samson et al., 1999;
Quartier et al., 2000), and the dynamics of granular avalanches (Douady et al., 2002;
Bonamy et al., 2002).
Given some measure of the fluid flow intensity, one would like to predict the granular
flux from the properties of the granular material such as size, shape, friction coefficient,
bed packing, etc. An important aspect of the problem to consider first is the onset of
granular flow. Just as the surface of a granular pile driven by gravity alone relaxes to
the angle of repose (Jaeger et al., 1989), granular beds driven by fluid flow are thought
to be static below a certain threshold fluid flux. Several empirical curves relating some
Page 3
Bed Erosion by Laminar Flow 3
measure of the fluid forcing at the onset of granular flow to the grain properties have
been proposed (Shields, 1936; Vanoni, 1964; Yalin, 1977). Numerous experimental stud-
ies aimed at computing these curves (summarised in Miller et al. (1977) or Buffington &
Montgomery (1997), for example) are difficult to interpret since measured critical prop-
erties (such as the Shields parameter) vary by as much as a factor of three from study to
study. The disparate and subjective definitions of the onset of granular flow used by the
researchers are frequently used to explain the observed scatter (Shvidchenko & Pender,
2000; Paphitis, 2001).
Even the existence of the threshold fluid forcing below which the granular flux is
identically zero is a subject of a lively ongoing debate (Graf & Pazis, 1977; van Rijn,
1989). When the flow is turbulent, the local bed forcing is stochastic (Papanicolaou
et al., 2001) and a strong case, supported by data, can be made for the presence of
a granular flux (albeit vanishingly small) for any mean value of the fluid forcing (van
Rijn, 1989). The omnipresence of a granular flux poses a two-fold problem. First,
an arbitrary threshold grain flux (Neill & Yalin, 1969), dislodging rate (Shvidchenko
& Pender, 2000), or dislodging probability (Dancey et al., 2002) must be introduced
to characterise the onset. Whereas the study of Graf & Pazis (1977) suggests that the
granular flux is exponentially small below some threshold driving, no systematic attempt,
to our knowledge, has been made to quantify the transition in the functional dependence
of the granular flux on driving. Second, the ever-present granular flux results in the
evolution of the surface packing. This “ageing” or “armouring” of the granular bed leads
to a decrease in the granular flux and an increase in the perceived threshold for the onset
of persistent granular flow (Charru et al., 2004; Paphitis & Collins, 2005).
Even when the flow is laminar, the rough surface of the granular bed yields a fluctuating
local fluid stress, albeit deterministically related to the time dependent realization of the
Page 4
4 A. E. Lobkovsky, A. V. Orpe, R. Molloy, A. Kudrolli and D. H. Rothman
surface packing. Statistical methods are therefore necessary to completely characterise
the onset of granular flow. Because we expect the surface packing to have a transient
component, so will the granular flux. However, we expect there to be a true threshold
forcing below which there exist surface packings such that the associated surface stress
is insufficient to dislodge any grains. Under steady pre-threshold forcing conditions, one
such surface packing will eventually be realized and the granular flow will cease. We are
interested in predicting the value of the threshold fluid forcing, the transient granular
flux in pre-threshold conditions, and the steady state granular flux above the threshold.
We would also like to establish whether a single characteristic of the fluid forcing (such
as the surface stress) is sufficient to predict the steady state granular flux.
Here we report our initial investigation of these questions in a cell partially filled with
transparent spherical glass beads driven by an index-matched fluid. The small size of the
cell and the grains and the high viscosity of the fluid ensures that the particle Reynolds
number is always less than ten. Adding small fluorescing tracers and illuminating the
cell with a laser sheet allows us to directly image all grains in a vertical slice through
the system. We can therefore simultaneously measure the fluid and granular fluxes, the
dimensions of the fluid filled region, and the granular packing. This allows us to test
theoretical predictions of the threshold condition and the functional dependence of the
granular flux on fluid driving. Our study may be considered complementary to that of
Goharzadeh et al. (2005), who examined the fluid flow near a granular bed using a similar
setup.
2. Experimental technique
As shown in figure 1, an enclosed cell with a rectangular cross-section is partially filled
with glass beads with diameter d = 0.70 ± 0.05 mm, density ρg = 2.5 g/cm3 and index
Page 5
Bed Erosion by Laminar Flow 5
245 mm
33 mm
26 mm
LaserSheet
Fluid Flow
Top Plate
hf
(b)80 mm
80 mmFluid In (Q)
Fluid Out (Q)
(c)
(1)
(2)
(a)
xz
regionImage90 mm
Granular Bed
7 mm
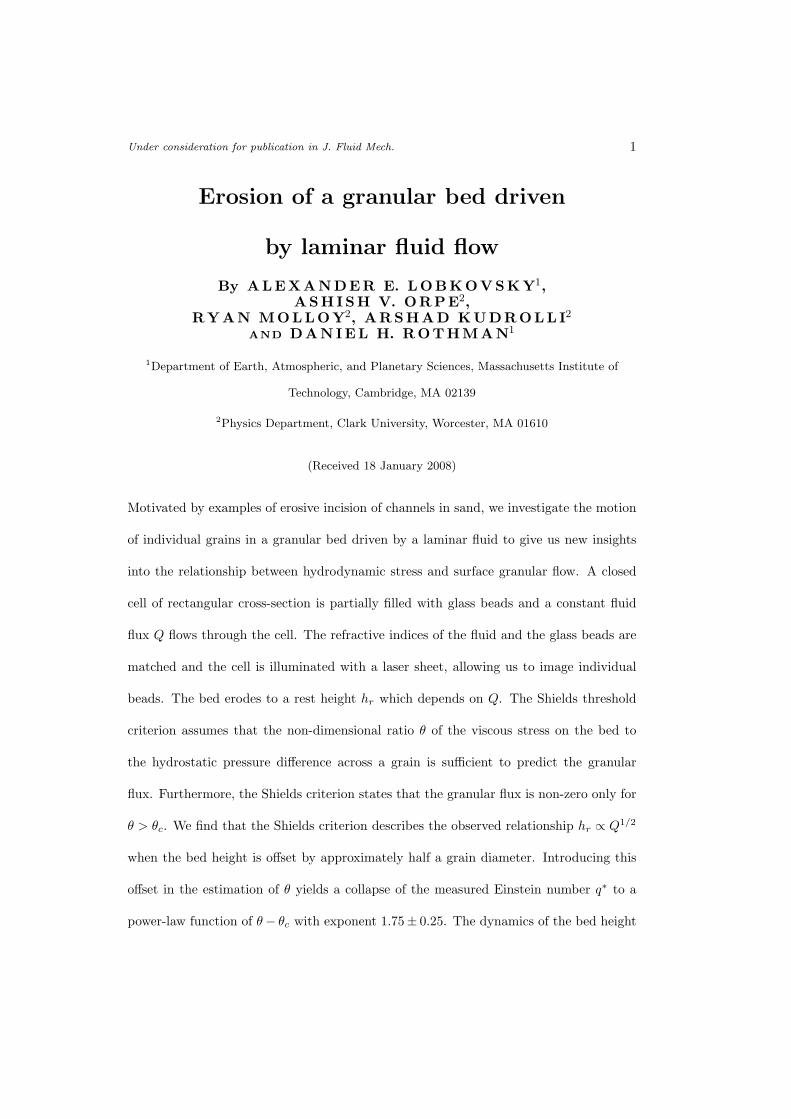
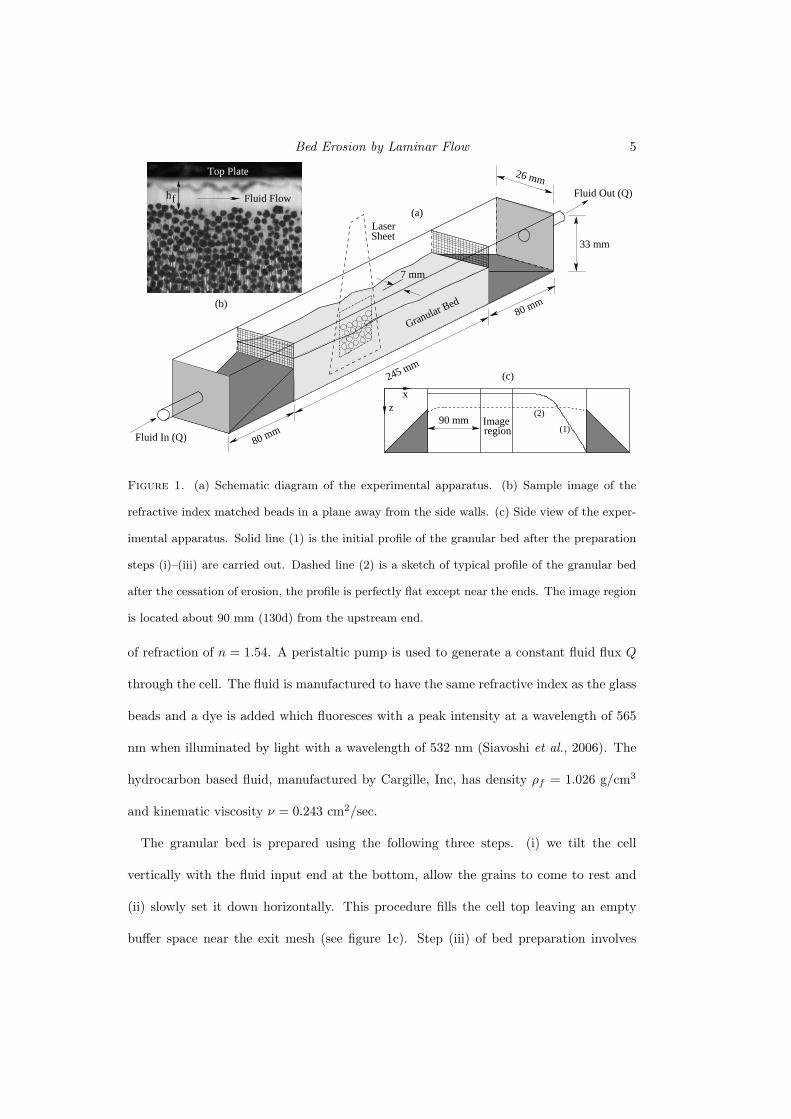
Figure 1. (a) Schematic diagram of the experimental apparatus. (b) Sample image of the
refractive index matched beads in a plane away from the side walls. (c) Side view of the exper-
imental apparatus. Solid line (1) is the initial profile of the granular bed after the preparation
steps (i)–(iii) are carried out. Dashed line (2) is a sketch of typical profile of the granular bed
after the cessation of erosion, the profile is perfectly flat except near the ends. The image region
is located about 90 mm (130d) from the upstream end.
of refraction of n = 1.54. A peristaltic pump is used to generate a constant fluid flux Q
through the cell. The fluid is manufactured to have the same refractive index as the glass
beads and a dye is added which fluoresces with a peak intensity at a wavelength of 565
nm when illuminated by light with a wavelength of 532 nm (Siavoshi et al., 2006). The
hydrocarbon based fluid, manufactured by Cargille, Inc, has density ρf = 1.026 g/cm3
and kinematic viscosity ν = 0.243 cm2/sec.
The granular bed is prepared using the following three steps. (i) we tilt the cell
vertically with the fluid input end at the bottom, allow the grains to come to rest and
(ii) slowly set it down horizontally. This procedure fills the cell top leaving an empty
buffer space near the exit mesh (see figure 1c). Step (iii) of bed preparation involves
Page 6
6 A. E. Lobkovsky, A. V. Orpe, R. Molloy, A. Kudrolli and D. H. Rothman
applying a small fluid flux to create a small (3–4 grain diameters) uniform gap. The
three steps above are repeated to create the initial condition for all runs. We scanned
the laser sheet across the initial bed surface and verified that it was flat in the observation
window of width to within half a bead diameter. After the bed is prepared, the fluid
flux is instantaneously raised to some value Q and kept constant for the duration of each
run. After traversing the pile’s surface, eroded grains fall out of the way into the empty
buffer space between the pile and the downstream mesh. Eventually, all granular motion
ceases. In such a rest state the profile is perfectly flat except in regions of order 2 cm
near the inlet and outlet meshes. We therefore suppose, and argue further below, that in
the flat region, which comprises at least a 20 cm portion of the cell, the fluid flow profile
is steady, laminar and independent of the downstream distance. We further checked that
systematically varying the initialization fluid flux to create different initial bed heights
did not change the final bed height. We observed that the final height reached was the
same to within a grain diameter, provided the initial bed height was greater.
The range of fluid fluxes Q for which the rest state is reached is a function of the cell
filling fraction. If the cell filling fraction is high, the range of Q is rather small. However,
if the filling fraction is small, the quiescent bed does not have a flat region when the rest
state is reached. We therefore set the uniform bed level at roughly 22 mm.
A laser and cylindrical lens system, placed above the cell, illuminates a vertical slice
through the cell away from the sidewalls. Because the beads do not contain the dye,
they appear dark against a bright background fluid. A high speed digital camera with
a resolution of 512×480 pixels records a sequence of images at a rate of 30–60 frames
per second. A typical image of a vertical slice through the bed is shown in figure 1b.
The image is truncated at a depth of about 15 mm (measured from the top plate) below
which the particles never move. The apparent size of a bead depends on the distance of
Page 7
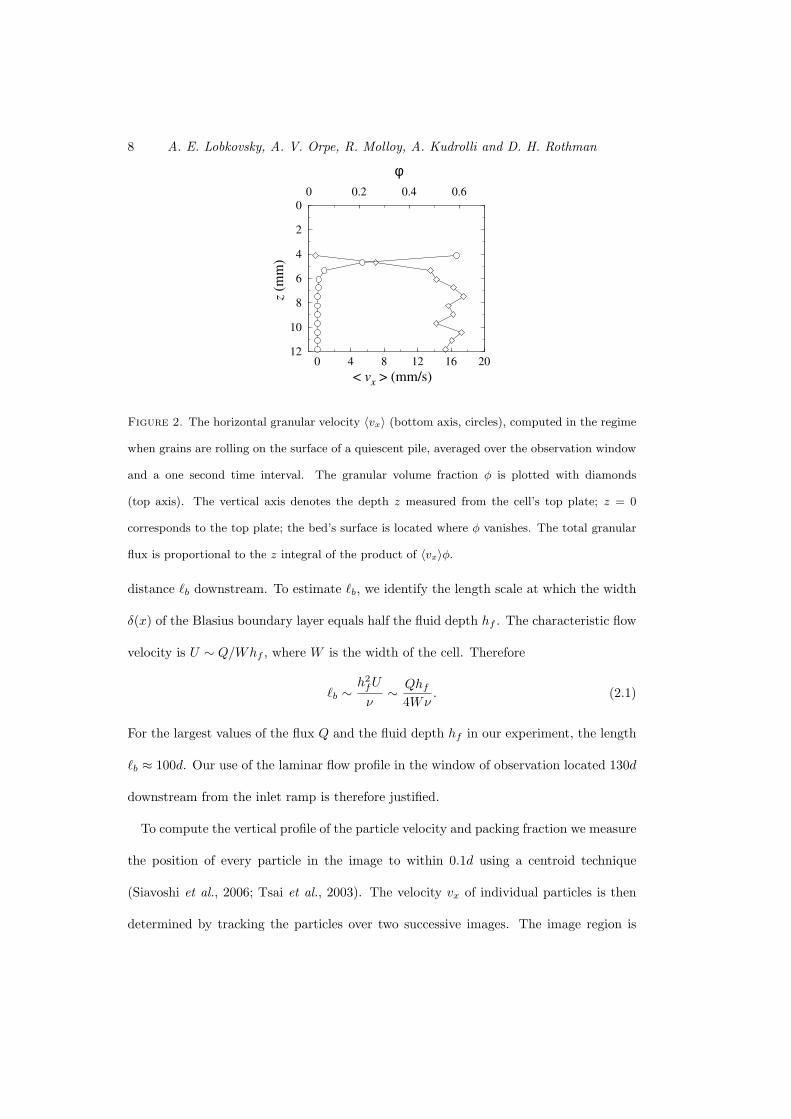
Bed Erosion by Laminar Flow 7
its centre from the illuminated plane. We are able to identify all beads whose centres
are within approximately 0.3d from the illuminated plane. The height of the granular
bed in every image is measured using an edge detection algorithm. We take the height
of the granular bed to be the inflection point in a depth profile of the pixel intensity
averaged over the image width. This technique yields the mean height of the bed in the
observation window. Furthermore, the mean height is averaged over 5 experimental runs
to reduce statistical fluctuations, and remove any variability in preparing the initial pile.
We verified that the bed height decreases monotonically away from the side walls up
to a distance of about 3.5 mm beyond which it remains constant to within the roughness
scale of the granular bed. For all subsequent measurements we therefore positioned the
laser sheet at a distance 7 mm from the side walls. The imaged region is about 16 mm
wide, and is located 90 mm downstream from the inlet mesh (see figure 1c). Comparing
the height data for experimental runs repeated under same preparation conditions, we
observed the standard deviations to be less that one particle diameter.
The inlet and outlet ramps ensure a smooth flow of the fluid onto the granular bed.
After a process of trial and error, the height of the ramps (22 mm) was chosen to be
slightly lower than the height of the granular bed when the grains fill the cell uniformly
forming a flat surface. The leading edge of the bed tends to align with the top of the
inlet ramp. If the bed is eroded below the upper edge of the inlet ramp, an undesirable
turbulent region can form behind it. Neglecting end effects is theoretically justified
because we find a relationship between the grain flux and the local viscous shear stress
in a region away from both ramps. In addition, we find that the final rest height of the
bed away from the ramps depends only on fluid flux Q and not on the bed preparation
or on the geometry of the ramps. Therefore, we maintain that the ramps only affect the
granular bed in their vicinity and do not influence the bed height further than a certain
Page 8
8 A. E. Lobkovsky, A. V. Orpe, R. Molloy, A. Kudrolli and D. H. Rothman
0 0.2 0.4 0.6
φ
0 4 8 12 16 20
< vx > (mm/s)
12
10
8
6
4
2
0
z (
mm
)
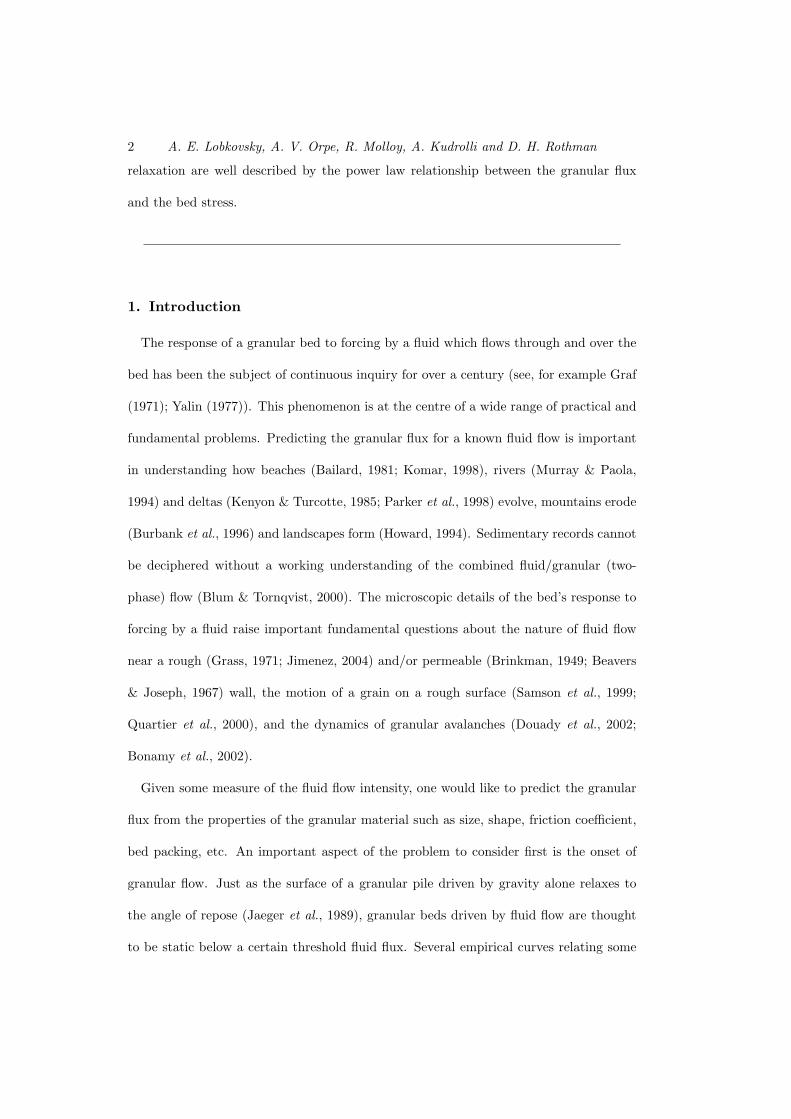
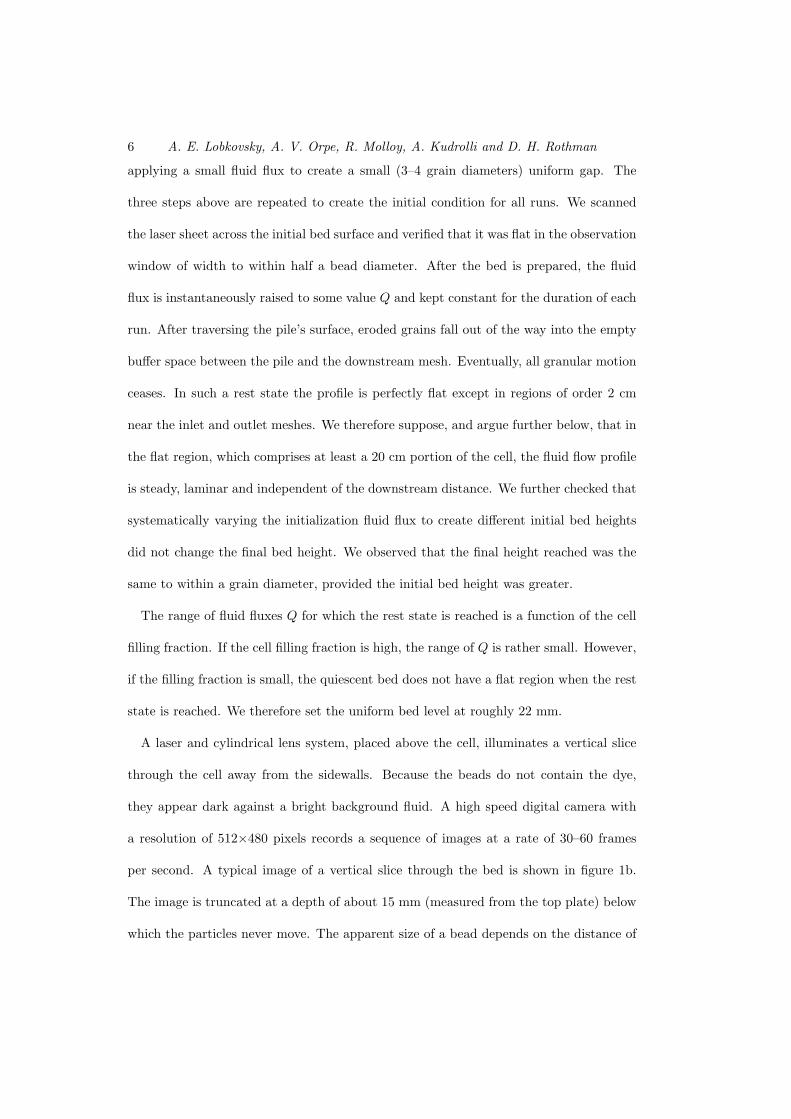
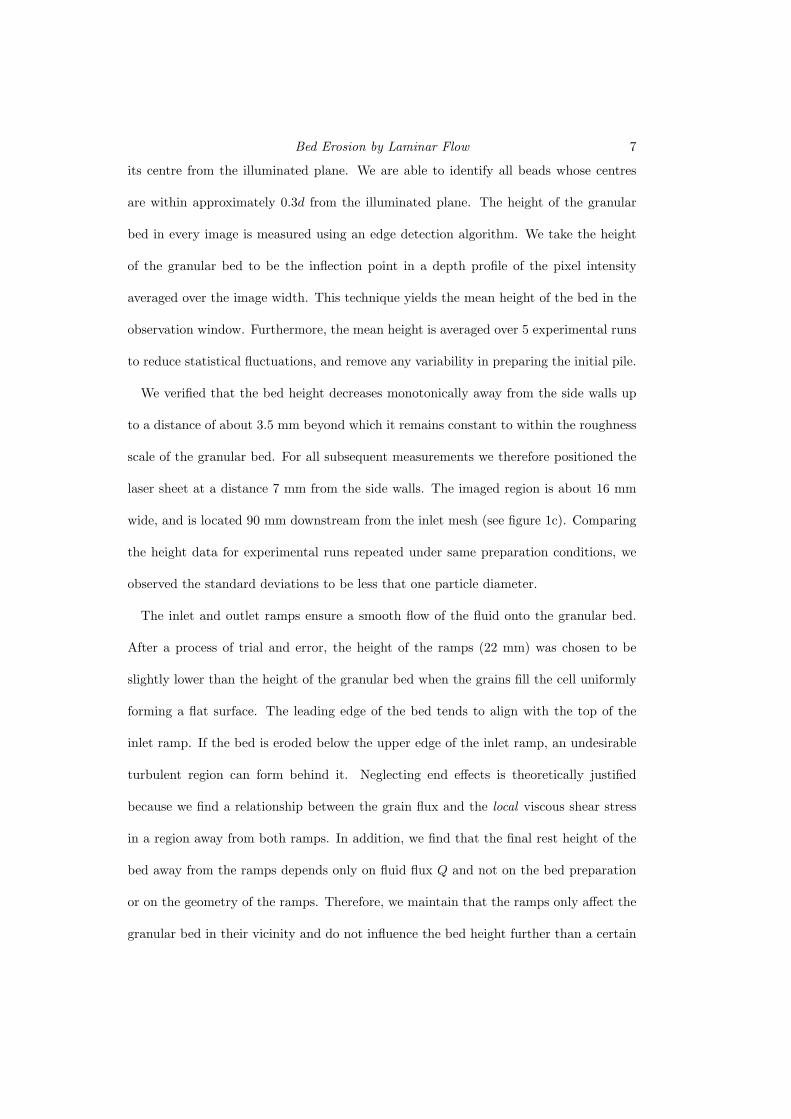
Figure 2. The horizontal granular velocity 〈vx〉 (bottom axis, circles), computed in the regime
when grains are rolling on the surface of a quiescent pile, averaged over the observation window
and a one second time interval. The granular volume fraction φ is plotted with diamonds
(top axis). The vertical axis denotes the depth z measured from the cell’s top plate; z = 0
corresponds to the top plate; the bed’s surface is located where φ vanishes. The total granular
flux is proportional to the z integral of the product of 〈vx〉φ.
distance `b downstream. To estimate `b, we identify the length scale at which the width
δ(x) of the Blasius boundary layer equals half the fluid depth hf . The characteristic flow
velocity is U ∼ Q/Whf , where W is the width of the cell. Therefore
`b ∼h2
fU
ν∼ Qhf
4Wν. (2.1)
For the largest values of the flux Q and the fluid depth hf in our experiment, the length
`b ≈ 100d. Our use of the laminar flow profile in the window of observation located 130d
downstream from the inlet ramp is therefore justified.
To compute the vertical profile of the particle velocity and packing fraction we measure
the position of every particle in the image to within 0.1d using a centroid technique
(Siavoshi et al., 2006; Tsai et al., 2003). The velocity vx of individual particles is then
determined by tracking the particles over two successive images. The image region is
Page 9
Bed Erosion by Laminar Flow 9
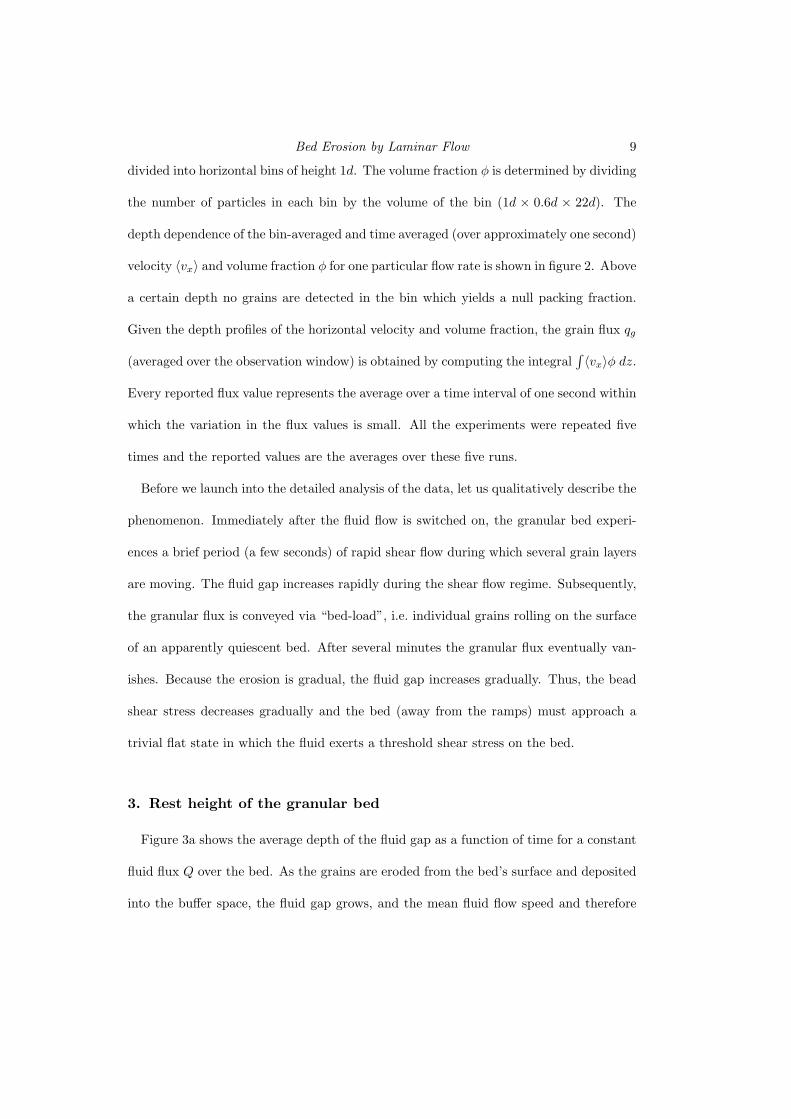
divided into horizontal bins of height 1d. The volume fraction φ is determined by dividing
the number of particles in each bin by the volume of the bin (1d × 0.6d × 22d). The
depth dependence of the bin-averaged and time averaged (over approximately one second)
velocity 〈vx〉 and volume fraction φ for one particular flow rate is shown in figure 2. Above
a certain depth no grains are detected in the bin which yields a null packing fraction.
Given the depth profiles of the horizontal velocity and volume fraction, the grain flux qg
(averaged over the observation window) is obtained by computing the integral∫ 〈vx〉φ dz.
Every reported flux value represents the average over a time interval of one second within
which the variation in the flux values is small. All the experiments were repeated five
times and the reported values are the averages over these five runs.
Before we launch into the detailed analysis of the data, let us qualitatively describe the
phenomenon. Immediately after the fluid flow is switched on, the granular bed experi-
ences a brief period (a few seconds) of rapid shear flow during which several grain layers
are moving. The fluid gap increases rapidly during the shear flow regime. Subsequently,
the granular flux is conveyed via “bed-load”, i.e. individual grains rolling on the surface
of an apparently quiescent bed. After several minutes the granular flux eventually van-
ishes. Because the erosion is gradual, the fluid gap increases gradually. Thus, the bead
shear stress decreases gradually and the bed (away from the ramps) must approach a
trivial flat state in which the fluid exerts a threshold shear stress on the bed.
3. Rest height of the granular bed
Figure 3a shows the average depth of the fluid gap as a function of time for a constant
fluid flux Q over the bed. As the grains are eroded from the bed’s surface and deposited
into the buffer space, the fluid gap grows, and the mean fluid flow speed and therefore
Page 10
10 A. E. Lobkovsky, A. V. Orpe, R. Molloy, A. Kudrolli and D. H. Rothman
(b)
Q, cm3/minh
r,m
m
1000100
10
1Q = 2500 cm3/minQ = 2000 cm3/minQ = 1500 cm3/minQ = 1000 cm3/minQ = 500 cm3/min
(a)
t, sec
hf,m
m
4003002001000
10
8
6
4
2
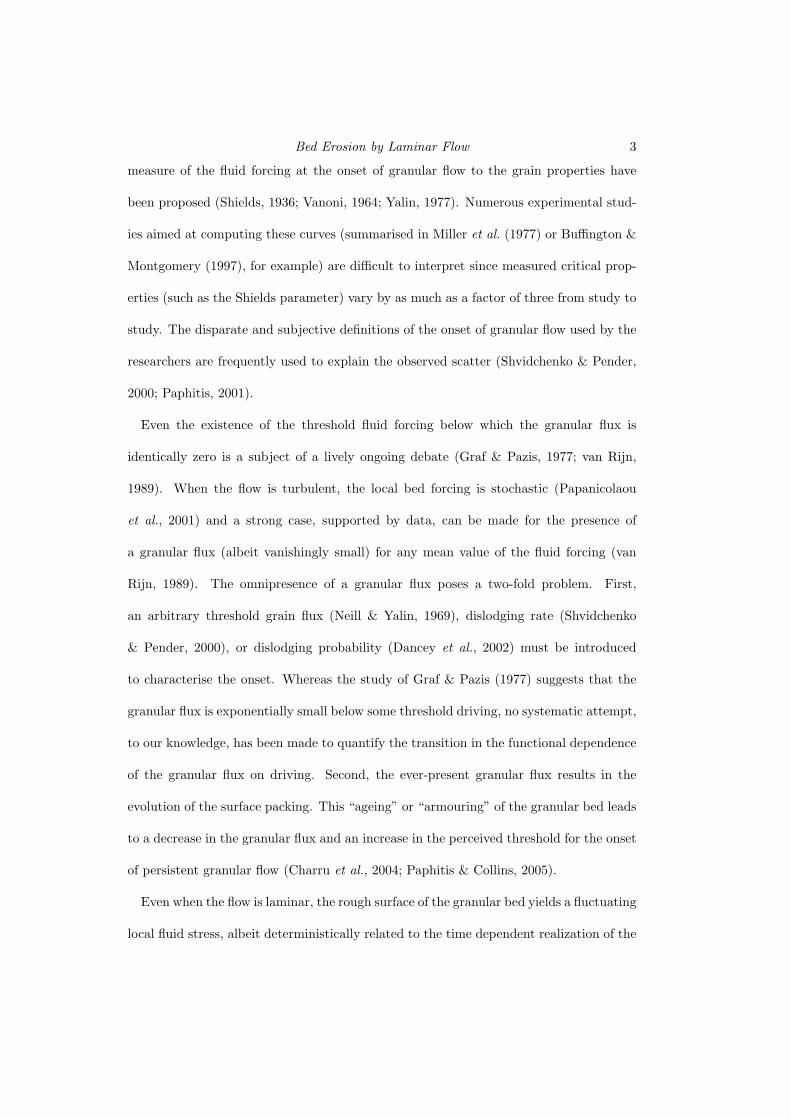
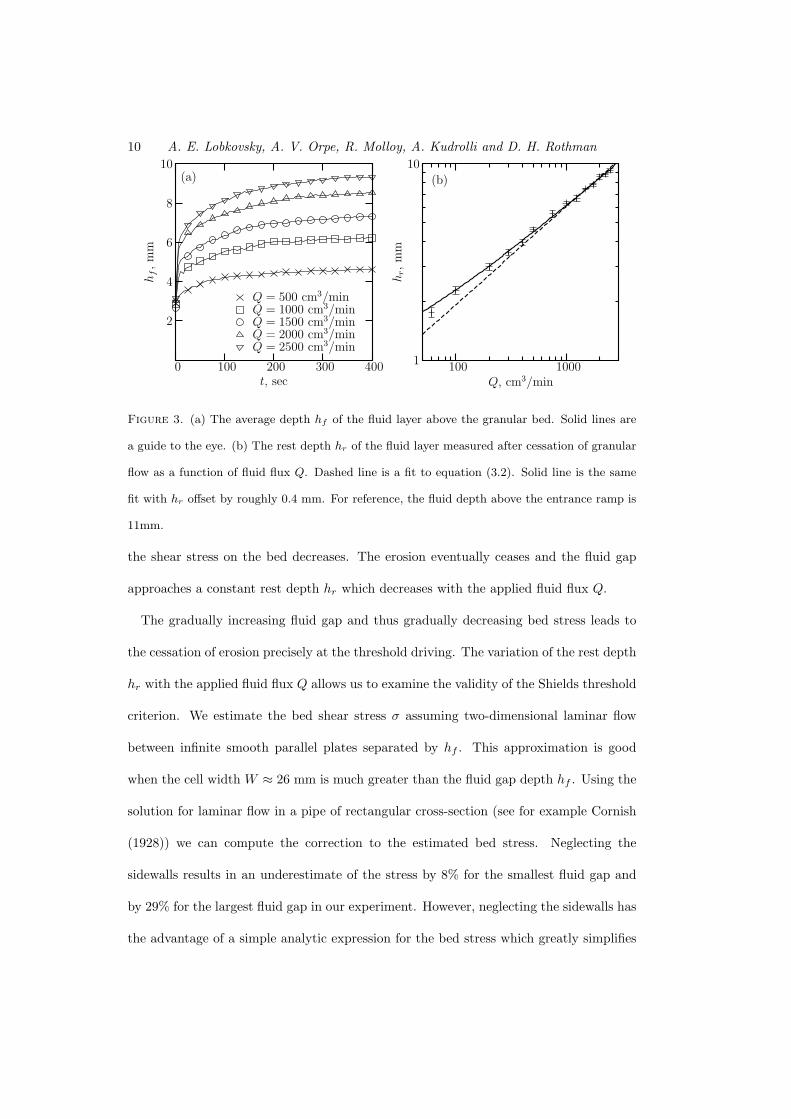
Figure 3. (a) The average depth hf of the fluid layer above the granular bed. Solid lines are
a guide to the eye. (b) The rest depth hr of the fluid layer measured after cessation of granular
flow as a function of fluid flux Q. Dashed line is a fit to equation (3.2). Solid line is the same
fit with hr offset by roughly 0.4 mm. For reference, the fluid depth above the entrance ramp is
11mm.
the shear stress on the bed decreases. The erosion eventually ceases and the fluid gap
approaches a constant rest depth hr which decreases with the applied fluid flux Q.
The gradually increasing fluid gap and thus gradually decreasing bed stress leads to
the cessation of erosion precisely at the threshold driving. The variation of the rest depth
hr with the applied fluid flux Q allows us to examine the validity of the Shields threshold
criterion. We estimate the bed shear stress σ assuming two-dimensional laminar flow
between infinite smooth parallel plates separated by hf . This approximation is good
when the cell width W ≈ 26 mm is much greater than the fluid gap depth hf . Using the
solution for laminar flow in a pipe of rectangular cross-section (see for example Cornish
(1928)) we can compute the correction to the estimated bed stress. Neglecting the
sidewalls results in an underestimate of the stress by 8% for the smallest fluid gap and
by 29% for the largest fluid gap in our experiment. However, neglecting the sidewalls has
the advantage of a simple analytic expression for the bed stress which greatly simplifies
Page 11
Bed Erosion by Laminar Flow 11
the analysis. The laminar flow assumption is good since the cell Reynolds number for
Q = 1000 cm3/min is Re = vmeanhf/ν = Q/Wν ≈ 0.3, where vmean is the horizontal
fluid velocity averaged over the fluid gap. The Shields parameter θ, defined as the stress
σ scaled by the hydrostatic pressure difference (ρg − ρf )gd across the grain, is
θ =6Qν
Wγgdh2f
, (3.1)
where γ ≡ ρg/ρf−1 ≈ 1.437 is the density contrast. The Shields parameter measures the
relative importance of the destabilising hydrodynamic forces and the stabilising gravity.
Assuming that the rest depth hr of the fluid gap corresponds to the Shields criterion
θ = θc, we obtain
hr = d
(Q
Qr
)1/2
, with Qr = θcWγgd3
6ν. (3.2)
The fit to the measured rest depth (shown as a dashed line in figure 3b) is significantly
improved if a positive constant of approximately half a diameter d is introduced to
the right-hand side of (3.2) (an even better fit is obtained if hr ∼ Q0.45). The fit
yields Qr = 15.4 ± 0.3 cm3/min which translates to the critical Shields parameter of
θc = 0.30 ± 0.01. This value is consistent with previously reported values, for example,
in Miller et al. (1977) or Buffington & Montgomery (1997). For comparison, the Yalin
parameter, Ξ ≡ (γgd3)1/2/ν, a less widely used dimensionless group which measures
the relative importance of viscous and gravitational forces without reference to the flow
intensity, is Ξ ≈ 0.03 in our experiment.
The physical origin of the offset is not entirely clear to us at this time. The correction
to the bed stress estimate due to the sidewalls cannot be the source of the offset since
in the limit of small gap hf the sidewall effect vanishes. A possible source of the offset
is the fluid boundary condition at a permeable wall which relates the derivative of the
fluid velocity to its magnitude at some penetration length scale `. Yet another possibility
Page 12
12 A. E. Lobkovsky, A. V. Orpe, R. Molloy, A. Kudrolli and D. H. Rothman
0 0.1 0.2 0.3 0.4 0.5
θ − θc
0
0.01
0.02
0.03
0.04
0.05
q *
Q = 500 cm3/min
Q = 750 cm3/min
Q = 1000 cm3/min
Q = 1500 cm3/min
Q = 2000 cm3/min
Q = 2500 cm3/min
q * = 0.112 (θ − θc)
1.89
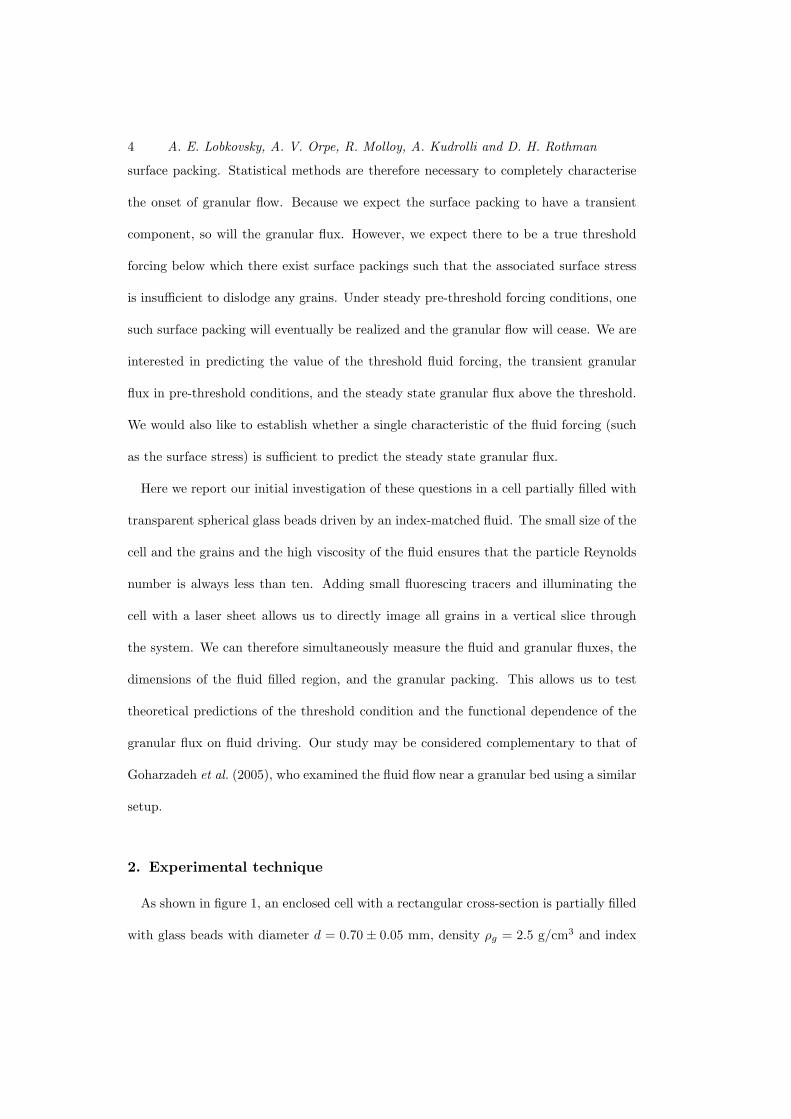
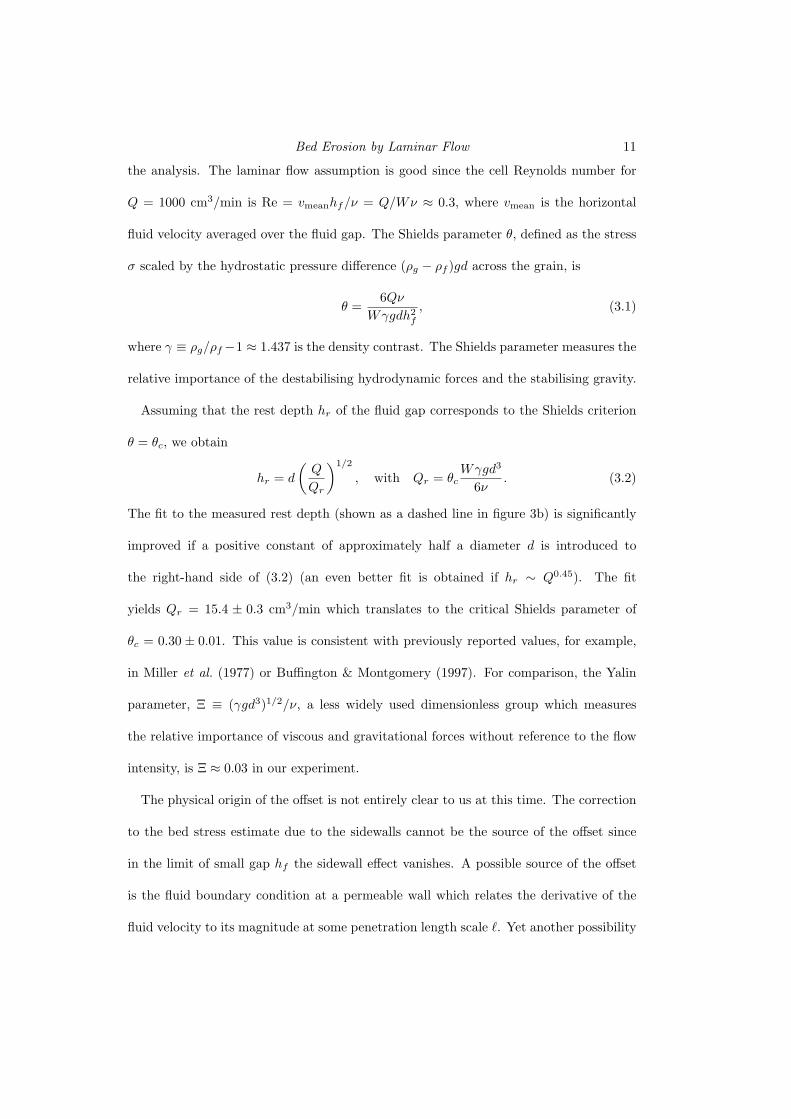
Figure 4. Einstein number q∗ vs. the excess θ− θc of the dimensionless shear stress. Solid line
is a power-law fit to the region θ − θc < 0.3. Dashed line is a power law fit with λ = 1.6 fixed.
is that the offset could be due to the way in which hf is measured. We use the mean
surface height to represent the mean boundary stress. In reality, however, fluid flow past
a rough permeable medium creates a distribution of bed stresses and the estimate of its
mean using a non-slip boundary condition at a flat wall is a gross approximation. The
fact that the error in the estimate of the mean stress translates to a height offset that is
only half a bead diameter is a pleasant surprise.
4. Flow rule
Tracking all grains in a vertical slice as mentioned in section 2 allows us to directly
measure the grain flux qg and to attempt to relate it to the estimated mean bed stress.
In general, other factors besides bed stress, such as the flow history, could influence the
grain flux. Although an unambiguous relationship between grain flux and bed stress is
usually tacitly assumed, here we test it directly.
Following convention (Einstein, 1950) we use the Einstein number q∗ = qg/(γgd3)1/2,
i.e. the non-dimensionalised grain flux. Figure 4 is a plot of q∗ vs. the estimated excess
Page 13
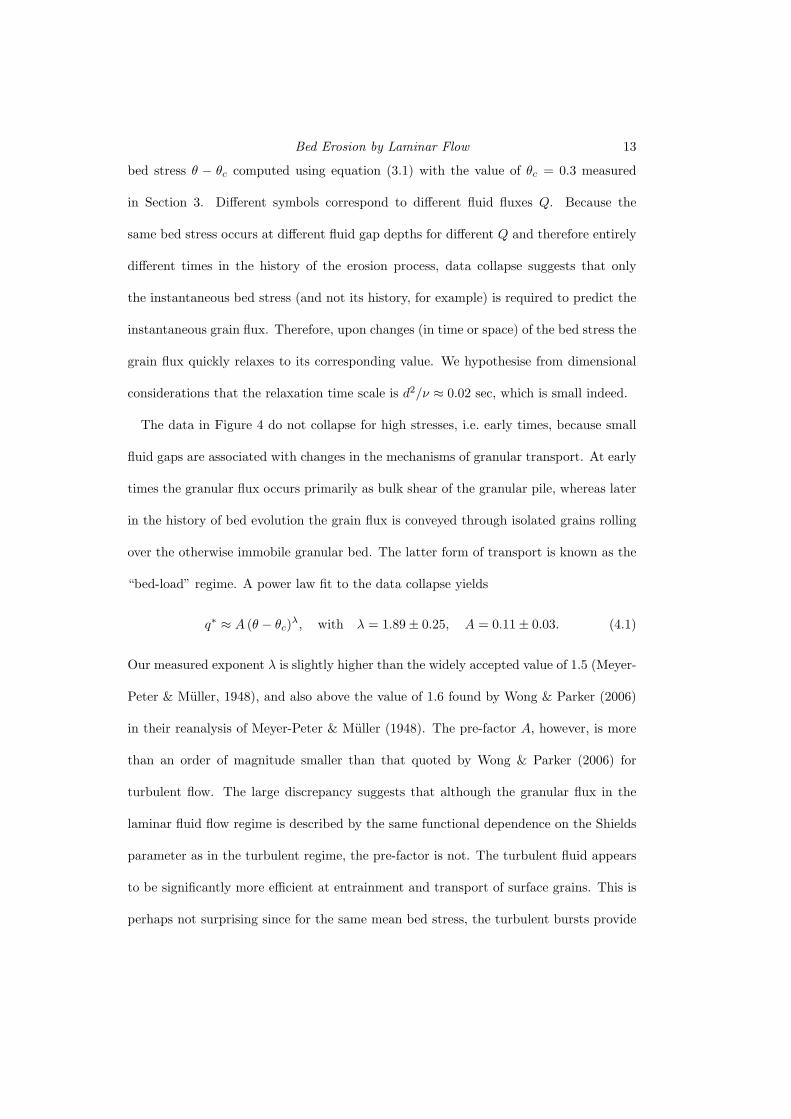
Bed Erosion by Laminar Flow 13
bed stress θ − θc computed using equation (3.1) with the value of θc = 0.3 measured
in Section 3. Different symbols correspond to different fluid fluxes Q. Because the
same bed stress occurs at different fluid gap depths for different Q and therefore entirely
different times in the history of the erosion process, data collapse suggests that only
the instantaneous bed stress (and not its history, for example) is required to predict the
instantaneous grain flux. Therefore, upon changes (in time or space) of the bed stress the
grain flux quickly relaxes to its corresponding value. We hypothesise from dimensional
considerations that the relaxation time scale is d2/ν ≈ 0.02 sec, which is small indeed.
The data in Figure 4 do not collapse for high stresses, i.e. early times, because small
fluid gaps are associated with changes in the mechanisms of granular transport. At early
times the granular flux occurs primarily as bulk shear of the granular pile, whereas later
in the history of bed evolution the grain flux is conveyed through isolated grains rolling
over the otherwise immobile granular bed. The latter form of transport is known as the
“bed-load” regime. A power law fit to the data collapse yields
q∗ ≈ A (θ − θc)λ, with λ = 1.89± 0.25, A = 0.11± 0.03. (4.1)
Our measured exponent λ is slightly higher than the widely accepted value of 1.5 (Meyer-
Peter & Muller, 1948), and also above the value of 1.6 found by Wong & Parker (2006)
in their reanalysis of Meyer-Peter & Muller (1948). The pre-factor A, however, is more
than an order of magnitude smaller than that quoted by Wong & Parker (2006) for
turbulent flow. The large discrepancy suggests that although the granular flux in the
laminar fluid flow regime is described by the same functional dependence on the Shields
parameter as in the turbulent regime, the pre-factor is not. The turbulent fluid appears
to be significantly more efficient at entrainment and transport of surface grains. This is
perhaps not surprising since for the same mean bed stress, the turbulent bursts provide
Page 14
14 A. E. Lobkovsky, A. V. Orpe, R. Molloy, A. Kudrolli and D. H. Rothman
a more effective dislodging process than the smoothly varying bed stress in the laminar
flow regime.
5. Approach to rest height
The experimentally verified relationship between the bed stress and the granular flux
allows us to compute the entire history of the fluid gap depth hf (x, t) (x is the coordinate
in the flow direction) as it approaches the rest depth hr. The mean thickness of the
flowing grain layer is negligible compared to hf in the “bed-load” regime. Therefore, we
write the conservation of sediment as
∂hf
∂t=
∂qg
∂x. (5.1)
To study the approach of the profile to the rest height hr, we introduce ξ = hf/hr, scale
all lengths by d and times by√
d/γg and use the flow rule (4.1) which can be expressed
as q∗ = Aθλc (1/ξ2 − 1)λ. Eq. (5.1) can therefore be written as
∂ξ
∂t+ c(ξ)
∂ξ
∂x= 0, c(ξ) = 2λAθλ
c ξ−1−2λ(1− ξ2)λ−1 d
hr. (5.2)
Given an initial condition ξ(x, t0) = ξ0(x), the solution to equation (5.2) (obtained by
the method of characteristics) determines ξ(x, t) implicitly through ξ(x, t) = ξ0(x −
c(ξ(x, t)) t).
There are two issues which make the full solution of (5.2) difficult to use. First, a
possibility exists that the granular flux includes a term proportional to the gradient of
the bed height resulting in a diffusive term in (5.2). Our measurements of the bed height
are not sufficiently resolved to verify or reject such a diffusive term. Second, the domain
of applicability of equation (5.2) is limited in time and space. In the beginning of the
experiment, granular transport is mainly conveyed via bulk shear and thus does not
obey (4.1). Also, near the inlet ramp the bed height may change rapidly and thus the
Page 15
Bed Erosion by Laminar Flow 15
approximate expression for the shear stress (3.1) is invalid there. Fixing the initial and
boundary conditions for equation (5.2) is therefore not feasible. Thus the full solution is
not useful.
However, the long time asymptotic solution to (5.2) with a small diffusive term may
be insensitive to the initial and boundary conditions. Therefore, we seek a separable
solution to (5.2) in the limit ξ → 1 (i.e. nearly flat bed)
ξ(x, t) = 1−(
x− x0
B (t− t0)
)1/(λ−1)
, (5.3)
where x0 and t0 are integration constants and B = λA(2θc)λd/hr.
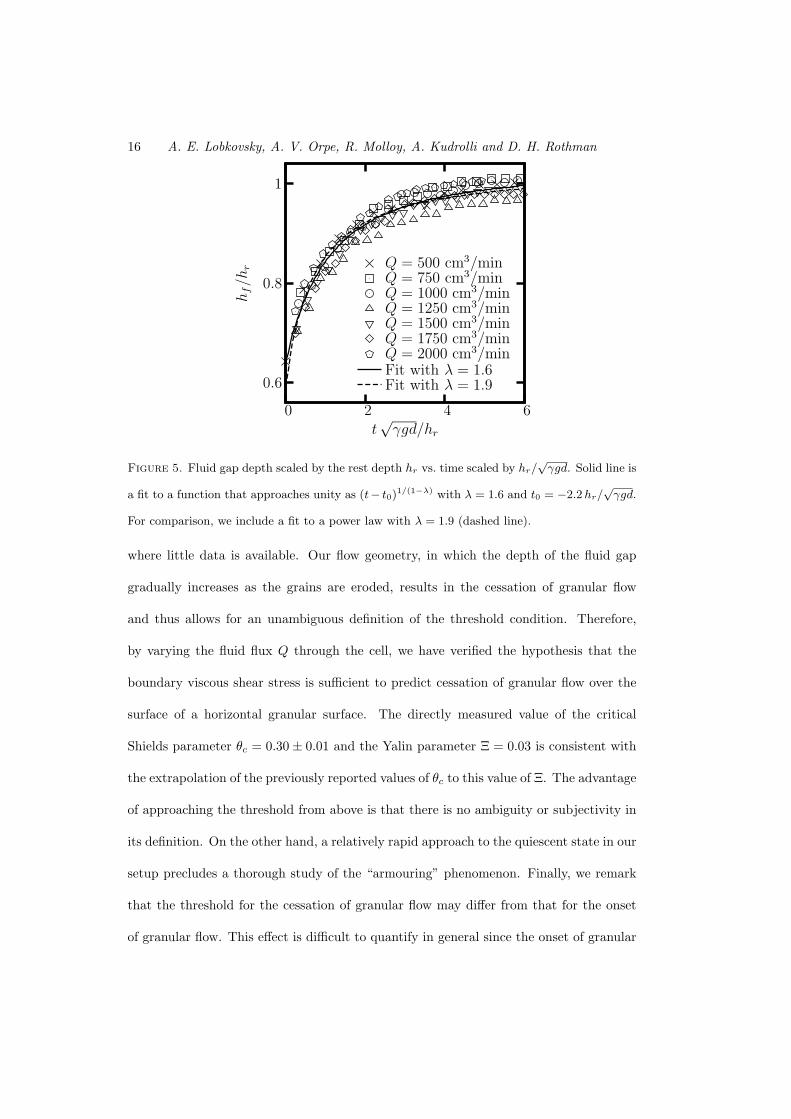
Because the height of the bed changes by less than a diameter along the cell, an
experimental test of the spatial variation in Eq. (5.3) is impractical in our setup. We
therefore focus on the approach of the fluid depth averaged over the observation window
to the rest depth hr (cf. figure 3a). Equation (5.3) implies that once the fluid gap depth
hf is scaled by rest depth hr and time is scaled by hr/√
γgd, the data should collapse
onto a master curve which approaches unity as the power law (t − t0)1/(1−λ). Figure 5
shows the data collapse. The power law fit to the resulting data cloud yields the offset
time t0 ≈ −2.2 hr/√
γgd and the exponent λ = 1.6 ± 0.1. The predicted data collapse
suggests that the assumed functional relationship between the instantaneous bed stress
and granular flux is indeed correct. It is difficult to interpret the value of t0, since the
asymptotic solution (5.3) only applies at long times. The fitted value for λ falls just
outside the 1σ interval of the value quoted in (4.1), but is consistent with the value
found by Wong & Parker (2006).
6. Discussion
In summary, we have revisited the well-studied problem of a sand bed driven by an
overlying viscous fluid. We focused on precise measurements in the laminar flow regime
Page 16
16 A. E. Lobkovsky, A. V. Orpe, R. Molloy, A. Kudrolli and D. H. Rothman
Fit with λ = 1.9Fit with λ = 1.6Q = 2000 cm3/minQ = 1750 cm3/minQ = 1500 cm3/minQ = 1250 cm3/minQ = 1000 cm3/minQ = 750 cm3/minQ = 500 cm3/min
t√
γgd/hr
hf/h
r
6420
1
0.8
0.6
Figure 5. Fluid gap depth scaled by the rest depth hr vs. time scaled by hr/√
γgd. Solid line is
a fit to a function that approaches unity as (t− t0)1/(1−λ) with λ = 1.6 and t0 = −2.2 hr/
√γgd.
For comparison, we include a fit to a power law with λ = 1.9 (dashed line).
where little data is available. Our flow geometry, in which the depth of the fluid gap
gradually increases as the grains are eroded, results in the cessation of granular flow
and thus allows for an unambiguous definition of the threshold condition. Therefore,
by varying the fluid flux Q through the cell, we have verified the hypothesis that the
boundary viscous shear stress is sufficient to predict cessation of granular flow over the
surface of a horizontal granular surface. The directly measured value of the critical
Shields parameter θc = 0.30± 0.01 and the Yalin parameter Ξ = 0.03 is consistent with
the extrapolation of the previously reported values of θc to this value of Ξ. The advantage
of approaching the threshold from above is that there is no ambiguity or subjectivity in
its definition. On the other hand, a relatively rapid approach to the quiescent state in our
setup precludes a thorough study of the “armouring” phenomenon. Finally, we remark
that the threshold for the cessation of granular flow may differ from that for the onset
of granular flow. This effect is difficult to quantify in general since the onset of granular
Page 17
Bed Erosion by Laminar Flow 17
flow is marked by transient flow and steady driving is impossible in our cell since any
erosion leads to a decrease in driving.
We directly verified that the boundary shear stress determines not only the onset of
granular flow, but also the granular flux over a roughly horizontal bed in non-steady
driving conditions. This is an important result since it implies that the granular flux
quickly adjusts to changes in the driving. We have established the power law relation-
ship between the grain flux and the excess boundary shear stress via two independent
measurements. We measure the granular flux directly by particle tracking and, alterna-
tively, we analyse the approach of the bed height to the quiescent state. The average
of the two independently measured exponents is λ = 1.75 ± 0.25. The pre-factor in the
power law relationship between the Einstein number and the excess Shields stress is more
than an order of magnitude smaller than that in the widely used “bed-load” granular flux
rule (Wong & Parker, 2006), indicating perhaps a different mechanism for the granular
transport in the laminar fluid flow regime.
We have measured the parameters in the granular flux rule (4.1) not only for a par-
ticular range of Reynolds numbers, but also for a particular type of grains—smooth
spheroids. How the parameters in (4.1) depend on the grain properties such as shape,
friction constant and roughness is an interesting and open question.
Lastly, we note that since the threshold condition in our experiment is reached gradu-
ally, our problem is similar to the relaxation of a dry granular pile expressed in terms of
the angle of repose. Moreover, the concept of a Shields threshold, typically defined via
the onset of granular flow due to gradually increased fluid driving, may be analogous to
the notion that dry granular piles can be characterised by a maximum angle of stability.
The work was funded by the Department of Energy grants DE-FG0202ER15367 (Clark),
Page 18
18 A. E. Lobkovsky, A. V. Orpe, R. Molloy, A. Kudrolli and D. H. Rothman
DE-FG0299ER15004 (MIT), and the National Science Foundation grant number CTS-
0334587 (Clark).
References
Bailard, J. A. 1981 An energetics total load sediment transport model for a plane
sloping beach. J. Geophys. Res.–Oceans and Atmospheres 86 (NC11), 938–54.
Beavers, G. S. & Joseph, D. S. 1967 Boundary conditions near a permeable wall. J.
Fluid Mech. 30 (1), 197–207.
Blum, M. D. & Tornqvist, T. E. 2000 Fluvial responses to climate and sea-level
change: a review and look forward. Sedimentology 47, 2–48.
Bonamy, D., Daviaud, F., Laurent, L., Bonetti, M. & Bouchaud, J. P. 2002
Multiscale clustering in granular surface flows. Phys. Rev. Lett. 89 (3), 034301.
Brinkman, H. C. 1949 A calculation of the viscous force exerted by a flowing fluid on
a dense swarm of particles. Appl. Sci. Res. A 1 (1), 27–34.
Buffington, J. M. & Montgomery, D. R. 1997 A systematic analysis of eight
decades of incipient motion studies, with special reference to gravel-bedded rivers.
Water Resour. Res. 33 (8), 1993–2029.
Burbank, D. W., Leland, J., Fielding, E., Anderson, R. S., Brozovic, N.,
Reid, M. R. & Duncan, C. 1996 Bedrock incision, rock uplift and threshold hillslopes
in the northwestern Himalayas. Nature 379, 505–10.
Charru, F., Mouilleron, H. & Eiff, O. 2004 Erosion and deposition of particles on
a bed sheared by a viscous flow. J. Fluid Mech. 519, 55–80.
Cornish, R. J. 1928 Flow in a pipe of rectangular cross-section. Proc. Roy. Soc. London,
Ser. A 120 (786), 691–700.
Dancey, C. L., Diplas, P., Papanicolaou, A. & Bala, M. 2002 Probability of
Page 19
Bed Erosion by Laminar Flow 19
individual grain movement and threshold condition. J. Hydraul. Eng. 128 (12), 1069–
75.
Douady, S., Andreotti, B., Daerr, A. & Clade, P. 2002 From a grain to
avalanches: on the physics of granular surface flows. Compt. Rend. Phys. 3 (2), 177–86.
Einstein, H. A. 1950 The bed-load function for sediment transportation in open channel
flows. Technical Bulletin 1026. United States Department of Agriculture, Washington.
Goharzadeh, A., Khalili, A. & Jorgensen, B. B. 2005 Transition layer thickness
at a fluid-porous interface. Phys. Fluids 17, 057102.
Graf, W. H. 1971 Hydraulics of sediment transport . McGraw-Hill, New York.
Graf, W. H. & Pazis, G. C. 1977 Deposition and erosion in an alluvial channel. J.
Hydraul. Res. 15, 151–65.
Grass, A. J. 1971 Structural features of turbulent flow over smooth and rough bound-
aries. J. Fluid Mech. 50, 233–55.
Howard, A. D. 1994 A detachment-limited model of drainage-basin evolution. Water
Resour. Res. 30 (7), 2261–85.
Jaeger, H. M., Liu, C. & Nagel, S. R. 1989 Relaxation at the angle of repose. PRL
62 (1), 40–43.
Jimenez, J. 2004 Turbulent flows over rough walls. Ann. Rev. Fluid Mech. 36, 173–196.
Kenyon, P. M. & Turcotte, D. L. 1985 Morphology of a delta prograding by bulk
sediment transport. Geol. Soc. Am. Bull. 96, 1457–65.
Komar, P. D. 1998 Beach processes and sedimentation. Prentice-Hall, Upper Saddle
River, N.J.
Meyer-Peter, E. & Muller, R. 1948 Formulas for bed-load transport. In Proceedings
of the 2nd Meeting of the International Association for Hydraulic Structures Research,
pp. 39–64. Int. Assoc. Hydraul. Res., Delft, Netherlands.
Page 20
20 A. E. Lobkovsky, A. V. Orpe, R. Molloy, A. Kudrolli and D. H. Rothman
Miller, M. C., McCave, I. N. & Komar, P. D. 1977 Threshold of sediment motion
under unidirectional currents. Sedimentology 24, 507–27.
Murray, A. B. & Paola, C. 1994 A cellular-model of braided rivers. Nature 371,
54–7.
Neill, C. R. & Yalin, M. S. 1969 Quantitative definition of beginning of bed move-
ment. J. Hydraul. Div. Am. Soc. Civ. Eng. 95, 585–8.
Papanicolaou, A. N., Diplas, P., Dancey, C. L. & Balakrishnan, M. 2001 Sur-
face roughness effects in near-bed turbulence: Implications to sediment entrainment.
J. Eng. Mech.-ASCE 127 (3), 211–8.
Paphitis, D. 2001 Sediment movement under unidirectional flows: an assessment of
empirical threshold curves. Coastal Engineering 43, 227–45.
Paphitis, D. & Collins, M. B. 2005 Sand grain threshold, in relation to bed ’stress
history’: an experimental study. Sedimentology 52, 827–38.
Parker, G., Paola, C., Whipple, K. X. & Mohrig, D. 1998 Alluvial fans formed
by channelized fluvial and sheet flow. i: Theory. J. Hydraul. Eng.-ASCE 124 (10),
985–95.
Quartier, L., Andreotti, B., Douady, S. & Daerr, A. 2000 Dynamics of a grain
on a sandpile model. Phys. Rev. E 62 (6), 8299–8307.
van Rijn, L. C. 1989 Handbook of sediment transport by currents and waves. Report
H 461. Delft Hydraulics, Delft, Netherlands.
Samson, L., Ippolito, I., Bideau, D. & Bartouni, G. G. 1999 Motion of grains
down a bumpy surface. Chaos 9 (3), 639–48.
Shields, A. 1936 Anwendung der Ahnlichkeitsmechanik und der Turbulenzforschung
auf die Geschiebebewegung. Tech. Rep. Heft 26. Mitteilung der Preussischen Versuch-
sanstalt fur Wasserbau und Schiffbau, Berlin, Germany. (In German).
Page 21
Bed Erosion by Laminar Flow 21
Shvidchenko, A. B. & Pender, G. 2000 Flume study of the effect of relative depth
on the incipient motion of uniform sediments. Water Resour. Res. 36 (2), 619–28.
Siavoshi, S., Orpe, A. V. & Kudrolli, A. 2006 Friction of a slider on a granular layer:
Nonmonotonic thickness dependence and effect of boundary. Phys. Rev. E 73 (1),
010301.
Tsai, J.-C., Voth, G. A. & Gollub, J. P. 2003 Internal granular dynamics, shear-
induced crystallization, and compaction steps. Phys. Rev. Lett. 91 (6), 64301.
Vanoni, V. A. 1964 Measurements of critical shear stress for entraining fine sediments
in a boundary layer. Tech. Rep. KH–R–7. W. M. Keck Lab. of Hydraulics and Water
Resourses, Cal. Inst. Tech.
Wong, M. & Parker, G. 2006 Reanalysis and correction of bed-load relation of Meyer-
peter and Muller using their own database. J. Hydraul. Eng. 132 (11), 1159–68.
Yalin, M. S. 1977 Mechanics of sediment transport , 2nd edn. Pergamon Press, Oxford,
New York.