WATER RESOURCES RESEARCH, VOL. 36, NO. 4, PAGES 1129-1142, APRIL 2000 Erosion thresholds and suspended sediment yields, Waipaoa River Basin, New Zealand D. Murray Hicks National Instituteof Water and Atmospheric Research, Christchurch, New Zealand Basil Gomez Department of Geography and Geology, Indiana StateUniversity, Terre Haute Noel A. Trustrum Landcare Research Ltd., Palmerston North, New Zealand Abstract. Characteristics of the suspended sediment load in the WaipaoaRiver, New Zealand,and in two of its tributaries (Mangatuand Te Arai Rivers)are examined for evidence of different dominant erosion processes in the basins upstream. Different shapes of the suspended sediment concentration-water discharge relations lead to differences in long-term average yield, event-yield magnitude-frequency relations, and relative importance of large flowsand rare events. In the Mangatu River, frequentrunoff events 2 1 are relatively more important to the long-term yield (11,540t km- yr- ), half of the long- term average load is transported by events with return periods less than -1 year, and there is little evidence of an erosion threshold limitation on sediment supply. This is consistent with the predominance in the Mangatubasinof hillslope erosion processes that involve scour by surface and channelized runoff, particularly gully erosion. This contrasts with the Te Arai River where sediment concentration tends to be much lower at low and moderate flows, frequent runoff events transport less of thelong-term yield (4600 t km -2 yr -•) than dorarer, large-magnitude flood events, event sediment yields are anorder of magnitude lower duringevents with subannual return periods, and half of the long-term average load is transported duringevents with a return period of >2 years.Some of these characteristics appearto resultin part from two populations of runoff events in the Te Arai basin; nonetheless, they are consistent with field evidence that most of the sediment supplied to the Te Arai stream networkis generated by shallow landslides which are activated once a rainfall threshold is exceeded. 1. Introduction At most points along a channel network,the discharge of suspended sediment is a reflection of the quantityof material delivered from a plethoraof hillslope and channel sources in the drainage basin upstream [Bo•ie a•d M•t½h[er, 1986]. Knowledge of these sources and the processes which deter- mine their delivery rate to stream channels is required to formulatesediment budgets [Reida•d D•e, 1996], to en- hancethe performance of simulation models[VanSickle and Beschta, 1983], and to make informedmanagement decisions aboutthe effectiveness of land use and pollutioncontrolstrat- egies [Novotny, 1980; Parkerand Osterkamp, 1995]. However,establishing links between the erosion processes and sediment sources in headwater basins and suspended sed- iment loadsmeasured at downstream pointsis rarely straight forward. One approach is to correlate time series information on sources and loads in an attemptto trackthe progression of sediment "slugs." While this approach has utility in smaller basins, in largerbasins it can be confounded by the intricate system of sources, tributarylinks, and sinks, spatialand tem- Copyright 2000 by the AmericanGeophysical Union. Paper number 1999WR900340. 0043-1397/00/1999 WR 900340509.00 poral variation in erosion processes, erosion thresholds, and the effects of prior events [Meade,1982;Campbell, 1992].In other words, the complexity of larger basins tendsto obscure relations between hillslope delivery processes to low-order drainage systems and the dynamics of suspended sediment transport in high-order channels. An alternative approach is to identify signatures of the dom- inant erosion processes in the relationship between sediment concentration and water discharge, the load distributionby flow interval, and the magnitude-frequency characteristics of event sedimentloads. It is reasonably well established that streamflow events of moderatemagnitude and frequency ap- pear to be more important than large-magnitude, low- frequency flood events in basins with relatively stable land use patterns where surface wash contributes mostof the sediment to the streamchannel[e.g., Wolman and Miller, 1960; Webb and Walling, 1982, 1984; Hicks, 1994].The reverse should be true in areas where mass movements, such as landslides, are the dominanterosion featuresbecause of the higher erosion thresholds typically observed for these processes [cf.Hack and Goodlett, 1960; O'Loughlin et al., 1978; Hovius et al., 1997]. In this paper,we examine characteristics of river sediment loads in the WaipaoaRiver Basin of New Zealand's East Cape region for evidence of such an erosion threshold effect.Recent work [Page et al., 1994;Trustrum et al., 1999; Reid and Page, 1129
Transcript
WATER RESOURCES RESEARCH, VOL. 36, NO. 4, PAGES 1129-1142, APRIL 2000
Erosion thresholds and suspended sediment yields, Waipaoa River Basin, New Zealand
D. Murray Hicks National Institute of Water and Atmospheric Research, Christchurch, New Zealand
Basil Gomez
Department of Geography and Geology, Indiana State University, Terre Haute
Noel A. Trustrum
Landcare Research Ltd., Palmerston North, New Zealand
Abstract. Characteristics of the suspended sediment load in the Waipaoa River, New Zealand, and in two of its tributaries (Mangatu and Te Arai Rivers) are examined for evidence of different dominant erosion processes in the basins upstream. Different shapes of the suspended sediment concentration-water discharge relations lead to differences in long-term average yield, event-yield magnitude-frequency relations, and relative importance of large flows and rare events. In the Mangatu River, frequent runoff events
2 1 are relatively more important to the long-term yield (11,540 t km- yr- ), half of the long- term average load is transported by events with return periods less than -1 year, and there is little evidence of an erosion threshold limitation on sediment supply. This is consistent with the predominance in the Mangatu basin of hillslope erosion processes that involve scour by surface and channelized runoff, particularly gully erosion. This contrasts with the Te Arai River where sediment concentration tends to be much lower at low and
moderate flows, frequent runoff events transport less of the long-term yield (4600 t km -2 yr -•) than do rarer, large-magnitude flood events, event sediment yields are an order of magnitude lower during events with subannual return periods, and half of the long-term average load is transported during events with a return period of >2 years. Some of these characteristics appear to result in part from two populations of runoff events in the Te Arai basin; nonetheless, they are consistent with field evidence that most of the sediment supplied to the Te Arai stream network is generated by shallow landslides which are activated once a rainfall threshold is exceeded.
1. Introduction
At most points along a channel network, the discharge of suspended sediment is a reflection of the quantity of material delivered from a plethora of hillslope and channel sources in the drainage basin upstream [Bo•ie a•d M•t½h[er, 1986]. Knowledge of these sources and the processes which deter- mine their delivery rate to stream channels is required to formulate sediment budgets [Reid a•d D•e, 1996], to en- hance the performance of simulation models [VanSickle and Beschta, 1983], and to make informed management decisions about the effectiveness of land use and pollution control strat- egies [Novotny, 1980; Parker and Osterkamp, 1995].
However, establishing links between the erosion processes and sediment sources in headwater basins and suspended sed- iment loads measured at downstream points is rarely straight forward. One approach is to correlate time series information on sources and loads in an attempt to track the progression of sediment "slugs." While this approach has utility in smaller basins, in larger basins it can be confounded by the intricate system of sources, tributary links, and sinks, spatial and tem-
Copyright 2000 by the American Geophysical Union.
Paper number 1999WR900340. 0043-1397/00/1999 WR 900340509.00
poral variation in erosion processes, erosion thresholds, and the effects of prior events [Meade, 1982; Campbell, 1992]. In other words, the complexity of larger basins tends to obscure relations between hillslope delivery processes to low-order drainage systems and the dynamics of suspended sediment transport in high-order channels.
An alternative approach is to identify signatures of the dom- inant erosion processes in the relationship between sediment concentration and water discharge, the load distribution by flow interval, and the magnitude-frequency characteristics of event sediment loads. It is reasonably well established that streamflow events of moderate magnitude and frequency ap- pear to be more important than large-magnitude, low- frequency flood events in basins with relatively stable land use patterns where surface wash contributes most of the sediment to the stream channel [e.g., Wolman and Miller, 1960; Webb and Walling, 1982, 1984; Hicks, 1994]. The reverse should be true in areas where mass movements, such as landslides, are the dominant erosion features because of the higher erosion thresholds typically observed for these processes [cf. Hack and Goodlett, 1960; O'Loughlin et al., 1978; Hovius et al., 1997].
In this paper, we examine characteristics of river sediment loads in the Waipaoa River Basin of New Zealand's East Cape region for evidence of such an erosion threshold effect. Recent work [Page et al., 1994; Trustrum et al., 1999; Reid and Page,
1129
1130 HICKS ET AL.: EROSION THRESHOLDS AND SUSPENDED SEDIMENT YIELDS
i ::?• Pacific ß :':•.....• Ocean
0 100 200 ,/::'":'"?...:•i/ km ' '•
0 = Omapere P = Pike's Weir
K = Kanakanaia
Te
I 178 ø E
Gisborne
Poverty Bay
0 10 20
km
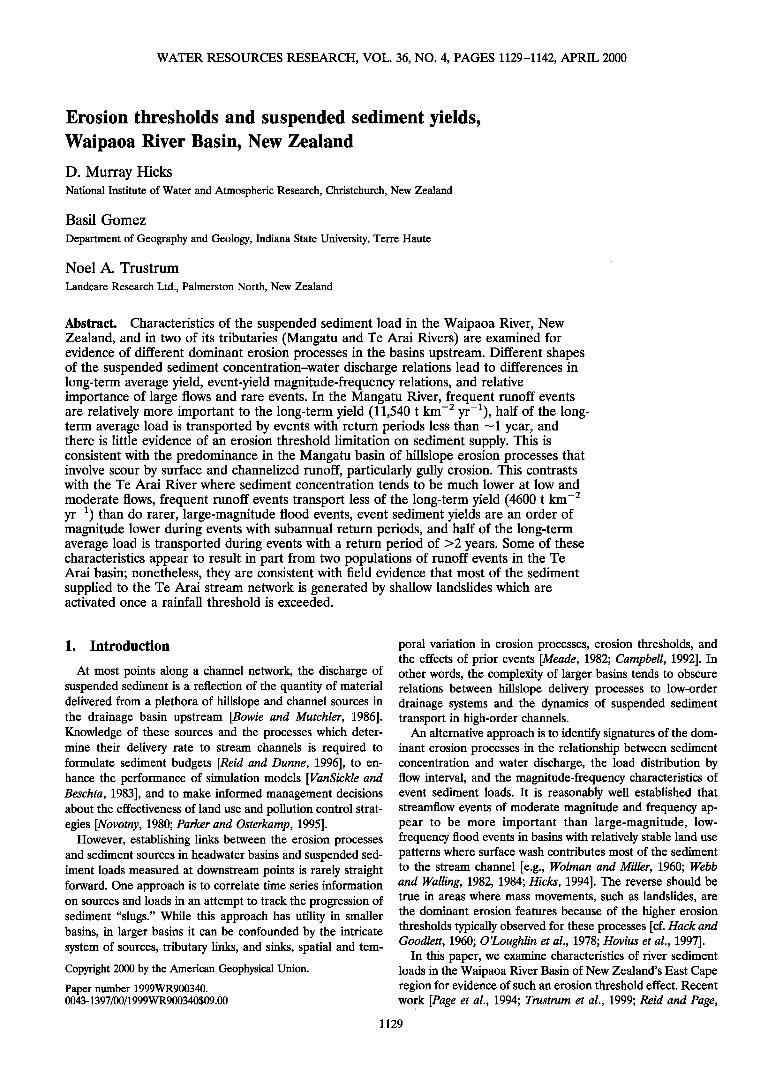
Figure 1. Map of the Waipaoa River catchment, locating the gauging sites on the Waipaoa main stem and on the Te Arai and Mangatu Rivers. Inset map locates the Waipaoa, Motu (M), and Waiapu (W) catchments in the East Cape region of North Island, New Zealand.
2000] in this region has shown that a higher storm rainfall is required to activate landslips than to initiate surface-wash type processes such as gully erosion. Specifically, we test the hy- pothesis that in tributary basins where shallow landsliding is known to be the dominant erosion process, frequent smaller runoff events should transport less of the long-term yield than rarer, large-magnitude flood events, with the converse ex- pected in tributary basins where gullies are the main sources of sediment supplied to the stream network. To this end, we analyze the suspended sediment loads at three gauging stations in the Waipaoa River Basin, located at sites on the main stem and two tributary streams, one draining a basin dominated by shallow landsliding and the other dominated by gully erosion.
Our basic approach is to use suspended sediment rating curves to estimate the long-term average sediment yield and the frequency distribution of event sediment yields. Some cau- tions attend this approach. First it is well known that as well as being affected by sediment supply, sediment-yield magnitude- frequency relations are also affected by the flow regime and by in-stream transport competence [e.g., Wolman and Miller, 1960; Baker, 1977; Andrews, 1980; Nolan et al., 1987; Ashmore and Day, 1988]. In this study, we check for flow regime differ- ences among our study sites by comparing flow-duration and flood-peak magnitude-frequency relations. We expect no sig- nificant difference in suspended sediment load characteristics that relate to competence effects because the basement mate- rial in the study basins consists mainly of either fine sedimen- tary rocks or well-crushed greywackes and argillites that yield an abundance of fine, silt-clay grade material. As a conse-
quence, suspended load at the gauging sites far exceeds bed- load. Second, event sequencing and landscape recovery after extreme events can influence the amount of sediment trans-
ported by a flood event of given magnitude [Beven, 1981; Wall- ing and Webb, 1987; Gomez et al., 1995]. We check for this effect by examining the stationarity (i.e., steadiness in time) of the sediment concentration versus discharge relationships after extreme events.
Finally, by relating in-basin variability in storm yield magni- tude-frequency characteristics to erosion processes at the trib- utary scale, our approach provides a bridge between event- based studies of sediment delivery from specific erosion sites and the space- and time-averaged sediment yield of large drainage basins. This provides a useful context in which to compare our sediment yield results with those reported previ- ously for the Waipaoa River Basin [Jones and Howie, 1970; Adams, 1979; Griffiths, 1982] and for other large basins in New Zealand's East Cape region.
2. Study Area The 2205 km 2 Waipaoa River Basin drains into Poverty Bay
on the East Coast of New Zealand's North Island (Figure 1). It is underlain by thrusted Cretaceous and Paleocene mudstone and argillite, Jurassic to early Cretaceous greywacke, and a cover sequence of poorly consolidated Miocene-Pliocene sand- stone, siltstone, and mudstone [Mazengarb et al., 1991]. Sub- duction has induced uplift rates as high as 10 mm yr- • in the
HICKS ET AL.: EROSION THRESHOLDS AND SUSPENDED SEDIMENT YIELDS 1131
Table 1. Characteristics of Basin, Flows, Suspended Sediment Gaugings, and Suspended Sediment Loads at the Three Study Sites
River Waipaoa Mangatu Te Arai
Gauging station Kanakanaia Bridge Omapere Pykes Weir Drainage area, km 2 1580 183 83 Annual rainfall,* mm 1471 1900 1420 Period of flow record Jan. 1960 to Dec. 1996 Aug. 1983 to Dec. 1996 Jan. 1984 to Dec. 1996 Period of sediment measurements Jan. 1962 to Nov. 1996 May 1968 to Nov. 1996 Sep. 1981 to Aug. 1996 Mean flow (Q .... ), m3 s-1 34.7 7.16 2.03 Mean annual flood (Q•_AF), m3 S-1 1346 361 145 Highest flow on record, m 3 s -1 5286 1169 260? Number of sediment measurements 301 172 48
Maximum measured concentration, mg L -1 36814 34657 20746 Maximum flow with sediment 1826 124 110
measurement, m 3 s -1 Suspended sediment yield, t a- 1 10,670,000 2,112,000 380,000 95% CI factorial error 1.15 1.24 2.69
Bulk log-log bias correction factor 1.08 1.22 ... Most-effective flow, m 3 s -1 360 9.1 72 Q5o, m3 S-1 500 69 106 Load at Q < Q ..... % 1.3 4.3 <1 Load at Q < Q•F, % 84 76 87 Tso, years 1.1 1.2 2.0
*Rainfall for Te Arai is 30-year normal (1951-1980) for raingauge upstream from the flow recording site [Hessell, 1980]. The Waipaoa and Mangatu rainfalls are the average for the catchment upstream of the recording site, obtained by spatial integration over a surface of mean-annual rainfall.
?Estimated.
Raukumara Ranges at the head of the basin, but slight subsi- dence is experienced near the coast [Pillaris, 1986].
The Waipaoa Basin has a maritime climate and is periodi- cally disturbed by intense cyclonic and more localized storms [Hessell, 1980]. Mean annual rainfall averages 1470 mm above the main stem gauging station at Kanakanaia. Rainfall varia- tion across the basin is primarily controlled by topography, although it also varies with the source direction of individual weather systems. Weather from the north and northeast tends to produce greater rainfall in the headwaters and less near the coast, winds from the south produce the reverse pattern, while southeast winds tend to bring high rain to the whole basin. The largest rainstorms are associated with slow-moving depressions that generate winds from the easterly quarter. The largest historical storm was Cyclone Bola, which generated between 300 and 900 mm of rain, depending on the locality, between March 6 and 9, 1988.
Maori settlements in the Waipaoa River basin date from ---700 yr B.P. [Jones, 1988], but widespread clearing of the indigenous forest did not commence until after the arrival of European settlers in the late 1820s [Pullar, 1962]. By 1880, most of the lower reaches of the basin had been cleared, while the headwaters were cleared by 1920. Today, <3% of the basin remains under primary indigenous forest. Reforestation of headwater areas with exotic species, such as Pinus radiata, began in 1960, and commercial timber harvesting commenced in 1990.
The aforementioned physical and anthropogenic factors have combined to generate severe hillslope erosion over the past 170 years [O'Byrne, 1967; Allsop, 1973; Gage and Black, 1979]. This is particularly so in the basin headwaters, where amphitheater-like gully complexes up to 0.2 km 2 in area have developed in the highly sheared rocks [Gage and Black, 1979]. In the lower reaches of the basin, the hills underlain by the Miocene-Pliocene cover sequence are prone to shallow lands- liding. Erosion thresholds in the East Cape region are lower
for gullying (and similar erosion processes involving scour by runoff) than for landslides, which typically occur only when storm rainfall exceeds ---120-200 mm [DeRose et al., 1998; Reid and Page, 2000]. Thus, while established gullies are activated by small, frequent rainstorms, the shallow landslides are activated only during relatively infrequent, high-magnitude rainstorms.
Large amounts of fine sediment are delivered to stream channels by the gullies and shallow landslides [DeRose et al., 1998; Reid and Page, 2000], and the Waipaoa River has a mean suspended sediment concentration of ---1700 mg L -1. The an- nual average suspended sediment yield to Poverty Bay of 15 Mt (as determined here) ranks among the highest measured in New Zealand for a basin of comparable size [cf. Griffiths and Glasby, 1985; Hicks et al., 1996] and is also very high by global standards [cf. Holeman, 1968; Milliman and Meade, 1983; Wall- ing and Webb, 1996].
Of the two tributaries addressed in this paper, the Mangatu River drains a head water basin where gully erosion predom- inates, while the Te Arai River drains Miocene-Pliocene ter- rain where shallow landsliding is the dominant erosion process. Annual rainfall and runoff for these basins are compared in Table 1. Mangatu Basin, higher in elevation, receives higher rainfall.
We analyzed records for the Waipaoa mainstem gauging station at Kanakanaia Bridge, the Mangatu River at Omapere, and the Te Arai River at Pyke's Weir (Figure 1, Table 1). Water discharge and suspended sediment records for these sites have been collected by the Gisborne District Council. Depth-integrated suspended sediment samples are normally obtained at multiple verticals with a US D-49 sampler, and suspended sediment samples are typically collected in conjunc- tion with discharge gaugings made for the purpose of main- taining stage-discharge ratings. The number of sediment gaug- ings and length of flow record vary among the three sites (Table 1). The data set at Kanakanaia Bridge comprises just over 300 gaugings collected since 1962. These are well distrib-
1132 HICKS ET AL.: EROSION THRESHOLDS AND SUSPENDED SEDIMENT YIELDS
uted by season, flow band, and rising and falling stage. There are fewer sediment gaugings for the stations on the Mangatu and Te Arai Rivers (Table 1), where records date from 1968 and 1981, respectively. The quality of all three flow records is good, but we patched a day-long gap in the record for the Te Arai River that occurred during the Cyclone Bola storm using the flow record for the neighboring Wharekopae River scaled by catchment area.
The observed suspended sediment concentration-water dis- charge relations for the three study sites are plotted in Figure 2. Normalizing discharge with mean discharge permits a direct comparison (Figure 3). The relations for the Mangatu and Waipaoa Rivers are very similar and are curved in log-log space, indicating that the rate of increase in suspended sedi- ment concentration with discharge decreases at high dis- charges. This is probably conditioned by the relative rates of supply of water and sediment to the channel during large storms, rather than any inherent limitation on sediment supply. The similarity in the sediment rating relations for the Mangatu and Waipaoa Rivers lends support to the view that the sedi- ment load of the Waipaoa River is, in large part, also gener- ated by the same erosion processes that prevail in the Mangatu [cf. Trustrum et al., 1999]. The total amount of sediment gen- erated by gully erosion in the headwaters of the Waipaoa River Basin is unknown but, on the basis of area and elevation differences derived from high-resolution digital elevation mod- els constructed from aerial photographs, it is estimated that the spectacular Mangatu gully complex, covering •0.1% of the Waipaoa Basin area, generates •3% of the Waipaoa River's annual suspended sediment load [DeRose et al., 1998].
The Te Arai River shows a different relationship, with sub- stantial data scatter at discharges less than the mean discharge, concentrations several orders of magnitude lower for dis- charges 1-10 times the mean, and no apparent curvature in the log-log relationship at high discharges (Figure 3). The greater scatter in the Te Arai River relationship (the standard error of the estimate for the Te Arai curve equates to a factor of 11, compared to a factor of 2 for the Mangatu and Waipaoa) appears to reflect the nonstationary influence that shallow landsliding has on the supply of sediment to the stream net- work. In the period following heavy rainstorms, suspended sediment concentrations, for a given water discharge, increase dramatically. Indeed, all the points lying above the Te Arai rating curve (Figure 2) were obtained <1.5 years after two prolonged high-intensity storms that surpassed the rainfall threshold (250 mm in 72 hours) which Page et al. [1994] con- sider is required to induce widespread shallow landsliding. One of these storms occurred in April 1982 and the other in Sep- tember 1989. The Cyclone Bola storm also exceeded the rain- fall threshold, but no sediment gaugings were made at the Te Arai station until 18 months after this storm.
C versus Q rating curves were fitted to the log-transformed sediment gauging data (Figure 2) using a modified version of the locally weighted scatter smoothing (LOWESS) technique [Cleveland, 1979]. LOWESS provides an objective, empirical approach to curve fitting which requires no a priori assumption as to the form of the relationship. It is superior to least squares regression in cases, such as those we encountered, where the log C - log Q relation exhibits curvature. To define the pro-
100000
•. 1 oooo
• lOOO
c-
c- o
o
lOO
lO
1
o.1 O.Ol
100000
10000
E 1000
.9 100
c- 10
c- 1 o
0.1
0.01
a- Waipaoa at Kanakanaia
0.1
•o eøø o o, .o; risi•ng stage • o falling stage
•.yo rating ½,o ß alternative 1 ..... alternative 2
Qmean , I , ,
1 10 100 1000 10000
Discharge (m3s -1)
b: Mangatu at Omapere
ø f e o ß o• o
(•e o eø
rising stage
falling stage
ß x unspecified Xß
Qmean --rating i I i i
1 10 100 1000 10000
Discharge (m3s-•)
100000
ß - lOOOO
E lOOO v
.9 100
c- 10
c- 1 o
c: Te Arai at Pykes Weir
0.1 0.01
o
i I
x
• ß X , o o
•o X X o o
o o
Omean i I i
0.1
rising stage
falling stage
unspecified
-- rating !
1 10 100 1000 10000
Discharge (m3s -1)
Figure 2. Suspended sediment concentration versus water discharge relationships for the Waipaoa, Mangatu, and Te Arai Rivers. Rising and falling stage data points are distin- guished where possible. Solid lines show the locally weighted scatter smoothing (LOWESS)-derived rating curves. Qmean in- dicates the mean discharge. On the Waipaoa plot, broken lines plot two alternative relationships for the high-discharge range. On the Te Arai plot, clusters of points gauged < 1.5 years after major rainstorms are ringed with broken lines.
portion of the total number of data points included in the weighted local regression, the conventional approach is to ap- ply a constant "stiffness" factor (F) over the entire range of the
HICKS ET AL.: EROSION THRESHOLDS AND SUSPENDED SEDIMENT YIELDS 1133
100000
c
c ¸
10000
1000
IO0
10 +
1
o.1 O.Ol
i i i i i i i ,i ! i i i i i i ii i i , i i i i ii i i , I I Ill
o.1 1 lO lOO
Discharge / Mean Discharge Figure 3. Suspended sediment concentration versus water discharge normalized by mean discharge for the Waipaoa, Mangatu, and Te Arai Rivers.
independent variable (F = 0.2, 0.2, and 0.5 for the Waipaoa, Mangatu, and Te Arai Rivers, respectively). However, in the case of the Waipaoa and Mangatu Rivers, we changed the value of F to improve the fit of the curve because there are fewer data points at the high-discharge tail of the rating rela- tionship.
To ascertain if separate rating relationships were required for rising and falling stages at all three sites, the residuals from the log C - log Q rating curves were separated into rising or falling stage groups, and the two-sample t test and Mann- Whitney U test were used to assess if there was any significant difference between the two groups (the nonparametric Mann- Whitney test was used for the Te Arai because its residuals were not normally distributed). There was no significant dif- ference (at the 5% level) between rising and falling stage data groups at any of the three stations.
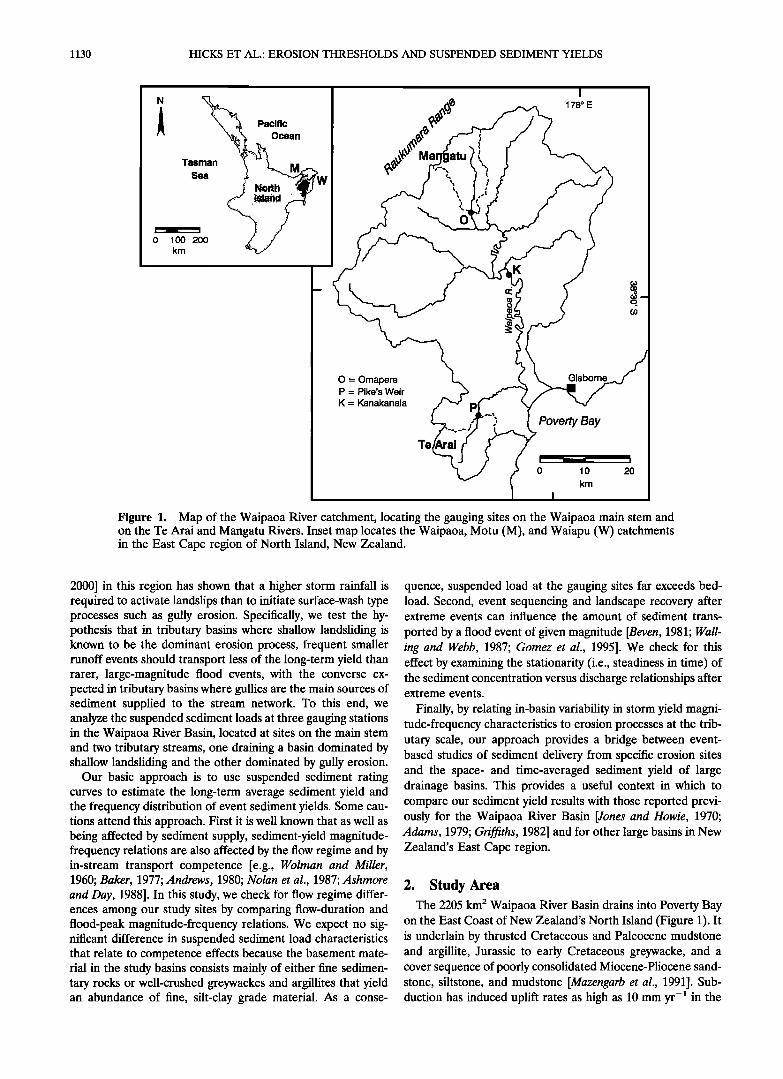
We corrected the log C - log Q ratings for log-log bias so that the ratings indicated the conditional arithmetic mean con- centration not the conditional geometric mean. The approach varied among the three stations, depending on whether the residuals (i.e., log C - log •) were normally distributed and were independent of discharge. For the Mangatu the residuals were normally distributed (Kolmorgorov-Smirnov test at 5% significance level) and were constant over the range of gauged discharge, thus the rating curve was adjusted using the factor exp (s2/2) [cf. Ferguson, 1987], where s is the standard error of the LOWESS curve in natural log units. In the case of the Waipaoa River, although the residuals were normally distrib- uted (<<5% significance level), they decreased as discharge increased (Figure 4). Thus we employed the log-log bias cor- rection factor exp (S•Q)/2)(Q), where (Q) signifies that both the local standard error and bias correction factor are condi-
tional on the discharge and the S(Q) function was defined as the running standard error over 60 data points (which matches the data window used by LOWESS for F = 0.2). The overall bias correction factors (i.e., averaged over the discharge range) for the Waipaoa and Mangatu Rivers were 1.08 and 1.22, respectively. No log-log bias correction was applied to the relation for the Te Arai River because the residuals were not
normally distributed (5% significance level). In cases where the
normality assumption is violated, the exp (s2/2) correction factor may induce errors that are larger than the errors it is designed to correct [Cohn et al., 1989].
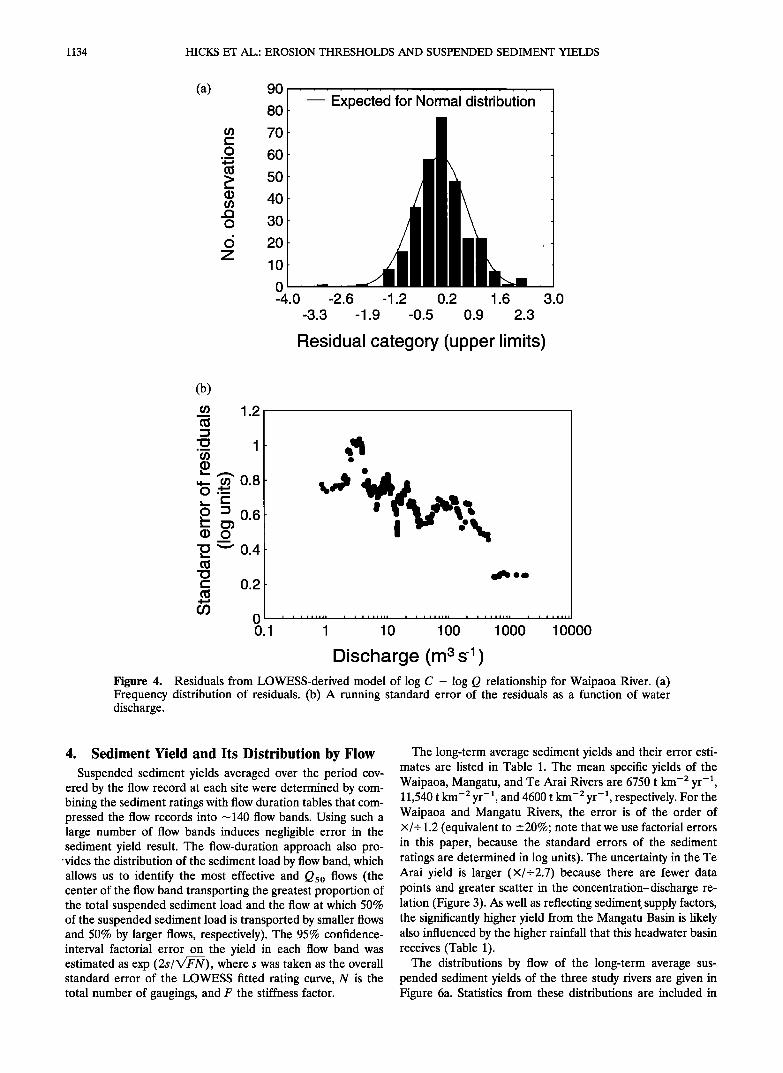
To ascertain if the Cyclone Bola storm induced nonstation- arity in the sediment rating curves (i.e., if the sediment dis- charge relationships changed with time), we separated the re- siduals from the log C - log Q rating curves into pre-Bola and post-Bola groups (Figure 5). At the Mangatu and Waipaoa sites, a two-sample t test of the residuals indicated that there was a significant (at the 5% level) increase in conditional concentration between gaugings made before the Cyclone Bola storm and gaugings made in the 3 years following the storm. On the basis of the difference in the mean residuals between
groups, the factor of increase was 1.4 for the Waipaoa River and 2.2 for the Mangatu River. No influence of the Cyclone Bola storm was apparent in the C-Q relationship at the Te Arai River, although this probably reflects the lack of gaugings there in the first 18 months after the storm. There was no
significant difference in the residuals for sediment gaugings made prior to and >3 years after the Cyclone Bola storm at any of the three sites, which suggests that the cyclone's impact on sediment loads was not long-lasting.
The fact that large rainstorms impart nonstationarity to the log C - log Q sediment rating relationships for all three sites raises some concern about how well the LOWESS-derived
sediment rating models represent the long-term conditional mean concentration (used to determine the long-term average yield) and the log C - log Q relationship during specific events (used to determine event yields). There is no explicit guarantee that the real sequence of events was representatively sampled. However, because the number of gaugings per year has been reasonably consistent, bias attributed to the gauging schedule has little effect on the estimates of the long-term average yields for the Waipaoa and Mangatu stations (and would, in any event, have been reflected in the weighting given to the data in the LOWESS curve-fitting process). The long-term represen- tativeness of the Te Arai rating, in terms of there being no bias in the number of gaugings made shortly after landslip events, is less certain since there are fewer gaugings and their spacing in time is more irregular.
1134 HICKS ET AL.' EROSION THRESHOLDS AND SUSPENDED SEDIMENT YIELDS
(a) 90 ExPected 'fo'r N0rmai d'is{ribuii0n 80
70
60
50
40
30
20
10
0 -4.0 -2.6 -1.2 0.2 1,6
-3.3 -1.9 -0.5 0,9 2.3
Residual category (upper limits)
3.0
(b)
• 1.2
• 1
ß .- o• 0.8
0:306 •,_ ,
a3 o
(- 0.2
0 0.1
I I I I I Illl I I I I I IIII I I I I I IIII I I I I I IIII I ! I I I III
10 100 1000 10000
Discharge (m 3 s '1 ) Figure 4. Residuals from LOWESS-derived model of log C - log Q relationship for Waipaoa River. (a) Frequency distribution of residuals. (b) A running standard error of the residuals as a function of water discharge.
4. Sediment Yield and Its Distribution by Flow Suspended sediment yields averaged over the period cov-
ered by the flow record at each site were determined by com- bining the sediment ratings with flow duration tables that com- pressed the flow records into •140 flow bands. Using such a large number of flow bands induces negligible error in the sediment yield result. The flow-duration approach also pro-
ß vides the distribution of the sediment load by flow band, which allows us to identify the most effective and Q s0 flows (the center of the flow band transporting the greatest proportion of the total suspended sediment load and the flow at which 50% of the suspended sediment load is transported by smaller flows and 50% by larger flows, respectively). The 95% confidence- interval factorial error on the yield in each flow band was estimated as exp (2s/X/•-•), where s was taken as the overall standard error of the LOWESS fitted rating curve, N is the total number of gaugings, and F the stiffness factor.
The long-term average sediment yields and their error esti- mates are listed in Table 1. The mean specific yields of the Waipaoa, Mangatu, and Te Arai Rivers are 6750 t km -2 yr -•, 11,540 t km-2 yr -•, and 4600 t km-2 yr -•, respectively. For the Waipaoa and Mangatu Rivers, the error is of the order of x/+ 1.2 (equivalent to +_20%; note that we use factorial errors in this paper, because the standard errors of the sediment ratings are determined in log units). The uncertainty in the Te Arai yield is larger (x/+2.7) because there are fewer data points and greater scatter in the concentration-discharge re- lation (Figure 3). As well as reflecting sediment supply factors, the significantly higher yield from the Mangatu Basin is likely also influenced by the higher rainfall that this headwater basin receives (Table 1).
The distributions by flow of the long-term average sus- pended sediment yields of the three study rivers are given in Figure 6a. Statistics from these distributions are included in
HICKS ET AL.' EROSION THRESHOLDS AND SUSPENDED SEDIMENT YIELDS 1135
Table 1. In the Waipaoa River, the moderate flow range is the most important from the perspective of suspended sediment transport, with 50% of the load transported by flows <14.4 times the mean flow (34.7 m 3 s -1) and 83% by flows between the mean flow and the mean annual flood (1346 m 3 s-•). The most effective discharge (360 m 3 s -1) is 0.27 times the mean
o
o
100000
10000
1000
100
10
1
0.11 .................. 0.1 1 10
Waipaoa at Kanakanaia
ß •œo OoaC•
IP, o,'•ß o ,-• 0 •-•00
o < • •rs before Bol•
ß < • •rs •fter Bol•
100 1000 10000
Discharge (m3 s-1)
1 ooooo
,, 10000
E 1000 o
• 100
c 10 o
o 1
Mangatu at Omapere
o before Bola
ß < 3 yrs after Bola
0.1 1 10 100 1000
Discharge (m 3 s '1)
Te Arai at Pykes Weir
100000 I .:j 10000 ,
E 10001 ß ._0 100i o ß a o • o l o ß •" 10 oo o
• o o 0 o o o o before Bola
o 11 % ß ß <3yrsafterBola O
0.01 0,1 1 10 100 1000
Discharge (m 3 s -1)
Figure 5. Suspended sediment concentration-water dis- charge relationships in Waipaoa, Mangatu, and Te Arai Rivers for periods before and after Cyclone Bola (March 8-10, 1988). The Waipaoa at Kanakanaia plot derives from Trustrum et al. [1999].
lOO%
80%
60%
40%
20%
Qmaf • •Waipaoa /// •Manga!u /'//•
0%
o. 1 i 1 o 1 oo 1 ooo
Discharge / Mean discharge
lOO%
(1) •Waipaoa "o
(1) 10% [[ '• • Mangatu (3 .
X ! •TeAra, • 1% ._E "- 0.1% o
o 0.01% • 0.001% .........................
O. 1 I 10 1 O0 1000
Discharge / Mean discharge
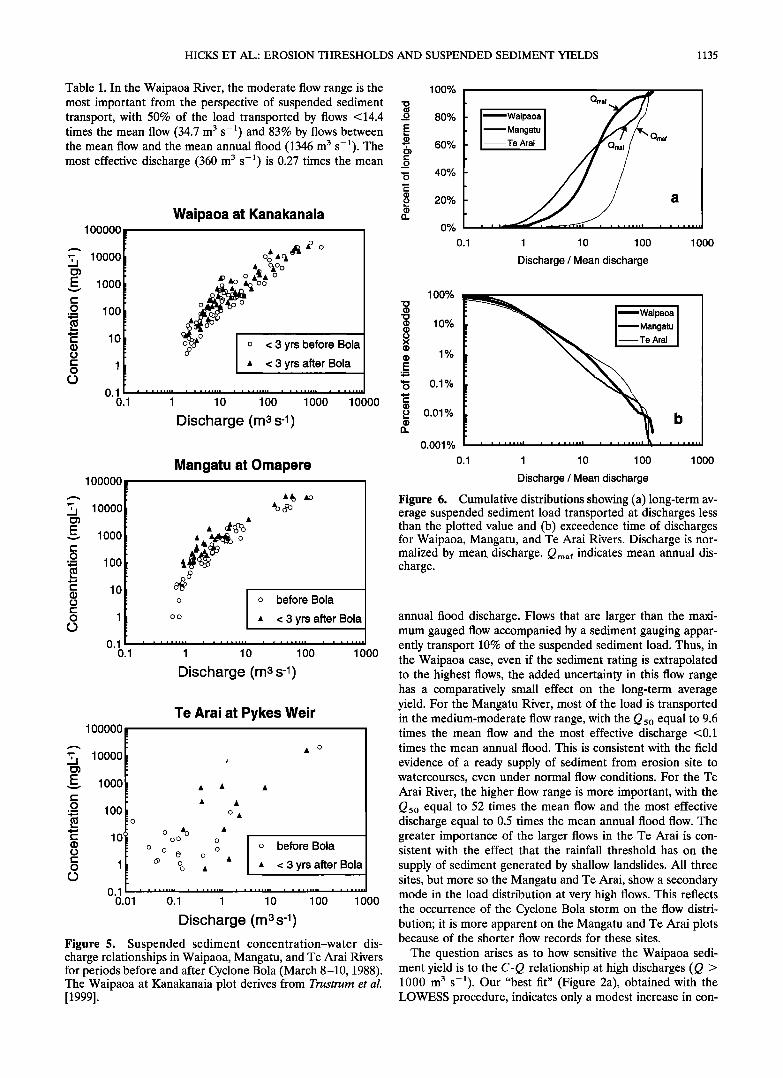
Figure 6. Cumulative distributions showing (a) long-term av- erage suspended sediment load transported at discharges less than the plotted value and (b) exceedence time of discharges for Waipaoa, Mangatu, and Te Arai Rivers. Discharge is nor- malized by mean discharge. Q maf indicates mean annual dis- charge.
annual flood discharge. Flows that are larger than the maxi- mum gauged flow accompanied by a sediment gauging appar- ently transport 10% of the suspended sediment load. Thus, in the Waipaoa case, even if the sediment rating is extrapolated to the highest flows, the added uncertainty in this flow range has a comparatively small effect on the long-term average yield. For the Mangatu River, most of the load is transported in the medium-moderate flow range, with the Qso equal to 9.6 times the mean flow and the most effective discharge <0.1 times the mean annual flood. This is consistent with the field
evidence of a ready supply of sediment from erosion site to watercourses, even under normal flow conditions. For the Te Arai River, the higher flow range is more important, with the Q so equal to 52 times the mean flow and the most effective discharge equal to 0.5 times the mean annual flood flow. The greater importance of the larger flows in the Te Arai is con- sistent with the effect that the rainfall threshold has on the
supply of sediment generated by shallow landslides. All three sites, but more so the Mangatu and Te Arai, show a secondary mode in the load distribution at very high flows. This reflects the occurrence of the Cyclone Bola storm on the flow distri- bution; it is more apparent on the Mangatu and Te Arai plots because of the shorter flow records for these sites.
The question arises as to how sensitive the Waipaoa sedi- ment yield is to the C-Q relationship at high discharges (Q > 1000 m 3 s-•). Our "best fit" (Figure 2a), obtained with the LOWESS procedure, indicates only a modest increase in con-
1136 HICKS ET AL.: EROSION THRESHOLDS AND SUSPENDED SEDIMENT YIELDS
Table 2. Sensitivity of Sediment Yield, Peak Concentration, and Flow Effectiveness Statistics to the Form of the C-Q Relationship for High Discharges, Waipaoa River at Kanakanaia
LOWESS Alternative Alternative Model Model 1 Model 2
Q50, m3 s-1 500 740 572 Sediment yield, t a -1 1,070,000 1,470,000 1,190,000 Concentration at Q = 31,500 145,000 58,000
5300 m 3 s -1, mg L -1 Ts0, year 1.1 3.6 1.7
The LOWESS, first alternative, and second alternative models are plotted in Figure 2a.
centration over this discharge range. To evaluate this we re- computed the yield using two alternative power law models for this range, as plotted in Figure 2a. The first alternative model continues the general trend of the data set in log-log space; the second lies part way between the first and our LOWESS model. The results (Table 2) show a maximum concentration of 145,000 mg L -1 (at the peak of the Cyclone Bola flood) for the first alternative model, which is grossly higher than any measured concentrations in New Zealand rivers. Thus we con-
sider this alternative highly unlikely. The second alternative model provides a more realistic peak concentration (58,000 mg L-•); with this model the Waipaoa yield would be 10% higher than indicated by the LOWESS model (which is within the bounds of our error estimate for the latter), and the Q s0 flow would increase by 14%. Thus, within reason, our C-Q model for the Waipaoa River does not overly affect our comparison of flow effectiveness among the study sites.
A further question concerns whether the different load dis- tributions (Figure 6a) reflect differences in flow regime, sedi- ment rating relationship, or both. Certainly, compared with the Mangatu, the Te Arai flow distribution is skewed toward higher flows (Figure 6b), notably in the flow range where most of the sediment load is transported. However, the rate of rise in concentration with discharge is also much higher in the Te Arai for this flow range (Figure 3). Thus both effects appear to be contributing, with the signature of erosion processes ap- pearing through the sediment rating relationship. The relative importance was assessed by combining the flow distribution of the Mangatu River (normalized by the mean flow) with the sediment rating of the Te Arai River (again, with flow normal- ized by the mean flow), which effectively models the hypothet- ical response of the Te Arai Basin if it experienced the same runoff distribution as the Mangatu. The Q s0 flow equated to 87 times the mean flow with this combination (compared with the value of 52 times the mean when the actual Te Arai runoff
distribution was used), suggesting that if the Te Arai had the same runoff distribution as the Mangatu, then its high flow range would be even more important at transporting sediment. Thus we conclude that the sediment ratings strongly influence the load distributions shown by the Mangatu and Te Arai Rivers.
In some rivers the most effective discharge has been equated with the bankfull discharge [e.g., Andrews, 1980], but in the Waipaoa River the bankfull discharge (-2550 m 3 S -1 at Ka- nakanaia Bridge) (D. H. Peacock, personal communication, 1998) is about 7 times greater than the most effective dis- charge. Nolan et al. [1987] suggested that this was a character-
istic of fluvial systems in which overbank deposition dominates over lateral channel migration as a mode of floodplain forma- tion. This is certainly the case in the Waipaoa River Basin [Gomez et al., 1999].
5. Magnitude-Frequency Characteristics of Event Sediment Loads
We used the sediment rating curves combined with the dis- charge time series records to compute yields during discrete runoff events in order to compile magnitude-frequency distri- butions of event yields. Events were defined by separate quick flows exceeding 0.5 mm of runoff. Appropriate quick flow separation slopes were determined by hydrograph inspection (0.03 mL s -2 km -2 for the Waipaoa and Mangatu rivers, and 0.015 mL s -2 km -2 for the Te Arai River). Event yields for the 13-year period (1984-1996) when the records for the three sites overlapped were ranked and assigned return periods (as- suming T = n/m, where T is the return period of an event, m is the event rank, and n is the number of years of record).
The distributions of event specific yields (i.e., event yield normalized by basin area) for the three stations were plotted as functions of return period (Figure 7a) and the Extreme Value reduced variate y T = - In (- In ( 1 - 1 / T' ), where T' = 12 T is the return period on a monthly basis (Figure 7b). A linear trend in the latter plots is indicative of an Extreme Value Type II distribution (i.e., the logarithms of event yields are linearly related to y T). The Cyclone Bola storm generated the largest event specific yields (16,430, 30,370, and 15,900 t km -2 in the case of the Waipaoa, Mangatu, and Te Arai rivers, respective- ly). With these Cyclone Bola points plotted at a return period of 13 years, they are clearly anomalous, lying above the trends of smaller events. In all likelihood, their true return periods may be closer to 100 years (a return period of 100 years for the peak discharge at Kanakanaia Bridge during Cyclone Bola was estimated from the historical flood record (B. G. Walpole, personal communication, 1998).
The magnitude-frequency distributions of event specific yields for the Mangatu and Waipaoa rivers are very similar (Figure 7). However, in keeping with the difference in their long-term average event yields, in the Mangatu River, event yields for all frequencies are consistently higher by a factor of -2. Both data sets exhibit only a slight departure from the linear trend of the Extreme Value Type II distribution at the subannual event scale, which suggests that even in the short term (for example, on a weekly or monthly basis) the supply of sediment is plentiful. By contrast, specific yields in the Te Arai River decline appreciably during events with return periods of <1 year (Figure 7a), suggesting that this may be a signature of the rainfall threshold effect on sediment supply. For events with large return periods, sediment specific yields from the Te Arai basin are a factor of 2-3 times less than those from the
Mangatu basin. Considering the uncertainty in the Te Arai yield estimates (95% confidence interval x/+2.7), this differ- ence is not statistically significant, although it may reflect fac- tors such as the lower annual rainfall experienced by the Te Arai (Table 1) and possibly also the spatial density of erosion features, which might in turn reflect factors such as slope, lithology, and landuse.
The ranked event yields were also used to determine the contribution that events with different return periods make to the long-term average sediment yield (Figure 8) and to define the parameter Ts0 (the return period at which half the sus-
HICKS ET AL.' EROSION THRESHOLDS AND SUSPENDED SEDIMENT YIELDS 1137
pended load was transported by smaller, more frequent events and the other half by larger, rarer events). Values of Tso for the Te Arai, Mangatu, and Waipaoa Rivers are 2, 1.2, and 1.1 years, respectively. In short, in the Te Arai River, a greater proportion of the long-term average event yield appears to be generated by extreme events. This is consistent with the notion that rainstorms of a minimum intensity and duration are re- quired to activate the shallow landslides that supply the bulk of the sediment to the Te Arai River.
As with our assessment of flow effectiveness on sediment
yield, we evaluated the sensitivity of the Tso statistic for the Waipaoa River to the C-Q relationship modeled for the high- discharge range. A substantial change in Tso is induced only by the extreme alternative model (Table 2), which we have al- ready considered unlikely.
Again, the question arises as to whether the load distribu- tions by event frequency (Figures 7a, 7b, and 8) faithfully reflect differences in the erosion processes that control sedi- ment supply or are confounded by differences in the flow regime. To check this, the magnitude-frequency distributions of flood peak flows for the study sites were plotted over the same 13 year period (Figure 7c). The peak flows were normal- ized by the factor A ø'81, where A is basin area, after the regional analysis of New Zealand floods by McKerchar and Pearson [1989] which showed that mean annual flood flow, Qmaf, varied spatially as Qmaf •'• A 0.81. Unlike the Mangatu and Waipaoa mainstem, there is a kink in the Te Arai flood peak distribution at Extreme Value Reduced Variate - 2 (Figure 7c), indicative of two populations of runoff events. This is consistent with rainfall patterns over the region: the Te Arai, lower and closer to the coast, receives less rain from weather systems sourced from the north and northeast compared with the headwater basins; however, larger easterly events tend to produce more uniform rainfall over the whole Waipaoa Basin.
Since the kink at the same return period on the Te Arai event yield distribution (Figure 7b) is evidently a consequence of this hydrological factor, the question becomes to what extent are hydrological differences affecting the event yield distribu- tions and the interpretations drawn there from regarding sed- iment supply effects? This can be answered by first comparing the relationships between event sediment yield and scaled event peak flow for the three sites (Figure 9). The Mangatu and Waipaoa have very similar relationships. In contrast, the Te Arai event yields are much lower for smaller events but increase more rapidly as peak flow increases. As with the sediment concentration-discharge relationships, this pattern is expected if erosion threshold effects are limiting sediment sup- plies to the Te Arai River. The steepness of these event yield "ratings" (Figure 9) is reflected in the steepness of the event yield distributions (Figures 7a and 7b). The relative impor- tance to the event yield frequency distributions of the differ- ences in event yield "ratings" compared with the hydrological differences was assessed by predicting event yields using the Mangatu flow record and the Te Arai sediment rating (nor- malized as previously). The results of this exercise (Figures 7b and 8) indicated that if the Te Arai had the same flood regime as the Mangatu (or the Waipaoa mainstem), then extreme events would be even more important at transporting Te Arai sediment than they actually are, with the Te Arai Tso rising from its actual value of 2 years to over 6 years. Thus, while there are indeed hydrological differences between the Te Arai Basin and the upper Waipaoa Basin (including the Mangatu Basin), the effect of these is to partly mask the importance of
100000
10000
>, 1000
• 100
.e_ lO
Kink ß Waipaoa [] Te Arai
o Mangatu
0.1
0.01 0.1 1 10
Return period (yr)
100
00000 ,
10000 [ b o 1000
/ Waipaoa 10
D Te Arai
1
0.1 -- !
-2 0 2 4
x Te Arai est. with
Mangatu flows , ! ,
EV Reduced variate
100000
1OOOO
1000
100
C
ß Waipaoa
o Mangatu [] Te Arai
10 I I I I I I I
-2 0 2 4 6
EV Reduced variate
Figure 7. Magnitude-frequency relationships for event sus- pended sediment yield and peak discharge in Waipaoa, Man- gatu, and Te Arai Rivers: (a) relates event yield to event return period, (b) scales return period in terms of extreme value reduced variate (definition in text), (c) relates event peak dis-
081 charge (normalized by (basin area)' ) to extreme value re- duced variate. The largest events at each site were associated with Cyclone Bola, March 1988. The distribution of hypothet- ical event sediment yields predicted from the Mangatu flow record and the Te Arai suspended sediment rating relationship (normalized by mean discharge) is included in Figure 7b.
erosion processes to stream sediment supply and of rare events to the long-term sediment yield.
A final consideration in our event-yield analysis is that we may have underestimated the sediment yields associated with Cyclone Bola because of the conspicuous effect nonstationarity has on discrete event-yield estimates for large magnitude
1138 HICKS ET AL.' EROSION THRESHOLDS AND SUSPENDED SEDIMENT YIELDS
100%
>' 80%
E
• 60%
o• 40% o
o
-• 20%
-•- waipaoa
c Mangatu
--D-- Te Arai
--, Te Arai est. from
Mangatu flows
O%
0.01 0.1 1 10 100
Return period (yr)
Figure 8. Proportion of long-term average suspended sediment yield transported during events with return period less than the plotted value, Waipaoa, Mangatu, and Te Arai Rivers, and hypothetical case where event yields are generated from the Mangatu flow record and the Te Arai suspended sediment rating relationship (normalized by mean discharge).
events. In the case of the Waipaoa River, the increase in concentration (at given discharge) after Bola (Figure 5) sug- gests that the yield during Bola (and for events during the next 1-2 years) may have been underestimated by a factor of 1.2 (by comparing the post Bola rating with the overall rating relation- ship). Similarly, the yield during Bola from the Mangatu River may have been underestimated by a factor of ---1.5. For the Te Arai the underestimate may be larger still. The problem is confounded by uncertainties associated with the definition of the return period of these large events. Nonetheless, the above numbers suggest little impact on the general conclusions re-
garding the relationship between event frequency and sedi- ment load.
6. Local and Regional Comparison of Sediment Yields
Estimates of the suspended sediment yield of the Waipaoa River at Kanakanaia have been previously derived [e.g., Jones and Howie, 1970; Adams, 1979; Griffiths, 1982]. These esti- mates were based on different sediment gaugings and flow records of different length and used different approaches to fit
100000
• 10000 E
-o 1000
•- 100
E
e 10
LU 1
Waipaoa trend
o
o
trend
.# Te Arai
trend
ß Waipaoa
o Mangatu
ri Te Arai
o.1 ' ! ! ! i i.l ! i a ! , i lal i i i i i i ii ß
100 1000 10000 100000
Event peak flow / Areaø'81 Figure 9. Relationships between event suspended sediment yield and event peak discharge (normalized by (basin area) ø'8•) for Wapaoa, Mangatu, and Te Arai Rivers. Trend lines were fitted by least squares regression of log data.
,
HICKS ET AL.: EROSION THRESHOLDS AND SUSPENDED SEDIMENT YIELDS 1139
Table 3. Suspended Sediment Yield Estimates and Sediment Rating Models for Waipaoa at Kanakanaia Compared
Study Site
C (mg L -1) Sediment Flow Number of versus Yield Over Concentration at
Record Sediment Q (m 3 S -1) Record Period, Bola Peak Flow, Period Gaugings Model t km -2 yr -1 mg L -1
Sediment Yield
1960-1996, t km -2 yr -1
Jones and Howie [1970] Bridge* 1960-1965 125 C = 23.9Q TM 8,370 Adams [1979] Cableway? 1972-1977 955 C = 1.48Q l'? 14,100 Griffiths [1982] Cableway 1972-1980 1275 C = 13.2Q 1-22 5,840 This study Bridge 1960-1996 301 LOWESS 6,750
*Site number 19701.
?Site number 19716. $Number of sediment gaugings used in referenced study was estimated based on date of study.
178,000 7,770 3,160,000 60,000
459,000 15,100 31,000 6,750
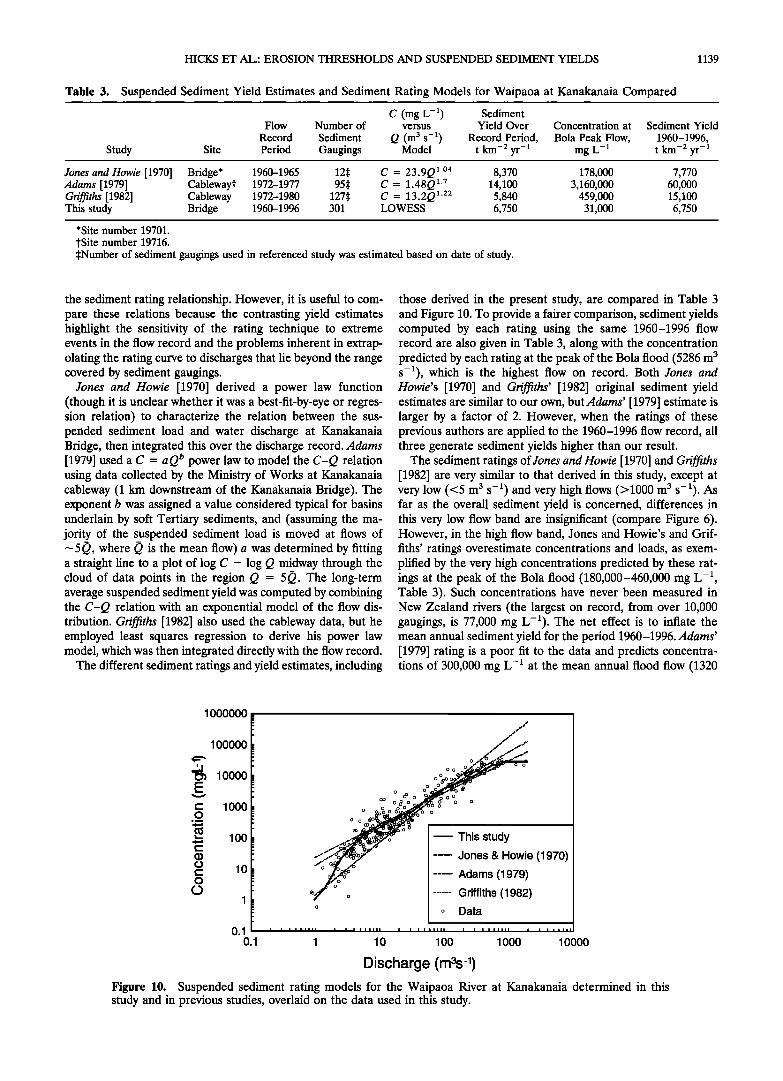
the sediment rating relationship. However, it is useful to com- pare these relations because the contrasting yield estimates highlight the sensitivity of the rating technique to extreme events in the flow record and the problems inherent in extrap- olating the rating curve to discharges that lie beyond the range covered by sediment gaugings.
Jones and Howie [1970] derived a power law function (though it is unclear whether it was a best-fit-by-eye or regres- sion relation) to characterize the relation between the sus- pended sediment load and water discharge at Kanakanaia Bridge, then integrated this over the discharge record. Adams [1979] used a C = a Q b power law to model the C-Q relation using data collected by the Ministry of Works at Kanakanaia cableway (1 km downstream of the Kanakanaia Bridge). The exponent b was assigned a value considered typical for basins underlain by soft Tertiary sediments, and (assuming the ma- jority of the suspended sediment load is moved at flows of --• 5Q, where Q is the mean flow) a was determined by fitting a straight line to a plot of log C - log Q midway through the cloud of data points in the region Q = 5•. The long-term average suspended sediment yield was computed by combining the C-Q relation with an exponential model of the flow dis- tribution. Griffiths [1982] also used the cableway data, but he employed least squares regression to derive his power law model, which was then integrated directly with the flow record.
The different sediment ratings and yield estimates, including
those derived in the present study, are compared in Table 3 and Figure 10. To provide a fairer comparison, sediment yields computed by each rating using the same 1960-1996 flow record are also given in Table 3, along with the concentration predicted by each rating at the peak of the Bola flood (5286 m 3 s-•), which is the highest flow on record. Both Jones and Howie's [1970] and Griffiths' [1982] original sediment yield estimates are similar to our own, but Adams' [1979] estimate is larger by a factor of 2. However, when the ratings of these previous authors are applied to the 1960-1996 flow record, all three generate sediment yields higher than our result.
The sediment ratings of Jones and Howie [1970] and Griffiths [1982] are very similar to that derived in this study, except at very low (<5 m 3 s -•) and very high flows (>1000 m 3 s-•). As far as the overall sediment yield is concerned, differences in this very low flow band are insignificant (compare Figure 6). However, in the high flow band, Jones and Howie's and Grif- fiths' ratings overestimate concentrations and loads, as exem- plified by the very high concentrations predicted by these rat- ings at the peak of the Bola flood (180,000-460,000 mg L -•, Table 3). Such concentrations have never been measured in New Zealand rivers (the largest on record, from over 10,000 gaugings, is 77,000 mg L-•). The net effect is to inflate the mean annual sediment yield for the period 1960-1996.Adams' [1979] rating is a poor fit to the data and predicts concentra- tions of 300,000 mg L -• at the mean annual flood flow (1320
1000000
100000
133 10000
• 1000 O
• 100
• 10 O
1
o /6 ....•"_-..'""•
.•;;•ff•g _.• .... This study ,.-•;..-;•;• Jones & Howie (1970)
•••••• ..... Adams (1979) ............ Griffiths (1982) o
o Data
o.1 , i i i i iiii i i i i i iiii i i i i i iiii i i i i i fill i i i i i iii 0.' 1 10 100 1000 10000
Discharge (m3s -1) Figure 10. Suspended sediment rating models for the Waipaoa River at Kanakanaia determined in this study and in previous studies, overlaid on the data used in this study.
1140 HICKS ET AL.: EROSION THRESHOLDS AND SUSPENDED SEDIMENT YIELDS
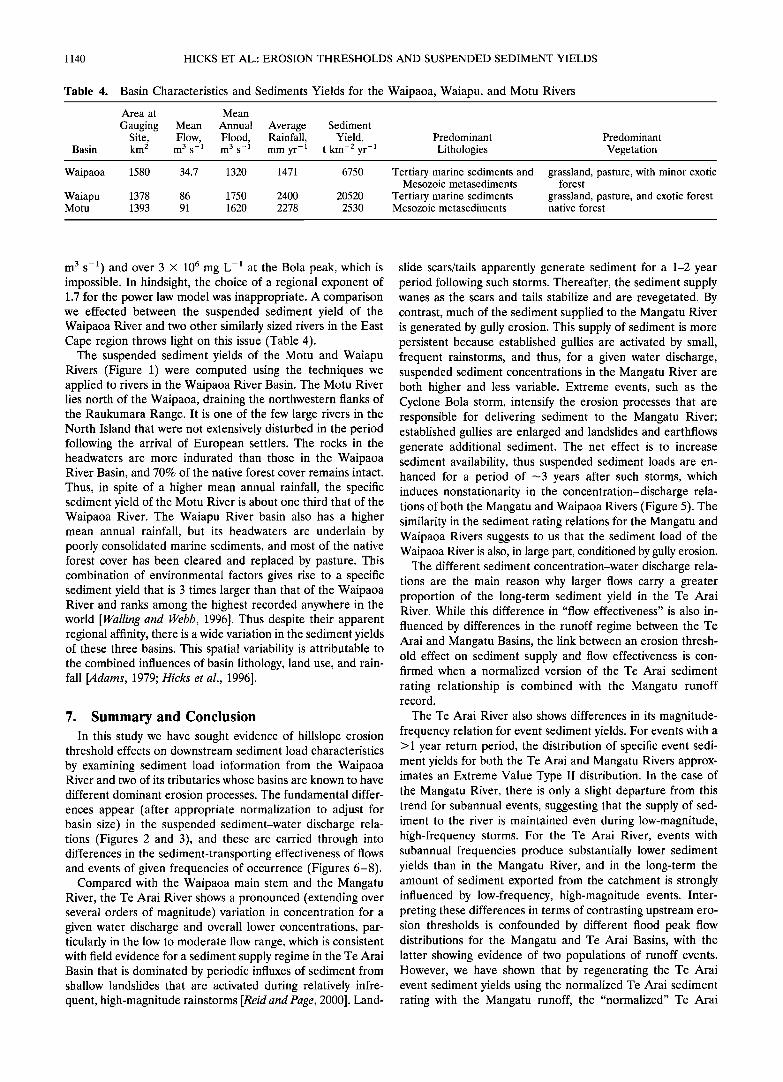
Table 4. Basin Characteristics and Sediments Yields for the Waipaoa, Waiapu, and Motu Rivers
Basin
Area at Mean
Gauging Mean Annual Average Sediment Site, Flow, Flood, Rainfall, Yield, Predominant km 2 m 3 s- • m 3 s- • mm yr- • t km-2 yr- • Lithologies
Tertiary marine sediments and Mesozoic metasediments
Tertiary marine sediments Mesozoic metasediments
grassland, pasture, with minor exotic forest
grassland, pasture, and exotic forest native forest
m 3 s -t) and over 3 x 10 6 mg L -• at the Bola peak, which is impossible. In hindsight, the choice of a regional exponent of 1.7 for the power law model was inappropriate. A comparison we effected between the suspended sediment yield of the Waipaoa River and two other similarly sized rivers in the East Cape region throws light on this issue (Table 4).
The suspended sediment yields of the Motu and Waiapu Rivers (Figure 1) were computed using the techniques we applied to rivers in the Waipaoa River Basin. The Motu River lies north of the Waipaoa, draining the northwestern flanks of the Raukumara Range. It is one of the few large rivers in the North Island that were not extensively disturbed in the period following the arrival of European settlers. The rocks in the headwaters are more indurated than those in the Waipaoa River Basin, and 70% of the native forest cover remains intact. Thus, in spite of a higher mean annual rainfall, the specific sediment yield of the Motu River is about one third that of the Waipaoa River. The Waiapu River basin also has a higher mean annual rainfall, but its headwaters are underlain by poorly consolidated marine sediments, and most of the native forest cover has been cleared and replaced by pasture. This combination of environmental factors gives rise to a specific sediment yield that is 3 times larger than that of the Waipaoa River and ranks among the highest recorded anywhere in the world [Walling and Webb, 1996]. Thus despite their apparent regional affinity, there is a wide variation in the sediment yields of these three basins. This spatial variability is attributable to the combined influences of basin lithology, land use, and rain- fall [Adams, 1979; Hicks et al., 1996].
7. Summary and Conclusion In this study we have sought evidence of hillslope erosion
threshold effects on downstream sediment load characteristics
by examining sediment load information from the Waipaoa River and two of its tributaries whose basins are known to have
different dominant erosion processes. The fundamental differ- ences appear (after appropriate normalization to adjust for basin size) in the suspended sediment-water discharge rela- tions (Figures 2 and 3), and these are carried through into differences in the sediment-transporting effectiveness of flows and events of given frequencies of occurrence (Figures 6-8).
Compared with the Waipaoa main stem and the Mangatu River, the Te Arai River shows a pronounced (extending over several orders of magnitude) variation in concentration for a given water discharge and overall lower concentrations, par- ticularly in the low to moderate flow range, which is consistent with field evidence for a sediment supply regime in the Te Arai Basin that is dominated by periodic influxes of sediment from shallow landslides that are activated during relatively infre- quent, high-magnitude rainstorms [Reid and Page, 2000]. Land-
slide scars/tails apparently generate sediment for a 1-2 year period following such storms. Thereafter, the sediment supply wanes as the scars and tails stabilize and are revegetated. By contrast, much of the sediment supplied to the Mangatu River is generated by gully erosion. This supply of sediment is more persistent because established gullies are activated by small, frequent rainstorms, and thus, for a given water discharge, suspended sediment concentrations in the Mangatu River are both higher and less variable. Extreme events, such as the Cyclone Bola storm, intensify the erosion processes that are responsible for delivering sediment to the Mangatu River; established gullies are enlarged and landslides and earthflows generate additional sediment. The net effect is to increase sediment availability, thus suspended sediment loads are en- hanced for a period of -3 years after such storms, which induces nonstationarity in the concentration-discharge rela- tions of both the Mangatu and Waipaoa Rivers (Figure 5). The similarity in the sediment rating relations for the Mangatu and Waipaoa Rivers suggests to us that the sediment load of the Waipaoa River is also, in large part, conditioned by gully erosion.
The different sediment concentration-water discharge rela- tions are the main reason why larger flows carry a greater proportion of the long-term sediment yield in the Te Arai River. While this difference in "flow effectiveness" is also in-
fluenced by differences in the runoff regime between the Te Arai and Mangatu Basins, the link between an erosion thresh- old effect on sediment supply and flow effectiveness is con- firmed when a normalized version of the Te Arai sediment
rating relationship is combined with the Mangatu runoff record.
The Te Arai River also shows differences in its magnitude- frequency relation for event sediment yields. For events with a > 1 year return period, the distribution of specific event sedi- ment yields for both the Te Arai and Mangatu Rivers approx- imates an Extreme Value Type II distribution. In the case of the Mangatu River, there is only a slight departure from this trend for subannual events, suggesting that the supply of sed- iment to the river is maintained even during low-magnitude, high-frequency storms. For the Te Arai River, events with subannual frequencies produce substantially lower sediment yields than in the Mangatu River, and in the long-term the amount of sediment exported from the catchment is strongly influenced by low-frequency, high-magnitude events. Inter- preting these differences in terms of contrasting upstream ero- sion thresholds is confounded by different flood peak flow distributions for the Mangatu and Te Arai Basins, with the latter showing evidence of two populations of runoff events. However, we have shown that by regenerating the Te Arai event sediment yields using the normalized Te Arai sediment rating with the Mangatu runoff, the "normalized" Te Arai
HICKS ET AL.: EROSION THRESHOLDS AND SUSPENDED SEDIMENT YIELDS 1141
yields are much lower than the Mangatu yields for equivalent small events, but the Te Arai yields increase more rapidly during larger events. This confirms the expectation that the erosion threshold effect should cause the rarer, extreme events
to transport the bulk of the sediment yield from the landslide- dominated Te Arai Basin.
Two previous estimates of the average annual suspended sediment load of the Waipaoa River are in reasonable agree- ment with our own [e.g., Jones and Howie, 1970; Griffiths, 1982]. We calculate that the specific suspended sediment yield of the Waipaoa River is one third that of the Waiapu River and 3 times that of the Motu River, which are neighboring rivers of similar size in the East Cape Region.
In conclusion, differences in the dominant erosion processes across the Waipaoa basin can be recognized in features of the suspended sediment load at sites downstream, particularly with appropriate normalization to reduce the effects of basin size and local differences in runoff regime. In particular, erosion thresholds observed to be associated with landsliding appear to lead to steeper relationships between sediment concentration and water discharge and to greater importance of higher flows and extreme events to the long-term sediment yield.
Acknowledgments. This paper is a contribution to Manaaki Whenua-Landcare Research's Waipaoa Catchment Study, funded by the New Zealand Foundation for Research, Science and Technology (contract C09306). We thank Gisborne District Council for supplying sediment gauging and flow data and Leslie Reid for reviewing the manuscript. Mike Church and Jack Schmidt made substantive contri- butions to the review process. BG was supported by NSF grant SBR- 9807195.
References
Adams, J., Sediment loads of North Island rivers, New Zealand-A reconnaissance, J. Hydrol. N. Z., 18, 36-48, 1979.
Allsop, F., The Story of Mangatu, 100 pp., Government Printer, Well- ington, N. Z., 1973.
Andrews, E. D., Effective and bankfull discharges of streams in the Yampa River Basin, Colorado and Wyoming, J. Hydrol., 46, 311- 330, 1980.
Ashmore, P. E., and T. J. Day, Effective discharge for suspended sediment transport in streams of the Saskatchewan River basin, Water Resour. Res., 24, 864-870, 1988.
Baker, V. R., Stream-channel response •o floods, with examples from central Texas, Geol. Soc. Am. Bull., 88, 1057-1071, 1977.
Beven, K., The effect of ordering on the geomorphic effectiveness of hydrologic events, IAHS Publ., 132, 510-526, 1981.
Bowie, A. J., and C. K. Mutchler, Sediment sources and yields from complex watersheds, in Proceedings of the Third International Sym- posium on River Sedimentation, edited by S. Y. Wang, H. W. Shen, and L. Z. Ding, pp. 1224-1232, School of Eng., Univ. of Miss., Jackson, 1986.
Campbell, I. A., Spatial and temporal variations in erosion and sedi- ment yield, IAHS Publ., 210, 455-465, 1992.
Cleveland, W. S., Robust locally weighted regression and smoothing scatterplots, J. Am. Stat. Assoc., 74, 829-836, 1979.
Cohn, T. A., L. L. DeLong, E. J. Gilroy, R. M. Hirsch, and D. K. Wells, Estimating constituent loads, Water Resour. Res., 25, 937-942, 1989.
DeRose, R. C., B. Gomez, M. Marden, and N. A. Trustrum, Gully erosion in Mangatu Forest, New Zealand, estimated from digital elevation models, Earth Surf. Processes Landforms, 23, 1045-1053, 1998.
Ferguson, R. I., Accuracy and precision of methods for estimating river loads, Earth Surf. Processes Landforms, 12, 95-104, 1987.
Gage, M., and R. D. Black, Slope-stability and geological investiga- tions at Mangatu State Forest, Tech. Pap. 66, 37 pp., N. Z. For. Serv., Wellington, 1979.
Gomez, B., L. A. K. Mertes, J. D. Phillips, F. J. Magilligan, and L. A.
James, Sediment characteristics of an extreme flood: 1993 upper Mississippi River valley, Geology, 23, 963-966, 1995.
Gomez, B., D. N. Eden, D. H. Peacock, and E. J. Pinkney, Floodplain construction by recent, rapid vertical accretion: Waipaoa River, New Zealand, Earth Surf. Processes Landforms, 23, 405-413, 1998.
Gomez, B., D. N. Eden, D. M. Hicks, N. A. Trustrum, D. H. Peacock, and J. Wilmshurst, Contribution of floodplain sequestration to the sediment budget of the Waipaoa River, New Zealand, in Flood- plains: Interdisciplinary Approaches, edited by J. Alexander and S. B. Marriott, Geol. Soc. Spec. Publ., 163, 69-88, 1999.
Griffiths, G. A., Spatial and temporal variability in suspended sediment yield of North Island basins, New Zealand, Water Resour. Bull., 18, 575-584, 1982.
Griffiths, G. A., and G. P. Glasby, Input of river-derived sediment to the New Zealand continental shelf, I, Mass, Estuarine, Coastal Shelf Sci., 21,773-787, 1985.
Hack, J. T., and J. C. Goodlett, Geomorphology and forest ecology of a mountain region in the central Appalachians, U.S. Geol. Surv. Prof. Pap. 347, 64 pp., 1960.
Hessell, J. W. D., The climate and weather of the Gisborne region, Misc. Publ. 115(8), 29 pp., New Zealand Meteorol. Serv., Welling- ton, 1980.
Hicks, D. M., Land-use effects on magnitude-frequency characteristics of storm sediment yields: Some New Zealand examples, IAHS Publ., 224, 395-402, 1994.
Hicks, D. M., J. Hill, and U. Shankar, Variation of suspended sediment yields around New Zealand: The relative importance of rainfall and geology, IAHS Publ., 236, 149-156, 1996.
Holeman, J. N., The sediment yield of major rivers of the world, Water Resour. Res., 4, 737-747, 1968.
Hovius, N., C. P. Stark, and P. A. Allen, Sediment flux from a moun- tain belt derived by landslide mapping, Geology, 25, 231-234, 1997.
Jones, I. E., and W. R. Howie, The measurement and control of erosion and sedimentation, Proceedings, New Zealand Water Confer- ence, Auckland, Part II, pp. 46.1-46.25, Lincoln College Press, Lin- coln, Oxford, U. K., 1970.
Jones, K. L., Horticulture and settlement chronology of the Waipaoa River catchment, East Coast, North Island, New Zealand, N. Z. J. Archaeology, 10, 19-51, 1988.
Mazengarb, C., D. A. Francis, and P. R. Moore, Sheet Y16 Tau- whareparae, Geological map of New Zealand, 1 sheet and 52 pp., scale 1:50,000, Dep. of Sci. and Ind. Res., Wellington, N. Z., 1991.
McKerchar, A. I., and C. P. Pearson, Flood frequency in New Zealand, publ. 20, Hydrol. Cent. Dep. of Sci. and Ind. Res., Christchurch, N. Z., 1989.
Meade, R. H., Sources, sinks and storage of river sediment in the Atlantic drainage of the United States, J. Geol., 90, 235-252, 1982.
Milliman, J. D., and R. H. Meade, World-wide delivery of river sedi- ment to the oceans, J. Geol., 91, 1-21, 1983.
Nolan, K. M., T. E. Lisle, and H. M. Kelsey, Bankfull discharge and sediment transport in northwestern California, IAHS Publ., 165, 439-449, 1987.
Novotny, V., Delivery of suspended sediment and pollutants from nonpoint sources during overland flow, Water Resour. Bull., 16, 1057-1065, 1980.
O'Byrne, T. N., A correlation of rock types with soils, topography and erosion in the Gisborne-East Cape region, N. Z. J. Geol. Geophys., 10, 217-231, 1967.
O'Loughlin, C. L., L. K. Rowe, and A. J. Pearce, Sediment yields from small forested catchments, North Westland-Nelson, New Zealand, J. Hydrol. N. Z., 17, 1-15, 1978.
Page, M. J., N. A. Trustrum, and J. R. Dymond, Sediment budget to assess the geomorphic effect of a cyclonic storm, New Zealand, Geomorphology, 9, 169-188, 1994.
Parker, R. S., and W. R. Osterkamp, Identifying trends in sediment discharge from alterations in upstream land use, IAHS Publ., 226, 207-213, 1995.
Pillans, B., Late Quaternary uplift map for North island, New Zealand, Bull. R. Soc. N. Z., 24, 409-417, 1986.
Pullar, W. A., Soils and agriculture of the Gisborne Plains, Bull. 20, 92 pp., New Zealand Soil Bureau, Wellington, 1962.
Reid, L. M., and T. Dunne, Rapid Evaluation of Sediment Budgets, 164 pp., Catena Verlag, Reischierken, Germany, 1996.
Reid, L. M., and M. J. Page, Magnitude and frequency of landsliding in a large New Zealand catchment, Geomorphology, in press, 2000.
Trustrum, N. A., B. Gomez, M. J. Page, L. M. Reid, and D. M. Hicks,
1142 HICKS ET AL.: EROSION THRESHOLDS AND SUSPENDED SEDIMENT YIELDS
Sediment production, storage and output: The relative role of large magnitude events in steepland catchments, Z. Geomorphol. Suœœ1., 155, 71-86, 1999.
VanSickle, J., and R. L. Beschta, Supply-based models of suspended sediment transport in streams, Water Resour. Res., 19, 768-778, 1983.
Walling, D. E., and B. W. Webb, Suspended load in gravel-bed rivers: UK experience, in Sediment Transport in Gravel-Bed Rivers, edited by C. R. Thorne, J. C. Bathurst, and R. D. Hey, pp. 691-723, John Wiley, New York, 1987.
Walling, D. E., and B. W. Webb, Erosion and sediment yield: A global overview, IAHS Publ., 236, 3-19, 1996.
Webb, B. W., and D. E. Walling, The magnitude and frequency char- acteristics of fluvial transport in a Devon drainage basin and some geomorphological implications, Catena, 9, 9-23, 1982.
Webb, B. W., and D. E. Walling, Magnitude and frequency character- istics of suspended sediment transport in Devon rivers, in Catchmerit
Experiments in Fluvial Geomorphology, edited by T. P. Burt and D. E. Walling, pp. 399-415, GeoBooks, Norwich, England, 1984.
Wolman, M. G., and J.P. Miller, Magnitude and frequency of forces in geomorphic processes, J. Geol., 68, 54-74, 1960.
B. Gomez, Department of Geography and Geology, Indiana State University, Terre Haute, IN 47809. (bgomez@in. dstate.edu)
D. M. Hicks, National Institute of Water and Atmospheric Re- search, P.O. Box 8602, Kyle Street, Riccarton, Christchurch, New Zealand. ([email protected])
N. A. Trustrum, Landcare Research Ltd., P.O. Box 11052, Palm- erston North, New Zealand. ([email protected])
(Received July 6, 1998; revised November 29, 1999; accepted November 29, 1999.)