ERRATA KLAMATH RIVER BASELINE WATER QUALITY SAMPLING – 2014 ANNUAL REPORT– Prepared for the KHSA Water Quality Monitoring Group Prepared by Watercourse Engineering, Inc. January 11, 2018 Grant Johnson
Transcript
ERRATA
KLAMATH RIVER BASELINE WATER QUALITY SAMPLING – 2014 ANNUAL REPORT–
Prepared for the KHSA Water Quality Monitoring Group
Prepared by Watercourse Engineering, Inc.
January 11, 2018
Grant Johnson
January 11, 2018
2014 KHSA Annual Report Errata
E-2
Errata In 2017 PacifiCorp completed a comprehensive quality control data review process for the data collected under Interim Measure 15. Several corrections were made to the 2014 dataset which required the following changes be made to the Klamath River Baseline Water Quality Sampling 2014 Annual Report. Tables and figures in this errata sheet replace tables and figures with the corresponding number (e.g., Errata Figure 4 replaces report Figure 4). Completely new tables and figures are given a new number that would place them in the correct location within the original report (e.g., Errata Figure 3‐a would follow report Figure 3). Any changes to the text are referenced to page and paragraph and indicated in strikeout (old text) and underline (new text). 1. Public health data collected in 2014 has been added to the data files associated with
this report, but was not added to, analyzed, or presented within the annual report itself. The entire Interim Measure 15 data set is available at: http://www.pacificorp.com/es/hydro/hl/kr.html.
January 11, 2018
2014 KHSA Annual Report Errata
E-3
2. Project sites were standardized (Errata Table 1‐a).
Errata Table 1-a. Original 2014 Site IDs and Names and the corresponding Standardized Site IDs and Names.
Old Site ID and Name Corresponding Standardized Site ID and Name
KR2544 Link Dam (RM ‐ 254.4) KR25444 Link Dam (RM 254.44; Baseline)
KR2460 Keno Reservoir at Miller Island (RM ‐ 246.0) KR24600 Keno Reservoir at Miller Island (RM 246.0; Baseline)
KR2330 KR below Keno Dam (RM ‐233.4) KR23340 Klamath River below Keno Dam near a USGS gage (RM 233.4; Baseline)
SHR00 Shasta River near mouth SH00000 Shasta River near mouth (Baseline)
SCR00 Scott River near mouth SC00000 Scott River near mouth (Baseline)
SAR00 Salmon River near mouth SA00000 Salmon River near mouth (Baseline)
TRR00 Trinity River near mouth TR00000 Trinity River near mouth (Baseline)
January 11, 2018
2014 KHSA Annual Report Errata
E-4
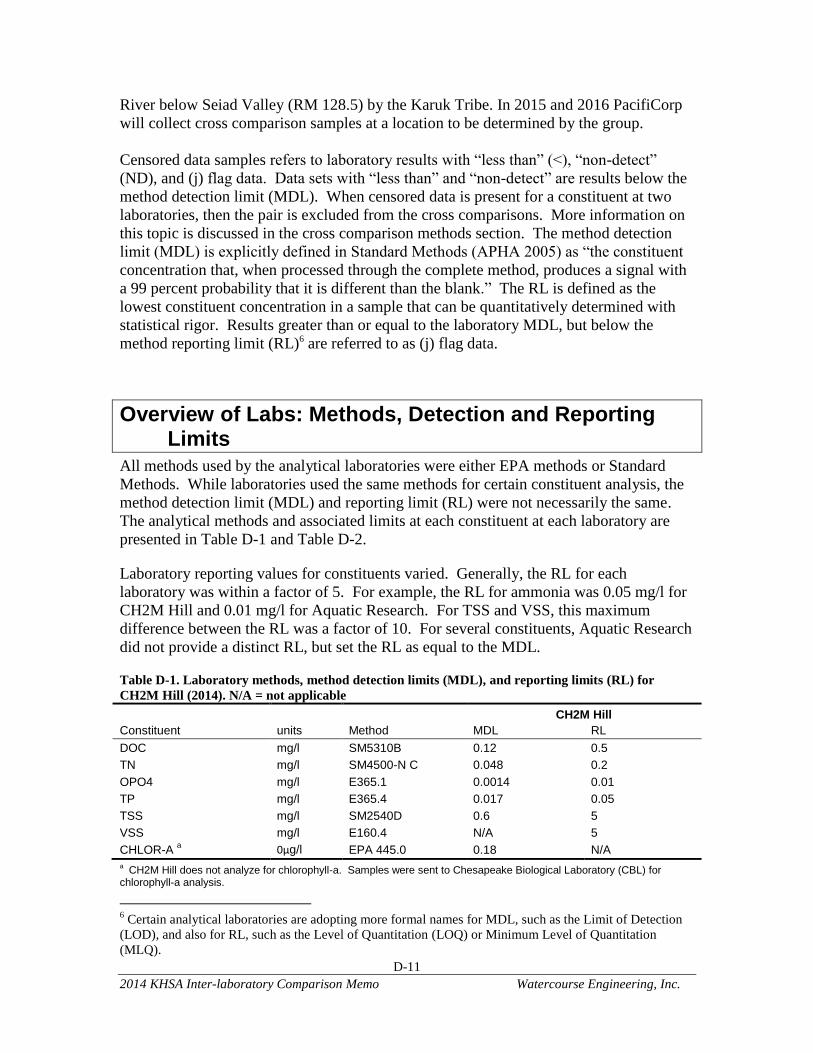
3. The original methods, MDLs and RLs listed in Table 2 did not present information for all constituents of interest in 2014, nor was the variability of the MDLs and RLs presented. The methods as well as the MDL and RL variation in 2014 are presented in Errata Table 2.
Errata Table 2. 2014 Laboratory methods, method detection limits (MDLs) and reporting limits (RLs). “na” indicates no limit available for a method.
CH2MHill Aquatic Research CBL EPA
Constituent Name ID Method MDL RL Method MDL RL Method MDL RL Method MDL RL
Alkalinity ALKT SM 2320B na 5.0 SM 2320B 1 ‐ ‐ ‐ ‐ ‐ ‐ ‐
Carbon, Dissolved Organic Carbon DOC SM 5310B 0.12 0.5 SM 5310B 0.25 ‐ ‐ ‐ ‐ ‐ ‐ ‐
Demand, Carbonaceous Biological Oxygen Demand
CBOD SM 5210B na 2.0 SM 5210B 2 ‐ ‐ ‐ ‐ ‐ ‐ ‐
Nitrogen, Ammonia NH3 EPA 350.1 0.014 0.02
0.05 0.05
SM 4500NH3H 0.01 ‐ ‐ ‐ ‐ ‐ ‐ ‐
Nitrogen, Nitrate+Nitrite NO3+ NO2
EPA353.2 0.0028 0.003 0.01
0.01 0.05 0.05
SM 4500NO3F 0.01 ‐ ‐ ‐ ‐ ‐ ‐ ‐
Nitrogen, Total Kjeldahl Nitrogen TKN EPA 351.2 0.051 0.069
0.02 0.2
na ‐ ‐ ‐ ‐ ‐ ‐ ‐ ‐
Nitrogen, Total Nitrogen TN SM 4500‐N C 0.062 0.048
0.2 0.2
SM 4500 NC 0.05 ‐ ‐ ‐ ‐ ‐ ‐ ‐
Phosphorus, Phosphate OPO4 EPA 365.1 0.0014 0.001
0.01 0.01
SM 4500PF 0.001 ‐ ‐ ‐ ‐ ‐ ‐ ‐
Phosphorus, Total Phosphorus TP EPA 365.4 0.022 0.017 0.024
0.05 0.5 0.5
SM 4500PF 0.002 ‐ ‐ ‐ ‐ ‐ ‐ ‐
Turbidity TURB SM 2130B na 0.1 SM 2130B 0.1 ‐ ‐ ‐ ‐ ‐ ‐ ‐
Solids, Total Suspended Solids TSS SM 2540D 0.6 5 SM 2540D 0.5 ‐ ‐ ‐ ‐ ‐ ‐ ‐
Solids, Volatile Suspended Solids VSS EPA 160.4 na 5 SM 2540E 0.5 ‐ ‐ ‐ ‐ ‐ ‐ ‐
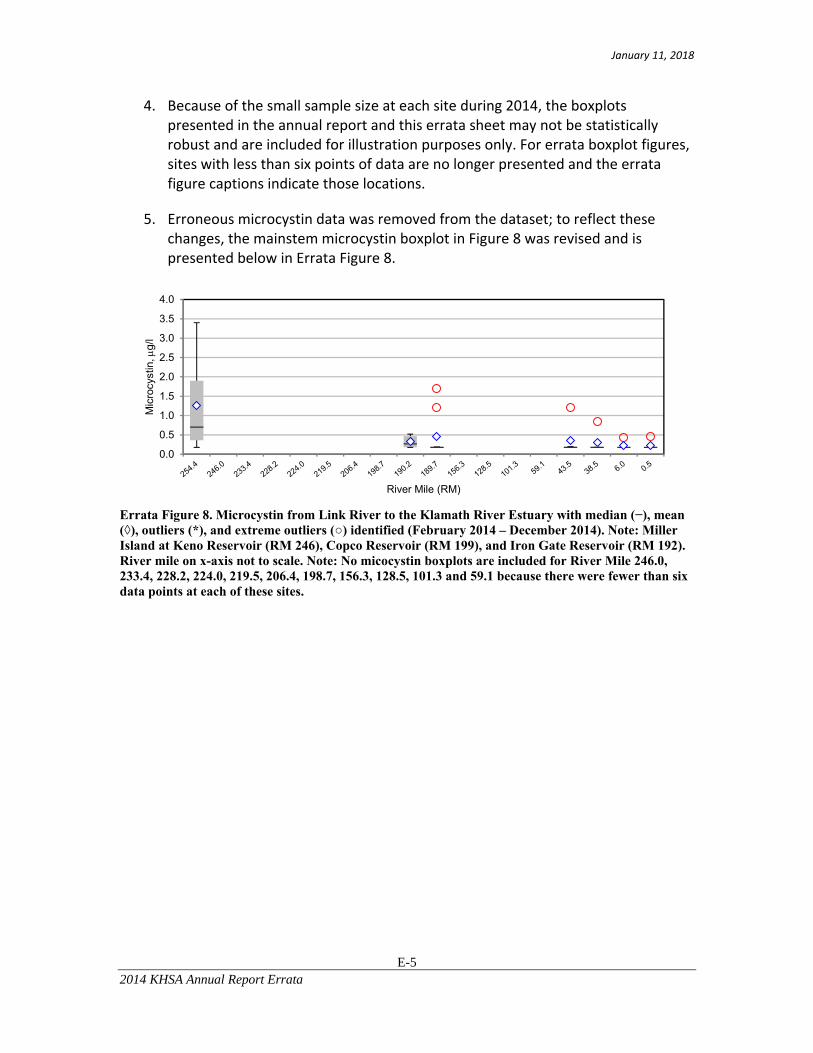
4. Because of the small sample size at each site during 2014, the boxplots presented in the annual report and this errata sheet may not be statistically robust and are included for illustration purposes only. For errata boxplot figures, sites with less than six points of data are no longer presented and the errata figure captions indicate those locations.
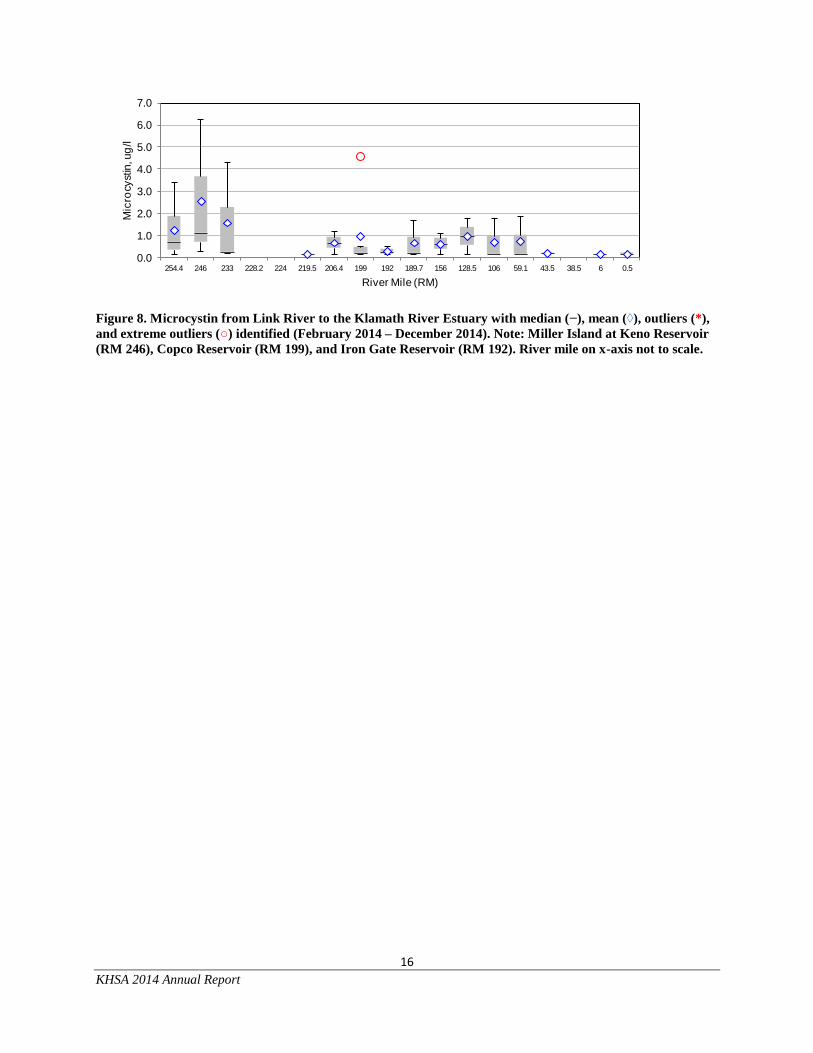
5. Erroneous microcystin data was removed from the dataset; to reflect these changes, the mainstem microcystin boxplot in Figure 8 was revised and is presented below in Errata Figure 8.
0.0
0.5
1.0
1.5
2.0
2.5
3.0
3.5
4.0
Mic
rocy
stin
, g/
l
River Mile (RM)
Errata Figure 8. Microcystin from Link River to the Klamath River Estuary with median (−), mean (◊), outliers (*), and extreme outliers (○) identified (February 2014 – December 2014). Note: Miller Island at Keno Reservoir (RM 246), Copco Reservoir (RM 199), and Iron Gate Reservoir (RM 192). River mile on x-axis not to scale. Note: No micocystin boxplots are included for River Mile 246.0, 233.4, 228.2, 224.0, 219.5, 206.4, 198.7, 156.3, 128.5, 101.3 and 59.1 because there were fewer than six data points at each of these sites.
January 11, 2018
2014 KHSA Annual Report Errata
E-6
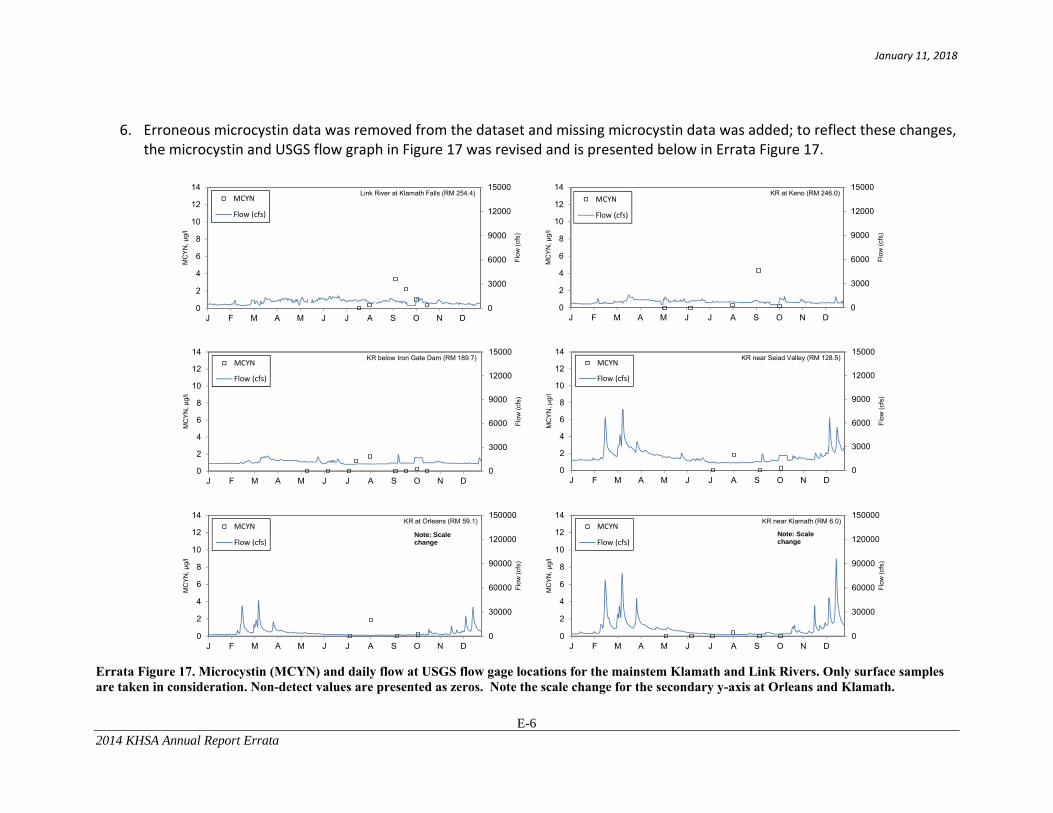
6. Erroneous microcystin data was removed from the dataset and missing microcystin data was added; to reflect these changes, the microcystin and USGS flow graph in Figure 17 was revised and is presented below in Errata Figure 17.
0
3000
6000
9000
12000
15000
0
2
4
6
8
10
12
14
J F M A M J J A S O N D
Flo
w (
cfs)
MC
YN
, μg/
lLink River at Klamath Falls (RM 254.4)
MCYN
Flow (cfs)
0
3000
6000
9000
12000
15000
0
2
4
6
8
10
12
14
J F M A M J J A S O N D
Flo
w (
cfs)
MC
YN
, μg/
l
KR at Keno (RM 246.0)MCYN
Flow (cfs)
0
3000
6000
9000
12000
15000
0
2
4
6
8
10
12
14
J F M A M J J A S O N D
Flo
w (
cfs)
MC
YN
, μg/
l
KR near Seiad Valley (RM 128.5)MCYN
Flow (cfs)
0
3000
6000
9000
12000
15000
0
2
4
6
8
10
12
14
J F M A M J J A S O N D
Flo
w (
cfs)
MC
YN
, μg/
l
KR below Iron Gate Dam (RM 189.7)MCYN
Flow (cfs)
0
30000
60000
90000
120000
150000
0
2
4
6
8
10
12
14
J F M A M J J A S O N D
Flo
w (
cfs)
MC
YN
, μg/
l
KR near Klamath (RM 6.0)MCYN
Flow (cfs)Note: Scale change
0
30000
60000
90000
120000
150000
0
2
4
6
8
10
12
14
J F M A M J J A S O N D
Flo
w (
cfs)
MC
YN
, μg/
l
KR at Orleans (RM 59.1)MCYN
Flow (cfs)Note: Scale change
Errata Figure 17. Microcystin (MCYN) and daily flow at USGS flow gage locations for the mainstem Klamath and Link Rivers. Only surface samples are taken in consideration. Non-detect values are presented as zeros. Note the scale change for the secondary y-axis at Orleans and Klamath.
January 11, 2018
2014 KHSA Annual Report Errata
E-7
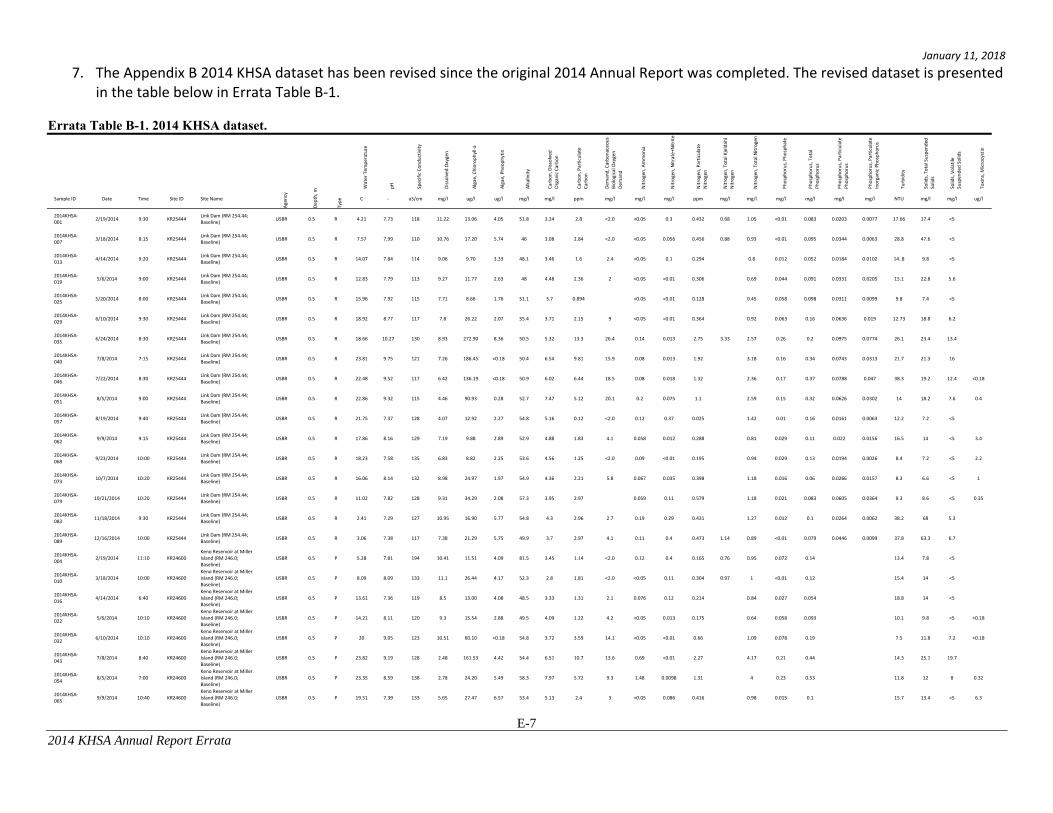
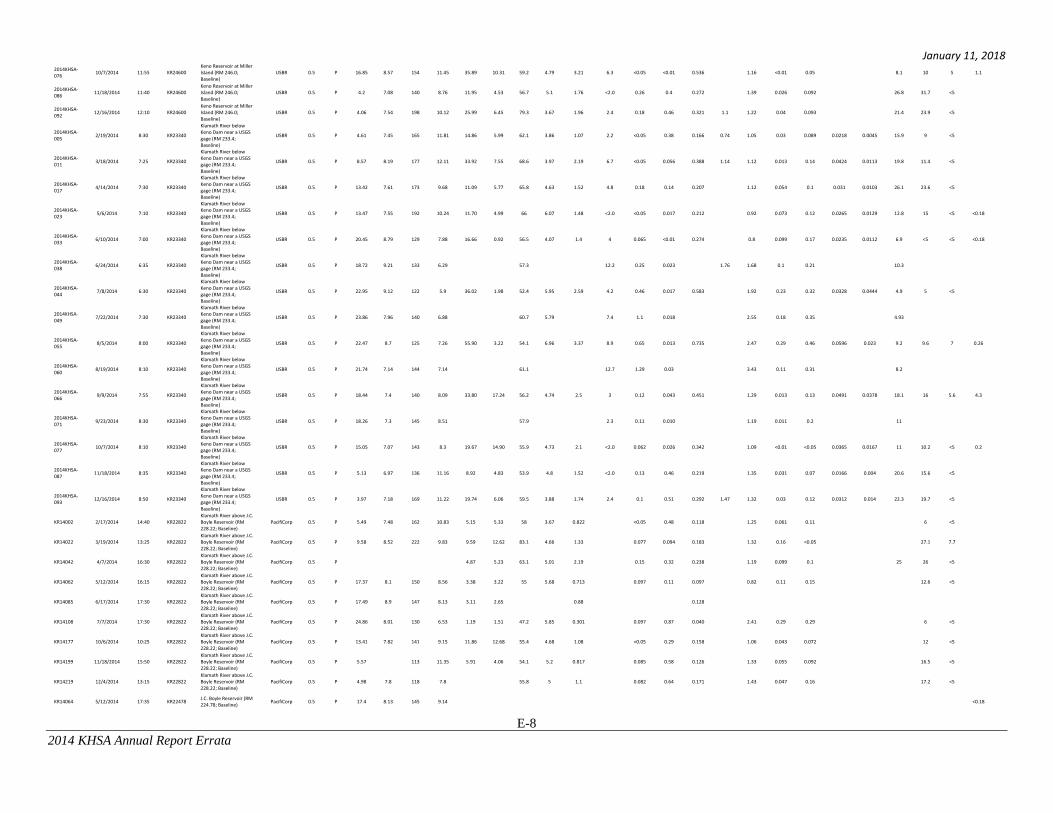
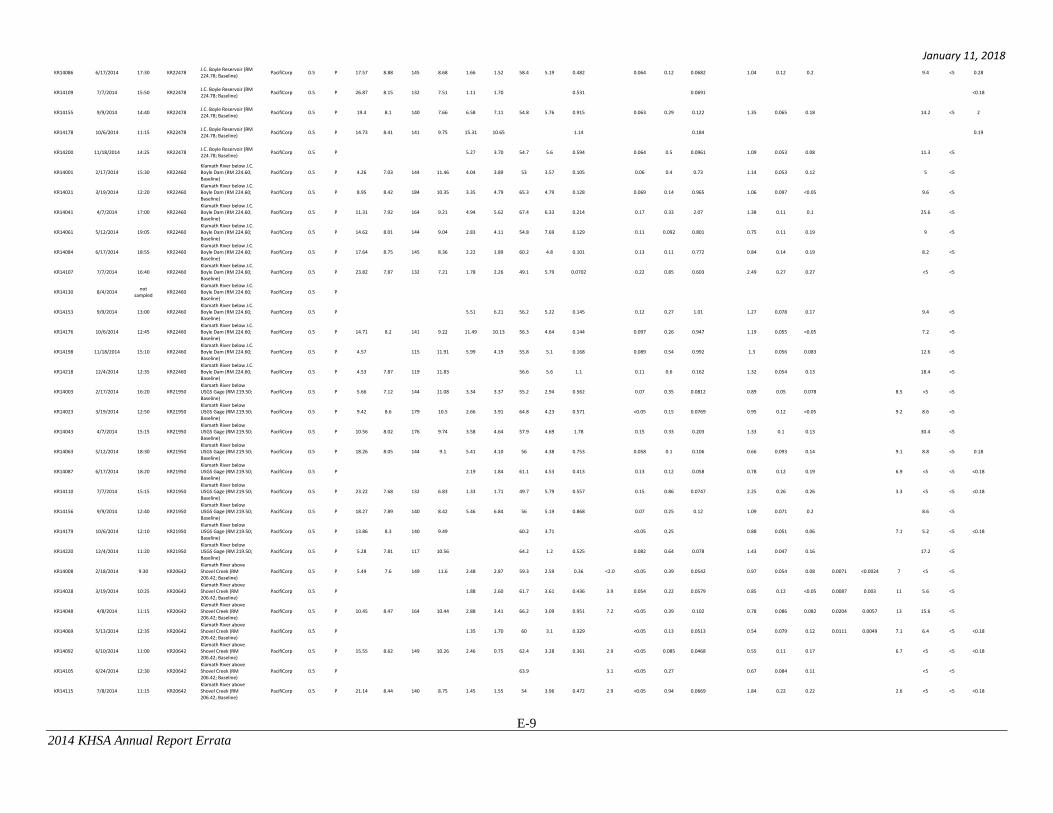
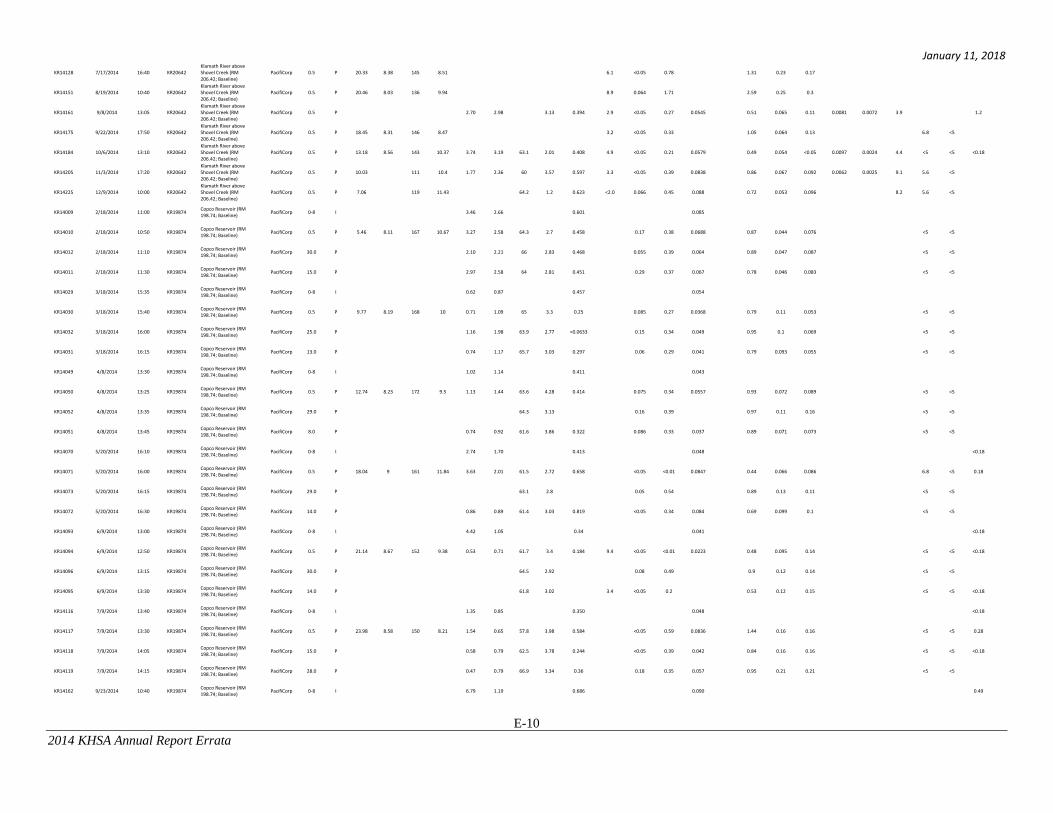
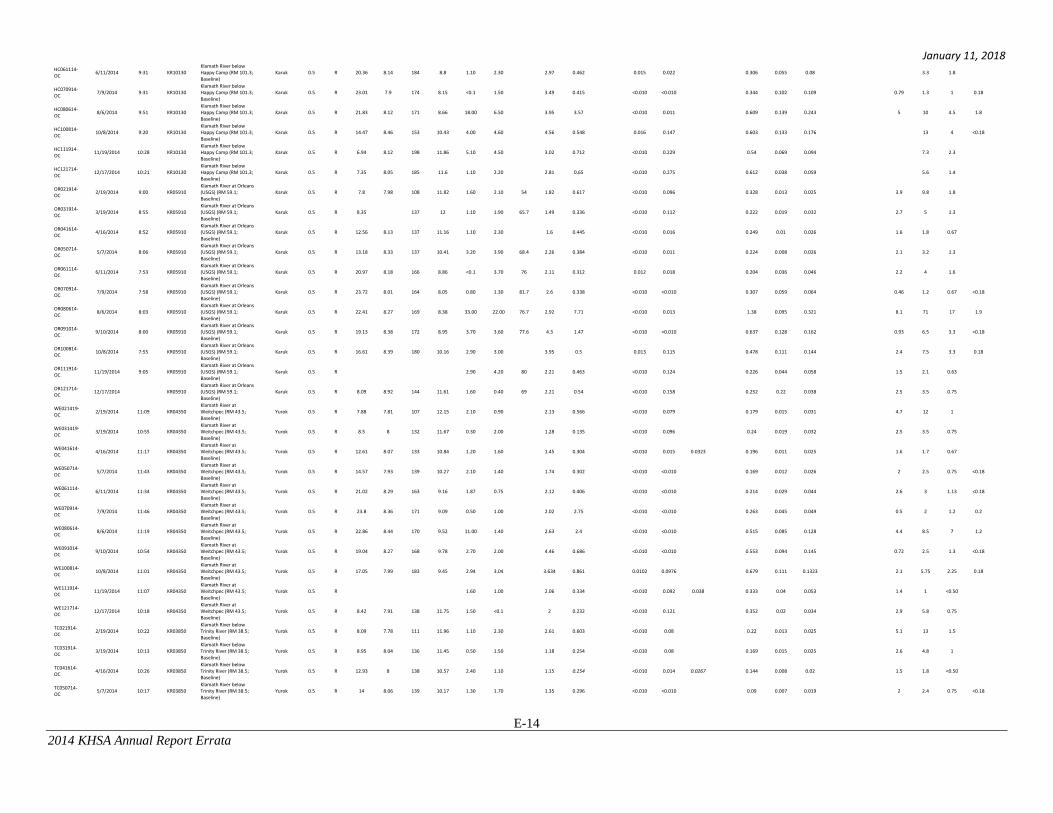
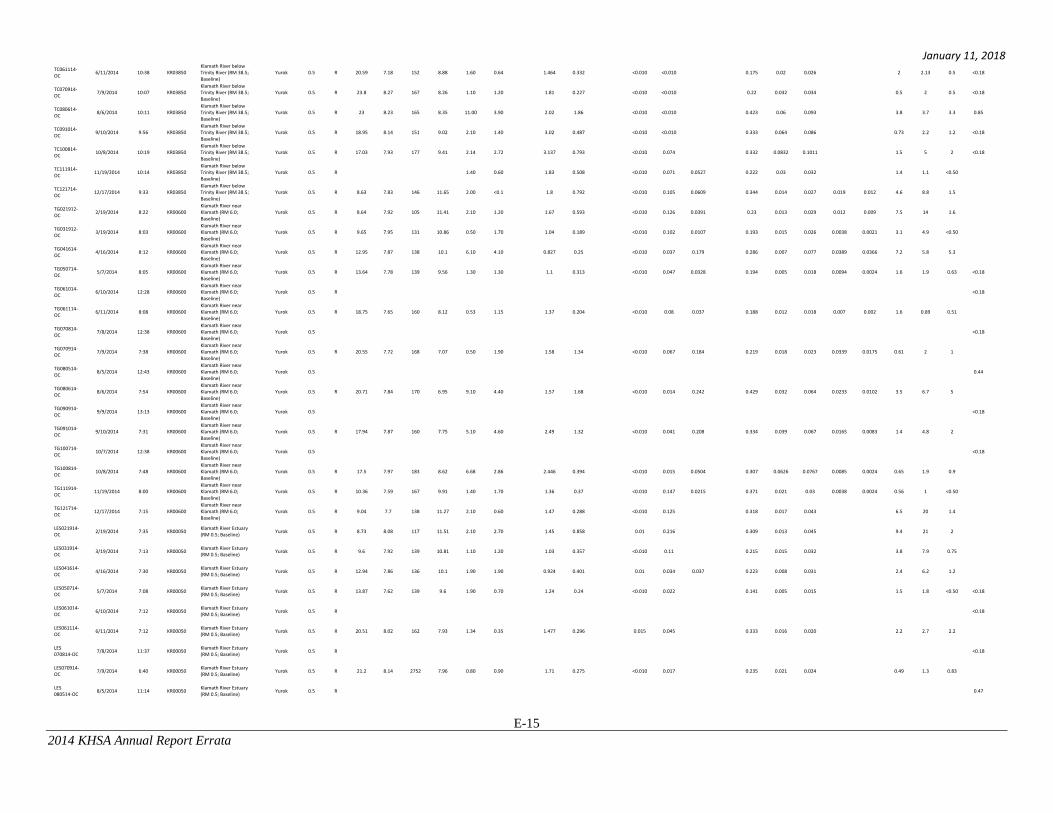
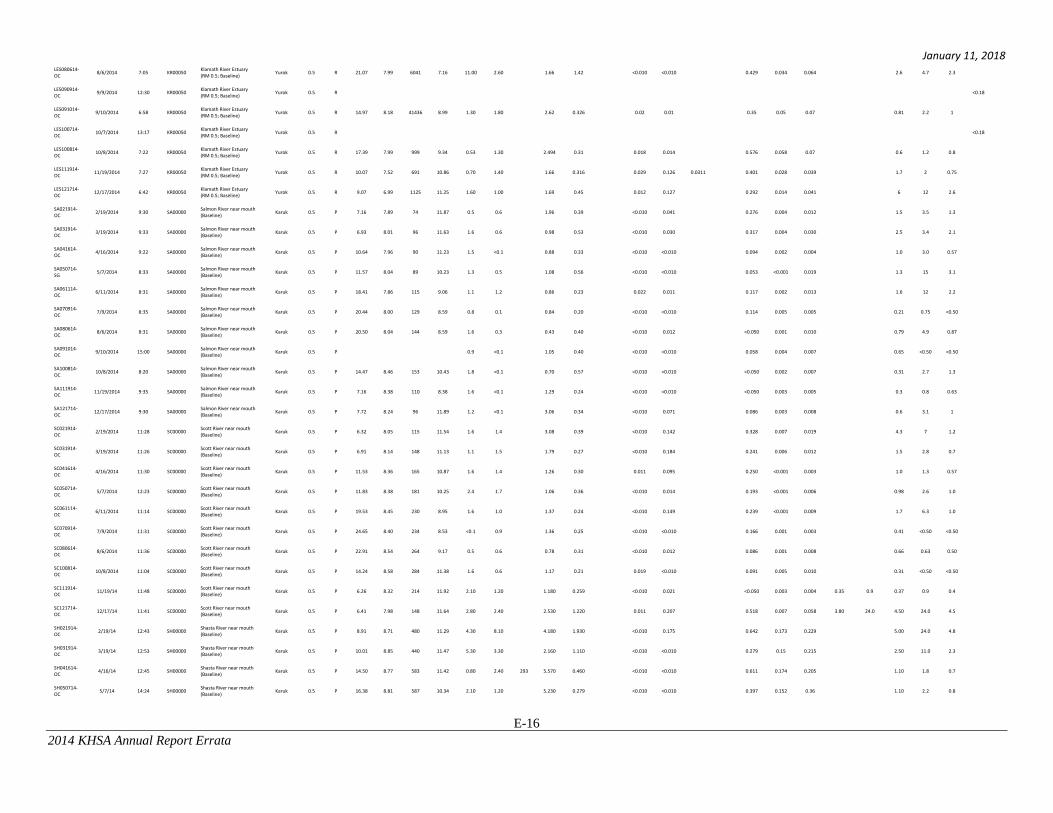
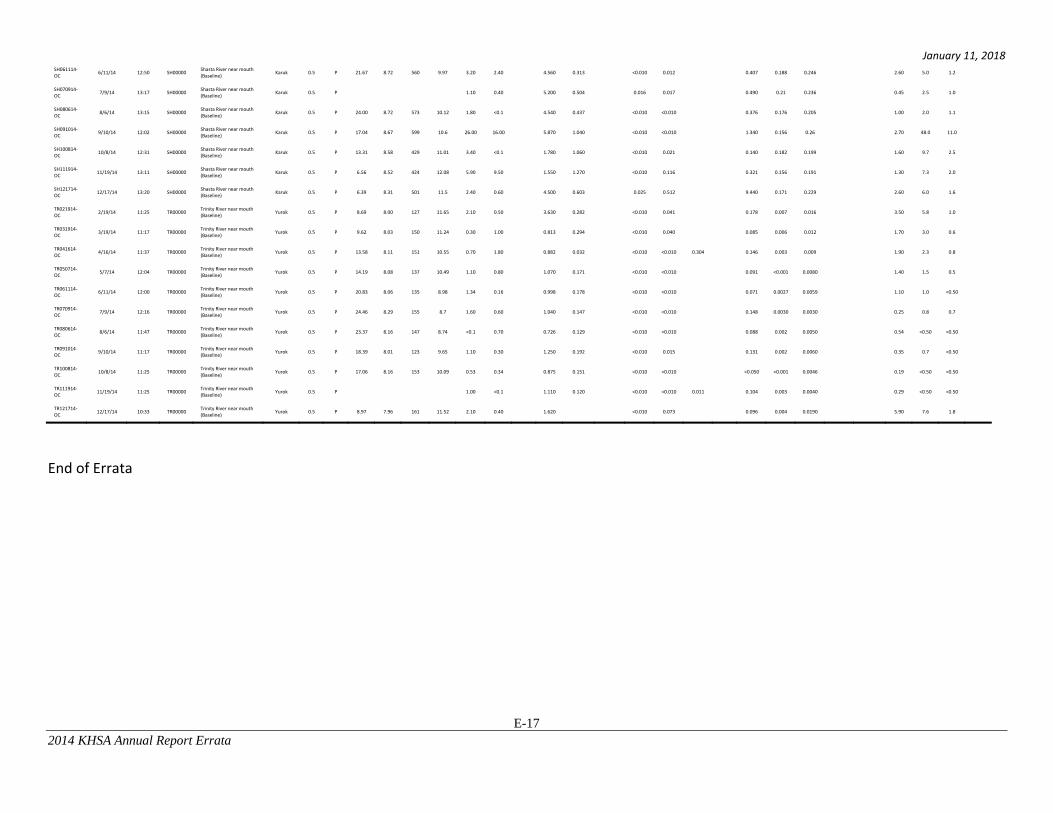
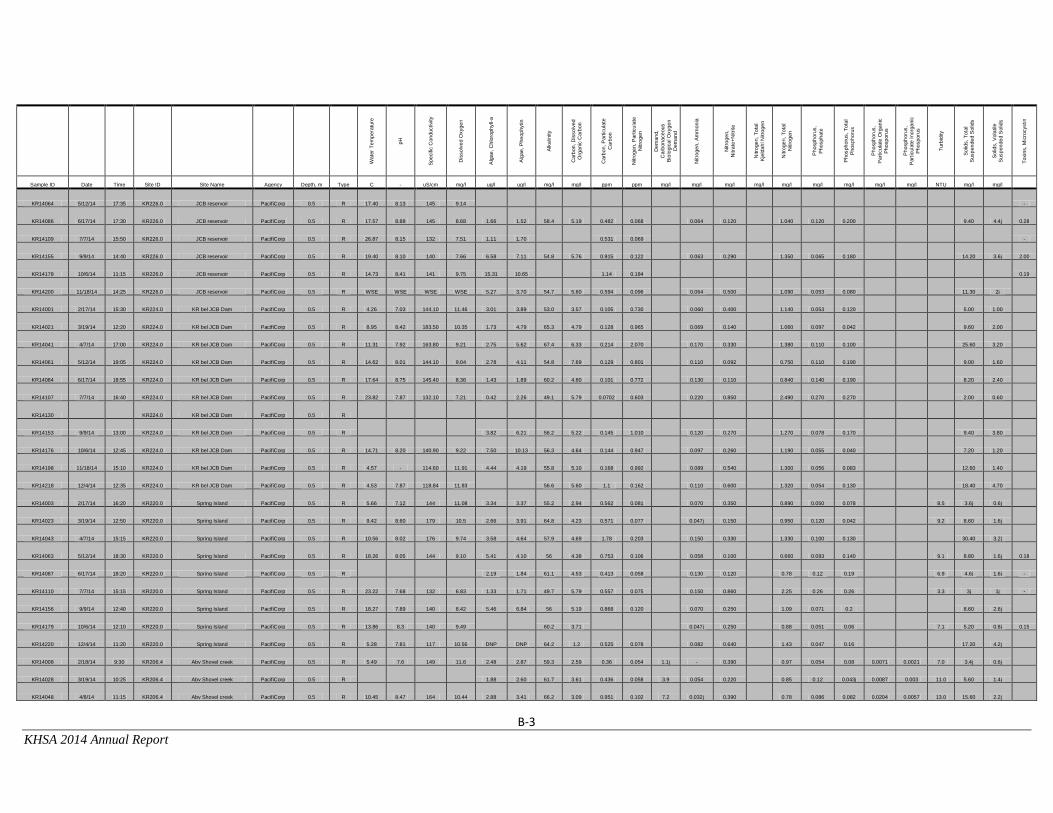
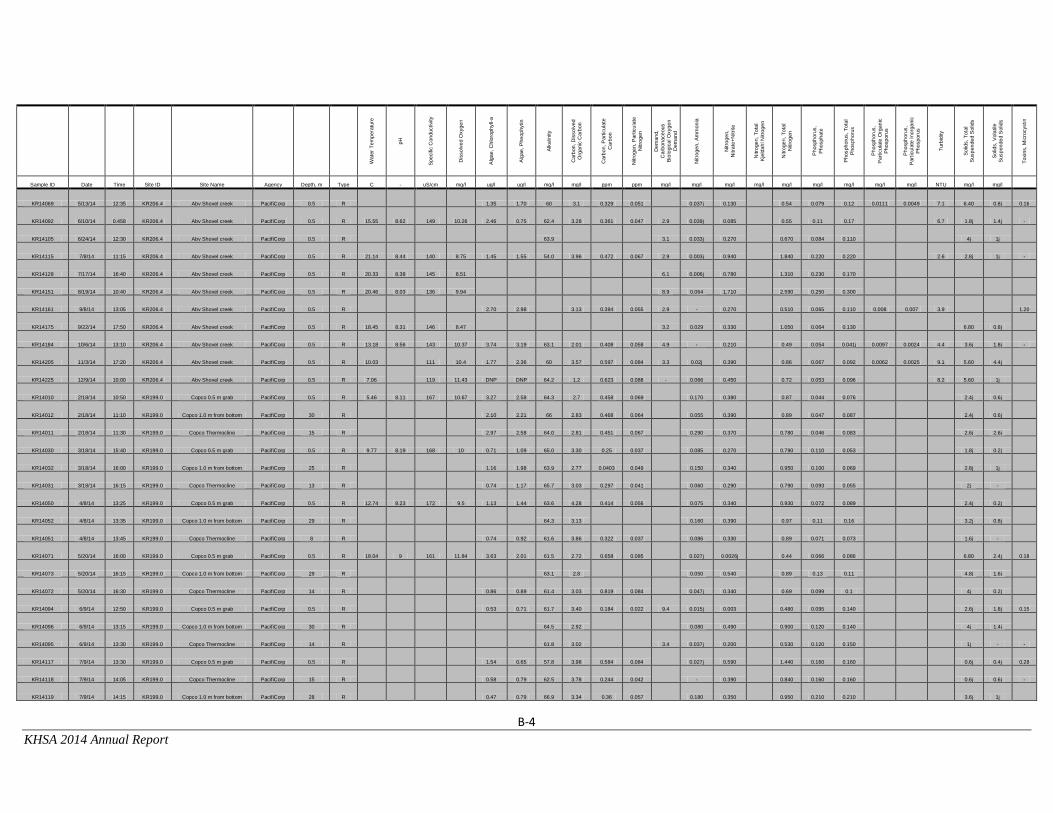
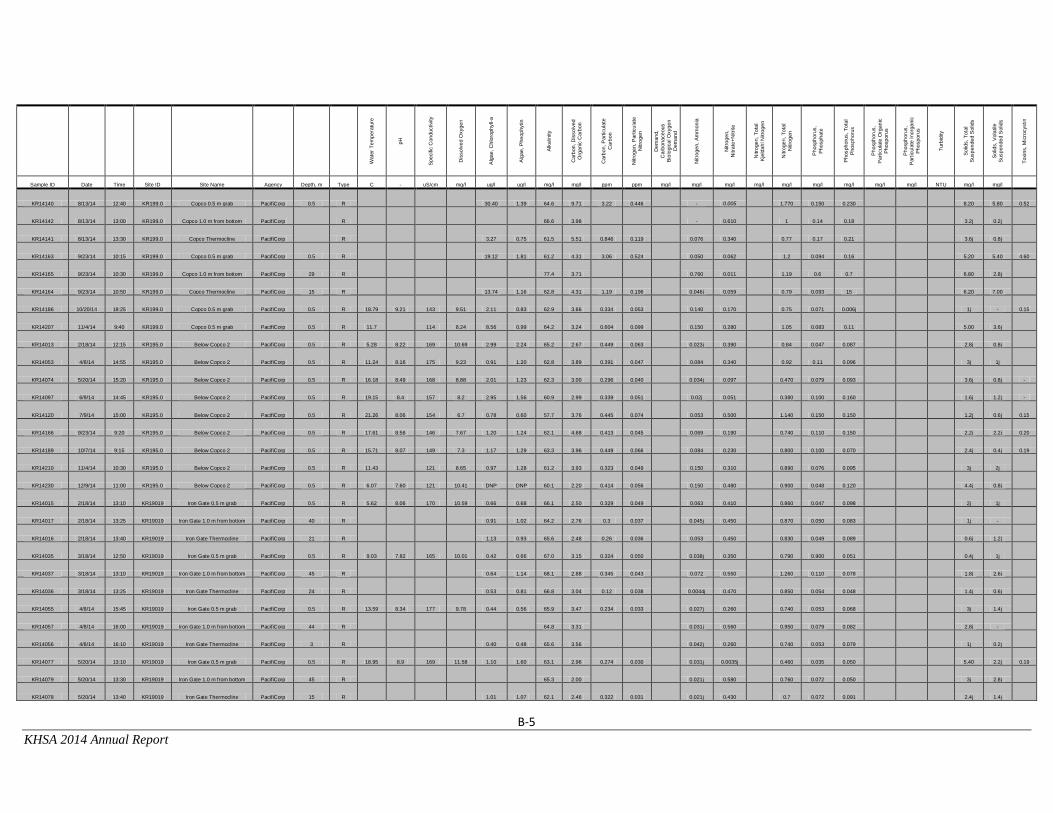
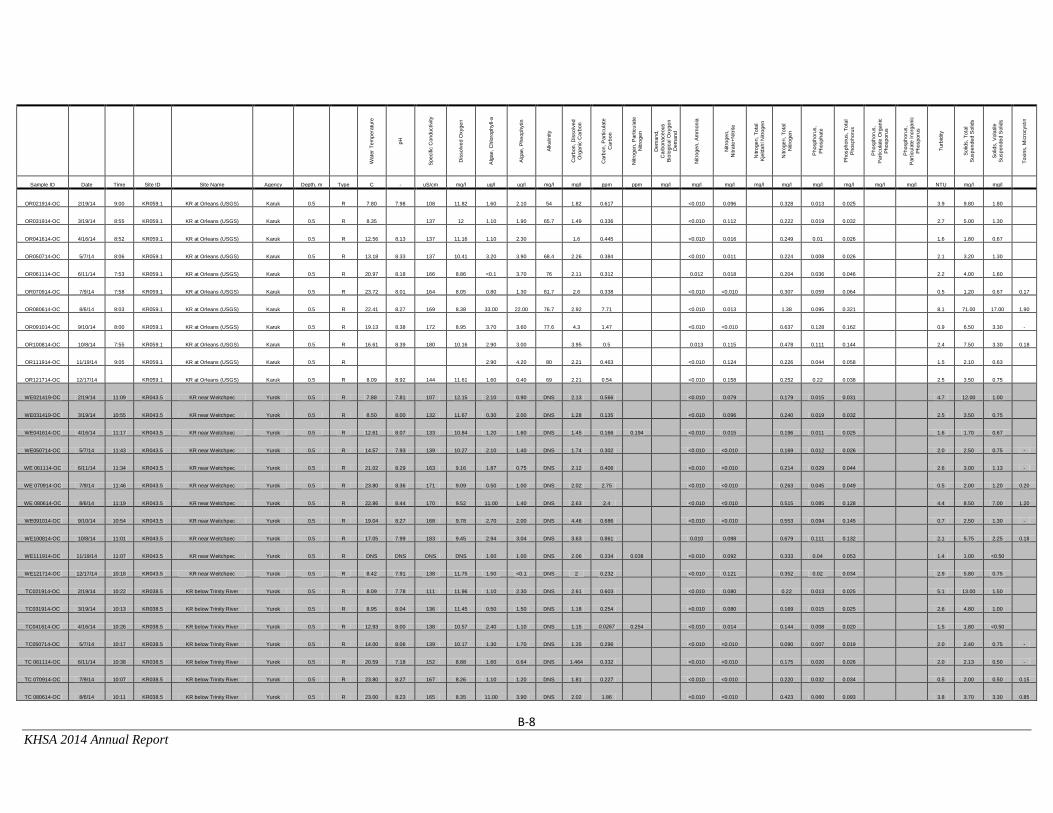
7. The Appendix B 2014 KHSA dataset has been revised since the original 2014 Annual Report was completed. The revised dataset is presented in the table below in Errata Table B‐1.
Errata Table B-1. 2014 KHSA dataset.
Agency
Dep
th, m
Type
Water Tem
perature
pH
Specific Conductivity
Dissolved
Oxygen
Algae, C
hlorophyll‐a
Algae, Pheo
phytin
Alkalinity
Carbon, D
issolved
Organic Carbon
Carbon, Particulate
Carbon
Dem
and, C
arbonaceo
us
Biological O
xygen
Dem
and
Nitrogen, A
mmonia
Nitrogen, N
itrate+N
itrite
Nitrogen, Particulate
Nitrogen
Nitrogen, Total Kjeldahl
Nitrogen
Nitrogen, Total N
itrogen
Phosphorus, Phosphate
Phosphorus, Total
Phosphorus
Phosphorus, Particulate
Phosphorus
Phosphorus, Particulate
Inorganic Phosphorus
Turbidity
Solids, Total Suspen
ded
Solids
Solids, Volatile
Suspen
ded
Solids
Toxins, M
icrocystin
Sample ID Date Time Site ID Site Name C ‐ uS/cm mg/l ug/l ug/l mg/l mg/l ppm mg/l mg/l mg/l ppm mg/l mg/l mg/l mg/l mg/l mg/l NTU mg/l mg/l ug/l
2014KHSA‐001
2/19/2014 9:30 KR25444 Link Dam (RM 254.44; Baseline)
5/7/14 14:24 SH00000 Shasta River near mouth (Baseline)
Karuk 0.5 P 16.38 8.81 587 10.34 2.10 1.20
5.230 0.279
<0.010 <0.010
0.397 0.152 0.36
1.10 2.2 0.8
January 11, 2018
2014 KHSA Annual Report Errata
E-17
SH061114‐OC
6/11/14 12:50 SH00000 Shasta River near mouth (Baseline)
Karuk 0.5 P 21.67 8.72 560 9.97 3.20 2.40
4.560 0.313
<0.010 0.012
0.407 0.188 0.246
2.60 5.0 1.2
SH070914‐OC
7/9/14 13:17 SH00000 Shasta River near mouth (Baseline)
Karuk 0.5 P
1.10 0.40
5.200 0.504
0.016 0.017
0.490 0.21 0.236
0.45 2.5 1.0
SH080614‐OC
8/6/14 13:15 SH00000 Shasta River near mouth (Baseline)
Karuk 0.5 P 24.00 8.72 573 10.12 1.80 <0.1
4.540 0.437
<0.010 <0.010
0.376 0.176 0.205
1.00 2.0 1.1
SH091014‐OC
9/10/14 12:02 SH00000 Shasta River near mouth (Baseline)
Karuk 0.5 P 17.04 8.67 599 10.6 26.00 16.00
5.870 1.040
<0.010 <0.010
1.340 0.156 0.26
2.70 48.0 11.0
SH100814‐OC
10/8/14 12:31 SH00000 Shasta River near mouth (Baseline)
Karuk 0.5 P 13.31 8.58 429 11.01 3.40 <0.1
1.780 1.060
<0.010 0.021
0.140 0.182 0.199
1.60 9.7 2.5
SH111914‐OC
11/19/14 13:11 SH00000 Shasta River near mouth (Baseline)
Karuk 0.5 P 6.56 8.52 424 12.08 5.90 9.50
1.550 1.270
<0.010 0.116
0.321 0.156 0.191
1.30 7.3 2.0
SH121714‐OC
12/17/14 13:20 SH00000 Shasta River near mouth (Baseline)
Karuk 0.5 P 6.39 8.31 501 11.5 2.40 0.60
4.500 0.603
0.025 0.512
9.440 0.171 0.229
2.60 6.0 1.6
TR021914‐OC
2/19/14 11:25 TR00000 Trinity River near mouth (Baseline)
Yurok 0.5 P 8.69 8.00 127 11.65 2.10 0.50
3.630 0.282
<0.010 0.041
0.178 0.007 0.016
3.50 5.8 1.0
TR031914‐OC
3/19/14 11:17 TR00000 Trinity River near mouth (Baseline)
Yurok 0.5 P 9.62 8.03 150 11.24 0.30 1.00
0.813 0.294
<0.010 0.040
0.085 0.006 0.012
1.70 3.0 0.6
TR041614‐OC
4/16/14 11:37 TR00000 Trinity River near mouth (Baseline)
Yurok 0.5 P 13.58 8.11 151 10.55 0.70 1.80
0.882 0.032
<0.010 <0.010 0.304
0.146 0.003 0.009
1.90 2.3 0.8
TR050714‐OC
5/7/14 12:04 TR00000 Trinity River near mouth (Baseline)
Yurok 0.5 P 14.19 8.08 137 10.49 1.10 0.80
1.070 0.171
<0.010 <0.010
0.091 <0.001 0.0080
1.40 1.5 0.5
TR061114‐OC
6/11/14 12:00 TR00000 Trinity River near mouth (Baseline)
Yurok 0.5 P 20.83 8.06 135 8.98 1.34 0.16
0.998 0.178
<0.010 <0.010
0.071 0.0027 0.0059
1.10 1.0 <0.50
TR070914‐OC
7/9/14 12:16 TR00000 Trinity River near mouth (Baseline)
Yurok 0.5 P 24.46 8.29 155 8.7 1.60 0.60
1.040 0.147
<0.010 <0.010
0.148 0.0030 0.0030
0.25 0.8 0.7
TR080614‐OC
8/6/14 11:47 TR00000 Trinity River near mouth (Baseline)
Yurok 0.5 P 23.37 8.16 147 8.74 <0.1 0.70
0.726 0.129
<0.010 <0.010
0.088 0.002 0.0050
0.54 <0.50 <0.50
TR091014‐OC
9/10/14 11:17 TR00000 Trinity River near mouth (Baseline)
Yurok 0.5 P 18.39 8.01 123 9.65 1.10 0.30
1.250 0.192
<0.010 0.015
0.131 0.002 0.0060
0.35 0.7 <0.50
TR100814‐OC
10/8/14 11:25 TR00000 Trinity River near mouth (Baseline)
Yurok 0.5 P 17.06 8.16 153 10.09 0.53 0.34
0.875 0.151
<0.010 <0.010
<0.050 <0.001 0.0046
0.19 <0.50 <0.50
TR111914‐OC
11/19/14 11:25 TR00000 Trinity River near mouth (Baseline)
Yurok 0.5 P
1.00 <0.1
1.110 0.120
<0.010 <0.010 0.011
0.104 0.003 0.0040
0.29 <0.50 <0.50
TR121714‐OC
12/17/14 10:33 TR00000 Trinity River near mouth (Baseline)
Yurok 0.5 P 8.97 7.96 161 11.52 2.10 0.40
1.620
<0.010 0.073
0.096 0.004 0.0190
5.90 7.6 1.8
End of Errata
KLAMATH RIVER BASELINE WATER QUALITY SAMPLING 2014 ANNUAL REPORT
Prepared for the
KHSA Water Quality Monitoring Group
Prepared by Watercourse Engineering, Inc.
April 28, 2015
Photo: Grant Johnson
ES-1
KHSA 2014 Annual Report
Table of Contents 1. Water Quality Sample Collection ......................................................................................................... 6
1.5.1. Algae Samples ...................................................................................................................... 8 2. Baseline Program Water Quality Data .................................................................................................10
2.1. Data Summary .............................................................................................................................10 2.1.1. Major Tributaries (Boxplot) ................................................................................................13 2.1.2. Mainstem Locations (Boxplot) ............................................................................................14 2.1.3. Major Tributaries (Time Series) ..........................................................................................17 2.1.4. Mainstem Locations (Time Series) .....................................................................................18
3. Summary ..............................................................................................................................................26 4. References ............................................................................................................................................27 Appendix A. Site Locations and Data Summary ................................................................................... A-1 Appendix B. Data Summary ...................................................................................................................B-1 Appendix C. Phytoplankton Charts ........................................................................................................C-1 Appendix D. 2014 Laboratory Cross Comparison ................................................................................. D-9 Introduction ................................................................................................................................................ D-9 Background .............................................................................................................................................. D-10 Overview of Labs: Methods, Detection and Reporting Limits ................................................................. D-11 Cross Comparison Method (RPD & AD) ................................................................................................. D-12 2014 Sampling .......................................................................................................................................... D-13
List of Figures Figure 1. 2014 KHSA Klamath River baseline monitoring sampling sites. ................................................... 3 Figure 2. Phytoplankton species percent biovolume for the eight locations in the Klamath River: September
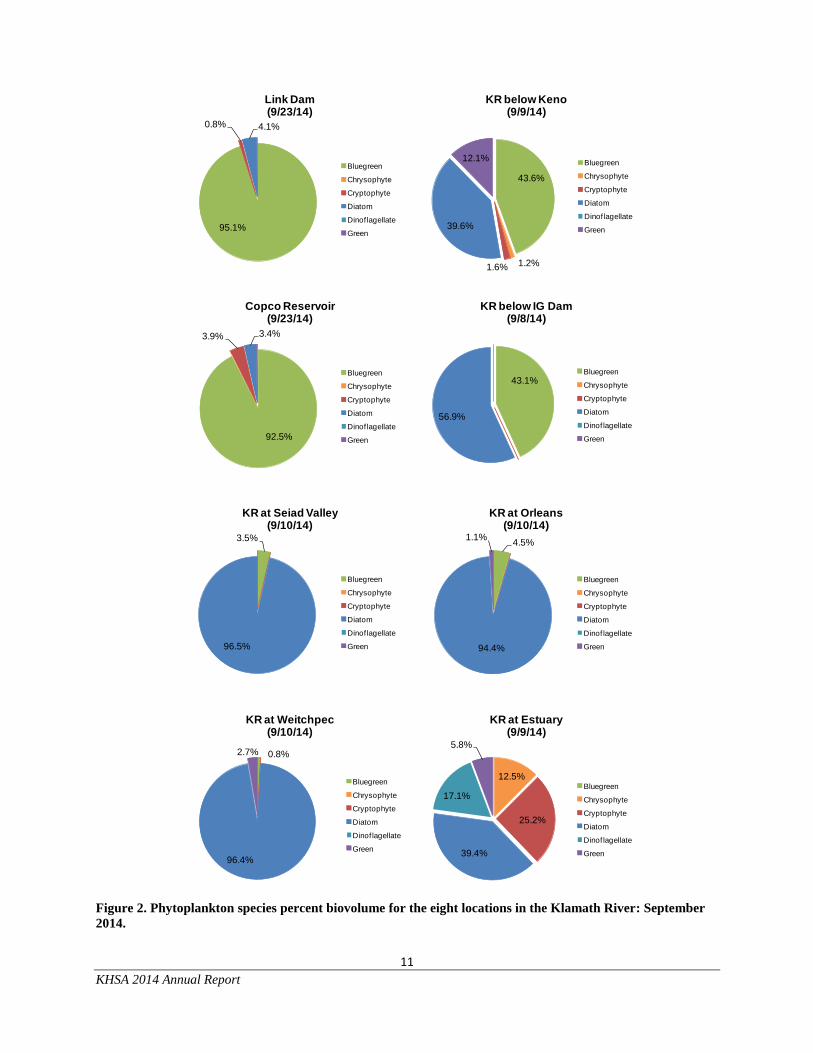
2014. ................................................................................................................................................11 Figure 3. Baseline data for dissolved oxygen, dissolved organic carbon, total nitrogen, and total phosphorus
for the Shasta, Scott, Salmon, and Trinity Rivers with median (−), mean (◊), outliers (*), and
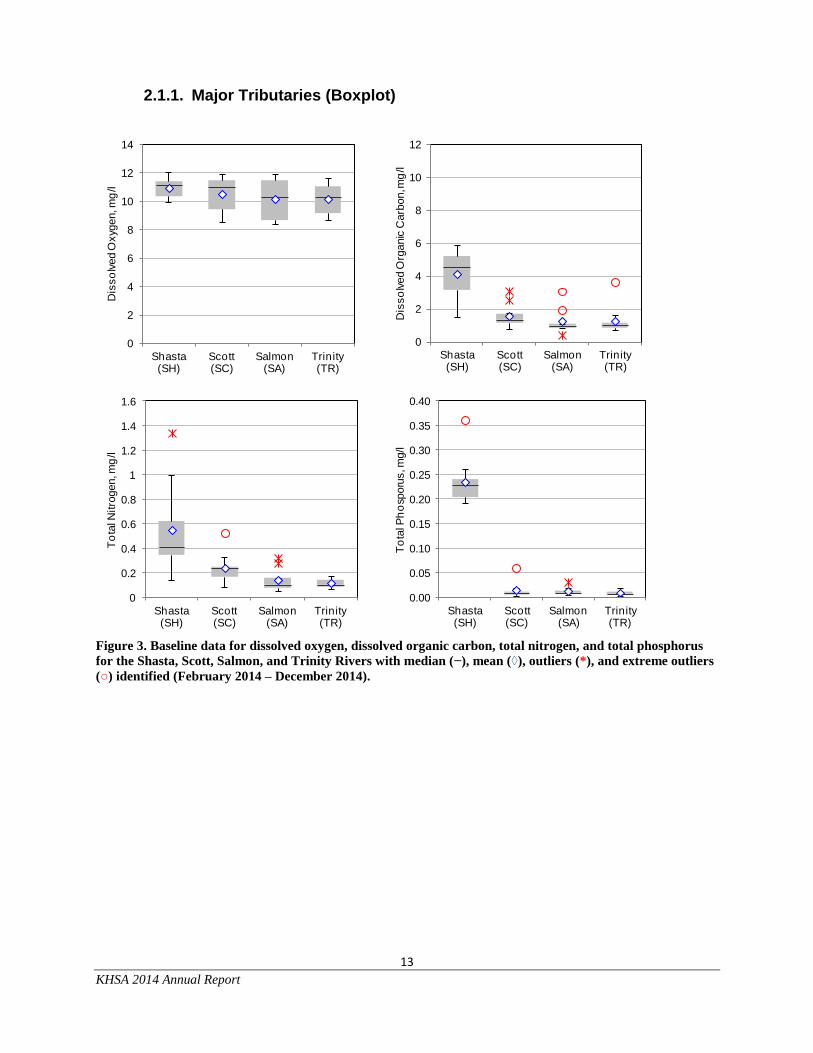
extreme outliers (○) identified (February 2014 – December 2014).................................................13 Figure 4. Dissolved oxygen concentration from Link River to the Klamath River Estuary with median (−),
mean (◊), outliers(*), and extreme outliers (○) identified (February 2014 – December 2014). Note:
Miller Island at Keno Reservoir (RM 246), Copco Reservoir (RM 199), and Iron Gate Reservoir
(RM 192). River mile on x-axis not to scale. ..................................................................................14 Figure 5. Dissolved organic carbon from Link River to the Klamath River Estuary with median (−), mean
(◊), outliers(*), and extreme outliers (○) identified (February 2014 – December 2014). Note:
Miller Island at Keno Reservoir (RM 246), Copco Reservoir (RM 199), and Iron Gate Reservoir
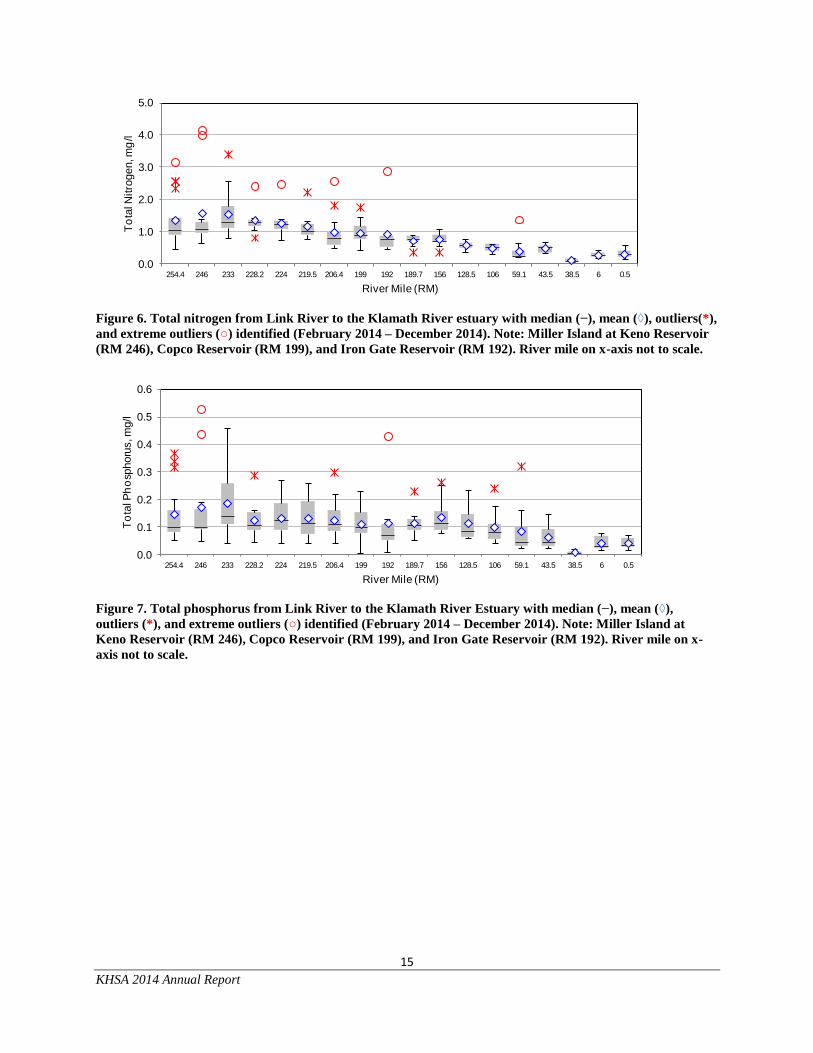
(RM 192). River mile on x-axis not to scale. ..................................................................................14 Figure 6. Total nitrogen from Link River to the Klamath River estuary with median (−), mean (◊),
outliers(*), and extreme outliers (○) identified (February 2014 – December 2014). Note: Miller
Island at Keno Reservoir (RM 246), Copco Reservoir (RM 199), and Iron Gate Reservoir (RM
192). River mile on x-axis not to scale. ...........................................................................................15 Figure 7. Total phosphorus from Link River to the Klamath River Estuary with median (−), mean (◊),
outliers (*), and extreme outliers (○) identified (February 2014 – December 2014). Note: Miller
Island at Keno Reservoir (RM 246), Copco Reservoir (RM 199), and Iron Gate Reservoir (RM
192). River mile on x-axis not to scale. ...........................................................................................15 Figure 8. Microcystin from Link River to the Klamath River Estuary with median (−), mean (◊), outliers
(*), and extreme outliers (○) identified (February 2014 – December 2014). Note: Miller Island at
Keno Reservoir (RM 246), Copco Reservoir (RM 199), and Iron Gate Reservoir (RM 192). River
mile on x-axis not to scale. ..............................................................................................................16 Figure 9. Continuous water temperature, dissolved oxygen, pH, specific conductance data (2014) for the
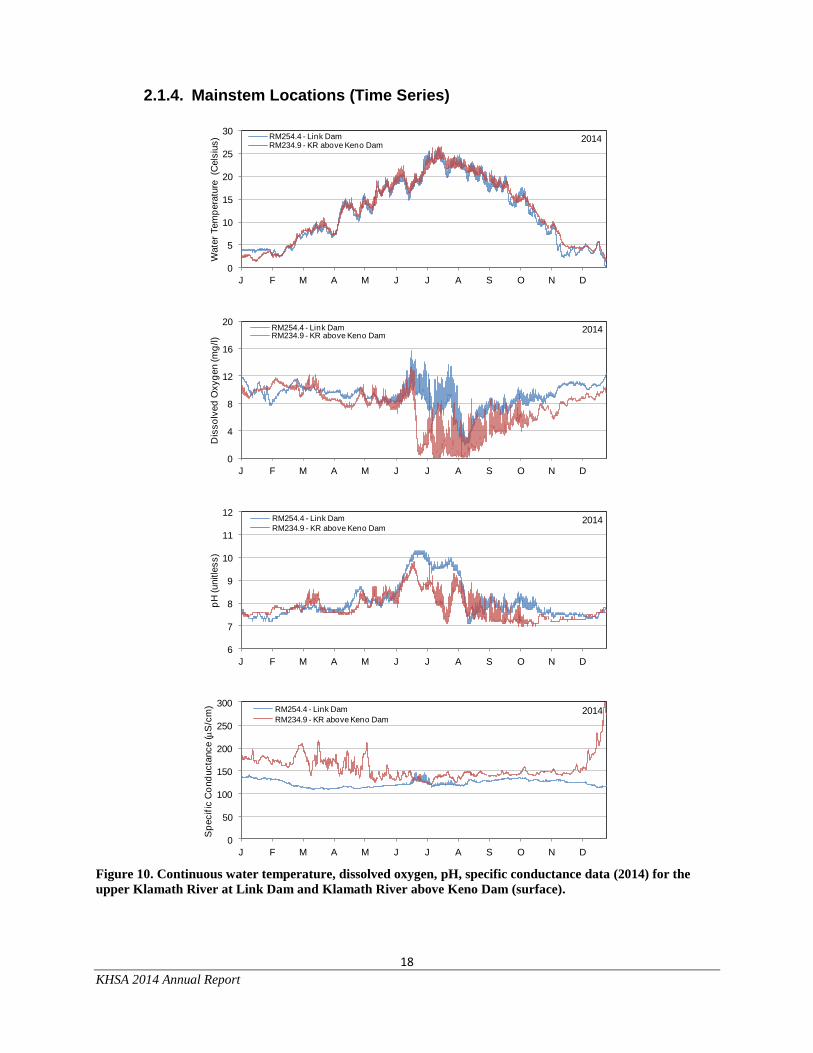
Shasta River, Scott River, Salmon River, and Trinity River. ..........................................................17 Figure 10. Continuous water temperature, dissolved oxygen, pH, specific conductance data (2014) for the
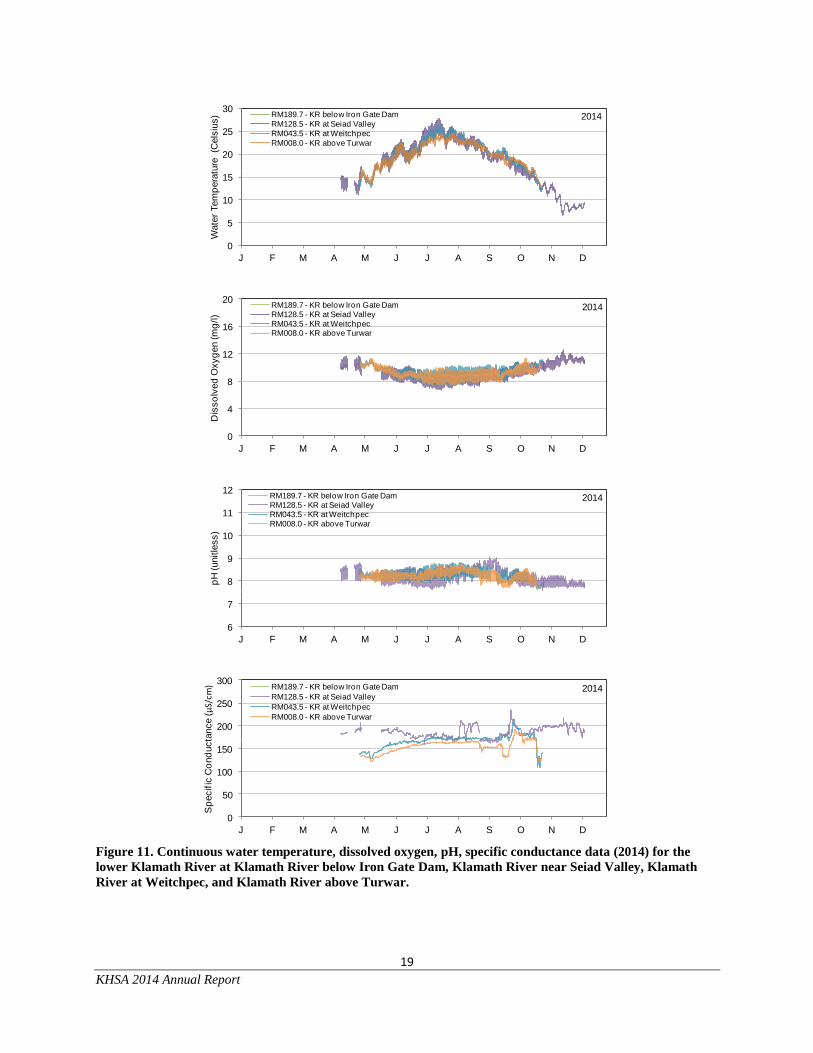
upper Klamath River at Link Dam and Klamath River above Keno Dam (surface). ......................18 Figure 11. Continuous water temperature, dissolved oxygen, pH, specific conductance data (2014) for the
lower Klamath River at Klamath River below Iron Gate Dam, Klamath River near Seiad Valley,
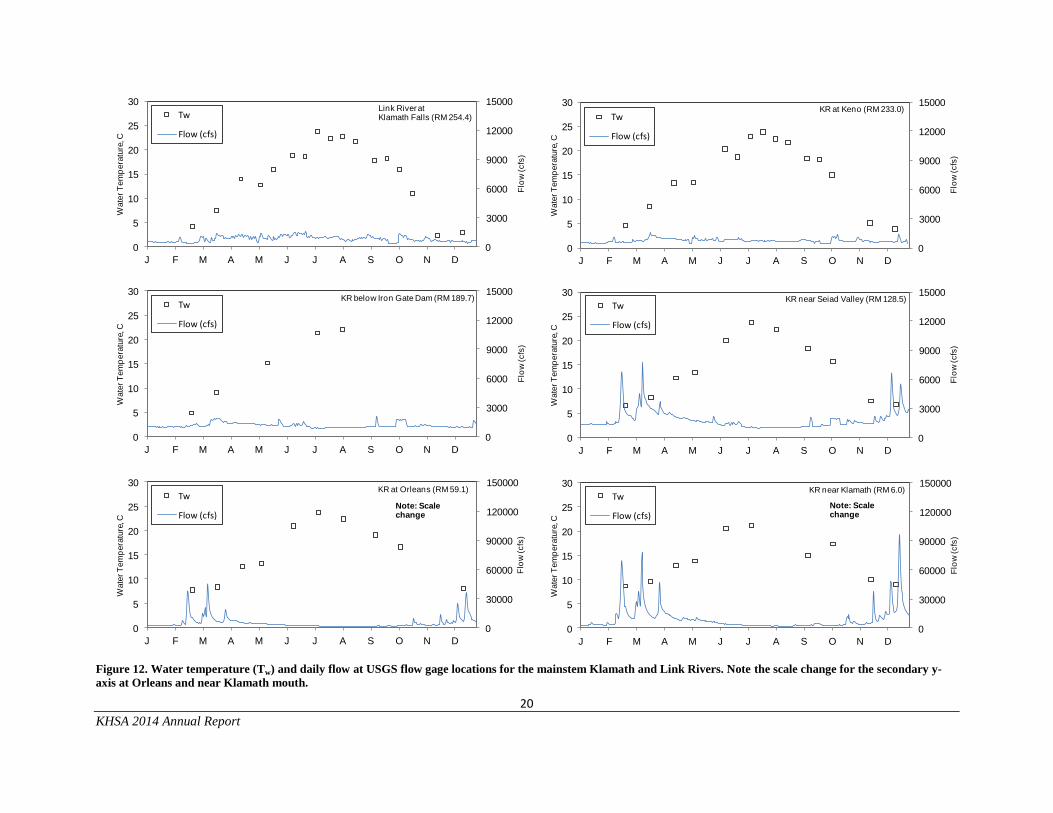
Klamath River at Weitchpec, and Klamath River above Turwar. ...................................................19 Figure 12. Water temperature (Tw) and daily flow at USGS flow gage locations for the mainstem Klamath
and Link Rivers. Note the scale change for the secondary y-axis at Orleans and near Klamath
mouth. .............................................................................................................................................20 Figure 13. Dissolved oxygen (DO) and daily flow at USGS flow gage locations for the mainstem Klamath
and Link Rivers. Note the scale change for the secondary y-axis at Orleans and near Klamath
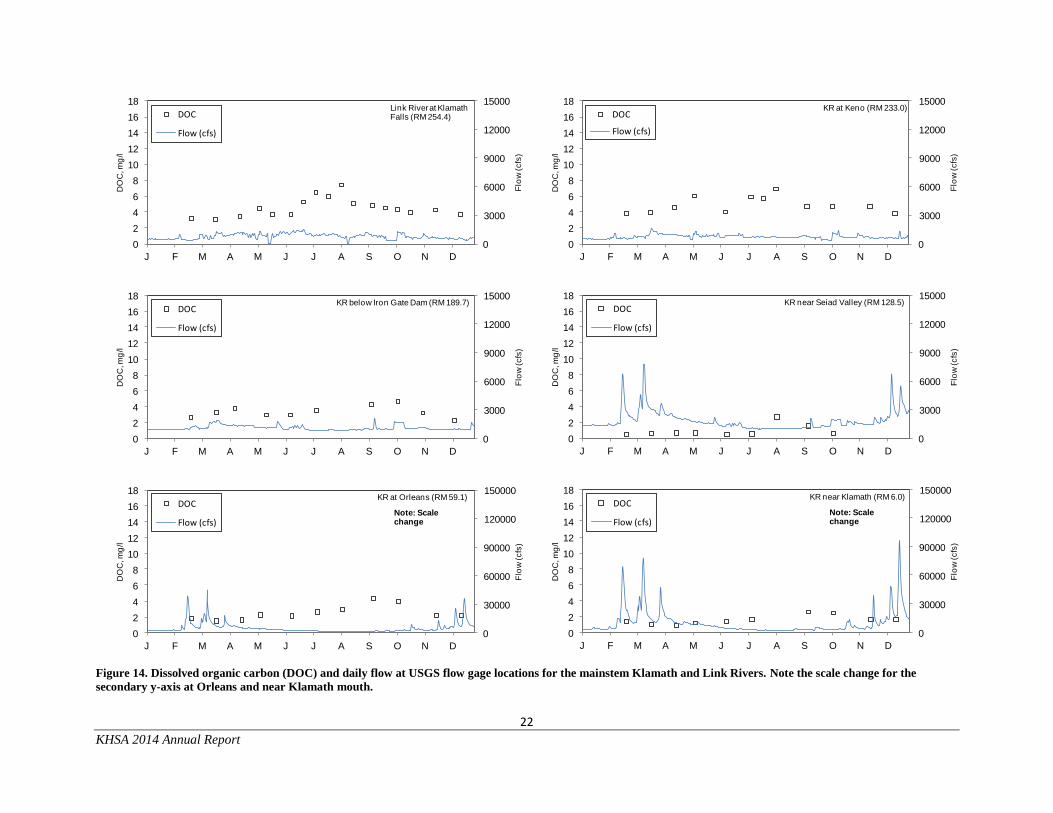
mouth. .............................................................................................................................................21 Figure 14. Dissolved organic carbon (DOC) and daily flow at USGS flow gage locations for the mainstem
Klamath and Link Rivers. Note the scale change for the secondary y-axis at Orleans and near
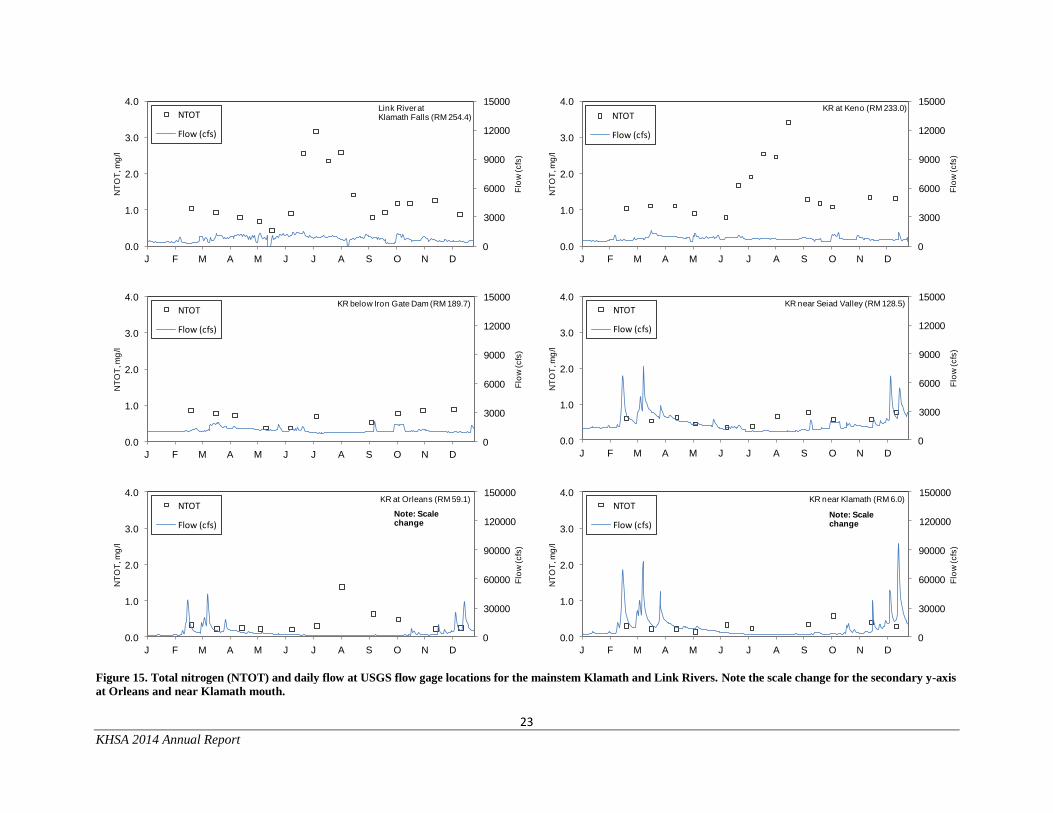
Klamath mouth. ...............................................................................................................................22 Figure 15. Total nitrogen (NTOT) and daily flow at USGS flow gage locations for the mainstem Klamath
and Link Rivers. Note the scale change for the secondary y-axis at Orleans and near Klamath
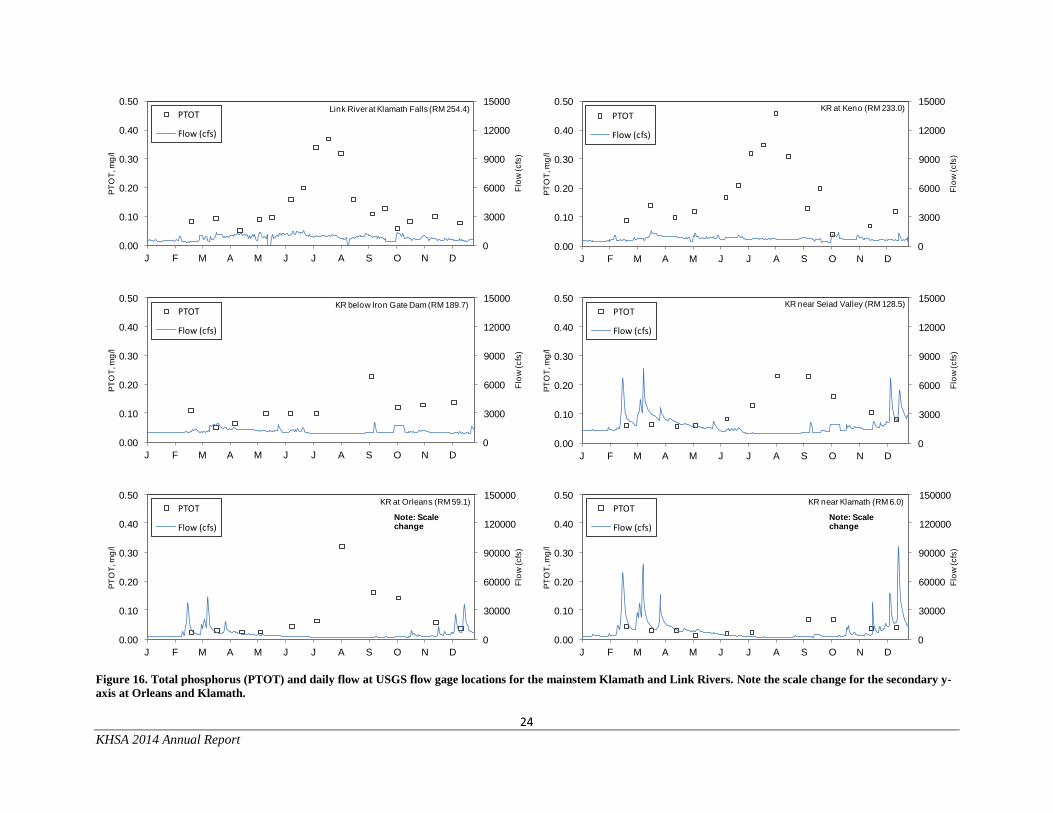
mouth. .............................................................................................................................................23 Figure 16. Total phosphorus (PTOT) and daily flow at USGS flow gage locations for the mainstem
Klamath and Link Rivers. Note the scale change for the secondary y-axis at Orleans and Klamath.
.........................................................................................................................................................24 Figure 17. Microcystin (MCYN) and daily flow at USGS flow gage locations for the mainstem Klamath
and Link Rivers. Only surface samples are taken in consideration. Non-detect values are presented
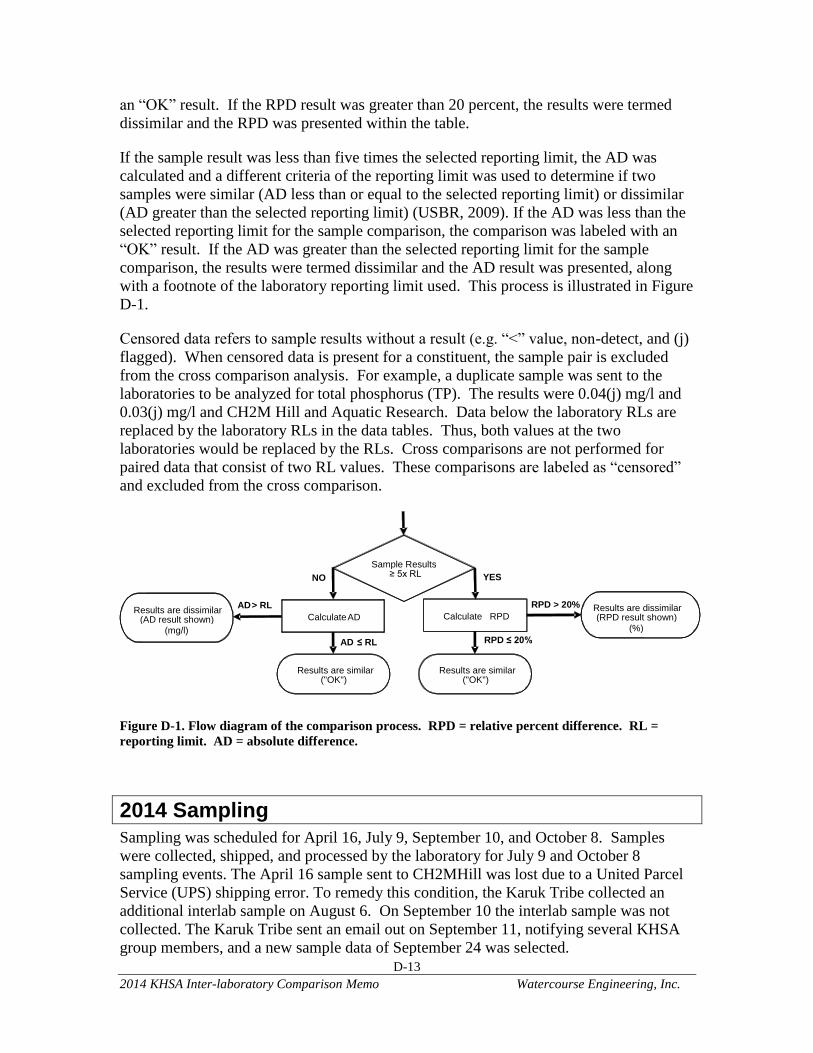
as zeros. Note the scale change for the secondary y-axis at Orleans and Klamath. .......................25 Figure D-1. Flow diagram of the comparison process. RPD = relative percent difference. RL = reporting
limit. AD = absolute difference. ................................................................................................ D-13
ES-3
KHSA 2014 Annual Report
Figure A-1. KHSA inter-laboratory plots from 2009-2014 for Dissolved Organic Carbon (mg/l). Grey
region in lower corner represents the region below the RL for the respective laboratories in 2014.
.................................................................................................................................................... D-21 Figure A-2. KHSA inter-laboratory plots from 2009-2014 for Total Nitrogen (mg/l). Grey region in lower
corner represents the region below the RL for the respective laboratories in 2014.................... D-21 Figure A-3. KHSA inter-laboratory plots from 2009-2014 for Orthophosphate (mg/l). Grey region in lower
corner represents the region below the RL for the respective laboratories in 2014.................... D-22 Figure A-4. KHSA inter-laboratory plots from 2009-2014 for Total Phosphorus (mg/l). Grey region in
lower corner represents the region below the RL for the respective laboratories in 2014. ........ D-22 Figure A-5. KHSA inter-laboratory plots from 2009-2014 for Total Suspended Solids (mg/l). Grey region
in lower corner represents the region below the RL for the respective laboratories in 2014. .... D-23 Figure A-6. KHSA inter-laboratory plots from 2009-2014 for Volatile Suspended Solids (mg/l). Grey
region in lower corner represents the region below the RL for the respective laboratories in 2014.
.................................................................................................................................................... D-23 Figure A-7. KHSA inter-laboratory plots from 2009-2014 for Chlorophyll-a (μg/l). Grey region in lower
corner represents the region below the RL for the respective laboratories in 2014. Note:
Chlorophyll-a was not collected from 2009-2011. ..................................................................... D-24
ES-4
KHSA 2014 Annual Report
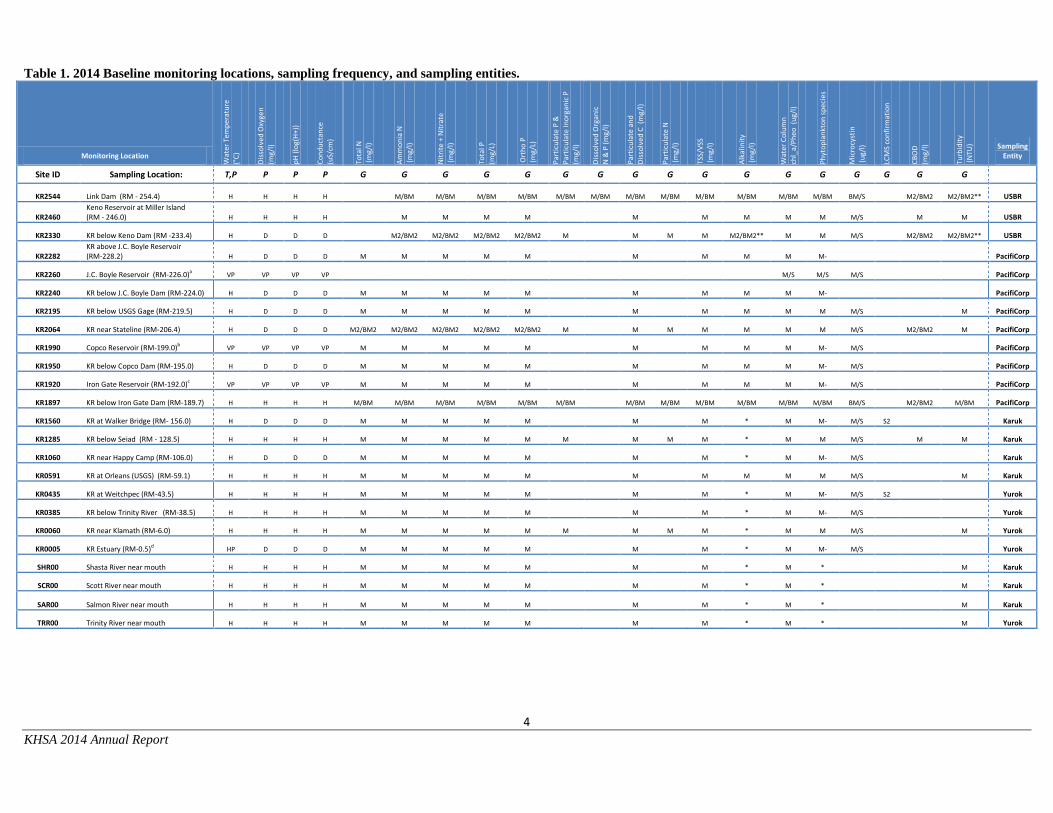
List of Tables and Charts Table 1. 2014 Baseline monitoring locations, sampling frequency, and sampling entities. ........................... 4 Table 2. Analyzing laboratory method references, method detection limits and method reporting limits for
water quality constituents. Units presented in milligrams per liter (mg/L) or parts per million
(ppm) unless otherwise noted. .......................................................................................................... 9 Table 3. United States Geological Survey (USGS) flow gage locations for time series data. River mile and
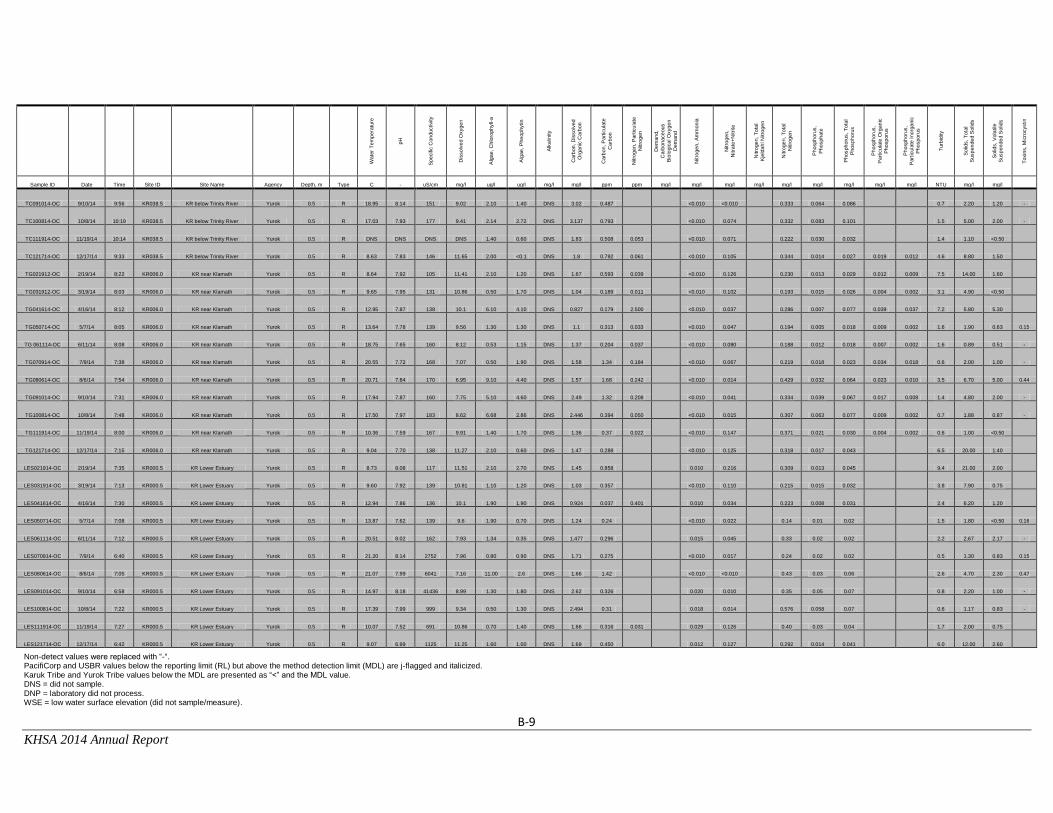
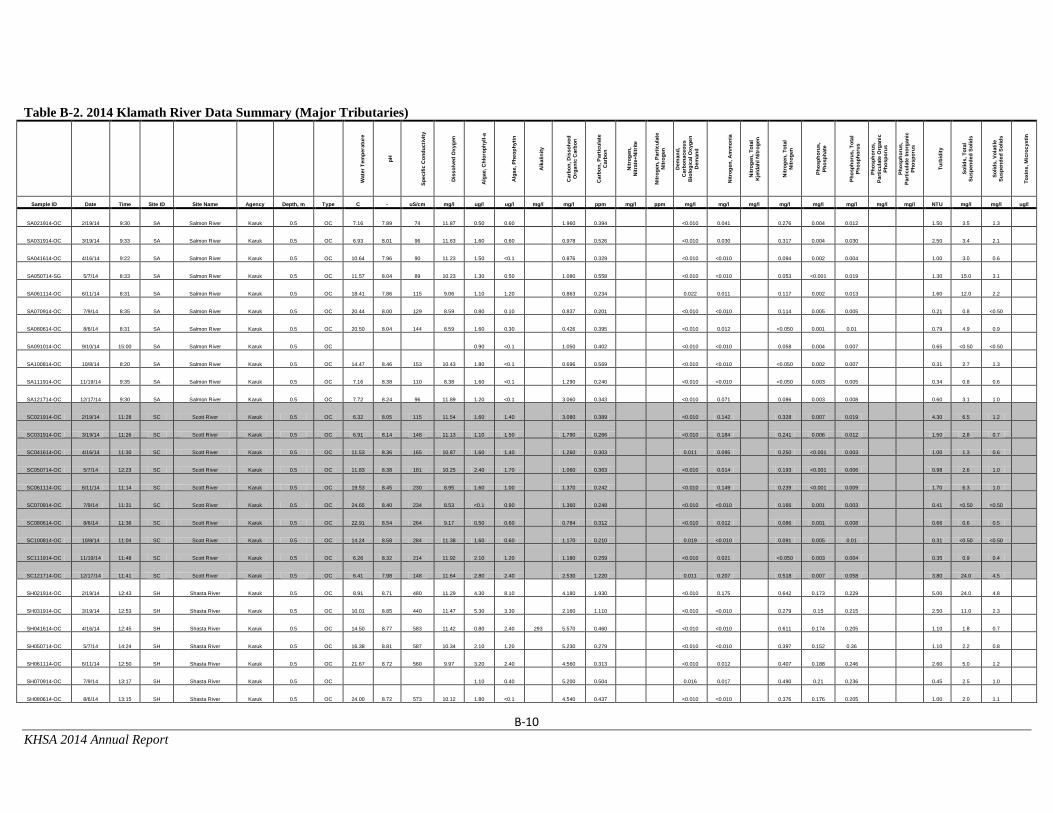
gage number presented. ...................................................................................................................12 Table 4. List of figures, data type, and data description. Note: KR = Klamath River ...................................12 Table A-1. 2014 Klamath River mainstem and major tributaries sampling locations. ............................... A-1 Table B-1. 2014 Klamath River Data Summary (Mainstem). .....................................................................B-1 Table B-2. 2014 Klamath River Data Summary (Major Tributaries) ........................................................B-10 Table B-3. Mass Spectroscopy data for the samples collected at the Klamath River at Weitchpec. Results
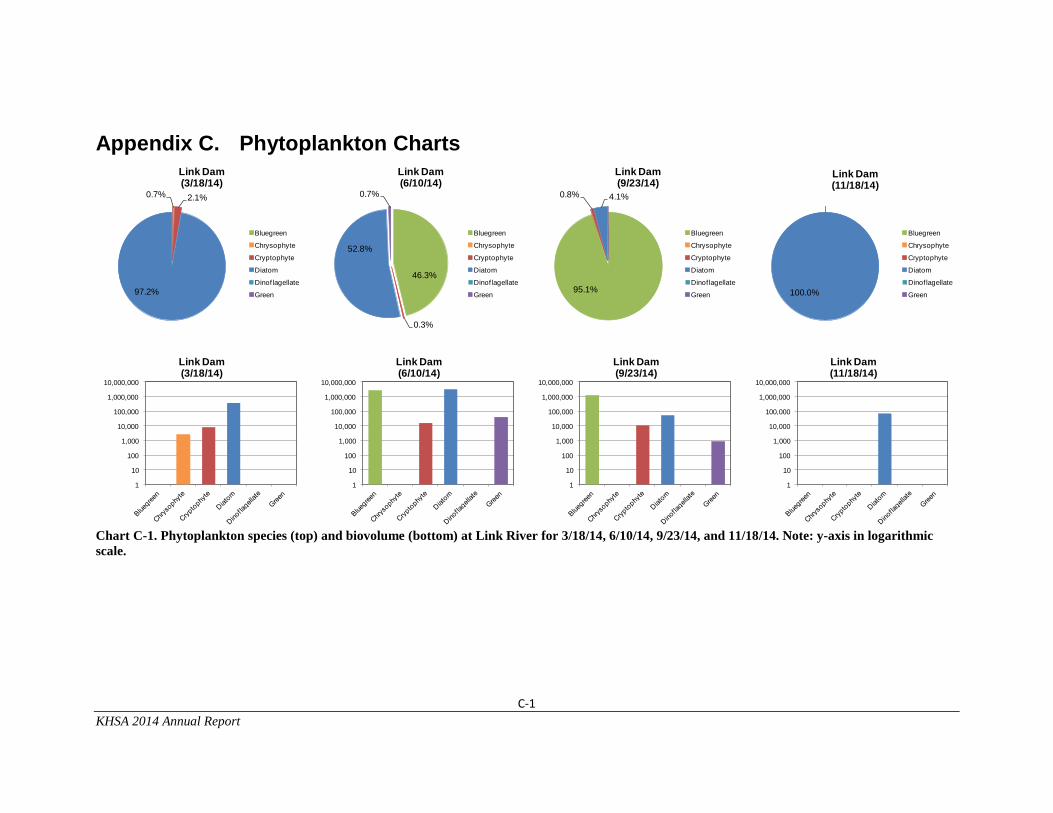
are presented in micrograms per liter (μg/l). Note: ND = non-detect.........................................B-11 Chart C-1. Phytoplankton species (top) and biovolume (bottom) at Link River for 3/18/14, 6/10/14,
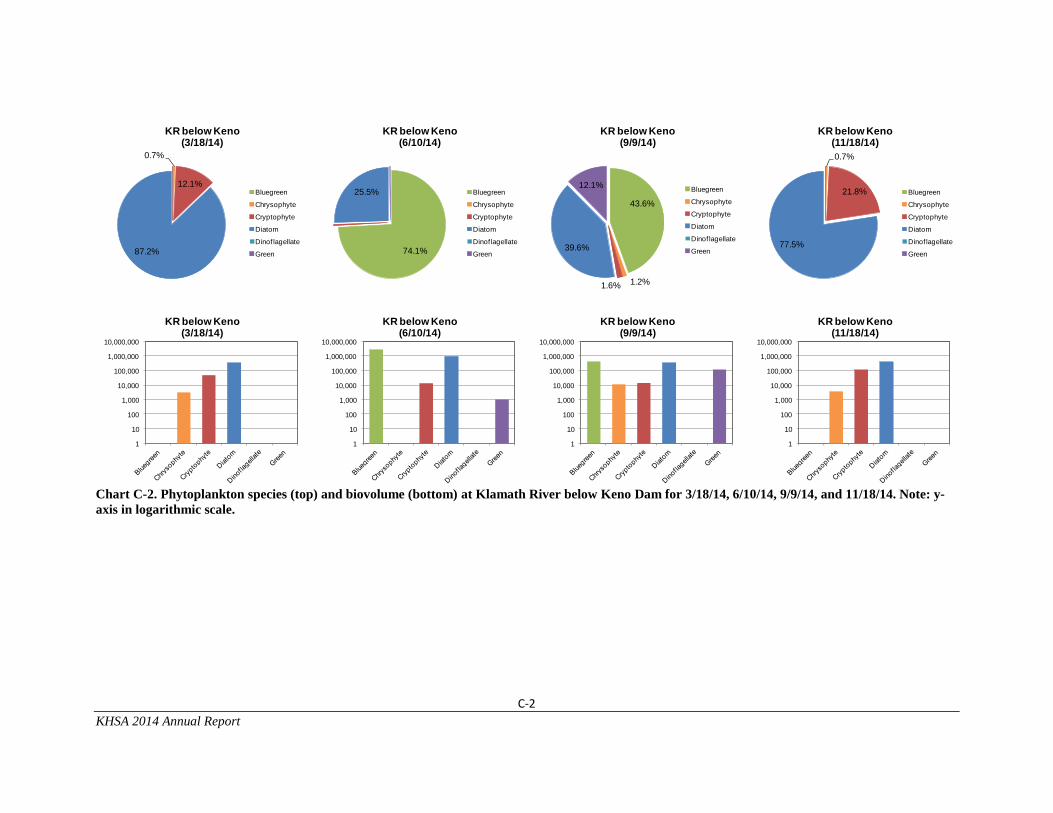
9/23/14, and 11/18/14. Note: y-axis in logarithmic scale. .............................................................C-1 Chart C-2. Phytoplankton species (top) and biovolume (bottom) at Klamath River below Keno Dam for
3/18/14, 6/10/14, 9/9/14, and 11/18/14. Note: y-axis in logarithmic scale. ...................................C-2 Chart C-3. Phytoplankton species (top) and biovolume (bottom) at Copco Reservoir near dam for 3/18/14,
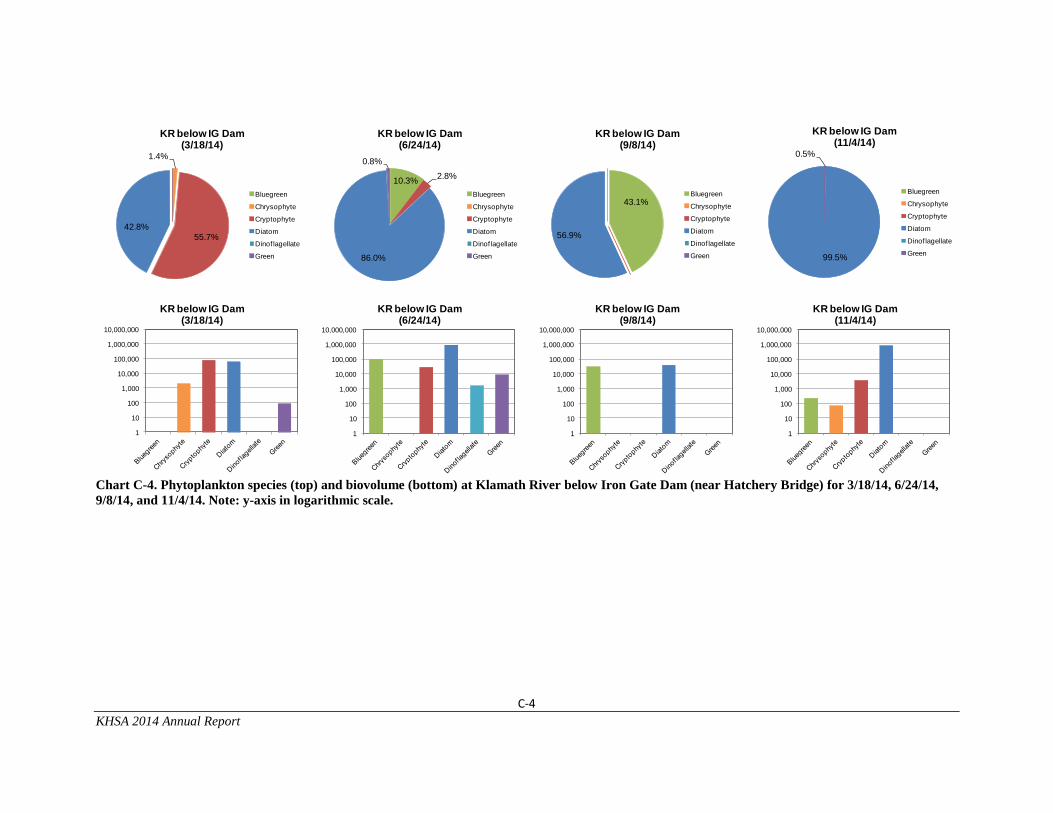
6/9/14, 9/23/14, and 11/4/14. Note: y-axis in logarithmic scale. ...................................................C-3 Chart C-4. Phytoplankton species (top) and biovolume (bottom) at Klamath River below Iron Gate Dam
(near Hatchery Bridge) for 3/18/14, 6/24/14, 9/8/14, and 11/4/14. Note: y-axis in logarithmic
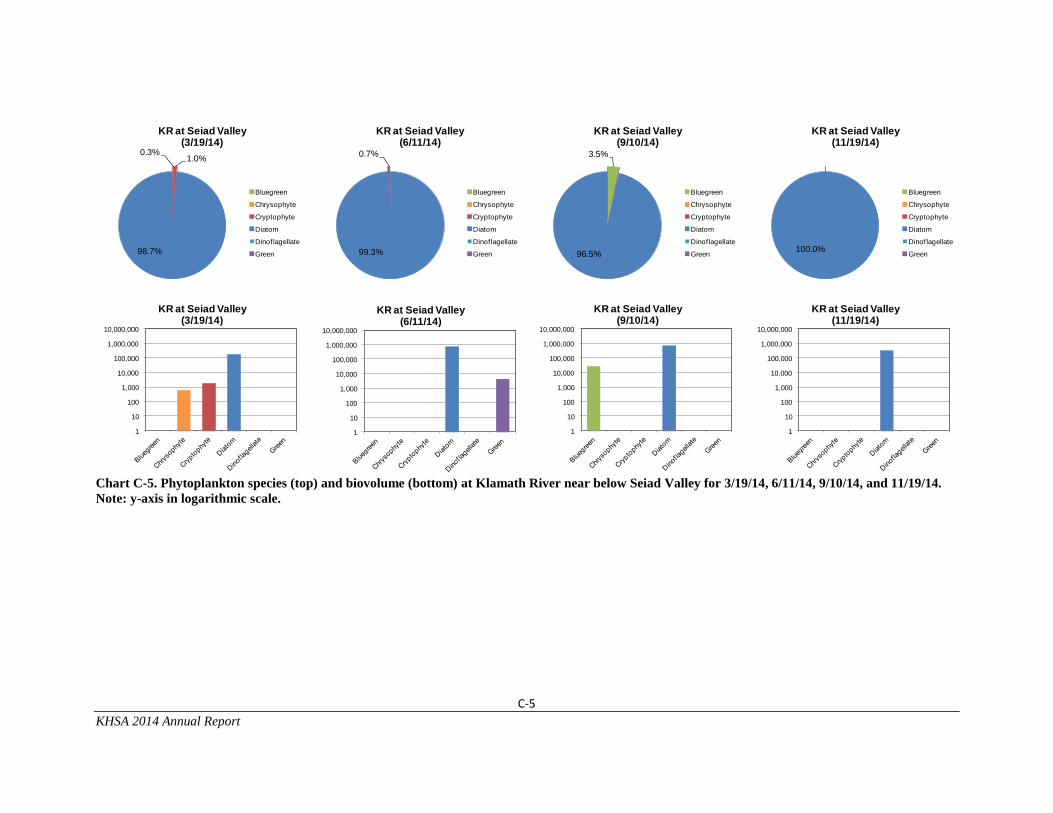
scale. ..............................................................................................................................................C-4 Chart C-5. Phytoplankton species (top) and biovolume (bottom) at Klamath River near below Seiad Valley
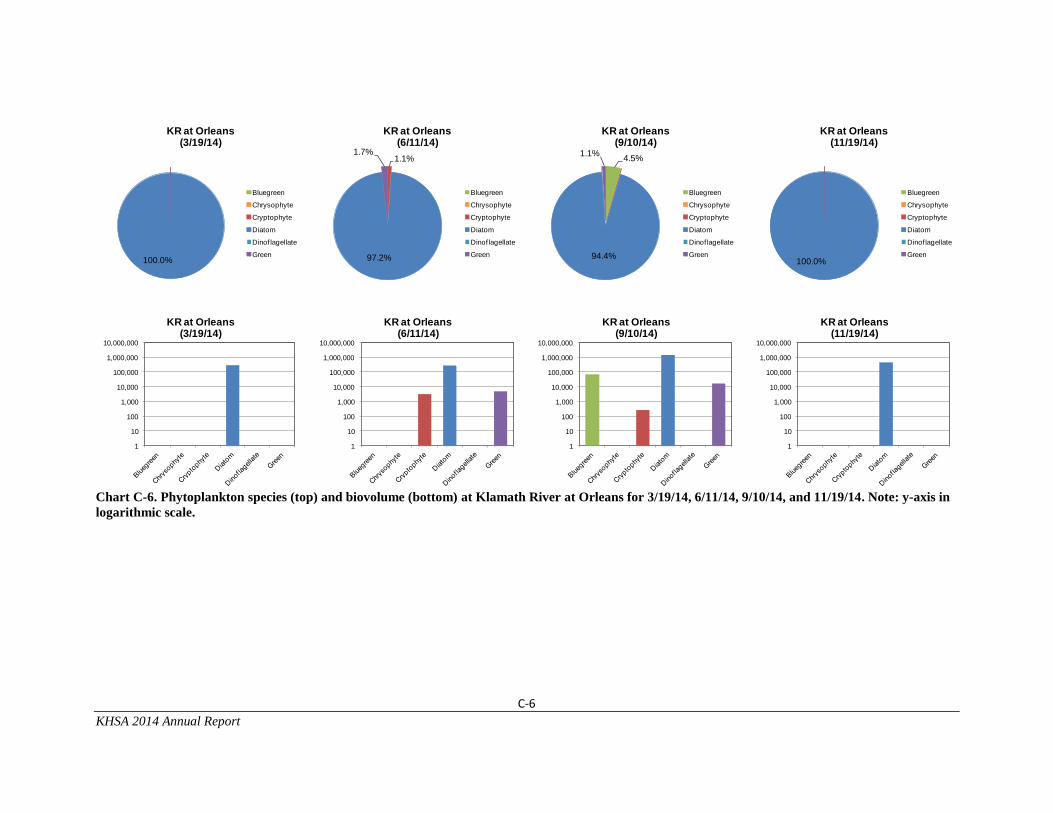
for 3/19/14, 6/11/14, 9/10/14, and 11/19/14. Note: y-axis in logarithmic scale. ...........................C-5 Chart C-6. Phytoplankton species (top) and biovolume (bottom) at Klamath River at Orleans for 3/19/14,
6/11/14, 9/10/14, and 11/19/14. Note: y-axis in logarithmic scale. ...............................................C-6 Chart C-7. Phytoplankton species (top) and biovolume (bottom) at Klamath River at Weitchpec for
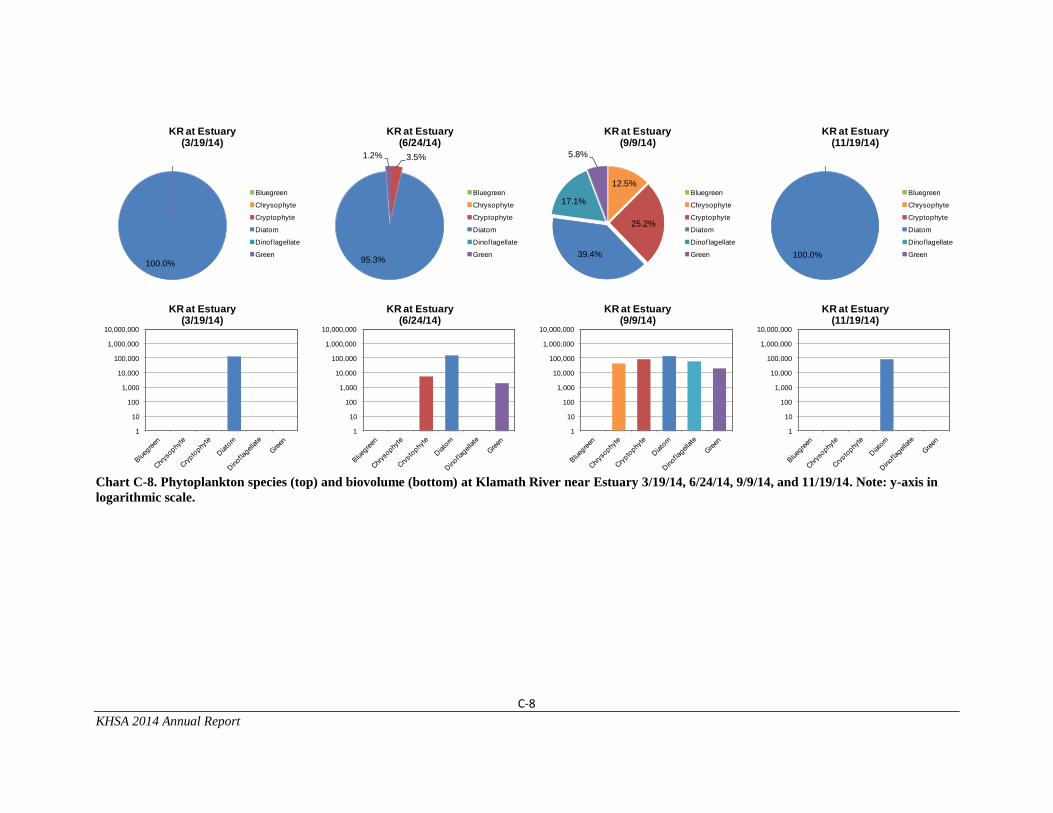
3/19/14, 6/25/14, 9/10/14, and 11/19/14. Note: y-axis in logarithmic scale. .................................C-7 Chart C-8. Phytoplankton species (top) and biovolume (bottom) at Klamath River near Estuary 3/19/14,
6/24/14, 9/9/14, and 11/19/14. Note: y-axis in logarithmic scale. .................................................C-8 Table D-1. Laboratory methods, method detection limits (MDL), and reporting limits (RL) for CH2M Hill
(2014). N/A = not applicable...................................................................................................... D-11 Table D-2. Laboratory methods, method detection limits (MDL), and reporting limits (RL) for Aquatic
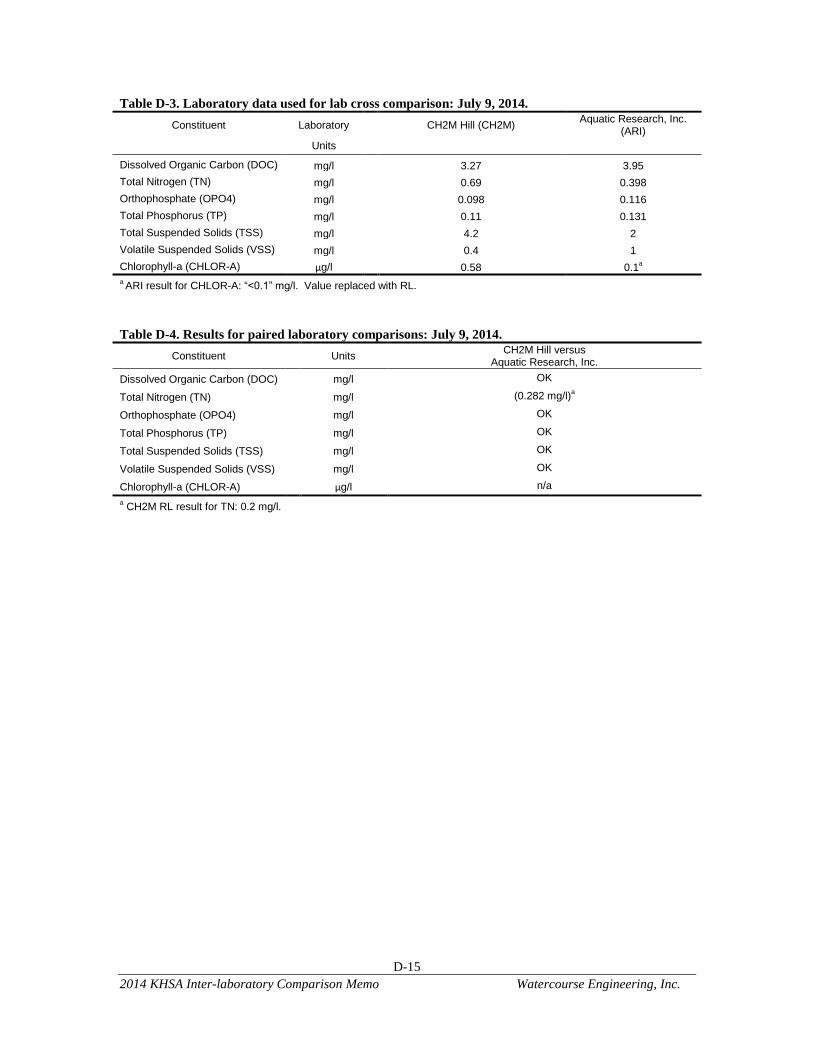
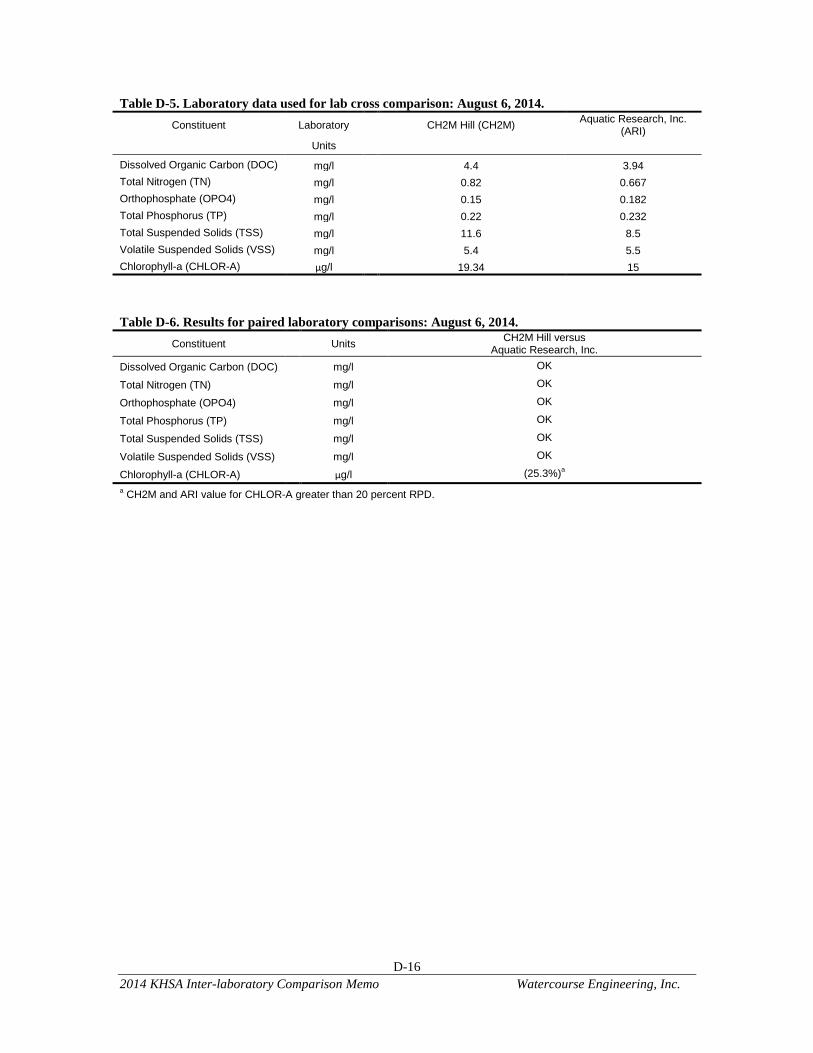
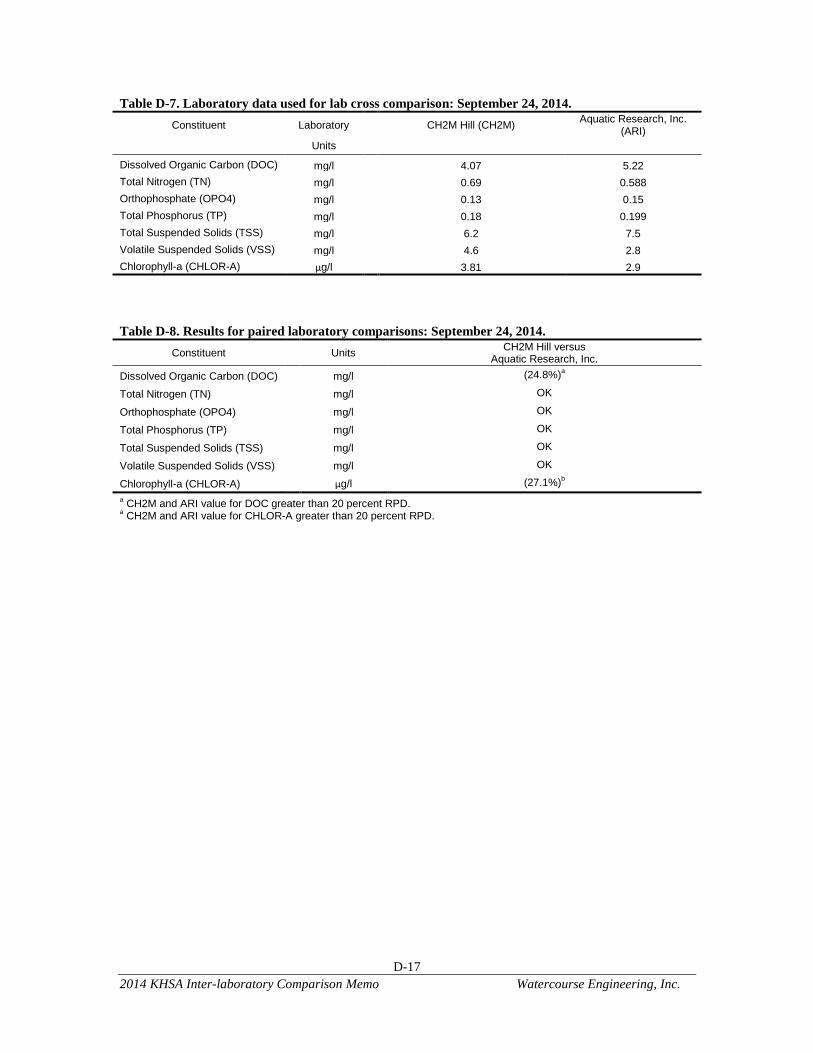
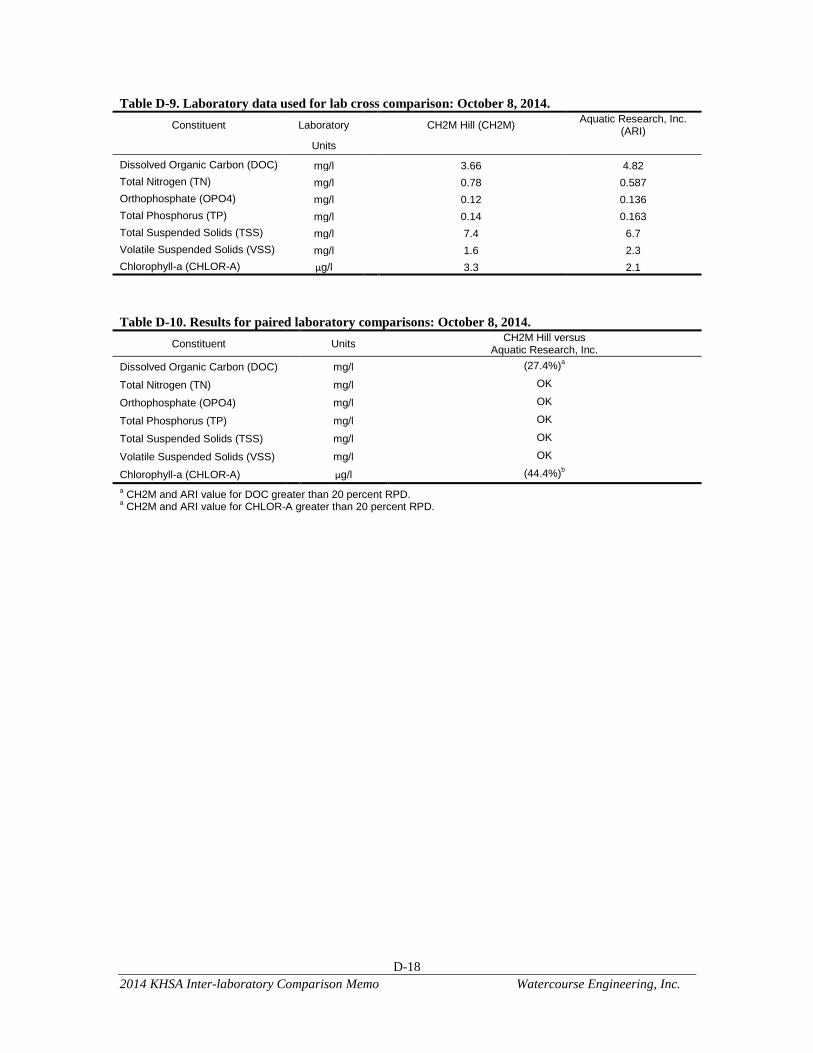
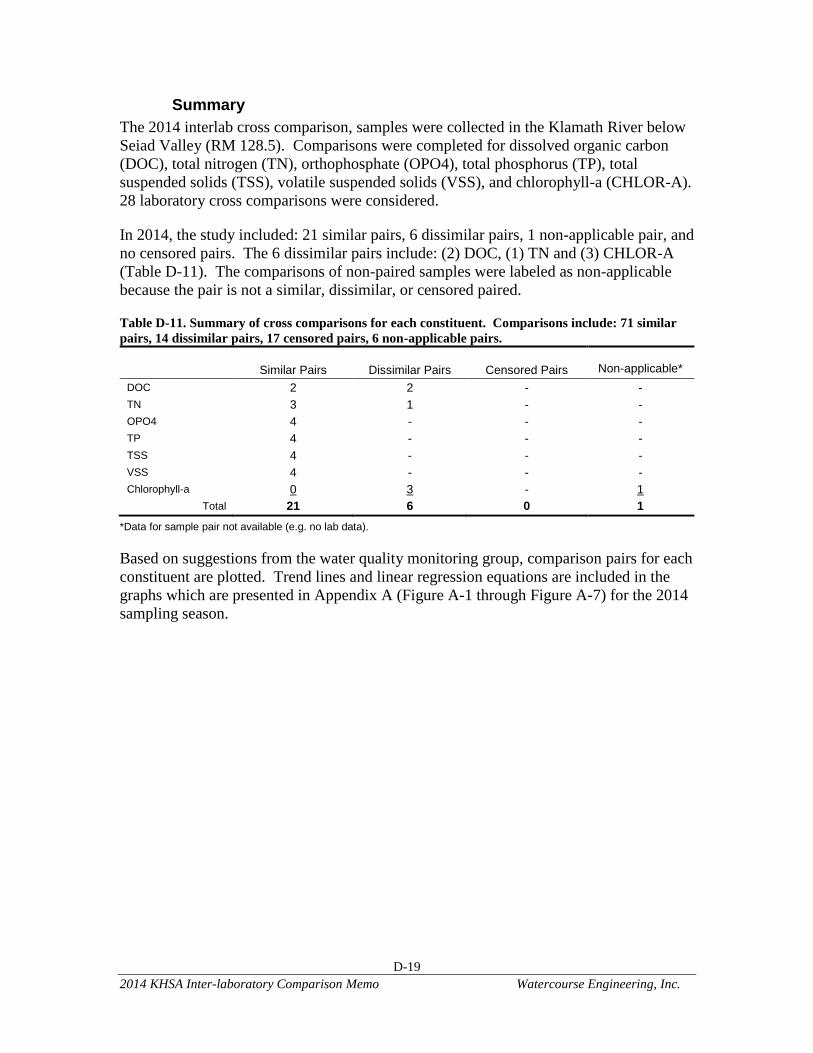
Research (2014). ........................................................................................................................ D-12 Table D-3. Laboratory data used for lab cross comparison: July 9, 2014. ............................................... D-15 Table D-4. Results for paired laboratory comparisons: July 9, 2014. ...................................................... D-15 Table D-5. Laboratory data used for lab cross comparison: August 6, 2014. ........................................... D-16 Table D-6. Results for paired laboratory comparisons: August 6, 2014. .................................................. D-16 Table D-7. Laboratory data used for lab cross comparison: September 24, 2014. ................................... D-17 Table D-8. Results for paired laboratory comparisons: September 24, 2014. .......................................... D-17 Table D-9. Laboratory data used for lab cross comparison: October 8, 2014. ......................................... D-18 Table D-10. Results for paired laboratory comparisons: October 8, 2014. .............................................. D-18 Table D-11. Summary of cross comparisons for each constituent. Comparisons include: 71 similar pairs,
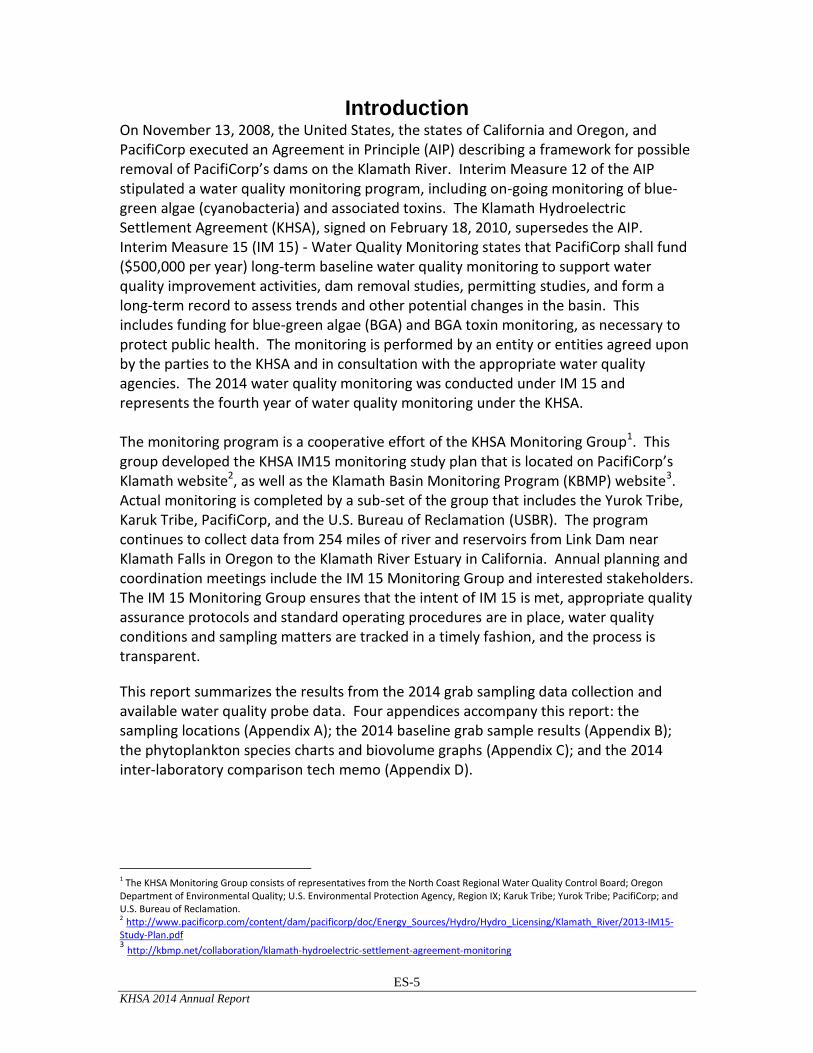
Introduction On November 13, 2008, the United States, the states of California and Oregon, and PacifiCorp executed an Agreement in Principle (AIP) describing a framework for possible removal of PacifiCorp’s dams on the Klamath River. Interim Measure 12 of the AIP stipulated a water quality monitoring program, including on-going monitoring of blue-green algae (cyanobacteria) and associated toxins. The Klamath Hydroelectric Settlement Agreement (KHSA), signed on February 18, 2010, supersedes the AIP. Interim Measure 15 (IM 15) - Water Quality Monitoring states that PacifiCorp shall fund ($500,000 per year) long-term baseline water quality monitoring to support water quality improvement activities, dam removal studies, permitting studies, and form a long-term record to assess trends and other potential changes in the basin. This includes funding for blue-green algae (BGA) and BGA toxin monitoring, as necessary to protect public health. The monitoring is performed by an entity or entities agreed upon by the parties to the KHSA and in consultation with the appropriate water quality agencies. The 2014 water quality monitoring was conducted under IM 15 and represents the fourth year of water quality monitoring under the KHSA. The monitoring program is a cooperative effort of the KHSA Monitoring Group1. This group developed the KHSA IM15 monitoring study plan that is located on PacifiCorp’s Klamath website2, as well as the Klamath Basin Monitoring Program (KBMP) website3. Actual monitoring is completed by a sub-set of the group that includes the Yurok Tribe, Karuk Tribe, PacifiCorp, and the U.S. Bureau of Reclamation (USBR). The program continues to collect data from 254 miles of river and reservoirs from Link Dam near Klamath Falls in Oregon to the Klamath River Estuary in California. Annual planning and coordination meetings include the IM 15 Monitoring Group and interested stakeholders. The IM 15 Monitoring Group ensures that the intent of IM 15 is met, appropriate quality assurance protocols and standard operating procedures are in place, water quality conditions and sampling matters are tracked in a timely fashion, and the process is transparent.
This report summarizes the results from the 2014 grab sampling data collection and available water quality probe data. Four appendices accompany this report: the sampling locations (Appendix A); the 2014 baseline grab sample results (Appendix B); the phytoplankton species charts and biovolume graphs (Appendix C); and the 2014 inter-laboratory comparison tech memo (Appendix D).
1 The KHSA Monitoring Group consists of representatives from the North Coast Regional Water Quality Control Board; Oregon Department of Environmental Quality; U.S. Environmental Protection Agency, Region IX; Karuk Tribe; Yurok Tribe; PacifiCorp; and U.S. Bureau of Reclamation. 2 http://www.pacificorp.com/content/dam/pacificorp/doc/Energy_Sources/Hydro/Hydro_Licensing/Klamath_River/2013-IM15-Study-Plan.pdf 3 http://kbmp.net/collaboration/klamath-hydroelectric-settlement-agreement-monitoring
Program Elements The primary elements of the IM 15 monitoring program include baseline and public health monitoring. The baseline water quality monitoring element includes water quality grab samples, physical observations associated with these grab samples, water quality probe and algae species data. The water quality probes recorded observations at hourly or sub-hourly intervals. Parameters sampled by probes included water temperature, dissolved oxygen, specific conductivity, and pH at specific locations in the Klamath River (Table 1). The grab samples are collected for analytical determination for a suite of water quality constituents (Section 1.1). The algae data in the baseline monitoring element includes algae species identification and quantification samples collected at each sampling location. The grab sample and water quality probe data and algae species quantification are presented in this report, and are available in electronic form. Monitoring was carried out from February through December.
The public health monitoring program data consists of algae species at specific sites within reservoirs and river reaches and focuses on algae species and algal toxin sampling. These results are not discussed herein, but rather are reported separately as a compilation of summary reports presented through the season. These reports were used to track phytoplankton and toxin conditions that supported management decisions to post and de-post reservoir and river reaches with public health advisory information.
KBMP has developed a database to store information collected under the IM 15 program, including the baseline monitoring and the public health monitoring elements. These data are accessible via the KBMP website. In addition, the KBMP website includes links to previous reports and other, associated program documents, and other materials and features that provide transparency to the KBMP process that are directly transferable to the IM 15 monitoring program. There are other Klamath River monitoring efforts outside of the IM 15 program that are sponsored by individual entities, including entities that participate in the IM 15 program. However, only data collected under the IM 15 are included herein.
2
KHSA 2014 Annual Report
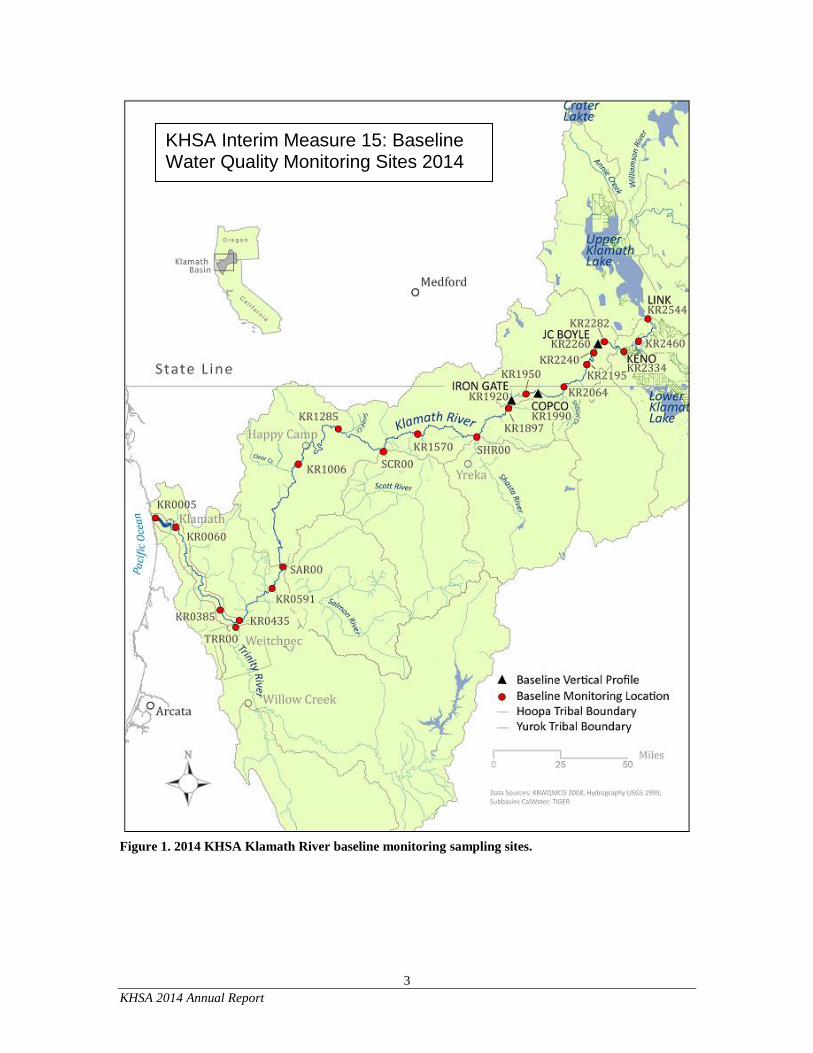
Baseline Program Water Quality Sampling In 2014, sampling was conducted at twenty-four sites along the Klamath River and its tributaries, from Link Dam to the Klamath River Estuary (Figure 1), by the four sampling entities: U.S. Bureau of Reclamation (USBR), PacifiCorp, Karuk Tribe, and Yurok Tribe. Sixteen of those sites were located on the mainstem of the Klamath River, four sites were located in the reservoirs on the Klamath River, and four sites were located on the major tributaries of the Klamath River (Shasta, Scott, Salmon and Trinity River). Sampling locations, sampling frequency and sampling entity are presented in Table 1.
Discrete physical parameters (water temperature, dissolved oxygen, specific conductivity, and pH) were collected at all sites when grab samples were collected during the sampling year. Continuous water quality parameters were collected at six sites: Link Dam (RM 254.4), Klamath River above Keno Dam (RM 234.9), Klamath River below Iron Gate Dam (RM 189.7), Klamath River at Seiad Valley (RM 128.5), Klamath River at Weitchpec (RM 043.5), and Klamath River above Turwar (RM 008.0). Grab samples of all other baseline water quality constituents were collected monthly. Exceptions include: (a) at Link Dam and Klamath River below Iron Gate Dam, where samples were collected bi-monthly from May through October and monthly for the remainder of the sampling season, and (b) Klamath River below Keno and Klamath River at Stateline, where samples were collected bi-monthly from June through September and monthly for the remainder of the sampling season. Please refer to Table 1 for the frequencies at each sampling location.
The following constituents were analyzed: inorganic nitrogen (total nitrogen, nitrate+nitrite, and ammonia), particulate nitrogen, particulate phosphorus, particulate inorganic phosphorus, inorganic phosphorus (total phosphorus and orthophosphate), particulate carbon, dissolved organic carbon, total and volatile suspended solids, carbonaceous biological oxygen demand, turbidity, chlorophyll-a, pheophytin, and microcystin. Phytoplankton species samples were also collected. Not all parameters were collected at every site; please refer to Table 1 for the parameters analyzed at each sampling location. Data results from the 2014 baseline grab samples are presented in Appendix B.
3
KHSA 2014 Annual Report
Figure 1. 2014 KHSA Klamath River baseline monitoring sampling sites.
KHSA Interim Measure 15: Baseline Water Quality Monitoring Sites 2014
Site ID Sampling Location: T,P P P P G G G G G G G G G G G G G G G G G
KR2544 Link Dam (RM - 254.4) H H H H M/BM M/BM M/BM M/BM M/BM M/BM M/BM M/BM M/BM M/BM M/BM M/BM BM/S M2/BM2 M2/BM2** USBR
KR2460 Keno Reservoir at Miller Island (RM - 246.0) H H H H M M M M M M M M M M/S M M USBR
KR2330 KR below Keno Dam (RM -233.4) H D D D M2/BM2 M2/BM2 M2/BM2 M2/BM2 M M M M M2/BM2** M M M/S M2/BM2 M2/BM2** USBR
KR2282 KR above J.C. Boyle Reservoir (RM-228.2) H D D D M M M M M M M M M M- PacifiCorp
KR2260 J.C. Boyle Reservoir (RM-226.0)a VP VP VP VP M/S M/S M/S PacifiCorp
KR2240 KR below J.C. Boyle Dam (RM-224.0) H D D D M M M M M M M M M M- PacifiCorp
KR2195 KR below USGS Gage (RM-219.5) H D D D M M M M M M M M M M M/S M PacifiCorp
KR2064 KR near Stateline (RM-206.4) H D D D M2/BM2 M2/BM2 M2/BM2 M2/BM2 M2/BM2 M M M M M M M M/S M2/BM2 M PacifiCorp
KR1990 Copco Reservoir (RM-199.0)b VP VP VP VP M M M M M M M M M M- M/S PacifiCorp
KR1950 KR below Copco Dam (RM-195.0) H D D D M M M M M M M M M M- M/S PacifiCorp
KR1920 Iron Gate Reservoir (RM-192.0)c VP VP VP VP M M M M M M M M M M- M/S PacifiCorp
KR1897 KR below Iron Gate Dam (RM-189.7) H H H H M/BM M/BM M/BM M/BM M/BM M/BM M/BM M/BM M/BM M/BM M/BM M/BM BM/S M2/BM2 M/BM PacifiCorp
KR1560 KR at Walker Bridge (RM- 156.0) H D D D M M M M M M M * M M- M/S S2 Karuk
KR1285 KR below Seiad (RM - 128.5) H H H H M M M M M M M M M * M M M/S M M Karuk
KR1060 KR near Happy Camp (RM-106.0) H D D D M M M M M M M * M M- M/S Karuk
KR0591 KR at Orleans (USGS) (RM-59.1) H H H H M M M M M M M M M M M/S M Karuk
KR0435 KR at Weitchpec (RM-43.5) H H H H M M M M M M M * M M- M/S S2 Yurok
KR0385 KR below Trinity River (RM-38.5) H H H H M M M M M M M * M M- M/S Yurok
KR0060 KR near Klamath (RM-6.0) H H H H M M M M M M M M M * M M M/S M Yurok
KR0005 KR Estuary (RM-0.5)d HP D D D M M M M M M M * M M- M/S Yurok
SHR00 Shasta River near mouth H H H H M M M M M M M * M * M Karuk
SCR00 Scott River near mouth H H H H M M M M M M M * M * M Karuk
SAR00 Salmon River near mouth H H H H M M M M M M M * M * M Karuk
TRR00 Trinity River near mouth H H H H M M M M M M M * M * M Yurok
5
KHSA 2014 Annual Report
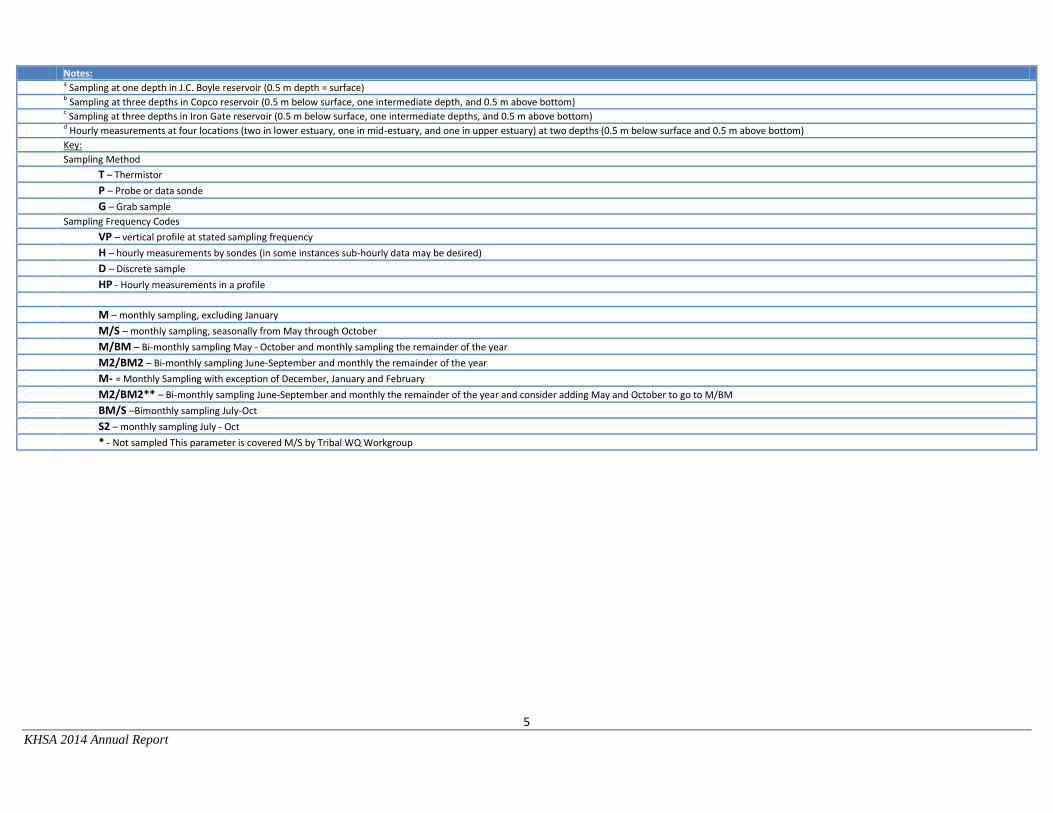
Notes: a Sampling at one depth in J.C. Boyle reservoir (0.5 m depth = surface) b Sampling at three depths in Copco reservoir (0.5 m below surface, one intermediate depth, and 0.5 m above bottom) c Sampling at three depths in Iron Gate reservoir (0.5 m below surface, one intermediate depths, and 0.5 m above bottom) d Hourly measurements at four locations (two in lower estuary, one in mid-estuary, and one in upper estuary) at two depths (0.5 m below surface and 0.5 m above bottom)
Key: Sampling Method T – Thermistor
P – Probe or data sonde
G – Grab sample
Sampling Frequency Codes VP – vertical profile at stated sampling frequency
H – hourly measurements by sondes (in some instances sub-hourly data may be desired) D – Discrete sample
HP - Hourly measurements in a profile
M – monthly sampling, excluding January
M/S – monthly sampling, seasonally from May through October
M/BM – Bi-monthly sampling May - October and monthly sampling the remainder of the year
M2/BM2 – Bi-monthly sampling June-September and monthly the remainder of the year M- = Monthly Sampling with exception of December, January and February
M2/BM2** – Bi-monthly sampling June-September and monthly the remainder of the year and consider adding May and October to go to M/BM
BM/S –Bimonthly sampling July-Oct
S2 – monthly sampling July - Oct
* - Not sampled This parameter is covered M/S by Tribal WQ Workgroup
6
KHSA 2014 Annual Report
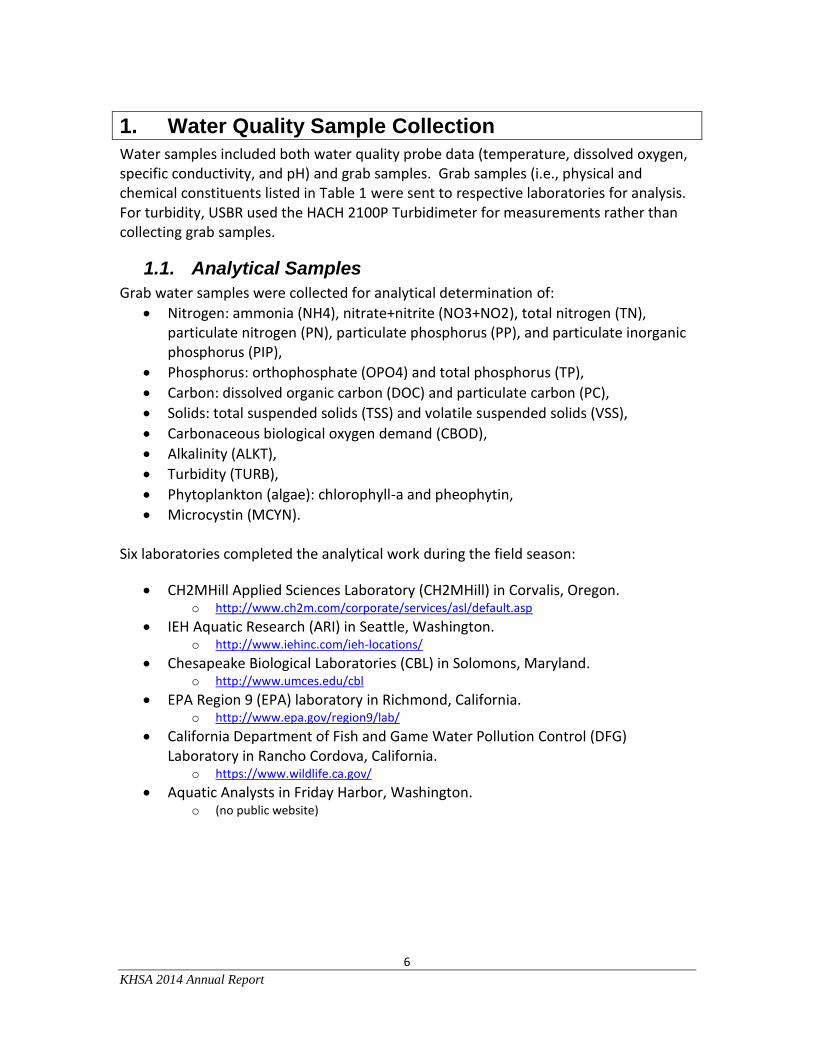
1. Water Quality Sample Collection
Water samples included both water quality probe data (temperature, dissolved oxygen, specific conductivity, and pH) and grab samples. Grab samples (i.e., physical and chemical constituents listed in Table 1 were sent to respective laboratories for analysis. For turbidity, USBR used the HACH 2100P Turbidimeter for measurements rather than collecting grab samples.
1.1. Analytical Samples
Grab water samples were collected for analytical determination of:
Nitrogen: ammonia (NH4), nitrate+nitrite (NO3+NO2), total nitrogen (TN), particulate nitrogen (PN), particulate phosphorus (PP), and particulate inorganic phosphorus (PIP),
Phosphorus: orthophosphate (OPO4) and total phosphorus (TP),
Carbon: dissolved organic carbon (DOC) and particulate carbon (PC),
Solids: total suspended solids (TSS) and volatile suspended solids (VSS),
Carbonaceous biological oxygen demand (CBOD),
Alkalinity (ALKT),
Turbidity (TURB),
Phytoplankton (algae): chlorophyll-a and pheophytin,
Microcystin (MCYN). Six laboratories completed the analytical work during the field season:
CH2MHill Applied Sciences Laboratory (CH2MHill) in Corvalis, Oregon. o http://www.ch2m.com/corporate/services/asl/default.asp
IEH Aquatic Research (ARI) in Seattle, Washington. o http://www.iehinc.com/ieh-locations/
Chesapeake Biological Laboratories (CBL) in Solomons, Maryland. o http://www.umces.edu/cbl
EPA Region 9 (EPA) laboratory in Richmond, California. o http://www.epa.gov/region9/lab/
California Department of Fish and Game Water Pollution Control (DFG) Laboratory in Rancho Cordova, California.
o https://www.wildlife.ca.gov/
Aquatic Analysts in Friday Harbor, Washington. o (no public website)
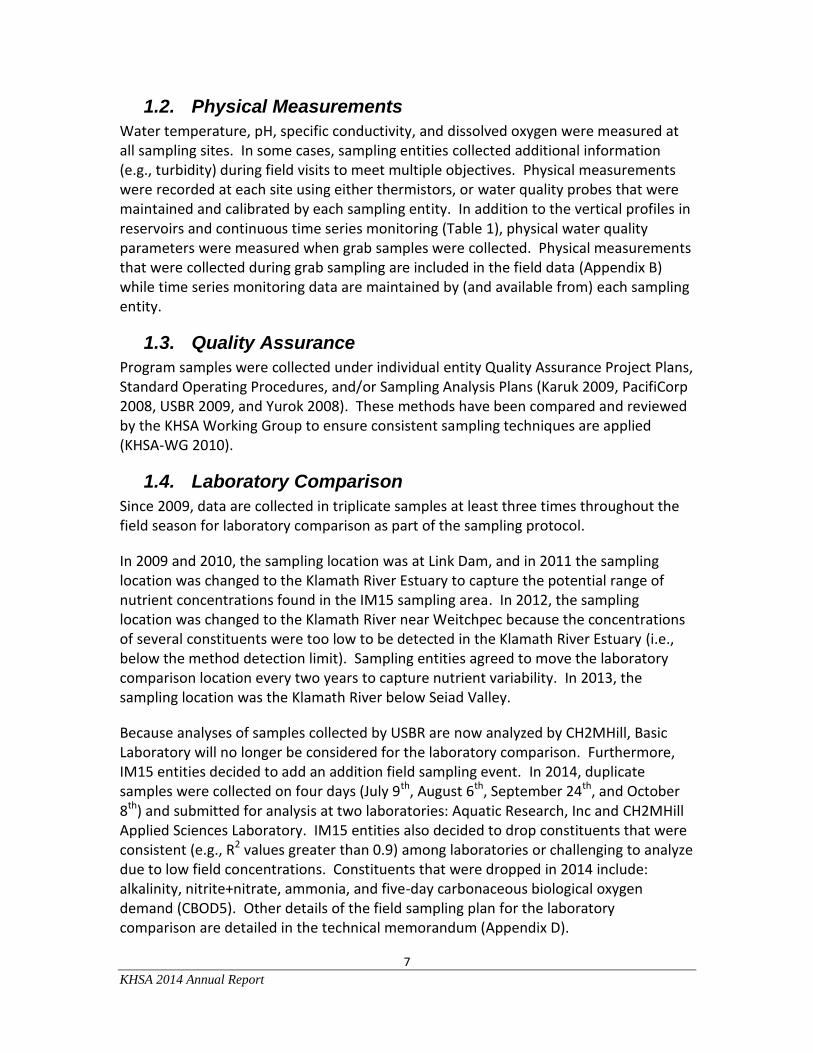
Water temperature, pH, specific conductivity, and dissolved oxygen were measured at all sampling sites. In some cases, sampling entities collected additional information (e.g., turbidity) during field visits to meet multiple objectives. Physical measurements were recorded at each site using either thermistors, or water quality probes that were maintained and calibrated by each sampling entity. In addition to the vertical profiles in reservoirs and continuous time series monitoring (Table 1), physical water quality parameters were measured when grab samples were collected. Physical measurements that were collected during grab sampling are included in the field data (Appendix B) while time series monitoring data are maintained by (and available from) each sampling entity.
1.3. Quality Assurance
Program samples were collected under individual entity Quality Assurance Project Plans, Standard Operating Procedures, and/or Sampling Analysis Plans (Karuk 2009, PacifiCorp 2008, USBR 2009, and Yurok 2008). These methods have been compared and reviewed by the KHSA Working Group to ensure consistent sampling techniques are applied (KHSA-WG 2010).
1.4. Laboratory Comparison
Since 2009, data are collected in triplicate samples at least three times throughout the field season for laboratory comparison as part of the sampling protocol.
In 2009 and 2010, the sampling location was at Link Dam, and in 2011 the sampling location was changed to the Klamath River Estuary to capture the potential range of nutrient concentrations found in the IM15 sampling area. In 2012, the sampling location was changed to the Klamath River near Weitchpec because the concentrations of several constituents were too low to be detected in the Klamath River Estuary (i.e., below the method detection limit). Sampling entities agreed to move the laboratory comparison location every two years to capture nutrient variability. In 2013, the sampling location was the Klamath River below Seiad Valley.
Because analyses of samples collected by USBR are now analyzed by CH2MHill, Basic Laboratory will no longer be considered for the laboratory comparison. Furthermore, IM15 entities decided to add an addition field sampling event. In 2014, duplicate samples were collected on four days (July 9th, August 6th, September 24th, and October 8th) and submitted for analysis at two laboratories: Aquatic Research, Inc and CH2MHill Applied Sciences Laboratory. IM15 entities also decided to drop constituents that were consistent (e.g., R2 values greater than 0.9) among laboratories or challenging to analyze due to low field concentrations. Constituents that were dropped in 2014 include: alkalinity, nitrite+nitrate, ammonia, and five-day carbonaceous biological oxygen demand (CBOD5). Other details of the field sampling plan for the laboratory comparison are detailed in the technical memorandum (Appendix D).
8
KHSA 2014 Annual Report
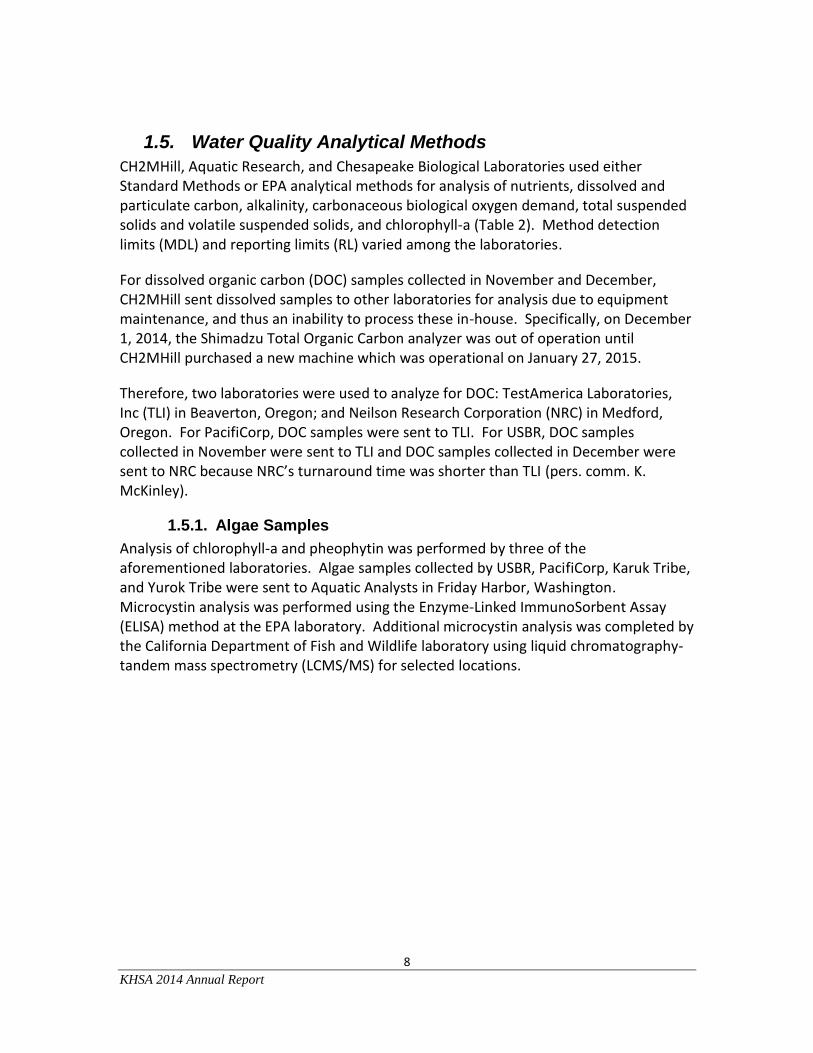
1.5. Water Quality Analytical Methods
CH2MHill, Aquatic Research, and Chesapeake Biological Laboratories used either Standard Methods or EPA analytical methods for analysis of nutrients, dissolved and particulate carbon, alkalinity, carbonaceous biological oxygen demand, total suspended solids and volatile suspended solids, and chlorophyll-a (Table 2). Method detection limits (MDL) and reporting limits (RL) varied among the laboratories.
For dissolved organic carbon (DOC) samples collected in November and December, CH2MHill sent dissolved samples to other laboratories for analysis due to equipment maintenance, and thus an inability to process these in-house. Specifically, on December 1, 2014, the Shimadzu Total Organic Carbon analyzer was out of operation until CH2MHill purchased a new machine which was operational on January 27, 2015.
Therefore, two laboratories were used to analyze for DOC: TestAmerica Laboratories, Inc (TLI) in Beaverton, Oregon; and Neilson Research Corporation (NRC) in Medford, Oregon. For PacifiCorp, DOC samples were sent to TLI. For USBR, DOC samples collected in November were sent to TLI and DOC samples collected in December were sent to NRC because NRC’s turnaround time was shorter than TLI (pers. comm. K. McKinley).
1.5.1. Algae Samples
Analysis of chlorophyll-a and pheophytin was performed by three of the aforementioned laboratories. Algae samples collected by USBR, PacifiCorp, Karuk Tribe, and Yurok Tribe were sent to Aquatic Analysts in Friday Harbor, Washington. Microcystin analysis was performed using the Enzyme-Linked ImmunoSorbent Assay (ELISA) method at the EPA laboratory. Additional microcystin analysis was completed by the California Department of Fish and Wildlife laboratory using liquid chromatography-tandem mass spectrometry (LCMS/MS) for selected locations.
9
KHSA 2014 Annual Report
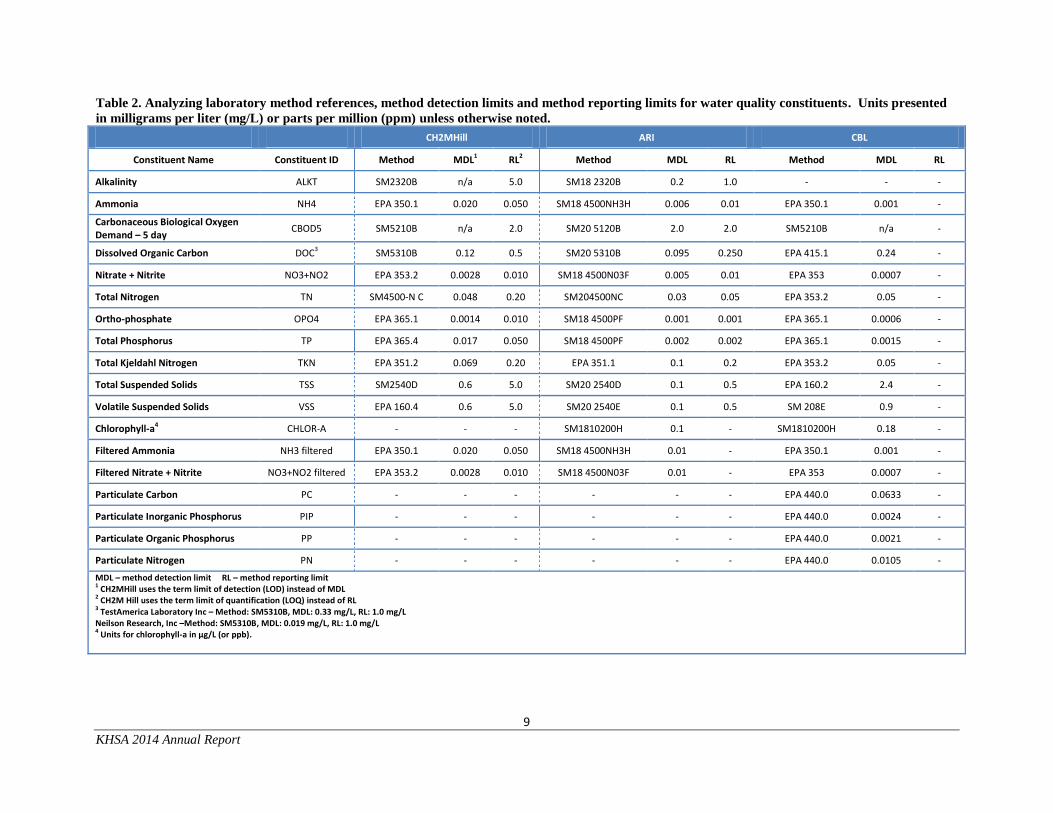
Table 2. Analyzing laboratory method references, method detection limits and method reporting limits for water quality constituents. Units presented
in milligrams per liter (mg/L) or parts per million (ppm) unless otherwise noted.
CH2MHill ARI CBL
Constituent Name Constituent ID Method MDL1 RL2 Method MDL RL Method MDL RL
MDL – method detection limit RL – method reporting limit 1 CH2MHill uses the term limit of detection (LOD) instead of MDL 2 CH2M Hill uses the term limit of quantification (LOQ) instead of RL
Water quality samples for the 2014 IM15 baseline water quality monitoring program were collected from February through December. Sampling crews from the various entities collected samples within a few days of each other. Sampling on the same day throughout the basin was infeasible due to other obligations, shipping constraints, travel considerations, and other factors. In most cases all twenty-four sites were sampled each month. There were periods when one or more sites were omitted or one or more constituents were not sampled. The data is summarized in the appendices.
2.1. Data Summary
Physical measurements collected included water temperature, pH, specific conductivity, and dissolved oxygen. Chemical and biological water quality measurements include two types of algae related estimates (chlorophyll-a and pheophytin), alkalinity, two forms of carbon (dissolved organic and particulate), carbonaceous biological oxygen demand, four forms of nitrogen (ammonia, nitrate+nitrite, total nitrogen, and particulate nitrogen), two forms of phosphorus (orthophosphate and total phosphorus), total suspended solids, and volatile suspended solids, and microcystin.
Data are summarized herein to illustrate general spatial and temporal patterns during the 2014 sampling period. Data are presented in three formats: (1) longitudinal boxplots4 based on seasonal grab sample data, (2) physical water quality sonde data (hourly) at specific locations, and (3) charts and bar graphs representing the types of algae and respective biovolumes at the sampling locations. The first two formats are presented in the main report; the third format is presented in Appendix C. The mainstem sites and major tributaries (Shasta, Scott, Salmon, and Trinity Rivers) are graphed separately. Constituents presented include: dissolved oxygen, dissolved organic carbon, total nitrogen, total phosphorus, and microcystin.
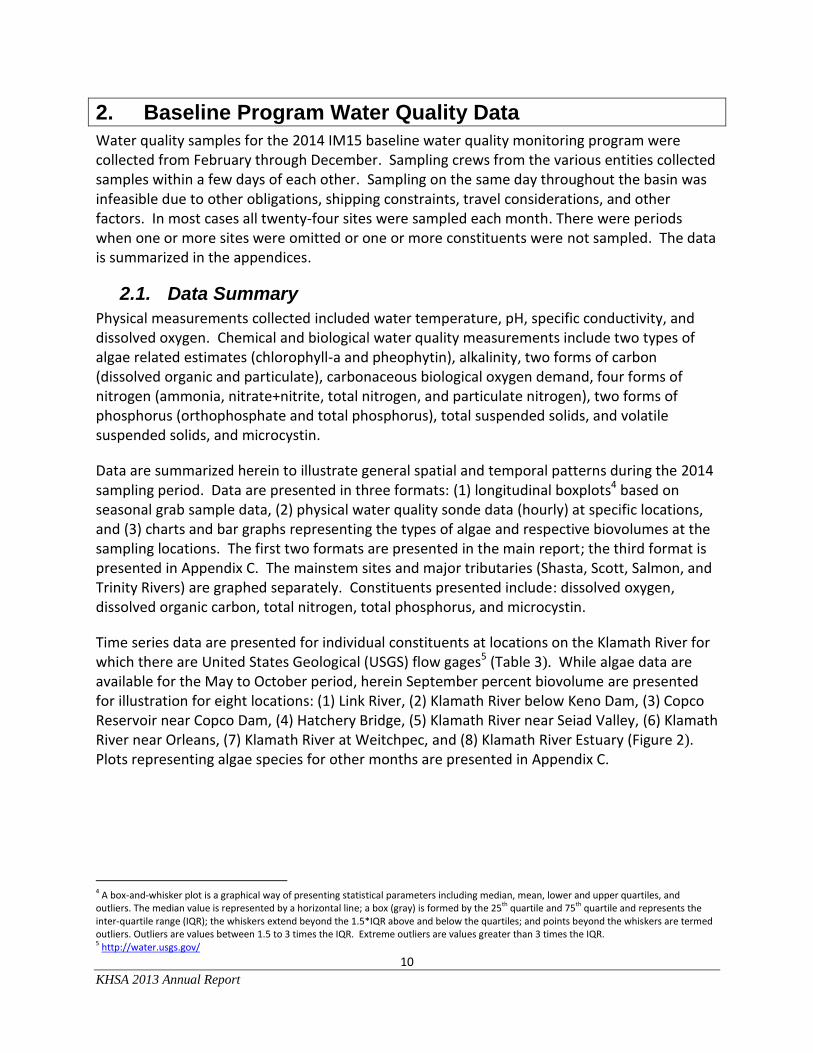
Time series data are presented for individual constituents at locations on the Klamath River for which there are United States Geological (USGS) flow gages5 (Table 3). While algae data are available for the May to October period, herein September percent biovolume are presented for illustration for eight locations: (1) Link River, (2) Klamath River below Keno Dam, (3) Copco Reservoir near Copco Dam, (4) Hatchery Bridge, (5) Klamath River near Seiad Valley, (6) Klamath River near Orleans, (7) Klamath River at Weitchpec, and (8) Klamath River Estuary (Figure 2). Plots representing algae species for other months are presented in Appendix C.
4 A box-and-whisker plot is a graphical way of presenting statistical parameters including median, mean, lower and upper quartiles, and outliers. The median value is represented by a horizontal line; a box (gray) is formed by the 25th quartile and 75th quartile and represents the inter-quartile range (IQR); the whiskers extend beyond the 1.5*IQR above and below the quartiles; and points beyond the whiskers are termed outliers. Outliers are values between 1.5 to 3 times the IQR. Extreme outliers are values greater than 3 times the IQR. 5 http://water.usgs.gov/
Figure 2. Phytoplankton species percent biovolume for the eight locations in the Klamath River: September
2014.
92.5%
3.9% 3.4%
Copco Reservoir(9/23/14)
Bluegreen
Chrysophyte
Cryptophyte
Diatom
Dinof lagellate
Green
43.1%
56.9%
KR below IG Dam(9/8/14)
Bluegreen
Chrysophyte
Cryptophyte
Diatom
Dinof lagellate
Green
3.5%
96.5%
KR at Seiad Valley(9/10/14)
Bluegreen
Chrysophyte
Cryptophyte
Diatom
Dinof lagellate
Green
4.5%
94.4%
1.1%
KR at Orleans(9/10/14)
Bluegreen
Chrysophyte
Cryptophyte
Diatom
Dinof lagellate
Green
0.8%
96.4%
2.7%
KR at Weitchpec(9/10/14)
Bluegreen
Chrysophyte
Cryptophyte
Diatom
Dinof lagellate
Green
12.5%
25.2%
39.4%
17.1%
5.8%
KR at Estuary(9/9/14)
Bluegreen
Chrysophyte
Cryptophyte
Diatom
Dinof lagellate
Green
95.1%
0.8% 4.1%
Link Dam(9/23/14)
Bluegreen
Chrysophyte
Cryptophyte
Diatom
Dinof lagellate
Green
43.6%
1.2%1.6%
39.6%
12.1%
KR below Keno(9/9/14)
Bluegreen
Chrysophyte
Cryptophyte
Diatom
Dinof lagellate
Green
12
KHSA 2014 Annual Report
Table 3. United States Geological Survey (USGS) flow gage locations for time series data. River mile and
gage number presented.
Location River Mile (RM)
(approximate)
USGS Gage Number
Link River at Klamath Falls, OR 254 11507500
Klamath River at Keno, OR 232 11509500
Klamath River below Iron Gate Dam, CA 190 11516530
Klamath River near Seiad Valley, CA 129 11520500
Klamath River at Orleans, CA 59 11523000
Klamath River near Klamath, CA 8 11530500
Grab sample data and the associated physical water quality measurements (e.g., water temperature and dissolved oxygen) are presented in the figures listed in Table 4. These illustrations are not intended to be comprehensive, but rather to present general conditions throughout the Klamath River during the sampling season. The complete data set is available on the KBMP website (http://www.kbmp.net/). The laboratory comparison technical memorandum is presented in Appendix D. Table 4. List of figures, data type, and data description. Note: KR = Klamath River
Figure Data Type Constituents and Locations
Figure 3 Box plot Dissolved oxygen, dissolved organic carbon, total nitrogen, total phosphorus for the Shasta, Scott, Salmon, and Trinity Rivers
Figure 4 Box plot Dissolved oxygen readings in the KR from Link River to the KR Estuary
Figure 5 Box plot Dissolved organic carbon sample results in the KR from Link River to the KR Estuary
Figure 6 Box plot Total nitrogen sample results in the KR from Link River to the KR Estuary
Figure 7 Box plot Total phosphorus sample results in the KR from Link River to the KR Estuary
Figure 8 Box plot Microcystin sample results in the KR from Link River to the KR Estuary
Figure 9 Time series Water temperature, dissolved oxygen, and pH data at major tributary locations: Shasta River, Scott River, Salmon River, and Trinity River.
Figure 10 Time series Water temperature, dissolved oxygen, and pH data at mainstem locations: Link Dam, KR above Keno Dam, and KR below Iron Gate Dam.
Figure 11 Time series Water temperature, dissolved oxygen, and pH data at mainstem locations: KR near Seiad Valley, KR at Weitchpec, and KR below the Trinity River.
Figure 12 Time series Water Temperature readings and daily flow at USGS flow gage locations for the KR.
Figure 13 Time series Dissolved oxygen readings and daily flow at USGS flow gage locations for the KR.
Figure 14 Time series Dissolved organic carbon and daily flow at USGS flow gage locations for the KR.
Figure 15 Time series Nitrogen and daily flow at USGS flow gage locations for the KR.
Figure 16 Time series Phosphorus and daily flow at USGS flow gage locations for the KR.
Figure 17 Time series Microcystin and daily flow at USGS flow gage locations for the KR.
Figure 9. Continuous water temperature, dissolved oxygen, pH, specific conductance data (2014) for the
Shasta River, Scott River, Salmon River, and Trinity River.
0
5
10
15
20
25
30
35
J F M A M J J A S O N D
Wate
r Tem
pera
ture
(C
els
ius) 2014Shasta River
Scott River
Salmon River
Trinity River
0
4
8
12
16
20
24
J F M A M J J A S O N D
Dis
so
lved
Oxyg
en (m
g/l)
2014Shasta River
Scott River
Salmon River
Trinity River
6
7
8
9
10
11
12
J F M A M J J A S O N D
pH
(unitle
ss)
2014Shasta River
Scott River
Salmon River
Trinity River
0
100
200
300
400
500
600
700
J F M A M J J A S O N D
Sp
ecif
ic C
ond
ucta
nce (μS
/cm
) 2014Shasta River
Scott River
Salmon River
Trinity River
18
KHSA 2014 Annual Report
2.1.4. Mainstem Locations (Time Series)
Figure 10. Continuous water temperature, dissolved oxygen, pH, specific conductance data (2014) for the
upper Klamath River at Link Dam and Klamath River above Keno Dam (surface).
0
5
10
15
20
25
30
J F M A M J J A S O N D
Wate
r Tem
pera
ture
(C
els
ius) 2014RM254.4 - Link Dam
RM234.9 - KR above Keno Dam
0
4
8
12
16
20
J F M A M J J A S O N D
Dis
so
lved
Oxyg
en (m
g/l)
2014RM254.4 - Link DamRM234.9 - KR above Keno Dam
6
7
8
9
10
11
12
J F M A M J J A S O N D
pH
(unitle
ss)
2014RM254.4 - Link Dam
RM234.9 - KR above Keno Dam
0
50
100
150
200
250
300
J F M A M J J A S O N D
Sp
ecif
ic C
ond
ucta
nce (S
/cm
)
2014RM254.4 - Link Dam
RM234.9 - KR above Keno Dam
19
KHSA 2014 Annual Report
Figure 11. Continuous water temperature, dissolved oxygen, pH, specific conductance data (2014) for the
lower Klamath River at Klamath River below Iron Gate Dam, Klamath River near Seiad Valley, Klamath
River at Weitchpec, and Klamath River above Turwar.
0
5
10
15
20
25
30
J F M A M J J A S O N D
Wate
r Tem
pera
ture
(C
els
ius) 2014RM189.7 - KR below Iron Gate Dam
RM128.5 - KR at Seiad Valley
RM043.5 - KR at Weitchpec
RM008.0 - KR above Turwar
0
4
8
12
16
20
J F M A M J J A S O N D
Dis
so
lved
Oxyg
en (m
g/l)
2014RM189.7 - KR below Iron Gate DamRM128.5 - KR at Seiad ValleyRM043.5 - KR at WeitchpecRM008.0 - KR above Turwar
6
7
8
9
10
11
12
J F M A M J J A S O N D
pH
(unitle
ss)
2014RM189.7 - KR below Iron Gate DamRM128.5 - KR at Seiad ValleyRM043.5 - KR at WeitchpecRM008.0 - KR above Turwar
0
50
100
150
200
250
300
J F M A M J J A S O N D
Sp
ecif
ic C
ond
ucta
nce (
μS/
cm) 2014RM189.7 - KR below Iron Gate Dam
RM128.5 - KR at Seiad Valley
RM043.5 - KR at Weitchpec
RM008.0 - KR above Turwar
20
KHSA 2014 Annual Report
Figure 12. Water temperature (Tw) and daily flow at USGS flow gage locations for the mainstem Klamath and Link Rivers. Note the scale change for the secondary y-
axis at Orleans and near Klamath mouth.
0
3000
6000
9000
12000
15000
0
5
10
15
20
25
30
J F M A M J J A S O N D
Flo
w (cfs
)
Wate
r T
em
pera
ture
, C
Link River at Klamath Falls (RM 254.4)Tw
Flow (cfs)
0
30000
60000
90000
120000
150000
0
5
10
15
20
25
30
J F M A M J J A S O N D
Flo
w (cfs
)
Wate
r T
em
pera
ture
, C
KR at Orleans (RM 59.1)Tw
Flow (cfs)Note: Scale change
0
3000
6000
9000
12000
15000
0
5
10
15
20
25
30
J F M A M J J A S O N D
Flo
w (cfs
)
Wate
r T
em
pera
ture
, C
KR below Iron Gate Dam (RM 189.7)Tw
Flow (cfs)
0
3000
6000
9000
12000
15000
0
5
10
15
20
25
30
J F M A M J J A S O N D
Flo
w (cfs
)
Wate
r T
em
pera
ture
, C
KR at Keno (RM 233.0)Tw
Flow (cfs)
0
3000
6000
9000
12000
15000
0
5
10
15
20
25
30
J F M A M J J A S O N D
Flo
w (cfs
)
Wate
r T
em
pera
ture
, C
KR near Seiad Valley (RM 128.5)Tw
Flow (cfs)
0
30000
60000
90000
120000
150000
0
5
10
15
20
25
30
J F M A M J J A S O N D
Flo
w (cfs
)
Wate
r T
em
pera
ture
, C
KR near Klamath (RM 6.0)Tw
Flow (cfs)Note: Scale change
21
KHSA 2014 Annual Report
Figure 13. Dissolved oxygen (DO) and daily flow at USGS flow gage locations for the mainstem Klamath and Link Rivers. Note the scale change for the secondary y-axis
at Orleans and near Klamath mouth.
0
3000
6000
9000
12000
15000
0
2
4
6
8
10
12
14
16
18
J F M A M J J A S O N D
Flo
w (cfs
)
DO
, mg
/l
KR near Seiad Valley (RM 128.5)DO
Flow (cfs)
0
3000
6000
9000
12000
15000
0
2
4
6
8
10
12
14
16
18
J F M A M J J A S O N D
Flo
w (cfs
)
DO
, mg
/l
KR at Keno (RM 233.0)DO
Flow (cfs)
0
3000
6000
9000
12000
15000
0
2
4
6
8
10
12
14
16
18
J F M A M J J A S O N D
Flo
w (cfs
)
DO
, mg
/l
Link River at Klamath Falls (RM 254.4)DO
Flow (cfs)
0
30000
60000
90000
120000
150000
0
2
4
6
8
10
12
14
16
18
J F M A M J J A S O N D
Flo
w (cfs
)
DO
, mg
/l
KR near Klamath (RM 6.0)DO
Flow (cfs)Note: Scale change
0
30000
60000
90000
120000
150000
0
2
4
6
8
10
12
14
16
18
J F M A M J J A S O N D
Flo
w (cfs
)
DO
, mg
/l
KR at Orleans (RM 59.1)DO
Flow (cfs)Note: Scale change
0
3000
6000
9000
12000
15000
0
2
4
6
8
10
12
14
16
18
J F M A M J J A S O N D
Flo
w (cfs
)
DO
, mg
/l
KR below Iron Gate Dam (RM 189.7) DO
Flow (cfs)
22
KHSA 2014 Annual Report
Figure 14. Dissolved organic carbon (DOC) and daily flow at USGS flow gage locations for the mainstem Klamath and Link Rivers. Note the scale change for the
secondary y-axis at Orleans and near Klamath mouth.
0
3000
6000
9000
12000
15000
0
2
4
6
8
10
12
14
16
18
J F M A M J J A S O N D
Flo
w (cfs
)
DO
C, m
g/l
Link River at Klamath Falls (RM 254.4)DOC
Flow (cfs)
0
3000
6000
9000
12000
15000
0
2
4
6
8
10
12
14
16
18
J F M A M J J A S O N D
Flo
w (cfs
)
DO
C, m
g/l
KR below Iron Gate Dam (RM 189.7)DOC
Flow (cfs)
0
30000
60000
90000
120000
150000
0
2
4
6
8
10
12
14
16
18
J F M A M J J A S O N D
Flo
w (cfs
)
DO
C, m
g/l
KR at Orleans (RM 59.1)DOC
Flow (cfs)Note: Scale change
0
3000
6000
9000
12000
15000
0
2
4
6
8
10
12
14
16
18
J F M A M J J A S O N D
Flo
w (cfs
)
DO
C, m
g/l
KR at Keno (RM 233.0)DOC
Flow (cfs)
0
3000
6000
9000
12000
15000
0
2
4
6
8
10
12
14
16
18
J F M A M J J A S O N D
Flo
w (cfs
)
DO
C, m
g/l
KR near Seiad Valley (RM 128.5)DOC
Flow (cfs)
0
30000
60000
90000
120000
150000
0
2
4
6
8
10
12
14
16
18
J F M A M J J A S O N D
Flo
w (cfs
)
DO
C, m
g/l
KR near Klamath (RM 6.0)DOC
Flow (cfs)Note: Scale change
23
KHSA 2014 Annual Report
Figure 15. Total nitrogen (NTOT) and daily flow at USGS flow gage locations for the mainstem Klamath and Link Rivers. Note the scale change for the secondary y-axis
at Orleans and near Klamath mouth.
0
3000
6000
9000
12000
15000
0.0
1.0
2.0
3.0
4.0
J F M A M J J A S O N D
Flo
w (cfs
)
NT
OT
, mg
/lLink River at Klamath Falls (RM 254.4)NTOT
Flow (cfs)
0
3000
6000
9000
12000
15000
0.0
1.0
2.0
3.0
4.0
J F M A M J J A S O N D
Flo
w (cfs
)
NT
OT
, mg
/l
KR below Iron Gate Dam (RM 189.7)NTOT
Flow (cfs)
0
30000
60000
90000
120000
150000
0.0
1.0
2.0
3.0
4.0
J F M A M J J A S O N D
Flo
w (cfs
)
NT
OT
, mg
/l
KR at Orleans (RM 59.1)NTOT
Flow (cfs)Note: Scale change
0
30000
60000
90000
120000
150000
0.0
1.0
2.0
3.0
4.0
J F M A M J J A S O N D
Flo
w (cfs
)
NT
OT
, mg
/l
KR near Klamath (RM 6.0)NTOT
Flow (cfs)Note: Scale change
0
3000
6000
9000
12000
15000
0.0
1.0
2.0
3.0
4.0
J F M A M J J A S O N D
Flo
w (cfs
)
NT
OT
, mg
/l
KR near Seiad Valley (RM 128.5)NTOT
Flow (cfs)
0
3000
6000
9000
12000
15000
0.0
1.0
2.0
3.0
4.0
J F M A M J J A S O N D
Flo
w (cfs
)
NT
OT
, mg
/l
KR at Keno (RM 233.0)NTOT
Flow (cfs)
24
KHSA 2014 Annual Report
Figure 16. Total phosphorus (PTOT) and daily flow at USGS flow gage locations for the mainstem Klamath and Link Rivers. Note the scale change for the secondary y-
axis at Orleans and Klamath.
0
3000
6000
9000
12000
15000
0.00
0.10
0.20
0.30
0.40
0.50
J F M A M J J A S O N D
Flo
w (cfs
)
PT
OT
, mg
/l
KR at Keno (RM 233.0)PTOT
Flow (cfs)
0
3000
6000
9000
12000
15000
0.00
0.10
0.20
0.30
0.40
0.50
J F M A M J J A S O N D
Flo
w (cfs
)
PT
OT
, mg
/lLink River at Klamath Falls (RM 254.4)
PTOT
Flow (cfs)
0
3000
6000
9000
12000
15000
0.00
0.10
0.20
0.30
0.40
0.50
J F M A M J J A S O N D
Flo
w (cfs
)
PT
OT
, mg
/l
KR near Seiad Valley (RM 128.5)PTOT
Flow (cfs)
0
3000
6000
9000
12000
15000
0.00
0.10
0.20
0.30
0.40
0.50
J F M A M J J A S O N D
Flo
w (cfs
)
PT
OT
, mg
/l
KR below Iron Gate Dam (RM 189.7)PTOT
Flow (cfs)
0
30000
60000
90000
120000
150000
0.00
0.10
0.20
0.30
0.40
0.50
J F M A M J J A S O N D
Flo
w (cfs
)
PT
OT
, mg
/l
KR near Klamath (RM 6.0)PTOT
Flow (cfs)Note: Scale change
0
30000
60000
90000
120000
150000
0.00
0.10
0.20
0.30
0.40
0.50
J F M A M J J A S O N D
Flo
w (cfs
)
PT
OT
, mg
/l
KR at Orleans (RM 59.1)PTOT
Flow (cfs)Note: Scale change
25
KHSA 2014 Annual Report
Figure 17. Microcystin (MCYN) and daily flow at USGS flow gage locations for the mainstem Klamath and Link Rivers. Only surface samples are taken in
consideration. Non-detect values are presented as zeros. Note the scale change for the secondary y-axis at Orleans and Klamath.
0
3000
6000
9000
12000
15000
0
2
4
6
8
10
J F M A M J J A S O N D
Flo
w (cfs
)
MC
YN
, μg
/l
Link River at Klamath Falls (RM 254.4)MCYN
Flow (cfs)
0
3000
6000
9000
12000
15000
0
2
4
6
8
10
J F M A M J J A S O N D
Flo
w (cfs
)
MC
YN
, μg
/l
KR at Keno (RM 233.0)MCYN
Flow (cfs)
0
3000
6000
9000
12000
15000
0
2
4
6
8
10
J F M A M J J A S O N D
Flo
w (cfs
)
MC
YN
, μg
/l
KR near Seiad Valley (RM 128.5)MCYN
Flow (cfs)
0
3000
6000
9000
12000
15000
0
2
4
6
8
10
J F M A M J J A S O N D
Flo
w (cfs
)
MC
YN
, μg
/l
KR below Iron Gate Dam (RM 189.7)MCYN
Flow (cfs)
0
30000
60000
90000
120000
150000
0
2
4
6
8
10
J F M A M J J A S O N D
Flo
w (cfs
)
MC
YN
, μg
/l
KR near Klamath (RM 6.0)MCYN
Flow (cfs)Note: Scale change
0
30000
60000
90000
120000
150000
0
2
4
6
8
10
J F M A M J J A S O N D
Flo
w (cfs
)
MC
YN
, μg
/l
KR at Orleans (RM 59.1)MCYN
Flow (cfs)Note: Scale change
26
KHSA 2014 Annual Report
3. Summary
The KHSA IM15 baseline water quality sampling program is an interagency cooperative effort to characterize water quality conditions in the Klamath Basin in support of ongoing and future measures pertaining to restoration, dam removal studies, public health, and other factors. The program was successfully implemented in 2010 and has been on-going. Quality assurance measures have been incorporated into the process and final data sets are available to all interested parties (http://kbmp.net/). Planning and monitoring effort has laid the groundwork for continued cooperation and quality data collection in the Klamath River basin. The 2014 KHSA Interim Measure 15 Monitoring Plan is available on the KBMP website.
Karuk Tribe (Karuk). 2009. Mid-Klamath River Nutrient, Periphyton, Phytoplankton and Algal Toxin Sampling Analysis Plan (SAP). February.
KHSA Working Group (KHSA-WG). 2010. Klamath River Baseline Sampling Program QA
Comparison. Prepared for the KHSA Water Quality Program Working Group by M. Deas, Watercourse Engineering, Inc. and K. Fetcho, Yurok Tribe Environmental Program. May 4.
PacifiCorp. 2008. Quality Assurance Project Plan. 2009 Baseline Water Quality
Monitoring by PacifiCorp, Interim Measure 12, Part 2. United States Bureau of Reclamation (USBR). 2009. Standard Operating Procedures for
Quality Assurance. Revision 2009-05. Prepared by Environmental Monitoring Branch. May.
Yurok Tribe (Yurok). 2008. Lower Klamath River Nutrient, Periphyton, Phytoplankton
and Algal Toxin Sampling Analysis Plan (SAP). June.
Personal Communications
Kathy McKinley, CH2MHill Applied Sciences Laboratory. Mar 31, 2015.
A-1
KHSA 2013 Annual Report
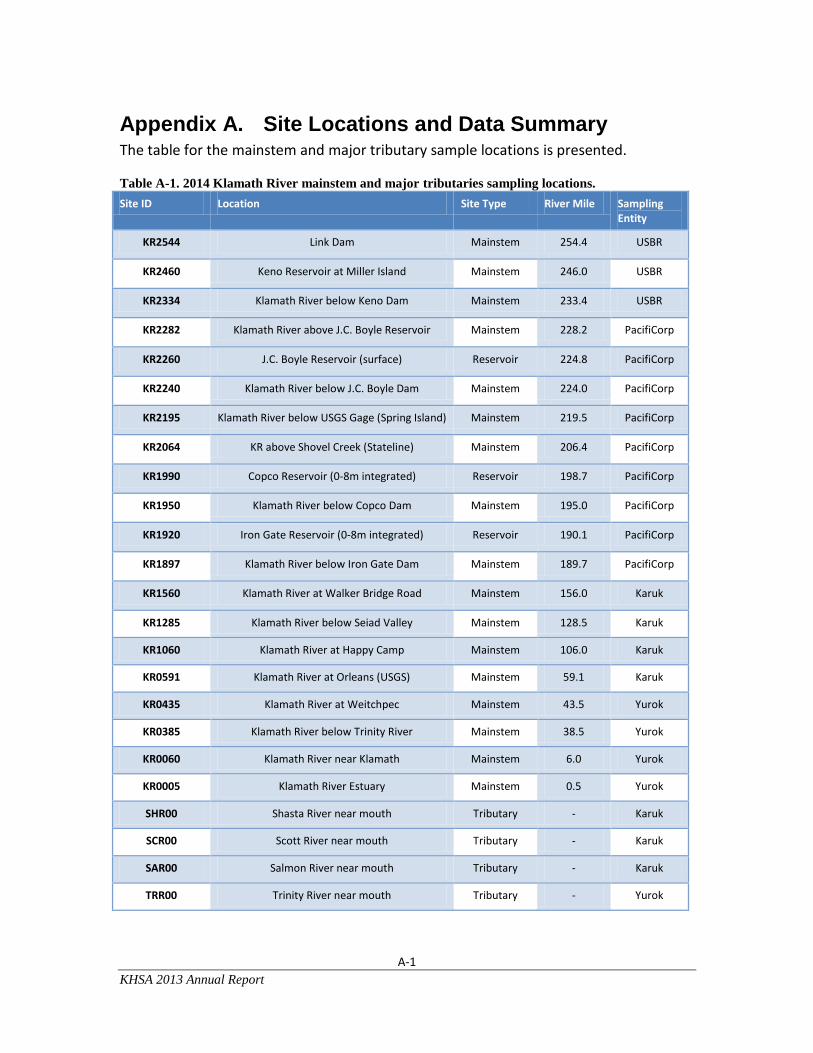
Appendix A. Site Locations and Data Summary The table for the mainstem and major tributary sample locations is presented.
Table A-1. 2014 Klamath River mainstem and major tributaries sampling locations.
Site ID Location Site Type River Mile Sampling Entity
KR2544 Link Dam Mainstem 254.4 USBR
KR2460 Keno Reservoir at Miller Island Mainstem 246.0 USBR
KR2334 Klamath River below Keno Dam Mainstem 233.4 USBR
KR2282 Klamath River above J.C. Boyle Reservoir Mainstem 228.2 PacifiCorp
KR1950 Klamath River below Copco Dam Mainstem 195.0 PacifiCorp
KR1920 Iron Gate Reservoir (0-8m integrated) Reservoir 190.1 PacifiCorp
KR1897 Klamath River below Iron Gate Dam Mainstem 189.7 PacifiCorp
KR1560 Klamath River at Walker Bridge Road Mainstem 156.0 Karuk
KR1285 Klamath River below Seiad Valley Mainstem 128.5 Karuk
KR1060 Klamath River at Happy Camp Mainstem 106.0 Karuk
KR0591 Klamath River at Orleans (USGS) Mainstem 59.1 Karuk
KR0435 Klamath River at Weitchpec Mainstem 43.5 Yurok
KR0385 Klamath River below Trinity River Mainstem 38.5 Yurok
KR0060 Klamath River near Klamath Mainstem 6.0 Yurok
KR0005 Klamath River Estuary Mainstem 0.5 Yurok
SHR00 Shasta River near mouth Tributary - Karuk
SCR00 Scott River near mouth Tributary - Karuk
SAR00 Salmon River near mouth Tributary - Karuk
TRR00 Trinity River near mouth Tributary - Yurok
B-1
KHSA 2014 Annual Report
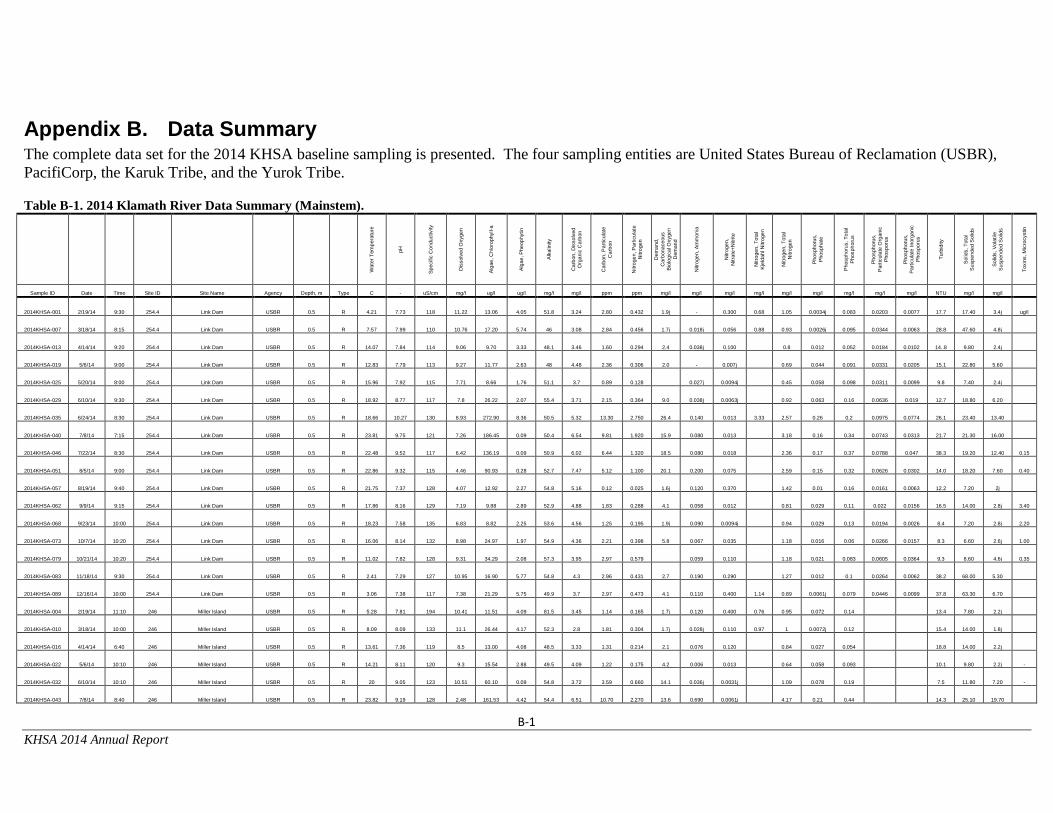
Appendix B. Data Summary The complete data set for the 2014 KHSA baseline sampling is presented. The four sampling entities are United States Bureau of Reclamation (USBR),
PacifiCorp, the Karuk Tribe, and the Yurok Tribe.
Table B-1. 2014 Klamath River Data Summary (Mainstem).
Wate
r T
em
pera
ture
pH
Specific
Con
ductivity
Dis
solv
ed O
xyge
n
Alg
ae
, C
hlo
rophyll-a
Alg
ae
, P
he
op
hytin
Alk
alin
ity
Carb
on
, D
isso
lved
Org
anic
Carb
on
Carb
on
, P
art
icula
te
Carb
on
Nitro
ge
n,
Part
icu
late
Nitro
ge
n
Dem
an
d,
Carb
on
ace
ous
Bio
logic
al O
xyge
n
Dem
an
d
Nitro
ge
n,
Am
mon
ia
Nitro
ge
n,
Nitra
te+
Nitri
te
Nitro
ge
n,
To
tal
Kje
ldah
l N
itro
ge
n
Nitro
ge
n,
To
tal
Nitro
ge
n
Phosph
oru
s,
Phosph
ate
Phosph
oru
s,
To
tal
Phosph
oru
s
Phosph
oru
s,
Part
icula
te O
rgan
ic
Phosporu
s
Phosph
oru
s,
Part
icula
te I
norg
anic
Phosporu
s
Turb
idity
Solid
s,
Tota
l
Susp
en
de
d S
olid
s
Solid
s,
Vola
tile
Susp
en
de
d S
olid
s
Toxin
s, M
icro
cystin
Sample ID Date Time Site ID Site Name Agency Depth, m Type C - uS/cm mg/l ug/l ug/l mg/l mg/l ppm ppm mg/l mg/l mg/l mg/l mg/l mg/l mg/l mg/l mg/l NTU mg/l mg/l
2014KHSA-004 2/19/14 11:10 246 Miller Island USBR 0.5 R 5.28 7.81 194 10.41 11.51 4.09 81.5 3.45 1.14 0.165 1.7j 0.120 0.400 0.76 0.95 0.072 0.14
13.4 7.80 2.2j
2014KHSA-010 3/18/14 10:00 246 Miller Island USBR 0.5 R 8.09 8.09 133 11.1 26.44 4.17 52.3 2.8 1.81 0.304 1.7j 0.028j 0.110 0.97 1 0.0072j 0.12
15.4 14.00 1.8j
2014KHSA-016 4/14/14 6:40 246 Miller Island USBR 0.5 R 13.61 7.36 119 8.5 13.00 4.08 48.5 3.33 1.31 0.214 2.1 0.076 0.120
0.84 0.027 0.054
18.8 14.00 2.2j
2014KHSA-022 5/6/14 10:10 246 Miller Island USBR 0.5 R 14.21 8.11 120 9.3 15.54 2.88 49.5 4.09 1.22 0.175 4.2 0.006 0.013
0.64 0.058 0.093
10.1 9.80 2.2j -
2014KHSA-032 6/10/14 10:10 246 Miller Island USBR 0.5 R 20 9.05 123 10.51 60.10 0.09 54.8 3.72 3.59 0.660 14.1 0.036j 0.0031j
1.09 0.078 0.19
7.5 11.80 7.20 -
2014KHSA-043 7/8/14 8:40 246 Miller Island USBR 0.5 R 23.82 9.19 128 2.48 161.53 4.42 54.4 6.51 10.70 2.270 13.6 0.690 0.0061j
4.17 0.21 0.44
14.3 25.10 19.70
B-2
KHSA 2014 Annual Report
Wate
r T
em
pera
ture
pH
Specific
Con
ductivity
Dis
solv
ed O
xyge
n
Alg
ae
, C
hlo
rophyll-
a
Alg
ae
, P
he
op
hytin
Alk
alin
ity
Carb
on
, D
isso
lved
Org
anic
Carb
on
Carb
on
, P
art
icula
te
Carb
on
Nitro
ge
n,
Part
icu
late
Nitro
ge
n
Dem
an
d,
Carb
on
ace
ous
Bio
logic
al O
xyge
n
Dem
an
d
Nitro
ge
n,
Am
mon
ia
Nitro
ge
n,
Nitra
te+
Nitri
te
Nitro
ge
n,
To
tal
Kje
ldah
l N
itro
ge
n
Nitro
ge
n,
To
tal
Nitro
ge
n
Phosph
oru
s,
Phosph
ate
Phosph
oru
s,
To
tal
Phosph
oru
s
Phosph
oru
s,
Part
icula
te O
rgan
ic
Phosporu
s
Phosph
oru
s,
Part
icula
te I
norg
anic
Phosporu
s
Turb
idity
Solid
s,
Tota
l
Susp
en
de
d S
olid
s
Solid
s,
Vola
tile
Susp
en
de
d S
olid
s
Toxin
s, M
icro
cystin
Sample ID Date Time Site ID Site Name Agency Depth, m Type C - uS/cm mg/l ug/l ug/l mg/l mg/l ppm ppm mg/l mg/l mg/l mg/l mg/l mg/l mg/l mg/l mg/l NTU mg/l mg/l
2014KHSA-054 8/5/14 7:00 246 Miller Island USBR 0.5 R 23.35 8.59 138 2.78 24.20 5.49 58.3 7.97 5.72 1.310 9.3 1.480 0.010
4 0.23 0.53
11.8 12.00 8.00 0.32
2014KHSA-065 9/9/14 10:40 246 Miller Island USBR 0.5 R 19.51 7.39 133 5.65 27.47 6.57 53.4 5.13 2.40 0.416 3.0 0.033j 0.086
0.98 0.015 0.1
15.7 13.40 4j 6.30
2014KHSA-076 10/7/14 11:55 246 Miller Island USBR 0.5 R 16.85 8.57 154 11.45 35.89 10.31 59.2 4.79 3.21 0.536 6.3 0.02j 0.0035j
1.16 0.0027j 0.05
8.1 10.00 5.00 1.10
2014KHSA-086 11/18/14 11:40 246 Miller Island USBR 0.5 R 4.2 7.08 140 8.76 11.95 4.53 56.7 5.1 1.76 0.272 1.9 0.260 0.400
1.39 0.026 0.092
26.8 31.70 2.8j
2014KHSA-092 12/16/14 12:10 246 Miller Island USBR 0.5 R 4.06 7.54 198 10.12 25.99 6.45 79.3 3.67 1.96 0.321 2.4 0.180 0.460 1.1 1.22 0.04 0.093
Sample ID Date Time Site ID Site Name Agency Depth, m Type C - uS/cm mg/l ug/l ug/l mg/l mg/l ppm ppm mg/l mg/l mg/l mg/l mg/l mg/l mg/l mg/l mg/l NTU mg/l mg/l
Sample ID Date Time Site ID Site Name Agency Depth, m Type C - uS/cm mg/l ug/l ug/l mg/l mg/l ppm ppm mg/l mg/l mg/l mg/l mg/l mg/l mg/l mg/l mg/l NTU mg/l mg/l
KR14069 5/13/14 12:35 KR206.4 Abv Shovel creek PacifiCorp 0.5 R
KR14073 5/20/14 16:15 KR199.0 Copco 1.0 m from bottom PacifiCorp 29 R
63.1 2.8
0.050 0.540
0.89 0.13 0.11
4.8j 1.6j
KR14072 5/20/14 16:30 KR199.0 Copco Thermocline PacifiCorp 14 R
0.86 0.89 61.4 3.03 0.819 0.084
0.047j 0.340
0.69 0.099 0.1
4j 0.2j
KR14094 6/9/14 12:50 KR199.0 Copco 0.5 m grab PacifiCorp 0.5 R
0.53 0.71 61.7 3.40 0.184 0.022 9.4 0.015j 0.003
0.480 0.095 0.140
2.6j 1.8j 0.15
KR14096 6/9/14 13:15 KR199.0 Copco 1.0 m from bottom PacifiCorp 30 R
64.5 2.92
0.080 0.490
0.900 0.120 0.140
4j 1.4j
KR14095 6/9/14 13:30 KR199.0 Copco Thermocline PacifiCorp 14 R
61.8 3.02
3.4 0.037j 0.200
0.530 0.120 0.150
1j - -
KR14117 7/9/14 13:30 KR199.0 Copco 0.5 m grab PacifiCorp 0.5 R
1.54 0.65 57.8 3.98 0.584 0.084
0.027j 0.590
1.440 0.160 0.160
0.6j 0.4j 0.28
KR14118 7/9/14 14:05 KR199.0 Copco Thermocline PacifiCorp 15 R
0.58 0.79 62.5 3.78 0.244 0.042
- 0.390
0.840 0.160 0.160
0.6j 0.6j -
KR14119 7/9/14 14:15 KR199.0 Copco 1.0 m from bottom PacifiCorp 28 R
0.47 0.79 66.9 3.34 0.36 0.057
0.180 0.350
0.950 0.210 0.210
3.6j 1j
B-5
KHSA 2014 Annual Report
Wate
r T
em
pera
ture
pH
Specific
Con
ductivity
Dis
solv
ed O
xyge
n
Alg
ae
, C
hlo
rophyll-
a
Alg
ae
, P
he
op
hytin
Alk
alin
ity
Carb
on
, D
isso
lved
Org
anic
Carb
on
Carb
on
, P
art
icula
te
Carb
on
Nitro
ge
n,
Part
icu
late
Nitro
ge
n
Dem
an
d,
Carb
on
ace
ous
Bio
logic
al O
xyge
n
Dem
an
d
Nitro
ge
n,
Am
mon
ia
Nitro
ge
n,
Nitra
te+
Nitri
te
Nitro
ge
n,
To
tal
Kje
ldah
l N
itro
ge
n
Nitro
ge
n,
To
tal
Nitro
ge
n
Phosph
oru
s,
Phosph
ate
Phosph
oru
s,
To
tal
Phosph
oru
s
Phosph
oru
s,
Part
icula
te O
rgan
ic
Phosporu
s
Phosph
oru
s,
Part
icula
te I
norg
anic
Phosporu
s
Turb
idity
Solid
s,
Tota
l
Susp
en
de
d S
olid
s
Solid
s,
Vola
tile
Susp
en
de
d S
olid
s
Toxin
s, M
icro
cystin
Sample ID Date Time Site ID Site Name Agency Depth, m Type C - uS/cm mg/l ug/l ug/l mg/l mg/l ppm ppm mg/l mg/l mg/l mg/l mg/l mg/l mg/l mg/l mg/l NTU mg/l mg/l
KR14140 8/13/14 12:40 KR199.0 Copco 0.5 m grab PacifiCorp 0.5 R
30.40 1.39 64.6 9.71 3.22 0.446
- 0.005
1.770 0.150 0.230
8.20 5.80 0.52
KR14142 8/13/14 13:00 KR199.0 Copco 1.0 m from bottom PacifiCorp
KR14015 2/18/14 13:10 KR19019 Iron Gate 0.5 m grab PacifiCorp 0.5 R 5.62 8.06 170 10.59 0.66 0.68 66.1 2.50 0.329 0.049
0.063 0.410
0.860 0.047 0.098
2j 1j
KR14017 2/18/14 13:25 KR19019 Iron Gate 1.0 m from bottom PacifiCorp 40 R
0.91 1.02 64.2 2.76 0.3 0.037
0.045j 0.450
0.870 0.050 0.083
1j -
KR14016 2/18/14 13:40 KR19019 Iron Gate Thermocline PacifiCorp 21 R
1.13 0.93 65.6 2.48 0.26 0.036
0.053 0.450
0.830 0.049 0.089
0.6j 1.2j
KR14035 3/18/14 12:50 KR19019 Iron Gate 0.5 m grab PacifiCorp 0.5 R 9.03 7.82 165 10.01 0.42 0.66 67.0 3.15 0.324 0.050
0.038j 0.350
0.790 0.900 0.051
0.4j 1j
KR14037 3/18/14 13:10 KR19019 Iron Gate 1.0 m from bottom PacifiCorp 45 R
0.64 1.14 68.1 2.88 0.345 0.043
0.072 0.550
1.260 0.110 0.078
1.8j 2.6j
KR14036 3/18/14 13:25 KR19019 Iron Gate Thermocline PacifiCorp 24 R
0.53 0.81 66.8 3.04 0.12 0.038
0.0044j 0.470
0.850 0.054 0.048
1.4j 0.6j
KR14055 4/8/14 15:45 KR19019 Iron Gate 0.5 m grab PacifiCorp 0.5 R 13.59 8.34 177 9.78 0.44 0.56 65.9 3.47 0.234 0.033
0.027j 0.260
0.740 0.053 0.068
3j 1.4j
KR14057 4/8/14 16:00 KR19019 Iron Gate 1.0 m from bottom PacifiCorp 44 R
64.8 3.31
0.031j 0.560
0.950 0.079 0.082
2.8j -
KR14056 4/8/14 16:10 KR19019 Iron Gate Thermocline PacifiCorp 3 R
0.40 0.48 65.6 3.56
0.042j 0.260
0.740 0.053 0.079
1j 0.2j
KR14077 5/20/14 13:10 KR19019 Iron Gate 0.5 m grab PacifiCorp 0.5 R 18.95 8.9 169 11.58 1.10 1.60 63.1 2.96 0.274 0.030
0.031j 0.0035j
0.460 0.035 0.050
5.40 2.2j 0.19
KR14079 5/20/14 13:30 KR19019 Iron Gate 1.0 m from bottom PacifiCorp 45 R
65.3 2.00
0.021j 0.580
0.760 0.072 0.050
3j 2.8j
KR14078 5/20/14 13:40 KR19019 Iron Gate Thermocline PacifiCorp 15 R
1.01 1.07 62.1 2.46 0.322 0.031
0.021j 0.430
0.7 0.072 0.091
2.4j 1.4j
B-6
KHSA 2014 Annual Report
Wate
r T
em
pera
ture
pH
Specific
Con
ductivity
Dis
solv
ed O
xyge
n
Alg
ae
, C
hlo
rophyll-
a
Alg
ae
, P
he
op
hytin
Alk
alin
ity
Carb
on
, D
isso
lved
Org
anic
Carb
on
Carb
on
, P
art
icula
te
Carb
on
Nitro
ge
n,
Part
icu
late
Nitro
ge
n
Dem
an
d,
Carb
on
ace
ous
Bio
logic
al O
xyge
n
Dem
an
d
Nitro
ge
n,
Am
mon
ia
Nitro
ge
n,
Nitra
te+
Nitri
te
Nitro
ge
n,
To
tal
Kje
ldah
l N
itro
ge
n
Nitro
ge
n,
To
tal
Nitro
ge
n
Phosph
oru
s,
Phosph
ate
Phosph
oru
s,
To
tal
Phosph
oru
s
Phosph
oru
s,
Part
icula
te O
rgan
ic
Phosporu
s
Phosph
oru
s,
Part
icula
te I
norg
anic
Phosporu
s
Turb
idity
Solid
s,
Tota
l
Susp
en
de
d S
olid
s
Solid
s,
Vola
tile
Susp
en
de
d S
olid
s
Toxin
s, M
icro
cystin
Sample ID Date Time Site ID Site Name Agency Depth, m Type C - uS/cm mg/l ug/l ug/l mg/l mg/l ppm ppm mg/l mg/l mg/l mg/l mg/l mg/l mg/l mg/l mg/l NTU mg/l mg/l
KR14099 6/18/14 13:05 KR19019 Iron Gate 0.5 m grab PacifiCorp 0.5 R 21.03 8.53 159 8.59 0.21 0.31 63.4 3.69 0.156 0.023
0.018j 0.0025j
0.52 0.079 0.11
2.8j 1j 0.16
KR14100 6/18/14 13:15 KR19019 Iron Gate Thermocline PacifiCorp 10 R
3.35 0.93 65.5 3.03 0.133 0.021
0.019j 0.062
0.36 0.083 0.12
2.2j 0.8j -
KR14101 6/18/14 13:30 KR19019 Iron Gate 1.0 m from bottom PacifiCorp 44 R
67 2.46
0.025j 0.560
1.03 0.1 0.12
2j 0.2j
KR14122 7/9/14 10:45 KR19019 Iron Gate 0.5 m grab PacifiCorp 0.5 R 25.27 8.97 157 8.72 1.81 0.45 63.5 4.43 0.391 0.065
0.011j 0.010
0.53 0.072 0.072
0.2j 0.4j 0.51
KR14124 7/9/14 10:55 KR19019 Iron Gate 1.0 m from bottom PacifiCorp 45 R
67.4 3.45
0.088 0.580
1.13 0.16 0.16
6.7 2.6j 0.6j
KR14123 7/9/14 11:05 KR19019 Iron Gate Thermocline PacifiCorp 13 R
0.80 0.57 62.6 3.08 0.402 0.070
0.012j 0.190
0.59 0.11 0.11
1.2j 1j -
KR14168 9/8/14 10:00 KR19019 Iron Gate 0.5 m grab PacifiCorp 0.5 R
63.4 5.51
- -
2.9 0.16 0.43
37.60 32.80 0.35
KR14191 10/20/14 16:35 KR19019 Iron Gate 0.5 m grab PacifiCorp 0.5 R
3.32 0.93 65 3.69 0.454 0.068
0.180 0.180
0.77 0.11 0.009j
2.4j 1j -
KR14212 11/4/14 11:55 KR19019 Iron Gate 0.5 m grab PacifiCorp 0.5 R 13.03
KR14183 10/7/14 11:45 KR18973 Hatchery bridge PacifiCorp 0.5 R
2.54 1.47 64.2 4.69 0.0646 0.418 4.3 0.096 0.180
0.77 0.12 0.12 0.0071 0.004 3.1 2j 1.6j 0.19
KR14197 10/20/14 15:00 KR18973 Hatchery bridge PacifiCorp 0.5 R
1.64 0.84 65.9 3.52 0.0798 0.424
0.160 0.200
0.76 0.11 0.069
2.2 4.4j 0.2j -
KR14204 11/4/14 12:45 KR18973 Hatchery bridge PacifiCorp 0.5 R
2.79 1.19 66.4 3.28 0.0416 0.338 0.8j 0.160 0.260
0.87 0.11 0.13 0.0053 0.0047 3.7 2.8j 2.4j
KR14224 12/9/14 12:00 KR18973 Hatchery bridge PacifiCorp 0.5 R
61.6 2.3 0.414 0.063 0.1j 0.130 0.480
0.88 0.063 0.14
4.7 2.2j -
WA021914-OC 2/19/14 11:59 KR156.0 KR at Walker Bridge Karuk 0.5 R 6.21 8.23 217 11.63 2.10 3.10
3.92 0.833
0.015 0.396
0.911 0.055 0.077
5.60 1.40
WA031914-OC 3/19/14 11:56 KR156.0 KR at Walker Bridge Karuk 0.5 R 8.20 8.20 196 10.81 1.60 4.80
3.29 0.686
<0.010 0.293
0.797 0.058 0.085
3.70 1.00
WA041614-OC 4/16/14 12:03 KR156.0 KR at Walker Bridge Karuk 0.5 R 12.80 8.29 188 10.79 2.10 5.30
3.74 0.732
0.013 0.257
0.979 0.053 0.080
4.30 1.80
B-7
KHSA 2014 Annual Report
Wate
r T
em
pera
ture
pH
Specific
Con
ductivity
Dis
solv
ed O
xyge
n
Alg
ae
, C
hlo
rophyll-
a
Alg
ae
, P
he
op
hytin
Alk
alin
ity
Carb
on
, D
isso
lved
Org
anic
Carb
on
Carb
on
, P
art
icula
te
Carb
on
Nitro
ge
n,
Part
icu
late
Nitro
ge
n
Dem
an
d,
Carb
on
ace
ous
Bio
logic
al O
xyge
n
Dem
an
d
Nitro
ge
n,
Am
mon
ia
Nitro
ge
n,
Nitra
te+
Nitri
te
Nitro
ge
n,
To
tal
Kje
ldah
l N
itro
ge
n
Nitro
ge
n,
To
tal
Nitro
ge
n
Phosph
oru
s,
Phosph
ate
Phosph
oru
s,
To
tal
Phosph
oru
s
Phosph
oru
s,
Part
icula
te O
rgan
ic
Phosporu
s
Phosph
oru
s,
Part
icula
te I
norg
anic
Phosporu
s
Turb
idity
Solid
s,
Tota
l
Susp
en
de
d S
olid
s
Solid
s,
Vola
tile
Susp
en
de
d S
olid
s
Toxin
s, M
icro
cystin
Sample ID Date Time Site ID Site Name Agency Depth, m Type C - uS/cm mg/l ug/l ug/l mg/l mg/l ppm ppm mg/l mg/l mg/l mg/l mg/l mg/l mg/l mg/l mg/l NTU mg/l mg/l
WA050714-OC 5/7/14 11:33 KR156.0 KR at Walker Bridge Karuk 0.5 R
11.00 9.50
4.22 0.778
0.023 0.193
0.703 0.050 0.095
6.50 2.00
WA061114-OC 6/11/14 11:47 KR156.0 KR at Walker Bridge Karuk 0.5 R 20.09 8.48 176 9.55 1.10 2.70
3.65 0.503
0.013 0.027
0.367 0.075 0.098
4.50 2.00
WA070914-OC 7/9/14 12:24 KR156.0 KR at Walker Bridge Karuk 0.5 R 23.24 8.31 160 9.13 1.10 1.50
3.94 0.386
<0.010 0.119
0.545 0.125 0.142
1.9 2.80 1.00 0.16
WA080614-OC 8/6/14 12:15 KR156.0 KR at Walker Bridge Karuk 0.5 R
16.00 3.80
4.39 2.7
<0.010 0.047
0.719 0.183 0.264
4.5 8.00 5.50 1.10
WA091014-OC 9/10/14 11:17 KR156.0 KR at Walker Bridge Karuk 0.5 R 19.53 9.39 162 9.08 9.90 4.70
6.11 2.06
0.019 0.018
0.886 0.186 0.252
3.0 8.70 4.70 -
WA100814-OC 10/8/14 11:42 KR156.0 KR at Walker Bridge Karuk 0.5 R 15.70 8.32 173 10.09 1.90 3.20
4.73 0.633
0.030 0.210
0.68 0.138 0.171
6.30 2.80
WA111914-OC 11/19/14 13:27 KR156.0 KR at Walker Bridge Karuk 0.5 R 8.71 8.25 196 11.44 1.60 3.30
3.53 0.58
0.027 0.368
0.703 0.108 0.132
2.60 1.00
WA121714-OC 12/17/14 12:18 KR156.0 KR at Walker Bridge Karuk 0.5 R 6.99 8.11 229 11.71 1.30 2.00
3.71 0.724
0.022 0.506
1.07 0.08 0.114
4.0 5.00 1.50
SV021914-OC 2/19/14 10:54 KR128.5 KR below Seiad Valley Karuk 0.5 R 6.62 8.09 176 11.49 2.10 3.10
3.290 0.48 0.049 <2.00 <0.010 0.276
0.609 0.033 0.062 0.017 0.014 4.5 23.00 2.60
SV031914-OC 3/19/14 10:55 KR128.5 KR below Seiad Valley Karuk 0.5 R 8.33 8.15 181 10.75 2.10 3.50
Sample ID Date Time Site ID Site Name Agency Depth, m Type C - uS/cm mg/l ug/l ug/l mg/l mg/l ppm ppm mg/l mg/l mg/l mg/l mg/l mg/l mg/l mg/l mg/l NTU mg/l mg/l
OR021914-OC 2/19/14 9:00 KR059.1 KR at Orleans (USGS) Karuk 0.5 R 7.80 7.98 108 11.82 1.60 2.10 54 1.82 0.617
<0.010 0.096
0.328 0.013 0.025
3.9 9.80 1.80
OR031914-OC 3/19/14 8:55 KR059.1 KR at Orleans (USGS) Karuk 0.5 R 8.35
137 12 1.10 1.90 65.7 1.49 0.336
<0.010 0.112
0.222 0.019 0.032
2.7 5.00 1.30
OR041614-OC 4/16/14 8:52 KR059.1 KR at Orleans (USGS) Karuk 0.5 R 12.56 8.13 137 11.16 1.10 2.30
1.6 0.445
<0.010 0.016
0.249 0.01 0.026
1.6 1.80 0.67
OR050714-OC 5/7/14 8:06 KR059.1 KR at Orleans (USGS) Karuk 0.5 R 13.18 8.33 137 10.41 3.20 3.90 68.4 2.26 0.384
<0.010 0.011
0.224 0.008 0.026
2.1 3.20 1.30
OR061114-OC 6/11/14 7:53 KR059.1 KR at Orleans (USGS) Karuk 0.5 R 20.97 8.18 166 8.86 <0.1 3.70 76 2.11 0.312
0.012 0.018
0.204 0.036 0.046
2.2 4.00 1.60
OR070914-OC 7/9/14 7:58 KR059.1 KR at Orleans (USGS) Karuk 0.5 R 23.72 8.01 164 8.05 0.80 1.30 81.7 2.6 0.338
<0.010 <0.010
0.307 0.059 0.064
0.5 1.20 0.67 0.17
OR080614-OC 8/6/14 8:03 KR059.1 KR at Orleans (USGS) Karuk 0.5 R 22.41 8.27 169 8.38 33.00 22.00 76.7 2.92 7.71
<0.010 0.013
1.38 0.095 0.321
8.1 71.00 17.00 1.90
OR091014-OC 9/10/14 8:00 KR059.1 KR at Orleans (USGS) Karuk 0.5 R 19.13 8.38 172 8.95 3.70 3.60 77.6 4.3 1.47
<0.010 <0.010
0.637 0.128 0.162
0.9 6.50 3.30 -
OR100814-OC 10/8/14 7:55 KR059.1 KR at Orleans (USGS) Karuk 0.5 R 16.61 8.39 180 10.16 2.90 3.00
3.95 0.5
0.013 0.115
0.478 0.111 0.144
2.4 7.50 3.30 0.18
OR111914-OC 11/19/14 9:05 KR059.1 KR at Orleans (USGS) Karuk 0.5 R
2.90 4.20 80 2.21 0.463
<0.010 0.124
0.226 0.044 0.058
1.5 2.10 0.63
OR121714-OC 12/17/14
KR059.1 KR at Orleans (USGS) Karuk 0.5 R 8.09 8.92 144 11.61 1.60 0.40 69 2.21 0.54
<0.010 0.158
0.252 0.22 0.038
2.5 3.50 0.75
WE021419-OC 2/19/14 11:09 KR043.5 KR near Weitchpec Yurok 0.5 R 7.88 7.81 107 12.15 2.10 0.90 DNS 2.13 0.566
<0.010 0.079
0.179 0.015 0.031
4.7 12.00 1.00
WE031419-OC 3/19/14 10:55 KR043.5 KR near Weitchpec Yurok 0.5 R 8.50 8.00 132 11.67 0.30 2.00 DNS 1.28 0.135
<0.010 0.096
0.240 0.019 0.032
2.5 3.50 0.75
WE041614-OC 4/16/14 11:17 KR043.5 KR near Weitchpec Yurok 0.5 R 12.61 8.07 133 10.84 1.20 1.60 DNS 1.45 0.166 0.194
<0.010 0.015
0.196 0.011 0.025
1.6 1.70 0.67
WE050714-OC 5/7/14 11:43 KR043.5 KR near Weitchpec Yurok 0.5 R 14.57 7.93 139 10.27 2.10 1.40 DNS 1.74 0.302
<0.010 <0.010
0.169 0.012 0.026
2.0 2.50 0.75 -
WE 061114-OC 6/11/14 11:34 KR043.5 KR near Weitchpec Yurok 0.5 R 21.02 8.29 163 9.16 1.87 0.75 DNS 2.12 0.406
<0.010 <0.010
0.214 0.029 0.044
2.6 3.00 1.13 -
WE 070914-OC 7/9/14 11:46 KR043.5 KR near Weitchpec Yurok 0.5 R 23.80 8.36 171 9.09 0.50 1.00 DNS 2.02 2.75
<0.010 <0.010
0.263 0.045 0.049
0.5 2.00 1.20 0.20
WE 080614-OC 8/6/14 11:19 KR043.5 KR near Weitchpec Yurok 0.5 R 22.86 8.44 170 9.52 11.00 1.40 DNS 2.63 2.4
<0.010 <0.010
0.515 0.085 0.128
4.4 8.50 7.00 1.20
WE091014-OC 9/10/14 10:54 KR043.5 KR near Weitchpec Yurok 0.5 R 19.04 8.27 168 9.78 2.70 2.00 DNS 4.46 0.686
<0.010 <0.010
0.553 0.094 0.145
0.7 2.50 1.30 -
WE100814-OC 10/8/14 11:01 KR043.5 KR near Weitchpec Yurok 0.5 R 17.05 7.99 183 9.45 2.94 3.04 DNS 3.63 0.861
0.010 0.098
0.679 0.111 0.132
2.1 5.75 2.25 0.18
WE111914-OC 11/19/14 11:07 KR043.5 KR near Weitchpec Yurok 0.5 R DNS DNS DNS DNS 1.60 1.00 DNS 2.06 0.334 0.038
<0.010 0.092
0.333 0.04 0.053
1.4 1.00 <0.50
WE121714-OC 12/17/14 10:18 KR043.5 KR near Weitchpec Yurok 0.5 R 8.42 7.91 138 11.75 1.50 <0.1 DNS 2 0.232
<0.010 0.121
0.352 0.02 0.034
2.9 5.80 0.75
TC021914-OC 2/19/14 10:22 KR038.5 KR below Trinity River Yurok 0.5 R 8.09 7.78 111 11.96 1.10 2.30 DNS 2.61 0.603
<0.010 0.080
0.22 0.013 0.025
5.1 13.00 1.50
TC031914-OC 3/19/14 10:13 KR038.5 KR below Trinity River Yurok 0.5 R 8.95 8.04 136 11.45 0.50 1.50 DNS 1.18 0.254
<0.010 0.080
0.169 0.015 0.025
2.6 4.80 1.00
TC041614-OC 4/16/14 10:26 KR038.5 KR below Trinity River Yurok 0.5 R 12.93 8.00 138 10.57 2.40 1.10 DNS 1.15 0.0267 0.254
<0.010 0.014
0.144 0.008 0.020
1.5 1.80 <0.50
TC050714-OC 5/7/14 10:17 KR038.5 KR below Trinity River Yurok 0.5 R 14.00 8.06 139 10.17 1.30 1.70 DNS 1.35 0.296
<0.010 <0.010
0.090 0.007 0.019
2.0 2.40 0.75 -
TC 061114-OC 6/11/14 10:38 KR038.5 KR below Trinity River Yurok 0.5 R 20.59 7.18 152 8.88 1.60 0.64 DNS 1.464 0.332
<0.010 <0.010
0.175 0.020 0.026
2.0 2.13 0.50 -
TC 070914-OC 7/9/14 10:07 KR038.5 KR below Trinity River Yurok 0.5 R 23.80 8.27 167 8.26 1.10 1.20 DNS 1.81 0.227
<0.010 <0.010
0.220 0.032 0.034
0.5 2.00 0.50 0.15
TC 080614-OC 8/6/14 10:11 KR038.5 KR below Trinity River Yurok 0.5 R 23.00 8.23 165 8.35 11.00 3.90 DNS 2.02 1.86
<0.010 <0.010
0.423 0.060 0.093
3.8 3.70 3.30 0.85
B-9
KHSA 2014 Annual Report
Wate
r T
em
pera
ture
pH
Specific
Con
ductivity
Dis
solv
ed O
xyge
n
Alg
ae
, C
hlo
rophyll-
a
Alg
ae
, P
he
op
hytin
Alk
alin
ity
Carb
on
, D
isso
lved
Org
anic
Carb
on
Carb
on
, P
art
icula
te
Carb
on
Nitro
ge
n,
Part
icu
late
Nitro
ge
n
Dem
an
d,
Carb
on
ace
ous
Bio
logic
al O
xyge
n
Dem
an
d
Nitro
ge
n,
Am
mon
ia
Nitro
ge
n,
Nitra
te+
Nitri
te
Nitro
ge
n,
To
tal
Kje
ldah
l N
itro
ge
n
Nitro
ge
n,
To
tal
Nitro
ge
n
Phosph
oru
s,
Phosph
ate
Phosph
oru
s,
To
tal
Phosph
oru
s
Phosph
oru
s,
Part
icula
te O
rgan
ic
Phosporu
s
Phosph
oru
s,
Part
icula
te I
norg
anic
Phosporu
s
Turb
idity
Solid
s,
Tota
l
Susp
en
de
d S
olid
s
Solid
s,
Vola
tile
Susp
en
de
d S
olid
s
Toxin
s, M
icro
cystin
Sample ID Date Time Site ID Site Name Agency Depth, m Type C - uS/cm mg/l ug/l ug/l mg/l mg/l ppm ppm mg/l mg/l mg/l mg/l mg/l mg/l mg/l mg/l mg/l NTU mg/l mg/l
TC091014-OC 9/10/14 9:56 KR038.5 KR below Trinity River Yurok 0.5 R 18.95 8.14 151 9.02 2.10 1.40 DNS 3.02 0.487
<0.010 <0.010
0.333 0.064 0.086
0.7 2.20 1.20 -
TC100814-OC 10/8/14 10:19 KR038.5 KR below Trinity River Yurok 0.5 R 17.03 7.93 177 9.41 2.14 2.72 DNS 3.137 0.793
<0.010 0.074
0.332 0.083 0.101
1.5 5.00 2.00 -
TC111914-OC 11/19/14 10:14 KR038.5 KR below Trinity River Yurok 0.5 R DNS DNS DNS DNS 1.40 0.60 DNS 1.83 0.508 0.053
<0.010 0.071
0.222 0.030 0.032
1.4 1.10 <0.50
TC121714-OC 12/17/14 9:33 KR038.5 KR below Trinity River Yurok 0.5 R 8.63 7.83 146 11.65 2.00 <0.1 DNS 1.8 0.792 0.061
<0.010 0.105
0.344 0.014 0.027 0.019 0.012 4.6 8.80 1.50
TG021912-OC 2/19/14 8:22 KR006.0 KR near Klamath Yurok 0.5 R 8.64 7.92 105 11.41 2.10 1.20 DNS 1.67 0.593 0.039
<0.010 0.126
0.230 0.013 0.029 0.012 0.009 7.5 14.00 1.60
TG031912-OC 3/19/14 8:03 KR006.0 KR near Klamath Yurok 0.5 R 9.65 7.95 131 10.86 0.50 1.70 DNS 1.04 0.189 0.011
<0.010 0.102
0.193 0.015 0.026 0.004 0.002 3.1 4.90 <0.50
TG041614-OC 4/16/14 8:12 KR006.0 KR near Klamath Yurok 0.5 R 12.95 7.87 138 10.1 6.10 4.10 DNS 0.827 0.179 2.500
<0.010 0.037
0.286 0.007 0.077 0.039 0.037 7.2 5.80 5.30
TG050714-OC 5/7/14 8:05 KR006.0 KR near Klamath Yurok 0.5 R 13.64 7.78 139 9.56 1.30 1.30 DNS 1.1 0.313 0.033
<0.010 0.047
0.194 0.005 0.018 0.009 0.002 1.6 1.90 0.63 0.15
TG 061114-OC 6/11/14 8:08 KR006.0 KR near Klamath Yurok 0.5 R 18.75 7.65 160 8.12 0.53 1.15 DNS 1.37 0.204 0.037
<0.010 0.080
0.188 0.012 0.018 0.007 0.002 1.6 0.89 0.51 -
TG070914-OC 7/9/14 7:38 KR006.0 KR near Klamath Yurok 0.5 R 20.55 7.72 168 7.07 0.50 1.90 DNS 1.58 1.34 0.184
<0.010 0.067
0.219 0.018 0.023 0.034 0.018 0.6 2.00 1.00 -
TG080614-OC 8/6/14 7:54 KR006.0 KR near Klamath Yurok 0.5 R 20.71 7.84 170 6.95 9.10 4.40 DNS 1.57 1.68 0.242
<0.010 0.014
0.429 0.032 0.064 0.023 0.010 3.5 6.70 5.00 0.44
TG091014-OC 9/10/14 7:31 KR006.0 KR near Klamath Yurok 0.5 R 17.94 7.87 160 7.75 5.10 4.60 DNS 2.49 1.32 0.208
<0.010 0.041
0.334 0.039 0.067 0.017 0.008 1.4 4.80 2.00 -
TG100814-OC 10/8/14 7:48 KR006.0 KR near Klamath Yurok 0.5 R 17.50 7.97 183 8.62 6.68 2.86 DNS 2.446 0.394 0.050
<0.010 0.015
0.307 0.063 0.077 0.009 0.002 0.7 1.88 0.87 -
TG111914-OC 11/19/14 8:00 KR006.0 KR near Klamath Yurok 0.5 R 10.36 7.59 167 9.91 1.40 1.70 DNS 1.36 0.37 0.022
<0.010 0.147
0.371 0.021 0.030 0.004 0.002 0.6 1.00 <0.50
TG121714-OC 12/17/14 7:15 KR006.0 KR near Klamath Yurok 0.5 R 9.04 7.70 138 11.27 2.10 0.60 DNS 1.47 0.288
<0.010 0.125
0.318 0.017 0.043
6.5 20.00 1.40
LES021914-OC 2/19/14 7:35 KR000.5 KR Lower Estuary Yurok 0.5 R 8.73 8.08 117 11.51 2.10 2.70 DNS 1.45 0.858
0.010 0.216
0.309 0.013 0.045
9.4 21.00 2.00
LES031914-OC 3/19/14 7:13 KR000.5 KR Lower Estuary Yurok 0.5 R 9.60 7.92 139 10.81 1.10 1.20 DNS 1.03 0.357
<0.010 0.110
0.215 0.015 0.032
3.8 7.90 0.75
LES041614-OC 4/16/14 7:30 KR000.5 KR Lower Estuary Yurok 0.5 R 12.94 7.86 136 10.1 1.90 1.90 DNS 0.924 0.037 0.401
0.010 0.034
0.223 0.008 0.031
2.4 6.20 1.20
LES050714-OC 5/7/14 7:08 KR000.5 KR Lower Estuary Yurok 0.5 R 13.87 7.62 139 9.6 1.90 0.70 DNS 1.24 0.24
<0.010 0.022
0.14 0.01 0.02
1.5 1.80 <0.50 0.16
LES061114-OC 6/11/14 7:12 KR000.5 KR Lower Estuary Yurok 0.5 R 20.51 8.02 162 7.93 1.34 0.35 DNS 1.477 0.296
0.015 0.045
0.33 0.02 0.02
2.2 2.67 2.17 -
LES070914-OC 7/9/14 6:40 KR000.5 KR Lower Estuary Yurok 0.5 R 21.20 8.14 2752 7.96 0.80 0.90 DNS 1.71 0.275
<0.010 0.017
0.24 0.02 0.02
0.5 1.30 0.83 0.15
LES080614-OC 8/6/14 7:05 KR000.5 KR Lower Estuary Yurok 0.5 R 21.07 7.99 6041 7.16 11.00 2.6 DNS 1.66 1.42
<0.010 <0.010
0.43 0.03 0.06
2.6 4.70 2.30 0.47
LES091014-OC 9/10/14 6:58 KR000.5 KR Lower Estuary Yurok 0.5 R 14.97 8.18 41436 8.99 1.30 1.80 DNS 2.62 0.326
0.020 0.010
0.35 0.05 0.07
0.8 2.20 1.00 -
LES100814-OC 10/8/14 7:22 KR000.5 KR Lower Estuary Yurok 0.5 R 17.39 7.99 999 9.34 0.50 1.30 DNS 2.494 0.31
0.018 0.014
0.576 0.058 0.07
0.6 1.17 0.83 -
LES111914-OC 11/19/14 7:27 KR000.5 KR Lower Estuary Yurok 0.5 R 10.07 7.52 691 10.86 0.70 1.40 DNS 1.66 0.316 0.031
0.029 0.126
0.40 0.03 0.04
1.7 2.00 0.75
LES121714-OC 12/17/14 6:42 KR000.5 KR Lower Estuary Yurok 0.5 R 9.07 6.99 1125 11.25 1.60 1.00 DNS 1.69 0.450
0.012 0.127
0.292 0.014 0.041
6.0 12.00 2.60
Non-detect values were replaced with “-“. PacifiCorp and USBR values below the reporting limit (RL) but above the method detection limit (MDL) are j-flagged and italicized. Karuk Tribe and Yurok Tribe values below the MDL are presented as “<” and the MDL value. DNS = did not sample. DNP = laboratory did not process. WSE = low water surface elevation (did not sample/measure).
B-10
KHSA 2014 Annual Report
Table B-2. 2014 Klamath River Data Summary (Major Tributaries)
Wate
r T
em
pera
ture
pH
Sp
ecif
ic C
on
du
cti
vit
y
Dis
so
lved
Ox
yg
en
Alg
ae, C
hlo
rop
hyll
-a
Alg
ae,
Ph
eo
ph
yti
n
Alk
alin
ity
Carb
on
, D
isso
lve
d
Org
an
ic C
arb
on
Carb
on
, P
art
icu
late
Carb
on
Nit
rog
en
,
Nit
rate
+N
itri
te
Nit
rog
en
, P
art
icu
late
Nit
rog
en
Dem
an
d,
Carb
on
ace
ou
s
Bio
log
ical
Ox
yg
en
Dem
an
d
Nit
rog
en
, A
mm
on
ia
Nit
rog
en
, T
ota
l
Kje
ldah
l N
itro
gen
Nit
rog
en
, T
ota
l
Nit
rog
en
Ph
osp
ho
rus
,
Ph
osp
hate
Ph
osp
ho
rus
, T
ota
l
Ph
osp
ho
rus
Ph
osp
ho
rus
,
Part
icu
late
Org
an
ic
Ph
osp
oru
s
Ph
osp
ho
rus
,
Part
icu
late
In
org
an
ic
Ph
osp
oru
s
Tu
rbid
ity
So
lid
s,
To
tal
Su
sp
en
de
d S
olid
s
So
lid
s,
Vo
lati
le
Su
sp
en
de
d S
olid
s
To
xin
s, M
icro
cys
tin
Sample ID Date Time Site ID Site Name Agency Depth, m Type C - uS/cm mg/l ug/l ug/l mg/l mg/l ppm mg/l ppm mg/l mg/l mg/l mg/l mg/l mg/l mg/l mg/l NTU mg/l mg/l ug/l
SA021914-OC 2/19/14 9:30 SA Salmon River Karuk 0.5 OC 7.16 7.89 74 11.87 0.50 0.60
1.960 0.394
<0.010 0.041
0.276 0.004 0.012
1.50 3.5 1.3
SA031914-OC 3/19/14 9:33 SA Salmon River Karuk 0.5 OC 6.93 8.01 96 11.63 1.60 0.60
0.978 0.526
<0.010 0.030
0.317 0.004 0.030
2.50 3.4 2.1
SA041614-OC 4/16/14 9:22 SA Salmon River Karuk 0.5 OC 10.64 7.96 90 11.23 1.50 <0.1
0.876 0.329
<0.010 <0.010
0.094 0.002 0.004
1.00 3.0 0.6
SA050714-SG 5/7/14 8:33 SA Salmon River Karuk 0.5 OC 11.57 8.04 89 10.23 1.30 0.50
1.080 0.558
<0.010 <0.010
0.053 <0.001 0.019
1.30 15.0 3.1
SA061114-OC 6/11/14 8:31 SA Salmon River Karuk 0.5 OC 18.41 7.86 115 9.06 1.10 1.20
0.863 0.234
0.022 0.011
0.117 0.002 0.013
1.60 12.0 2.2
SA070914-OC 7/9/14 8:35 SA Salmon River Karuk 0.5 OC 20.44 8.00 129 8.59 0.80 0.10
0.837 0.201
<0.010 <0.010
0.114 0.005 0.005
0.21 0.8 <0.50
SA080614-OC 8/6/14 8:31 SA Salmon River Karuk 0.5 OC 20.50 8.04 144 8.59 1.60 0.30
0.426 0.395
<0.010 0.012
<0.050 0.001 0.01
0.79 4.9 0.9
SA091014-OC 9/10/14 15:00 SA Salmon River Karuk 0.5 OC
0.90 <0.1
1.050 0.402
<0.010 <0.010
0.058 0.004 0.007
0.65 <0.50 <0.50
SA100814-OC 10/8/14 8:20 SA Salmon River Karuk 0.5 OC 14.47 8.46 153 10.43 1.80 <0.1
0.696 0.569
<0.010 <0.010
<0.050 0.002 0.007
0.31 2.7 1.3
SA111914-OC 11/19/14 9:35 SA Salmon River Karuk 0.5 OC 7.16 8.38 110 8.38 1.60 <0.1
1.290 0.240
<0.010 <0.010
<0.050 0.003 0.005
0.34 0.8 0.6
SA121714-OC 12/17/14 9:30 SA Salmon River Karuk 0.5 OC 7.72 8.24 96 11.89 1.20 <0.1
3.060 0.343
<0.010 0.071
0.086 0.003 0.008
0.60 3.1 1.0
SC021914-OC 2/19/14 11:28 SC Scott River Karuk 0.5 OC 6.32 8.05 115 11.54 1.60 1.40
3.080 0.389
<0.010 0.142
0.328 0.007 0.019
4.30 6.5 1.2
SC031914-OC 3/19/14 11:26 SC Scott River Karuk 0.5 OC 6.91 8.14 148 11.13 1.10 1.50
1.790 0.266
<0.010 0.184
0.241 0.006 0.012
1.50 2.8 0.7
SC041614-OC 4/16/14 11:30 SC Scott River Karuk 0.5 OC 11.53 8.36 165 10.87 1.60 1.40
1.260 0.303
0.011 0.095
0.250 <0.001 0.003
1.00 1.3 0.6
SC050714-OC 5/7/14 12:23 SC Scott River Karuk 0.5 OC 11.83 8.38 181 10.25 2.40 1.70
1.060 0.363
<0.010 0.014
0.193 <0.001 0.006
0.98 2.6 1.0
SC061114-OC 6/11/14 11:14 SC Scott River Karuk 0.5 OC 19.53 8.45 230 8.95 1.60 1.00
1.370 0.242
<0.010 0.149
0.239 <0.001 0.009
1.70 6.3 1.0
SC070914-OC 7/9/14 11:31 SC Scott River Karuk 0.5 OC 24.65 8.40 234 8.53 <0.1 0.90
1.360 0.248
<0.010 <0.010
0.166 0.001 0.003
0.41 <0.50 <0.50
SC080614-OC 8/6/14 11:36 SC Scott River Karuk 0.5 OC 22.91 8.54 264 9.17 0.50 0.60
0.784 0.312
<0.010 0.012
0.086 0.001 0.008
0.66 0.6 0.5
SC100814-OC 10/8/14 11:04 SC Scott River Karuk 0.5 OC 14.24 8.58 284 11.38 1.60 0.60
1.170 0.210
0.019 <0.010
0.091 0.005 0.01
0.31 <0.50 <0.50
SC111914-OC 11/19/14 11:48 SC Scott River Karuk 0.5 OC 6.26 8.32 214 11.92 2.10 1.20
1.180 0.259
<0.010 0.021
<0.050 0.003 0.004
0.35 0.9 0.4
SC121714-OC 12/17/14 11:41 SC Scott River Karuk 0.5 OC 6.41 7.98 148 11.64 2.80 2.40
2.530 1.220
0.011 0.207
0.518 0.007 0.058
3.80 24.0 4.5
SH021914-OC 2/19/14 12:43 SH Shasta River Karuk 0.5 OC 8.91 8.71 480 11.29 4.30 8.10
4.180 1.930
<0.010 0.175
0.642 0.173 0.229
5.00 24.0 4.8
SH031914-OC 3/19/14 12:53 SH Shasta River Karuk 0.5 OC 10.01 8.85 440 11.47 5.30 3.30
2.160 1.110
<0.010 <0.010
0.279 0.15 0.215
2.50 11.0 2.3
SH041614-OC 4/16/14 12:45 SH Shasta River Karuk 0.5 OC 14.50 8.77 583 11.42 0.80 2.40 293 5.570 0.460
<0.010 <0.010
0.611 0.174 0.205
1.10 1.8 0.7
SH050714-OC 5/7/14 14:24 SH Shasta River Karuk 0.5 OC 16.38 8.81 587 10.34 2.10 1.20
5.230 0.279
<0.010 <0.010
0.397 0.152 0.36
1.10 2.2 0.8
SH061114-OC 6/11/14 12:50 SH Shasta River Karuk 0.5 OC 21.67 8.72 560 9.97 3.20 2.40
4.560 0.313
<0.010 0.012
0.407 0.188 0.246
2.60 5.0 1.2
SH070914-OC 7/9/14 13:17 SH Shasta River Karuk 0.5 OC
1.10 0.40
5.200 0.504
0.016 0.017
0.490 0.21 0.236
0.45 2.5 1.0
SH080614-OC 8/6/14 13:15 SH Shasta River Karuk 0.5 OC 24.00 8.72 573 10.12 1.80 <0.1
4.540 0.437
<0.010 <0.010
0.376 0.176 0.205
1.00 2.0 1.1
B-11
KHSA 2014 Annual Report
Wate
r T
em
pera
ture
pH
Sp
ecif
ic C
on
du
cti
vit
y
Dis
so
lved
Ox
yg
en
Alg
ae, C
hlo
rop
hyll
-a
Alg
ae,
Ph
eo
ph
yti
n
Alk
alin
ity
Carb
on
, D
isso
lve
d
Org
an
ic C
arb
on
Carb
on
, P
art
icu
late
Carb
on
Nit
rog
en
,
Nit
rate
+N
itri
te
Nit
rog
en
, P
art
icu
late
Nit
rog
en
Dem
an
d,
Carb
on
ace
ou
s
Bio
log
ical
Ox
yg
en
Dem
an
d
Nit
rog
en
, A
mm
on
ia
Nit
rog
en
, T
ota
l
Kje
ldah
l N
itro
gen
Nit
rog
en
, T
ota
l
Nit
rog
en
Ph
osp
ho
rus
,
Ph
osp
hate
Ph
osp
ho
rus
, T
ota
l
Ph
osp
ho
rus
Ph
osp
ho
rus
,
Part
icu
late
Org
an
ic
Ph
osp
oru
s
Ph
osp
ho
rus
,
Part
icu
late
In
org
an
ic
Ph
osp
oru
s
Tu
rbid
ity
So
lid
s,
To
tal
Su
sp
en
de
d S
olid
s
So
lid
s,
Vo
lati
le
Su
sp
en
de
d S
olid
s
To
xin
s, M
icro
cys
tin
Sample ID Date Time Site ID Site Name Agency Depth, m Type C - uS/cm mg/l ug/l ug/l mg/l mg/l ppm mg/l ppm mg/l mg/l mg/l mg/l mg/l mg/l mg/l mg/l NTU mg/l mg/l ug/l
SH091014-OC 9/10/14 12:02 SH Shasta River Karuk 0.5 OC 17.04 8.67 599 10.6 26.00 16.00
5.870 1.040
<0.010 <0.010
1.340 0.156 0.26
2.70 48.0 11.0
SH100814-OC 10/8/14 12:31 SH Shasta River Karuk 0.5 OC 13.31 8.58 429 11.01 3.40 <0.1
1.780 1.060
<0.010 0.021
0.140 0.182 0.199
1.60 9.7 2.5
SH111914-OC 11/19/14 13:11 SH Shasta River Karuk 0.5 OC 6.56 8.52 424 12.08 5.90 9.50
1.550 1.270
<0.010 0.116
0.321 0.156 0.191
1.30 7.3 2.0
SH121714-OC 12/17/14 13:20 SH Shasta River Karuk 0.5 OC 6.39 8.31 501 11.5 2.40 0.60
4.500 0.603
0.025 0.512
9.440 0.171 0.229
2.60 6.0 1.6
SB041614-OC 4/16/14 13:20 SH Blank (Shasta) Karuk 0.5 OC
Non-detect values were replaced with “-“. PacifiCorp and USBR values below the reporting limit (RL) but above the method detection limit (MDL) are j-flagged. Karuk Tribe and Yurok Tribe values below the MDL are presented as “<” and the MDL value.
Table B-3. Mass Spectroscopy data for the samples collected at the Klamath River at Weitchpec. Results are presented in micrograms per liter (μg/l). Note: ND = non-detect.
Sample ID Lab ID Date Time Site Name MC-RR MC-Desmethyl-RR* MC-LR MC-Desmethyl-LR MC-YR MC-LA MC-LW MC-LF MC-LY Anatoxin A Domoic acid Okadaic acid Nodularin