26


• What Went Wrong with the Random Assignment National Evaluation of Upward Bound? David Goodwin, Retired US Department of Education (20 minutes)
• Findings from the ED-PPSS Staff Re-analysis and a New
Cost Benefit Analysis of the National Evaluation of Upward Bound Data, Maggie Cahalan, The Pell Institute (25 minutes)
• Discussion of Lessons Learned for the Next Generation of
Evaluation Studies. Questions and Discussion by attenders (20 minutes)

Before Start Would Like to State-- What our presentation is not! Not a critique of random assignment-recognize
power of method and hope this critique will improve its application
Not an Act of Advocacy for the program —we are acting as researchers concerned with meeting professional research standards
Not a dismissal of the UB study as a whole—When corrected can give useful information

Who Are We and Why are We Are Speaking Out Again! We are former COTRs whose job it was be responsible for
the technical monitoring of the study Reports large policy influence—resulted in OMB PART
ineffective rating and also zero funding requests in FY2005 and FY2006 President’s budgets for all federal college access programs (UB, UBMS, Talent Search, GEAR UP)
We made our concerns well known in the Department in 2008—report published over PPSS technical staff objections—final report ordered published by departing political staff in January 2009
Flawed reports continue to be cited and used to the detriment of the program (Whitehurst Congressional testimony 2011, Haskins and Rouse, 2013, Decker, 2013)

UB Evaluation: Study History
Second national evaluation and first random assignment study of UB:
Begun in 1992. Ran for 16 years Under 3 contracts
Four Mathematica Policy Research (Mathematica) contractor reports published by ED 1996, 1999, 2004, 2009
Large influence on policy

UB Study Basic DesignUnique Over Ambitious Combination
Multi-stage complex nationally representative probability sampling procedures
Random assignment design for selection; could not control treatment--- control group service participation
Multi-stage sample design 67 projects ---1500 treatment and 1380 control
student “applicants”—baseline survey completers interested in UB program
Multi-grade—multi-year cohort—grades 7 to 11 at baseline

Basic Finding of QA Analyses As US-ED study monitors, in the last of the three
contracts with PPSS– we gradually found contractor impact estimates of no overall impact were seriously flawed
We did a re-analyses correcting for these errors found strong positive results for the UB program on major outcomes
Contractor Reports are not transparent in revealing these issues or the findings of positive results

8 Major Errors Found in PPSS QA Review of Contractor Reports
1. Flawed sample design2. Severe lack of sample representation for 4-year public3. Lack of equivalent treatment and control group with systematic statistical bias in
favor of control group– 4. Lack of Common-Outcome Measures-use of unstandardized outcome measures for a
sample that spanned 5 years of expected high school graduation years.5. Biased and improper imputation of survey non-respondents’ outcome measures
from data with lack of sufficient coverage at the time ---improper use of National Student Clearinghouse data
6. False Attribution—Attributing negative impacts in project 69 to below average performance when negative impacts demonstrated to be related to treatment-control group non-equivalency
7. Failure to address equivalent services issues –failure to address control group contamination issues
8. Reports Lack of Transparency in acknowledging positive impacts detected when issues addressed such as standardizing outcomes to expected high school graduation year -

Flawed Sample Design --Extreme unequal weighting and serious representation issues
Project with 26 percent of weight (known as 69) was sole representative of 4-year public strata grantees, but was a former 2-year school with historical emphasis on certificates and was atypical program for its strata
Project partnered with job training program
Inadequate representation of 4-year
Figure 1. Percentage of sum of the weights by project of the 67 projects making up the study sample: National Evaluation of Upward Bound, study conducted 1992-93-2003-04
NOTE: Of the 67 projects making up the UB sample just over half (54 percent) have less than 1 percent of the weights each and one project (69) accounts for 26.4 percent of the weights. SOURCE: Data tabulated December 2007 using: National Evaluation of Upward Bound data files, study sponsored by the Policy and Planning Studies Services (PPSS), of the Office of Planning, Evaluation and Policy Development (OPEPD), US Department of Education,: study conducted 1992-93-2003-04.
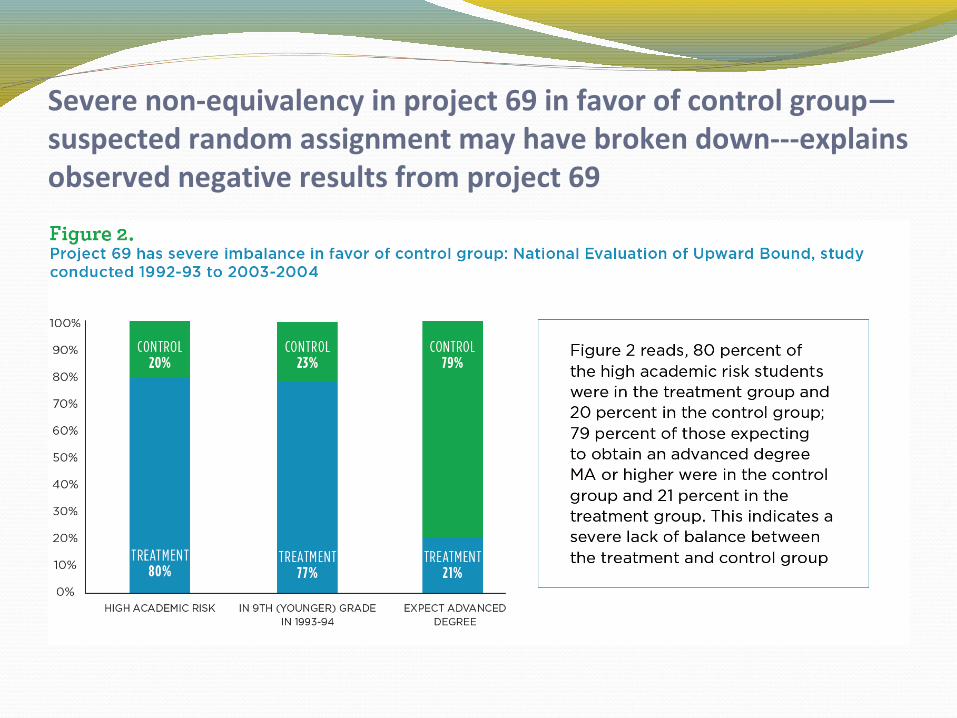
Severe non-equivalency in project 69 in favor of control group—suspected random assignment may have broken down---explains observed negative results from project 69

In project 69—Treatment group more likely to be on Track for Certificates; Control group on track for advanced degrees and UBMS

Uncorrected Bias in Favor of the Control Group in All of Mathematica Impact Estimates-- Project 69’s non-equivalent treatment and control group Project 69’s non-equivalent treatment and control group combined with large weight led to lack of balance in overall UB Samplecombined with large weight led to lack of balance in overall UB Sample

Among other 66 projects taken together there is balance one expects in random assignment study

Re-analysis to Mitigate Problems and Present More Robust Analysis that Reduced Identified Sources of Bias I (Cahalan) was personally influenced by work as
contractor Experimental design work examining the threats to validity Survey methods research —NCES and NSF required survey
evaluation studies looking at sampling and non-sampling error
Statistical and program evaluation standardsReason we are here is because we, as the Technical
Monitors whose job it was to ensure technical quality found very different conclusions about UB program than Mathematica Policy Research published in 2004 and 2009
Issue of Stakeholder rights to fair and transparent evaluation

What is the same as Mathematica’s Analyses? Use same statistical methods Statistical programs that take into account the
complex multi-stage sample design in estimating standard errors--STATA
Same ITT opportunity grouping: TOT participation grouping recognizes UBMS as form of UB
Similar model baseline controls Same weights--Mathematica

What is Different from Mathematica’s analyses Standardize survey data outcomes and 10 years of federal aid
data outcome measures by expected high school graduation year
Avoid using early National Student Clearninghouse (NSC) data when coverage too low or not existent; used only for BA degree as supplement for non-responders to surveys
Use all applicable follow-up surveys (3 to 5) not just one round at a time;
Present data with and without project 69 and weighted and un-weighted;
View impact estimates without project 69 as reasonably robust for 74 percent of applicants; view estimates with project 69 as non-robust and use should be avoided especially for estimates of BA impact

Impact on postsecondary enrollment when outcome measures are standardized to expected high school graduation year and when do not use NSC data

Impact on Award of Any Postsecondary Degree or Credential by End of Study Period: Fifth Follow-up Data: Mathematica and Cahalan results (67 of 67 projects)

Impact on BA degree for 66 of the 67 projects that did not have representation issue and severe lack of balance in treatment and control group on academics and expectations at baseline

Control group Alternative Service and Treatment-- Waiting List Drop-outs
Waiting List Drop-Outs --26 % of treatment group –kept in ITT
First Follow-up survey 20% ITT treatment group non-participation in neither UB or UBMS
Survey data--14 percent controls evidence of UB or UBMS participation
60 percent controls and 92 percent treatment group reported some pre-college supplemental service participation

Instrumental Variables Regression used in TOT/CACE and Observational analyses
Two stage regression—mitigate selection biasFirst stage models factors
related to participationSecond stage --uses results as
additional control in the model estimating outcomes

Two Stage Instrumental Variables regression impact results on entry into postsecondary in year after expected high school graduation: Levels of service impact

Two stage instrumental variables regression impact results on BA receipt in 6 years after expected high school graduation: Levels of service impact

Cost of UB and Estimated Impact on Life Time Taxes Paid Based on National Evaluation of Upward Bound

Conclusions Mathematica contractor conclusions of “no detectable impact” are not
robust and are seriously flawed. The reports are not transparent
A credible re-analysis conducted by US Department of ED staff assigned to monitor the contract that corrected for identified sources of study error using NCES statistical standards and US Department of Education Information Quality Guidelines detected strong positive impacts for the Upward Bound
Cost-Benefit analysis using Census Bureau estimates of life time taxes paid shows large relative impact of UB participation compared to cost of the program
Contractor reports continue to do serious harm to the reputation of the Upward Bound program and are in need of withdrawal or correction by Mathematica and the US Department of Education

Further Additional Information The full text of the COE Request for Correction can be found at
http://www.coenet.us/files/spotlight-COE_Request_for_Correction_of_Mathematica_Report_011812.pdf
Statement of concern by leading researchers in field http://www.coenet.us/files/spotlight-Statement_of_Concern_011812.pdf
Results of the re-analysis detailing study error issues can be found at: http://www.coenet.us/files/files-Do_the_Conclusions_Change_2009.pdf.
The materials that authors of this report (Cahalan and Goodwin 2014) submitted to the What Works Clearinghouse (WWC) in the “Request to Rescind the WWC Rating” are available at http://www. coenet.us/WWC_request_to_rescind


![THE GRAMMATICAL ERRORS OF THE ENGLISH WRITTEN …repository.usd.ac.id/26230/2/034214092_Full[1].pdfi the grammatical errors of the english written commentaries found in historical](https://static.documents.pub/doc/80x56/5d3be60288c993d64f8be1c0/the-grammatical-errors-of-the-english-written-1pdfi-the-grammatical-errors-of.jpg)


![Software Errors. There’s a bug in our code [Probably] The first software bug Harvard Mark II – Electromechanical machine Moth found in relay Found by.](https://static.documents.pub/doc/80x56/56649ed45503460f94be492f/software-errors-theres-a-bug-in-our-code-probably-the-first-software.jpg)


