ERS-2 SAR PERFORMANCE AND PRODUCT EVOLUTION P.J. Meadows (1) , B. Rosich (2) , A. Pilgrim (1) & M. Tranfaglia (3) (1) BAE SYSTEMS Advanced Technology Centre, West Hanningfield Road, Great Baddow, Chelmsford, Essex, CM2 8HN, United Kingdom. Email: [email protected], [email protected](2) European Space Agency, Directorate of Application Programmes, ESRIN, 00044 Frascati, Italy. Email: [email protected](3) Serco S.p.A., Via Sciadonna 24/26, 00044 Frascati (Roma), Italy. Email: [email protected]ABSTRACT The European Space Agency (ESA) ERS-2 Synthetic Aperture Radar (SAR) has successfully operated for more than 12 years. The performance of the ERS-SAR is routinely assessed via a variety of quality assessment and calibration measures. This paper gives the latest ERS-2 SAR quality assessment and calibration results, including elevation antenna pattern estimation and monitoring, updates to ERS-2 SAR internal calibration and stability, noise equivalent radar cross-section measurements, updates to the ERS-2 nominal replica pulse correction table and image localisation results. Equations are given for the calculation of distributed and point target radar cross-sections from the three- look ground range detected ERS-2.SAR.PRI and the single-look slant range complex ERS-2.SAR.SLC products. Also given are ERS-2 attitude and SAR Doppler variations following the change from three to one gyroscope operations in February 2000 and the change to gyro-less operations in February 2001. Finally a brief description is given of the evolution and harmonisation during 2006 of ERS SAR products from VMP to PGS-ERS processors and to the same specification as Envisat ASAR product. INTRODUCTION The ERS-2 SAR mission has been in operation since April 1995. The SAR instrument operates at C-band (5.3 GHz) using VV polarisation and its image mode has a single swath of 100km width and a mid-swath incidence angle of 23˚. It, along with ERS-1 [1], has fully lived up to expectations by successfully demonstrating the ability of imaging radars to provide valuable long-term earth observation data to many categories of users. Users require the SAR products from the ERS-2 SAR to be calibrated (absolutely or relatively). Absolute calibration supports the geophysical interpretation of SAR data by relating the digital values in data products to the physical and meaningful estimation of the normalised radar cross-section σ o (also referred to as the backscattering coefficient). Relative calibration enables SAR products from either ERS-1 or ERS-2 to be compared with each other. The importance of using calibrated ERS SAR imagery has been demonstrated for applications such as ocean wind speed extraction [2] and land applications [3, 4]. ELEVATION ANTENNA PATTERN At the start of the ERS-2 SAR mission the in-orbit ERS-2 SAR reference elevation antenna pattern was estimated using the Amazon rainforest. This was derived by using the mean range profile of several images of uniform rainforest and assuming that gamma is constant across the SAR swath (where γ = σ 0 /cos(α), σ 0 is radar cross-section and α is incidence angle). Improvements to the implementation of the reference elevation antenna pattern in the ESA VMP processors at extreme near and far ranges were made in November 2001 (VMP v6.8). Tables giving both patterns can be found in [5]. Analysis of the Amazon rainforest imagery from 1997 show differences between the measured and reference antenna patterns of up to 0.22dB at far range as shown in Fig.1. It is clear from Fig.1 that the gain at far range is reducing with time. -0.3 -0.2 -0.1 0.0 1995 1997 1999 2001 2003 2005 2007 Year Gain change at far range (dB) Fig. 1. Difference between the measured and reference antenna patterns at far range (+3° from boresight) _____________________________________________________ Proc. ‘Envisat Symposium 2007’, Montreux, Switzerland 23–27 April 2007 (ESA SP-636, July 2007)
Transcript
ERS-2 SAR PERFORMANCE AND PRODUCT EVOLUTION
P.J. Meadows (1), B. Rosich (2), A. Pilgrim (1) & M. Tranfaglia (3)
(1) BAE SYSTEMS Advanced Technology Centre, West Hanningfield Road, Great Baddow, Chelmsford, Essex, CM2 8HN, United Kingdom.
The European Space Agency (ESA) ERS-2 Synthetic Aperture Radar (SAR) has successfully operated for more than 12 years. The performance of the ERS-SAR is routinely assessed via a variety of quality assessment and calibration measures. This paper gives the latest ERS-2 SAR quality assessment and calibration results, including elevation antenna pattern estimation and monitoring, updates to ERS-2 SAR internal calibration and stability, noise equivalent radar cross-section measurements, updates to the ERS-2 nominal replica pulse correction table and image localisation results. Equations are given for the calculation of distributed and point target radar cross-sections from the three-look ground range detected ERS-2.SAR.PRI and the single-look slant range complex ERS-2.SAR.SLC products. Also given are ERS-2 attitude and SAR Doppler variations following the change from three to one gyroscope operations in February 2000 and the change to gyro-less operations in February 2001. Finally a brief description is given of the evolution and harmonisation during 2006 of ERS SAR products from VMP to PGS-ERS processors and to the same specification as Envisat ASAR product.
INTRODUCTION
The ERS-2 SAR mission has been in operation since April 1995. The SAR instrument operates at C-band (5.3 GHz) using VV polarisation and its image mode has a single swath of 100km width and a mid-swath incidence angle of 23˚. It, along with ERS-1 [1], has fully lived up to expectations by successfully demonstrating the ability of imaging radars to provide valuable long-term earth observation data to many categories of users. Users require the SAR products from the ERS-2 SAR to be calibrated (absolutely or relatively). Absolute calibration supports the geophysical interpretation of SAR data by relating the digital values in data products to the physical and meaningful estimation of the normalised radar cross-section σo (also referred to as
the backscattering coefficient). Relative calibration enables SAR products from either ERS-1 or ERS-2 to be compared with each other. The importance of using calibrated ERS SAR imagery has been demonstrated for applications such as ocean wind speed extraction [2] and land applications [3, 4].
ELEVATION ANTENNA PATTERN
At the start of the ERS-2 SAR mission the in-orbit ERS-2 SAR reference elevation antenna pattern was estimated using the Amazon rainforest. This was derived by using the mean range profile of several images of uniform rainforest and assuming that gamma is constant across the SAR swath (where γ = σ0/cos(α), σ0 is radar cross-section and α is incidence angle). Improvements to the implementation of the reference elevation antenna pattern in the ESA VMP processors at extreme near and far ranges were made in November 2001 (VMP v6.8). Tables giving both patterns can be found in [5]. Analysis of the Amazon rainforest imagery from 1997 show differences between the measured and reference antenna patterns of up to 0.22dB at far range as shown in Fig.1. It is clear from Fig.1 that the gain at far range is reducing with time.
-0.3
-0.2
-0.1
0.0
1995 1997 1999 2001 2003 2005 2007
Year
Gai
n ch
ange
at f
ar ra
nge
(dB
)
Fig. 1. Difference between the measured and reference antenna patterns at far range (+3° from boresight)
Proc. ‘Envisat Symposium 2007’, Montreux, Switzerland 23–27 April 2007 (ESA SP-636, July 2007)
A further improvement to the antenna pattern has been made which corrects the gain difference at near and, more importantly, at far range. This improved pattern has been derived from three images of Amazon rainforest acquired from 2005 and it is applicable to products acquired on and after the 1st May 1999 (approximate date at which the gain difference reached 0.1dB using the reference pattern). The reference and new antenna patterns are shown in Fig.2(a) and the difference between these patterns are shown in Fig.2(b). Analysis of Amazon rainforest imagery from post 1st May 1999 show differences between measured antenna patterns and the new antenna pattern of less than 0.1dB for the vast majority of the images.
-3
-2.5
-2
-1.5
-1
-0.5
0
0.5
-4 -2 0 2 4Relative Look Angle (deg)
Gai
n (d
B)
Fig. 2(a). Reference (blue) and new (red) ERS-2 SAR elevation antenna patterns
-0.2
-0.1
0
0.1
0.2
0.3
0.4
0.5
-4 -2 0 2 4
Fig. 2(b). Difference between the reference and new elevation antenna patterns
QUALITY ASSESSMENT
The quality of ERS-2 SAR imagery has been assessed via impulse response function (IRF) measurements using three ESA transponders deployed in The Netherlands. These measurements include the azimuth and range spatial resolutions, peak sidelobe ratio and integrated sidelobe ratio (see [2] for definitions). Table I gives values for these parameters from the three look detected ground range PRI and single look complex slant range SLCI products; as the PRI product range resolution varies across the swath, the table gives the range resolution converted to the mid-swath incidence angle of 23° (i.e. as if all the transponders were at an incidence angle of 23°). The PRI results have been derived from measurements up to November 2001
(when the last of the ESA transponder stopped operating) while the SLCI results are derived from a set of 10 products acquired between August 1995 and February 1997. Fig. 3 shows the range resolution as a function of incidence angle for ERS-2 PRI products. The solid curve shows the theoretical spatial resolution. Note that the largest range resolution value is from a de-focussed image acquired during the Extra Backup Mode in February 2001 (see section on attitude and Doppler variations below). Table I excludes the spatial resolutions from this scene. Table I and Fig. 3 show that the measured azimuth and range resolutions compare well with theoretical values (20.76m for PRI azimuth resolution, 24.67m for PRI range resolution at 23° incidence angle, 4.82m for SLCI azimuth resolution and 9.64m for SLCI slant range resolution). The sidelobe ratios are all low and acceptable.
Parameter PRI SLCI Azimuth resolution 21.63±0.37m 5.33±0.03m Range resolution 25.19±0.41m 9.83±0.07m Peak sidelobe ratio -15.8±0.7dB -21.9±0.6dB Integrated sidelobe ratio -12.2±1.4dB -14.9±0.5dB
Table I. ERS-2 SAR PRI and SLCI image quality parameters derived from the ESA transponders
The ESA transponders have also been used to derive the point target azimuth ambiguity ratio when the ambiguity background is sufficiently low to enable a measurement to be made (see [2] for further details). Based on the measurement of 10 azimuth ambiguities in PRI products, the average ambiguity ratio is -24.5±2.9dB while the average difference in the measured and theoretical azimuth locations of the ambiguities is only 4.1±2.2m (i.e. less than one pixel). These results indicate an excellent ambiguity performance for the ERS-2 SAR. Fig. 3. ERS-2.SAR.PRI range resolution derived from the ESA transponders (the curve is the theoretical range resolution)
20
22
24
26
28
30
32
34
36
19.5 21.5 23.5 25.5Incidence Angle (Deg.)
Ran
ge R
esol
utio
n (m
)
One source of additional point targets for quality assessment is ERS SAR ground receiving stations [6]. As these are used to acquire ERS SAR raw data in real time, they will be pointing towards the satellite while acquiring the data. Image quality parameters have been derived for two ground stations: the ESA ground station at Salmijärvi, Kiruna, Sweden and the German national station at Neustrelitz, Germany. At the Kiruna ground station there are two 15m dish antennae, one used primarily for ERS and the other for ENVISAT. At Neustrelitz there are three 7.3m disk antennae of which two are about 130m apart and the third about 330m from its neighbour. These three antennae have become operational at various times throughout the lifetime of ERS-2. These ground stations have been particularly useful for assessing the performance of the ERS-2 SAR after the failure of the last ERS transponder in November 2001. The two Kiruna antennae have extremely saturated IRF’s: the dish used for acquiring ERS SAR data has an estimated radar cross-section of ∼71dBm2 (cf. ∼57dBm2 for the ESA transponders). However, the IRF azimuth ambiguities are sufficiently strong to enable some IRF parameters to be measured. These have a radar cross-section of ∼47.5dBm2 but with very little sidelobe structure is visible. The Neustrelitz ground station antennae are not saturated in PRI products and so have been used to derive all IRF parameters. Table II gives the spatial resolution and sidelobe ratios for the ERS Kiruna antenna and the three Neustrlitz antennae. Acceptable mean values are found for the Kiruna azimuth and range resolutions and all the Neustrelitz IRF parameters (the Kiruna sidelobe ratios are poor due to lack of sidelobe structure in the ambiguities). The main difference between the ground station quality parameters and those derived from the ESA transponders is that the standard deviation of the ground station measurements is greater.
Parameter Kiruna Neustrelitz Azimuth resolution 22.62±0.45m 22.52±1.05m Range resolution (at 23°) 26.78±0.65m 26.83±1.91m Peak sidelobe ratio -8.6±2.5dB -15.9±1.2dB Integrated sidelobe ratio -3.7±2.0dB -13.5±1.1dB
Table II. ERS-2 SAR PRI image quality parameters derived from the Kiruna and Neustrelitz ground stations
Large uniform distributed targets can be used to estimate the image radiometric resolution. ERS-2 PRI and SLCI products give radiometric resolutions of 2.07dB and 3.03dB respectively. The theoretical values are 1.98dB for the PRI product and 3.01dB for the SLCI product (these values assume perfectly
uniform distributed targets).
RADIOMETRIC CALIBRATION
The radiometric calibration of ERS-2 SAR products has been achieved via internal and external calibration to determine equations that can be used to calculate the radar cross-section of point and distributed targets. External calibration comprised elevation antenna pattern derivation using the Amazon rain forest and the use of the ESA transponders for derivation of the image product calibration constants. The radiometric calibration corrections for ERS-2 ADC power loss are required to be carried out by the user [2, 3, 4, 5]. Internal Calibration
The internal calibration of the ERS-2 SAR is assessed via calibration pulse, replica pulse and noise signal powers. The calibration pulse and noise signal are available at the start and end of each imaging sequence while the replica pulses are available throughout an imaging sequence. The calibration pulse measures the majority of any gain drift from image sequence to image sequence while the replica pulse monitors any gain drift during the imaging sequence when the more representative calibration pulse is not available. In fact, the power of the calibration pulse is the best guide we have for the transmitted pulse power. The SAR processors at the ESA Processing and Archiving Facilities (PAFs) make no direct use of the calibration pulse and noise signal powers while the replica pulse is used for the range compression part of the processing. Calibration pulse, replica pulse and noise signal powers from ERS-2 SAR data archived at the UK-PAF are shown in Fig. 4. The calibration pulse powers from the start and end of imaging sequences are shown in Fig. 4(a) as a function of acquisition date. Unfortunately, the replica pulse power at the end of each imaging sequence is not calculated correctly and thus Fig. 4(b) only shows the replica powers from the start of each imaging sequence. Fig 4(c) shows the relationship between the calibration and replica pulses (from the start of imaging sequences). Finally, Fig 4(d) shows the noise power from the start of each imaging sequence (the noise power at the end of imaging sequences is not calculated correctly). On 6th August 1996 there was a change in calibration sub-system on-board ERS-2 due to the failure of the side-A: a small change in calibration and replica pulse behaviour can be seen after this date. The power of the calibration and replica pulses were increased by 2dB on 26th February 2003 and a further 1dB on 28th February 2003 through an increase in the up-converter level and a decrease in receiver gain respectively. Prior to and following this change both
the calibration and replica pulse powers have shown a drop in power as a function of time. The rate of decrease for both powers was approximately 0.66dB per year between launch and the end of 2000 and then approximately 0.82dB per year to the end February 2003. Since the gain change, the rate of decrease has returned to approximately 0.66dB per year. Unlike the ERS-1 SAR [1], the ERS-2 calibration and replica pulse powers are correlated (see Fig. 4(c)) and hence no replica pulse correction is required when obtaining the radar cross-section from ERS-2 SAR imagery. This is because any reduction in transmitter power is removed in the ESA SAR processors by the reduced power of the replica pulse used for range compression. Note that the noise signal power remained constant up to the 28th February 2003 when it increased by 1dB (thus the expected impact of the gain changes on the noise equivalent σo is a decrease of 2dB as described below).
Fig. 4(a). ERS-2 SAR calibration pulse powers
Fig. 4(b). ERS-2 SAR replica pulse powers The calibration attenuation gain setting was erroneously changed by 4dB for acquisitions between 4th September 2004 10:00 UT (orbit 49017) and 14th October 2004 12:00 UT (orbit 49590). As is shown in Fig. 4(b), the replica pulse power shows a 4dB drop in power during this acquisition period. A consequence
of this change is that the radiometric calibration of ERS-2 SAR image mode products is incorrect by 4dB such that the calibration constants of all products during the above acquisition period have to be increased by 4dB (see also [5]).
Fig. 4(c). Relationship between ERS-2 replica and calibration pulse powers. The purple symbols show the pulse powers since the end of February 2003.
Fig. 4(d). ERS-2 SAR noise signal powers
Raw Data Quality
SAR raw data obeys a particular statistical distribution: zero mean, Gaussian amplitude and uniform phase. A selection of raw data parameters are derived for all the ERS-2 SAR data archived at the UK-PAF. Fig. 5 shows the arithmetic mean, standard deviation for the in-phase (I) and quadrature (Q) channels together with saturation (the percentage of raw data samples occupying the highest or lowest quantisation levels). The I and Q mean values have been stable with very little difference between the I and Q values. As the expected mean value is zero and any difference, the bias, is removed prior to SAR processing. The standard deviation and saturation show larger values at the start of the mission due to the reducing power of the SAR up to the gain change at the end of February 2003 when the standard deviation and saturation increased
slightly. Differences between the I and Q channel values, the gain imbalance, are removed prior to processing.
Fig. 5(a). ERS-2 SAR raw data mean
Fig. 5(b). ERS-2 SAR raw data standard deviation
Fig. 5(c). ERS-2 SAR saturation
Stability
The stability of the ERS-2 SAR has been measured using the three ESA transponders deployed in The Netherlands, the Amazon rainforest and the ground stations at Kiruna and Neustrelitz.
Three ESA transponders were deployed across
Flevoland until February 1997, April 2001 and November 2001 respectively. The measured radar cross-sections of the transponders were compared to their actual radar cross-section values. This relative transponder radar cross-section (after the power loss calibration correction has been applied) was routinely calculated as is shown in Fig. 6. The measured mean radiometric accuracy, mean radiometric stability and peak to peak rcs for the ERS-2 SAR using the ESA transponders are shown in Tables III and IV. This table indicates an excellent radiometric stability for the ERS-2 SAR. In addition, the radiometric accuracy value is very good while the peak to peak radar cross-section value is acceptable.
Fig. 6. ERS-2 SAR corrected relative radar cross-sections for the ESA transponders (up to November 2001)
Tran Acquisition Dates
Mean Acc. (dB)
Mean Stab. (dB)
P-P RCS (dB)
Num
#1 19-Jul-95 to 05-Feb-97
0.04 0.29 1.54 28
#2 19-Jul-95 to 30-Nov-01
0.33 0.34 1.39 100
#3 19-Jul-95 to 25-Apr-01
0.11 0.18 0.88 92
Table III. ERS-2 SAR radiometric results derived from the ESA transponders
Radiometric stability 0.27dB Radiometric accuracy 0.16dB Peak to peak radar cross-section 1.27dB Table IV. Mean ERS-2 SAR radiometric results
derived from the ESA transponders
A selection of ERS-2.SAR.PRI images of the Amazon rainforest have also been used to derived radiometric stability. The dataset based on just one scene location has been used (track 139 and frame 3735 at centre latitude 6º 20’S, longitude 67º 13’W). Fig. 7 shows gamma derived from each image after the masking of none rainforest areas. The mean gamma for the whole
dataset is -6.07dB while the stability is 0.12dB. This stability is comparable to the values derived using the ESA transponders.
-6.4
-6.3
-6.2
-6.1
-6.0
-5.9
-5.8
-5.7
Jan-97 Jan-99 Jan-01 Jan-03 Jan-05 Jan-07
Gam
ma
(dB
)
Fig. 7. ERS-2 SAR Amazon rainforest Gamma.
The measured radar cross-section of the Kiruna ground station azimuth ambiguities have also been used to derive the stability of the ERS-2 SAR by using the average of two ambiguities in each scene. The use of the azimuth ambiguities assumes that the ERS SAR azimuth antenna pattern is stable. Table V gives the mean radar cross-section, stability and peak to peak radar cross-section values of the Kiruna ambiguities. These results are slightly higher than the transponder results given in Table IV. Fig. 8(a) shows the ERS-2 Kiruna ambiguity radar cross-section; a change in the rcs measurements occurs at the same time as the start of gyro-less attitude control operation in early 2001. The measurement indicated by the red symbol has been corrected by 4dB due to the replica pulse problem that occurred from imagery acquired between 4th September and 14th October 2004. There is no obvious radar cross-section trend with incidence angle. Fig. 8(a) also shows that there was a jump in the ambiguity relative rcs in late 2006. This was not due to a problem with the ERS-2 SAR instrument but to a change in ERS SAR processor from the VMP to PGS-ERS. A direct comparison of VMP and PGS-ERS images of the same data has shown that the azimuth ambiguity ratio from PGS-ERS images is about 3dB higher than from VMP images (see the section below on processor evolution). Note that the mean Kiruna ambiguity radar cross-section derived using ERS-1 and ERS-2 imagery was found to be similar indicating a good relative radiometric calibration between the two instruments [6].
Table V also gives the mean radar cross-section, stability and peak to peak radar cross-section values for the three Neustrelitz ground station antennae. Fig. 8(b) shows the ERS-2 Neustrelitz ground station radar
cross-section. Although the three Nesutrelitz ground stations are of the same diameter, the rcs of the latest antenna is significantly higher than the other two antennae. This is likely to be due differences in the focal area of each antennae [12]. Also for this antennae (NZ 3) there is a jump in rcs in late 2006. As with the jump in the Kiruna ambiguity relative rcs this is not an instrument issue but a change in the processor (from the VMP to PGS-ERS). In this instance the change is due to the increase in the number of used bits in the detected product (from 15 to 16) which indicates that VMP measurements of this antennae were saturated (this was not the case of the NZ 1 and NZ 2 antennae) – see the section below on processor evolution. The radiometric stability and peak to peak RCS results are slightly higher than for the ESA transponder. Examination of Fig. 8(b) shows there are a small number of radar cross-section measurements that are significantly lower than the majority. Four of these occur when the ground station IRF is at extreme low and high incidence angles; it is suggested that the ground station itself is contributing to the larger than expected radar cross-section variations through mis-pointing and/or weather effects. Overall, the radiometric stability results using the Kiruna and Neustrelitz give results that are, at worst, only 5% higher than derived using the ESA transponders thus indicating that ground stations could be used as secondary calibration sources.
Ground Station
Acquisition Dates
RCS (dBm2)
Mean Stab. (dB)
P-P RCS (dB)
Num
Kiruna 20-Jul-95 to 03-Feb-07
48.17 0.96 5.60 122
NZ 1 13-Apr-96 to 10-Mar-07
58.91 0.49 3.07 109
NZ 2 15-Jan-98 to 25-Nov-06
59.27 0.51 2.70 73
NZ 3 09-Jan-03 to 22-Feb-07
61.84 0.58 3.22 44
Table V. ERS-2 SAR radiometric results derived from the Kiruna and Neustrelitz ground stations
The upper limit to the noise equivalent σo (NEσo) of an image can be estimated by measuring the radar cross-section of low intensity regions (usually ocean/inland water regions). Fig. 9(a) shows low intensity region radar cross-section measurements from PRI images (after removing the range dependence in NEσ0 due to the elevation antenna pattern, range spreading loss and sin(α)/sin(23°) to give a NEσ0 at the mid-swath position). The NEσo measurements after the gain changes at the end of February 2003 are coloured red. NEσ0 measurements extracted from imagery acquired between 4th September and 14th October 2004 have been reduced by 4dB to correct for the erroneous calibration attenuation gain setting during this period (coloured green). The trend line in Fig. 9(a) is for • a 0.66dB per year decrease in transmitter pulse
power between launch and the end of 2000, • a decrease of 0.82dB per year until the end of
February 2003, • a 2dB drop at the end of February 2003 and then • the resumption of the 0.66dB per year decrease. An offset of 26.3dB has also been used for the trend line; -26.3dB represents the NEσo at the start of the ERS-2 mission. Note that during mid-2000 and since mid-2001 there are NEσ0 values below the trend line - this is due to imagery being used with higher replica and calibration pulse powers than the general downward trend in these powers. As the NEσ0 is directly related to the calibration and replica pulse powers, Fig. 9(b) shows the NEσ0 as a function of replica pulse power (the replica pulse power at the start of the mission has been set to 52.1dB). The lower trend line is a linear relationship between NEσ0 and replica pulse power prior to the gain change at the end of February 2003 while the upper trend line is for this relationship after the gain change. Fig. 9(b) shows more clearly the reduction in NEσ0 since the start of the ERS-2 mission.
-27
-26
-25
-24
-23
-22
-21
-20
-19
1995 1997 1999 2001 2003 2005 2007Date
Rad
ar C
ross
-Sec
tion
(dB)
Fig. 9(a). ERS-2.SAR.PRI Noise Equivalent σo as a function of acquisition date
-27
-26
-25
-24
-23
-22
-21
-20
-19
4647484950515253Replica Pow er (dB)
Rad
ar C
ross
-Sec
tion
(dB)
Fig. 9(b). ERS-2.SAR.PRI Noise Equivalent σo as a function of replica pulse power Assuming that the noise is thermal in origin, then the NEσo is expected to change across the PRI swath due to the application of the elevation antenna pattern. It has been possible to select a PRI product with a low backscatter region extending from near to far range, as shown in Fig. 9(c) where the strip used is shown in red. Fig. 9(d) shows the low intensity region σo measurements for a 6km azimuth strip stretching from near to far range together with the ERS-2 SAR elevation antenna pattern with an offset of -23.5dB (and again after including the range spreading loss and incidence angle correction). It can be seen that the elevation pattern and the σo profile fit very well indicating that the noise is indeed thermal in origin.
Fig. 9(c). ERS-2.SAR.PRI from Orbit 16652, Frame 2403 (27th June 1998) showing the strip used for the profile in Fig. 9(d) (near range is to the right) Fig. 9(d). ERS-2.SAR.PRI Noise Equivalent σo from Orbit 16652, Frame 2403 (27th June 1998) The NEσ0 measurements indicate an estimated ERS-2 NEσo of -26.3dB in July 1995, -21.0dB in early 2003 (i.e. an increase of just over 5dB in 7½ years) and -21.0dB in early 2007. This is similar to the change in transmitter pulse power over the same period (as measured by the calibration pulse power). Extending
current trends indicate that by the start of 2008 the ERS-2 NEσo will be approximately -20dB. ADC Power Loss Correction
ERS-2 SAR raw data are quantised to 5 bits within the on-board Analogue to Digital Convertor (ADC). The distribution of the I and Q channels is Gaussian and so if the input signal is high, a large number of data values will occupy the lowest and highest quantisation levels, i.e. saturation will occur. Any saturation will lead to the situation where the output power from the ADC will be less than the input power (i.e. there is a power loss). The gain of the ERS-2 SAR is such that a proportion of imagery is affected by saturation (for I and Q raw data standard deviations greater than approximately 5.3) but this proportion is significantly less than that for ERS-1 SAR imagery due to the reduced gain of ERS-2 compared to ERS-1. An ADC power loss of more than 1dB occurs if the I and Q standard deviation is greater than approximately 9 and a saturation level of more than approximately 6%.
Nominal Replica Pulse Products
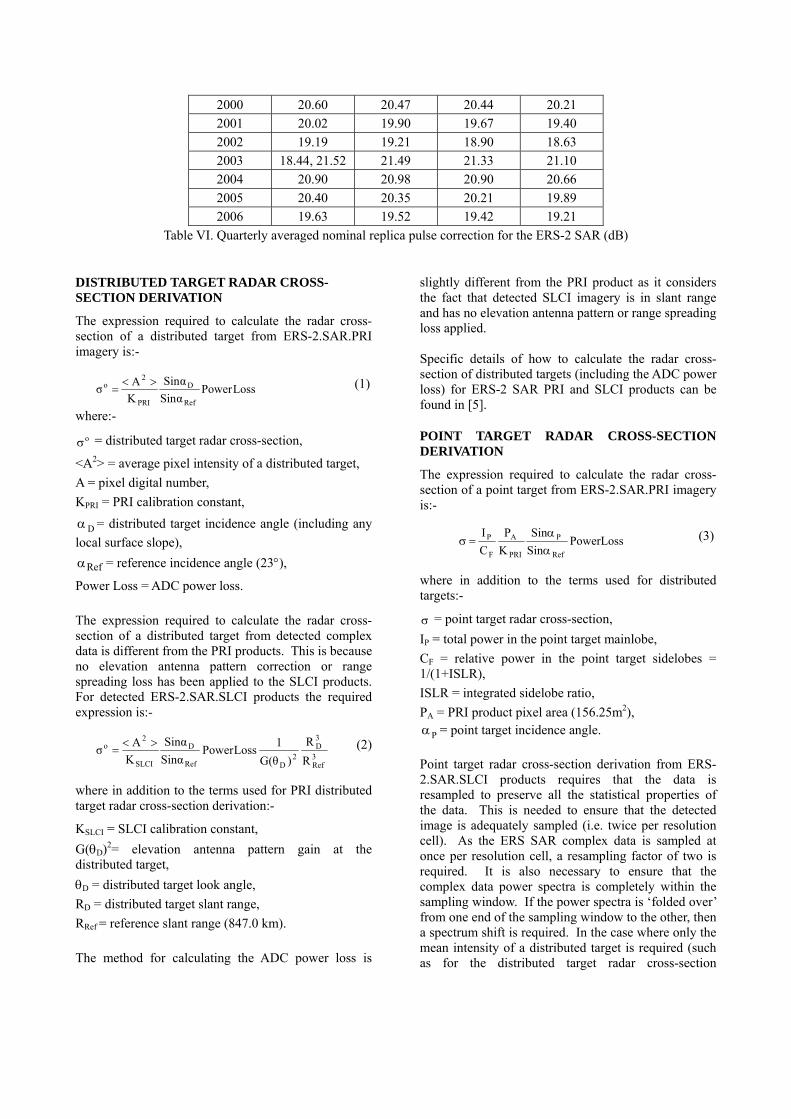
A small number of products generated within the ESA ground segment (< 1%) are processed with a nominal replica pulse rather than a replica generated at the time of imaging (an extracted replica). This occurs when the extracted replica pulse is corrupt. Products generated with a nominal replica have significantly higher pixel values than products generated using an extracted replica. These products can be corrected. For ERS-2 SAR products, the correction depends on the extracted replica pulse power at the time of data acquisition. This can be estimated from the quarterly averaged values given in Table VI (based on replica pulse powers at the start of imaging sequences as shown in Fig. 4(b) – values based on other ERS-2 SAR products can be found in [9]). For 2003 Q1, two corrections are given, one before 26th February and the other after 28th February due to the gain change between these dates. Replica pulse powers between 4th September and 14th October 2004 have been increased by 4dB to correct for the erroneous calibration attenuation gain setting during this period. The correction factor is applied such that the image intensity values need to be reduced. More details can be found in [2, 5].
Table VI. Quarterly averaged nominal replica pulse correction for the ERS-2 SAR (dB)
DISTRIBUTED TARGET RADAR CROSS-SECTION DERIVATION
The expression required to calculate the radar cross-section of a distributed target from ERS-2.SAR.PRI imagery is:-
LossPowerSinαSinα
KAσ
Ref
D
PRI
2o ><= (1)
where:-
σo = distributed target radar cross-section,
<A2> = average pixel intensity of a distributed target, A = pixel digital number, KPRI = PRI calibration constant, αD = distributed target incidence angle (including any local surface slope), αRef = reference incidence angle (23°),
Power Loss = ADC power loss. The expression required to calculate the radar cross-section of a distributed target from detected complex data is different from the PRI products. This is because no elevation antenna pattern correction or range spreading loss has been applied to the SLCI products. For detected ERS-2.SAR.SLCI products the required expression is:-
3Ref
3D
2DRef
D
SLCI
2o
RR
)θG(1 LossPower
SinαSinα
KAσ ><
= (2)
where in addition to the terms used for PRI distributed target radar cross-section derivation:-
KSLCI = SLCI calibration constant, G(θD)2= elevation antenna pattern gain at the distributed target, θD = distributed target look angle, RD = distributed target slant range, RRef = reference slant range (847.0 km). The method for calculating the ADC power loss is
slightly different from the PRI product as it considers the fact that detected SLCI imagery is in slant range and has no elevation antenna pattern or range spreading loss applied. Specific details of how to calculate the radar cross-section of distributed targets (including the ADC power loss) for ERS-2 SAR PRI and SLCI products can be found in [5].
POINT TARGET RADAR CROSS-SECTION DERIVATION
The expression required to calculate the radar cross-section of a point target from ERS-2.SAR.PRI imagery is:-
PowerLossSinSin
KP
CI
Ref
P
PRI
A
F
P
αα
=σ (3)
where in addition to the terms used for distributed targets:-
σ = point target radar cross-section, IP = total power in the point target mainlobe, CF = relative power in the point target sidelobes = 1/(1+ISLR), ISLR = integrated sidelobe ratio, PA = PRI product pixel area (156.25m2), αP = point target incidence angle. Point target radar cross-section derivation from ERS-2.SAR.SLCI products requires that the data is resampled to preserve all the statistical properties of the data. This is needed to ensure that the detected image is adequately sampled (i.e. twice per resolution cell). As the ERS SAR complex data is sampled at once per resolution cell, a resampling factor of two is required. It is also necessary to ensure that the complex data power spectra is completely within the sampling window. If the power spectra is ‘folded over’ from one end of the sampling window to the other, then a spectrum shift is required. In the case where only the mean intensity of a distributed target is required (such as for the distributed target radar cross-section
calculation) then it is possible to detect the complex data without resampling. For detected ERS-2.SAR.SLCI products the required expression is:-
3Ref
3P
2P
2FRefSLCI
A
F
P
RR
)θG(1 LossPower
S1
Sin1
KP
CI
α=σ (4)
where in addition to the terms used for PRI point target radar cross-section derivation:-
PA = SLCI product pixel area (~30.8m2), KSLCI = SLCI calibration constant, SF = sampling factor for detection of SLCI data, G(θP)2 = elevation antenna pattern gain at the point target, θP = point target look angle, RP = point target slant range. The derivation of the ADC power loss corrections is the same as for distributed targets.
ATTITUDE AND DOPPLER VARIATIONS
ERS-2 was piloted in the nominal yaw steering mode using 3 gyroscopes out of a total of 6 available on-board since launch until February 2000. During this period, there were several problems and failures with some of the gyroscopes. On-board software was developed to enable ERS-2 to be piloted in yaw-steering mode with a single gyro and thus to ensure continuity of operations in the case of additional gyroscope problems or failures. During the period from February 2000 to mid January 2001, the piloting of the ERS-2 satellite was performed using just one gyroscope (1GP) instead of the usual three. A consequence of this change was a loss of attitude stability but the impact of this on SAR product quality was small and no degradation in radiometric stability, as measured using the ESA transponders, was found [7]. During this period, the Doppler centroid frequency increased for localised areas and time intervals but values were mostly limited to the first ambiguity number (-1600Hz to 1600Hz). During this period, a new on board software to pilot the satellite without using any gyroscopes but exploiting the capabilities of the Digital Earth Sensor and Digital Sun Sensor, was developed and tested. A first coarse version of this software, the Extra Backup mode (EBM), was uploaded in December 2000 as a first step
for gyro-less operations, and operationally used from mid January 2001 due to further problems with the remaining gyroscopes. Significant degradation of ERS-2 attitude occurred during the EBM. Fig. 10 shows the yaw, pitch and Doppler centroid frequency since the start of 2000 and shows the large yaw and Doppler centroid frequencies during the EBM. Very large Doppler centroid frequencies are difficult to estimate in SAR processors - this is particularly the case for values outside the interval ±4500Hz with the ESA VMP processor. However, if the Doppler ambiguity number is properly estimated, even if it is high, then there is no impact on product quality - otherwise the image is de-focussed and miss-located in azimuth [8]. Only products with Doppler centroid frequencies within ±4500Hz have been directly distributed to users. Products with Doppler frequencies outside this range were sent to the Product Control Service (PCS) at ESRIN for correct Doppler verification before delivery to users. Verification of correct Doppler ambiguity estimation has now been included in the automatic quality control check performed at the PAFs systematically on all products before delivery to the users. Improvements in attitude control took place in June 2001 with the introduction of the Zero Gyro Mode (ZGM) and again in March 2002 with the ZGM-Yaw Control Monitoring (ZGM-YCM). Now more than 90% of the Doppler centroid frequencies remain within ±4500Hz (see Fig. 10(c)). Since the implementation of ZGM-YCM, the yaw values derived in near-real time from wave mode data are used to automatically correct the instrument attitude during the next orbit pass if necessary. Some changes to this strategy were required after the failure of the on-board tape recorders in June 2003, since data acquisition all over the orbit could not be ensured anymore. Using a network of receiving ground stations, it was possible to continue the low rate mission although coverage has been restricted to the north hemisphere. The new strategy used for routine yaw control monitoring is a so-called “regional yaw control monitoring” (R-YCM) as it is based on a limited set of data. As it can be observed in Fig. 10, the changes in the low rate mission, and therefore on the data available for routinely monitoring the attitude, has not significantly impacted the Doppler evolution in time. More details about the ERS-2 SAR Doppler and satellite attitude evolution can be found in [10].
Fig. 10(a). ERS-2 Yaw Evolution since January 2000
Fig. 10(b). ERS-2 Pitch Evolution since January 2000
Fig. 10(c). ERS-2 Doppler Centroid Evolution since January 2000
With the start of single gyroscope operations in February 2000, a new criterion appeared for the selection of ERS-2 InSAR data based on the Doppler centroid frequency difference between the InSAR pair. Due to the large and rapid variations of Doppler frequency during the EBM period, InSAR applications are not recommended with EBM data. The Doppler evolution around the orbit has been derived for 1GP, ZGM and ZGM-YCM orbits (repeat cycle to repeat cycle) to assist users in the identification of ERS-2 data
still suitable for InSAR. Doppler frequency values are included in the ESA EOLI and DESCW data catalogues and an interactive Doppler frequency query tool is available at http://earth.esa.int/pcs/ers/sar/ doppler/. As an example of the Doppler frequency changes during the ZGM-YCM, Fig. 11 shows the Doppler frequency for ascending and descending passes during repeat cycle 80 in December 2002 and January 2003.
Fig. 11. ERS-2 Doppler Centroid Frequency during Repeat Cycle 80 (December 2002-January 2003) for ascending passes (left) and descending passes (right). Blue is -5000Hz and red is 10000Hz
IMAGE LOCALISATION
Localisation of ERS-2 SAR imagery can be assessed by using the measured pixel coordinates of known point targets. This is achieved by converting the point target pixel coordinate to cartographic coordinates (x, y in a UTM map projection) via the image corner latitude
and longitudes. The distribution of point target cartographic coordinates gives the image localisation (after compensation of terrain height has been included). More details on the derivation of the image localisation can be found in [6].
The ESA transponders deployed in The Netherlands have been used to assess the ERS-2 SAR image localisation. Fig. 12 shows the displacement of each transponder in cartographic coordinates after compensating for terrain height and for the transponder time delay up to the end of 1999 (i.e. before the start of single and zero gyroscope operations). The mean displacement, i.e. the image localisation, from all measurements is 25.5m. Fig. 12. ERS-2.SAR.PRI image localisation using the ESA transponders (blue triangles for transponder#1, purple diamonds for transponder#2 and red squares for transponder#3)
A detailed examination of ERS localisation can be found in [11].
PROCESSOR EVOLUTION
During late 2006 the generation of ERS SAR products was evolved from the VMP to the PGS-ERS processors. In addition the ERS SAR products have been harmonised with the ASAR product definitions. So the off-line product types now include Level 0 (replacing the RAW product), IMP (PRI), IMS (SLC), IMG (GEC) and IMM. The Level 0, IMP and IMS products are available in either Envisat MPH/SPH format or CEOS format while IMG and IMM are only available in Envisat format. The product specification harmonisation has meant that, for example, the three look PRI product with a GEM6 ellipsoid has been replaced with the four look IMP product with a WGS84 ellipsoid [13]. Results presented above have shown that a new ERS-2 elevation antenna pattern is required for acquisitions after 1st May 1999. The auxiliary files associated with the generation of PGS-ERS products will be modified
to include the new elevation antenna pattern. Analysis of the Amazon imagery has shown also shown that there needs to be small correction to the IMP calibration constant (reduced by 0.22dB). This correction will also be included in PGS-ERS auxiliary files. As noted above the ERS-PGS IMP products use the full 16bits of the product compared to 15 bits for VMP PRI products. Also it has been found that the azimuth ambiguity ratio is about 3dB higher in PGS-ERS products than for VMP product which is still small at approximately -25dB.
CONCLUSIONS
This paper has given details of the performance of the ERS-2 SAR over a 12 year period by consideration of quality assessment and radiometric calibration using the ESA transponders, the Amazon rainforest and two ERS ground receiving stations together with other aspects of the ERS-2 SAR and its products. Results presented show that the SAR worked well with excellent quality assessment and radiometric calibration results, although some products acquired during the Extra Backup Mode (the first half of 2001) have poor image quality due to degraded satellite attitude performance (these products have not been distributed to users). It has been shown that a consequence of the decrease in SAR transmitter pulse power at the rate of 0.66dB per year between launch and the end of 2000 and then 0.82dB per year until February 2003 has been a corresponding increase in the noise equivalent radar cross-section. Following the changes in the ERS-2 SAR gain at the end of February 2003, the NEσo was estimated to be -21dB in early 2007. Image localisation using the ESA transponders has been measured to be an excellent 25.5m. A recent development has been the evolution of the generation of ERS SAR products from the VMP to the PGS-ERS processor. The change of processor has, more importantly, meant that ERS SAR products are now harmonised with the specification of Envisat ASAR products.
ACKNOWLEDGEMENTS
Much of the ERS-2 SAR data used in this paper was processed at one of the ESA ERS Processing and Archiving Facilities. We would like to thank the staff at the UK-PAF for their support in the processing of this SAR data.
REFERENCES
[1] Meadows, P.J., Laur, H., Rosich, B. & Schättler, B., “The ERS-1 SAR Performance: a Final Update”, Proceedings of the CEOS SAR
-60
-40
-20
0
20
40
60
-60 -40 -20 0 20 40 60
Range Displacement (m)
Azi
mut
h D
ispla
cem
ent (
m)
Workshop, Tokyo, Japan, on 2-5 April 2001. NASDA publication EORC-061.
B., “The ERS SAR Performances”, Proceedings of the CEOS SAR Workshop, 3-6 February 1998, ESTEC, Noordwijk, The Netherlands, ESA publication WPP-138, pp 223-232.
[3] Meadows, P.J., Laur, H. & Schättler, B., “The
Calibration of ERS SAR Imagery for Land Applications”, Proceedings of the 2nd International Workshop on Retrieval of Bio- & Geo-physical Parameters from SAR Data for Land Applications, 21-23 October 1998, ESTEC, Noordwijk, The Netherlands, ESA publication SP-441, pp 35-42.
[4] Meadows P.J., Laur, H. & Schättler, B., “The
Calibration of ERS SAR Imagery for Land Applications”, Earth Observation Quarterly, No 62, June 1999.
Schättler, B., Lopinto, E. & Esteban, D., “ERS SAR Calibration: Derivation of σ0 in ESA ERS SAR PRI Products”, ESA/ESRIN, ES-TN-RS-PM-HL09, Issue 2, Rev. 5f, November 2004.
[6] Meadows, P.J., “The Use of Ground Receiving
Stations for ERS SAR Quality Assessment”, Proceedings of the CEOS SAR Workshop, 26-29 October 1999, Toulouse, France. ESA publication SP-450, pp 525-530.
[7] Rosich, B., Esteban, D., Emiliani, G., Meadows,
P., Scháttler, B., “Assessment of the new ERS-2 mono-gyro piloting mode on the quality of ERS SAR data and ERS SAR applications performance”, ERS-Envisat Symposium, Gothenburg, Sweden, 16 - 20 October 2000. ESA publication SP-461.
[8] Rosich, B., Meadows, P.J., Schättler, B., Grion. M. & Emiliani, G., “The ERS-2 mono-gyro and extra backup piloting modes: impact on SAR performance”, Proceedings of the CEOS SAR Workshop, Tokyo, Japan, on 2-5 April 2001. NASDA publication EORC-061.
[9] ESA Product Control Service, “Replica pulse
power correction factor”, http://earth.esa.int/pcs/ers/sar/calibration/ replica_pwr/
[10] Miranda, N., Rosich, B. & Santella, C., “Review
of the Impact of the ERS-2 Piloting Modes on the SAR Doppler Stability”, Envisat & ERS Symposium, Salzburg, Austria, 6-10 September 2004. ESA publication SP-572.