ERT 349 SOIL AND WATER ENGINEERING Water Quality At the end of this topic, student should be able to: 1.Determine the sources of water pollution 2.Analyze water quality parameter based on water quality standard 3.Design the water treatment process
Transcript
ERT 349 SOIL AND WATER
ENGINEERING
Water Quality
At the end of this topic, student should be able to:
1.Determine the sources of water pollution2.Analyze water quality parameter based on water quality standard3.Design the water treatment process
Outline
Introduction to Water QualityWater Pollution
Types Sources of Pollution Sources categories Eutrophication
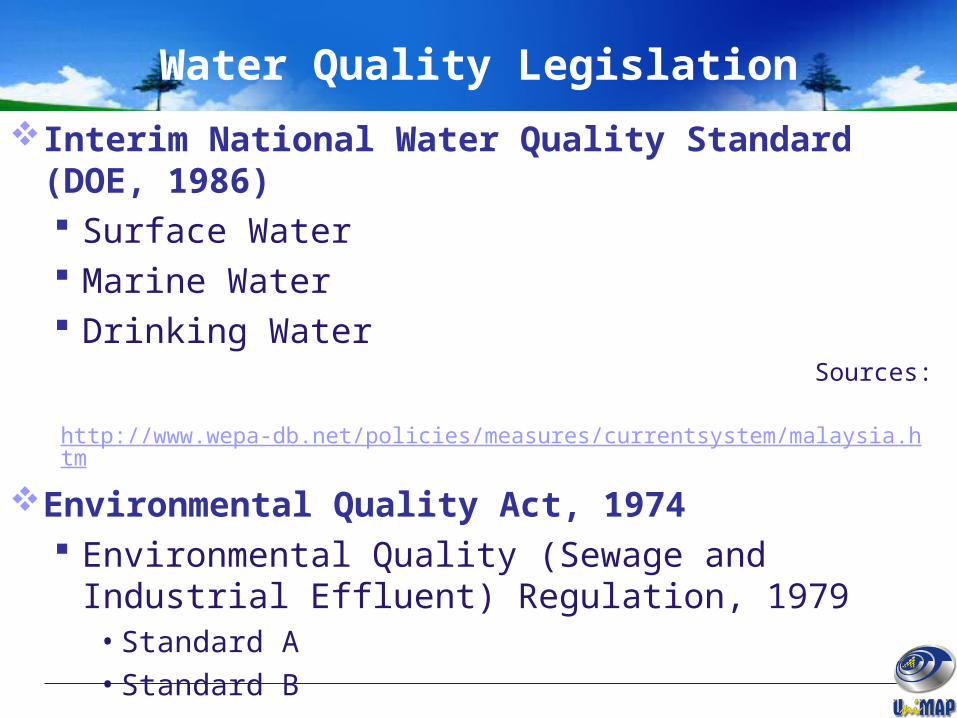
Water Quality LegislationWater Quality ParameterWater Quality Treatment
Introduction
Most of the Earth’s surface is covered with water.
Our bodies, plants & animals are consist about 90% of water.
We can only survive a few days without water.
Water is an essential nutrient for all plants & animals
Water transports nutrients & carries away waste products.
Water cools the body
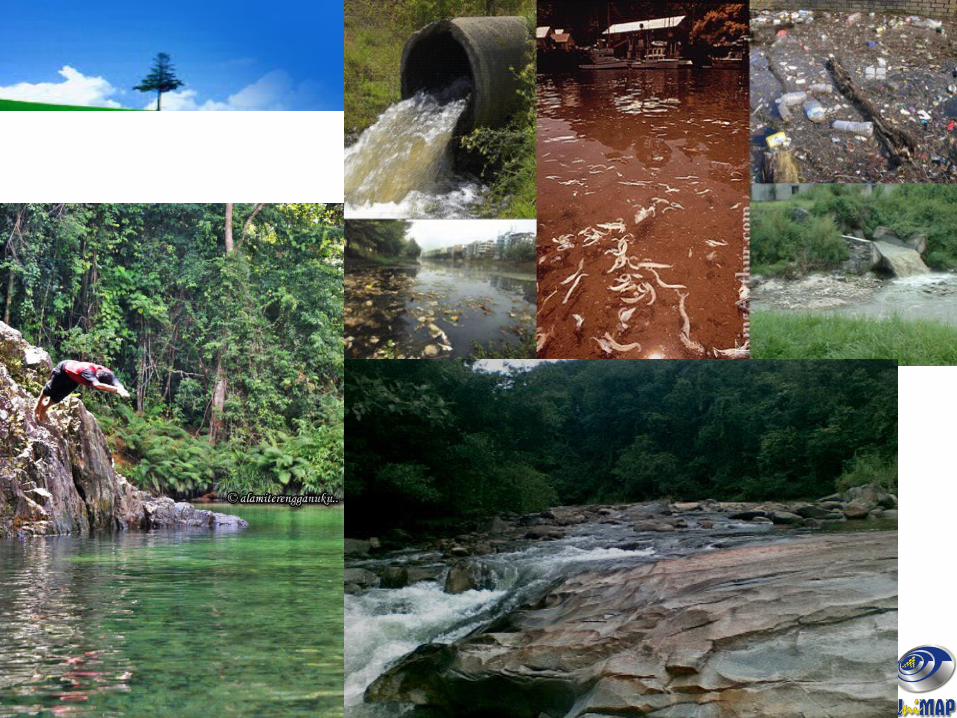
Water Pollution
The presence of a substance in the environment that because of its chemical composition or quantity prevents the functioning of natural processes and produces undesirable environmental and (human) health effects.
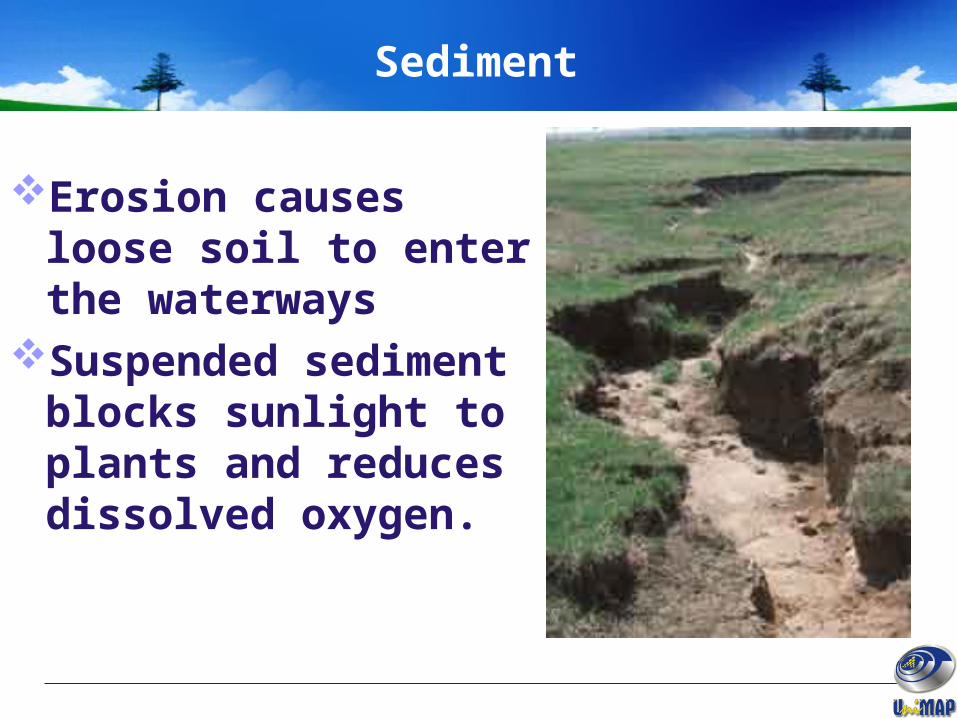
Suspended sediment blocks sunlight to plants and reduces dissolved oxygen.
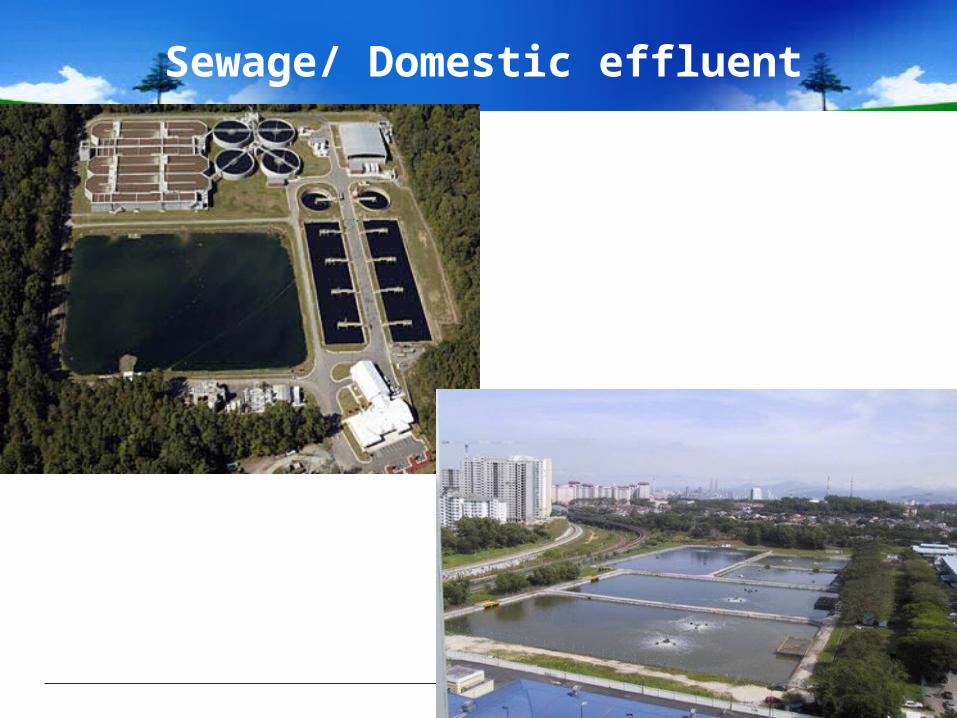
Sewage/ Domestic effluent
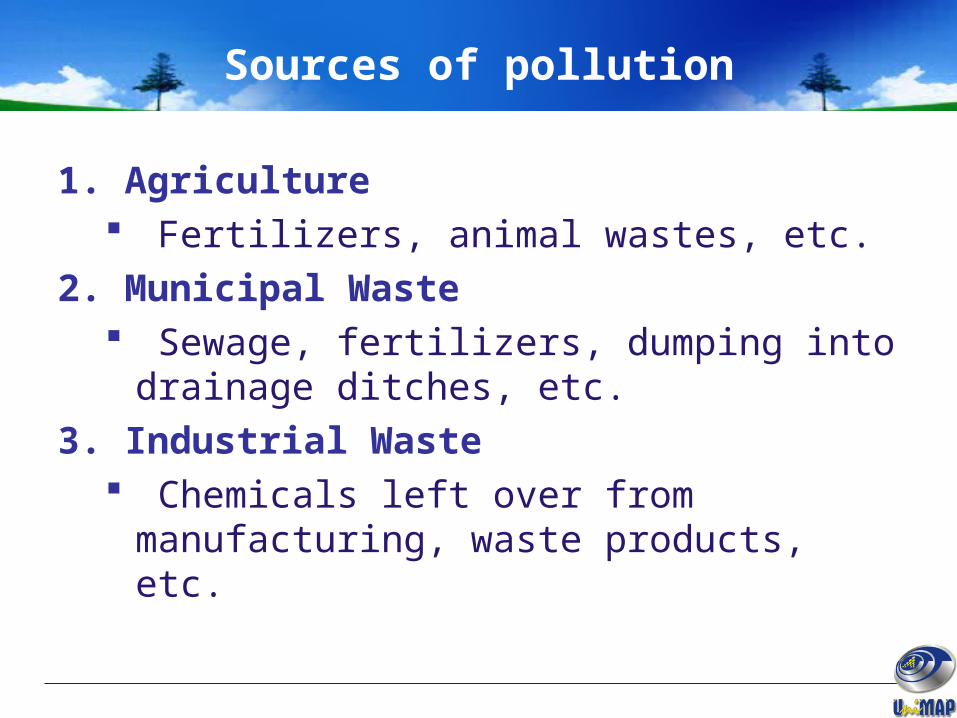
Sources of pollution
1. Agriculture Fertilizers, animal wastes, etc.
2. Municipal Waste Sewage, fertilizers, dumping into drainage
ditches, etc.
3. Industrial Waste Chemicals left over from manufacturing,
waste products, etc.
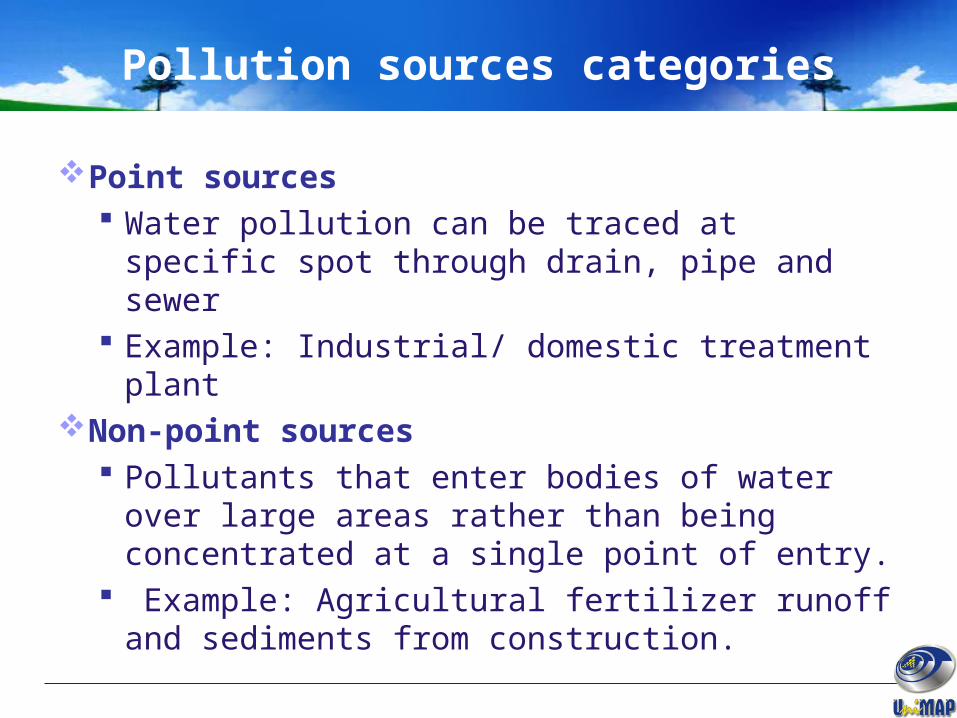
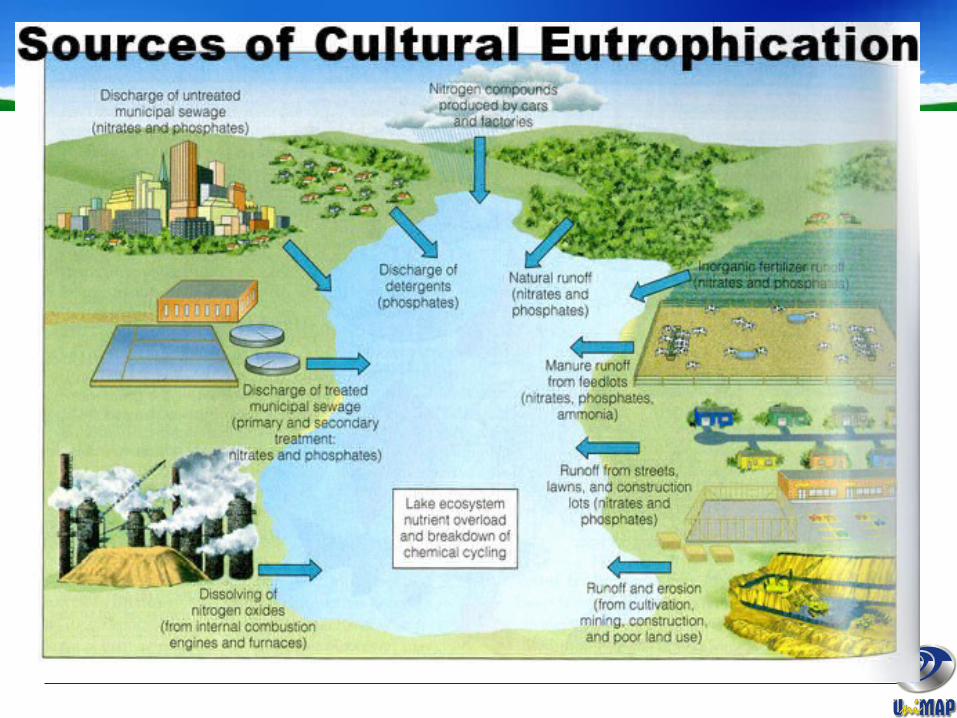
Pollution sources categories
Point sources Water pollution can be traced at specific spot
through drain, pipe and sewer Example: Industrial/ domestic treatment plant
Non-point sources Pollutants that enter bodies of water over
large areas rather than being concentrated at a single point of entry.
Example: Agricultural fertilizer runoff and sediments from construction.
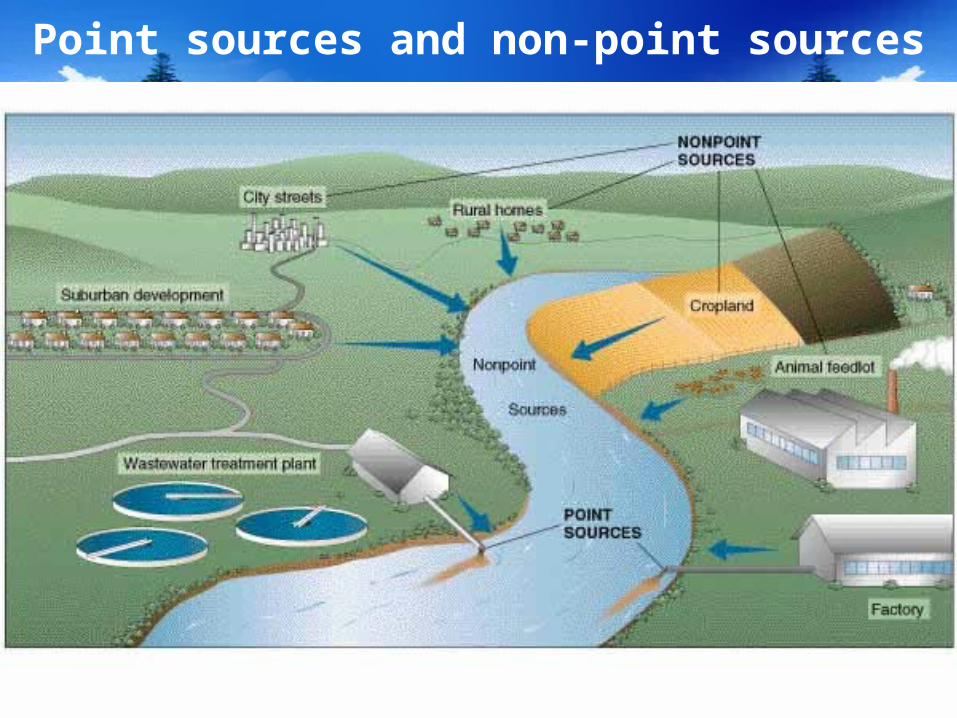
Point sources and non-point sources
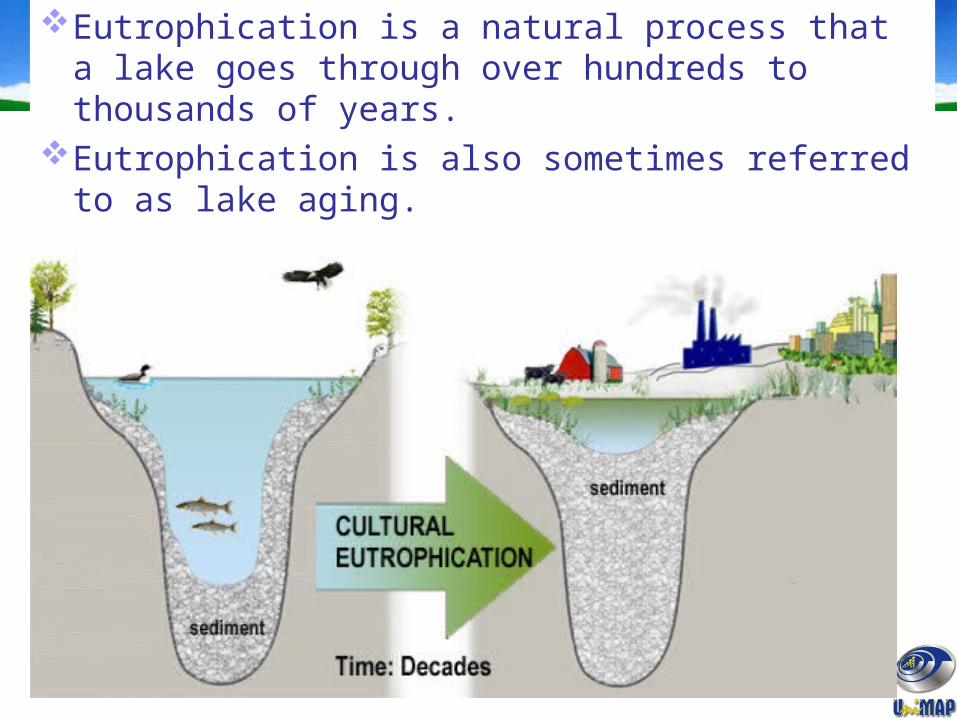
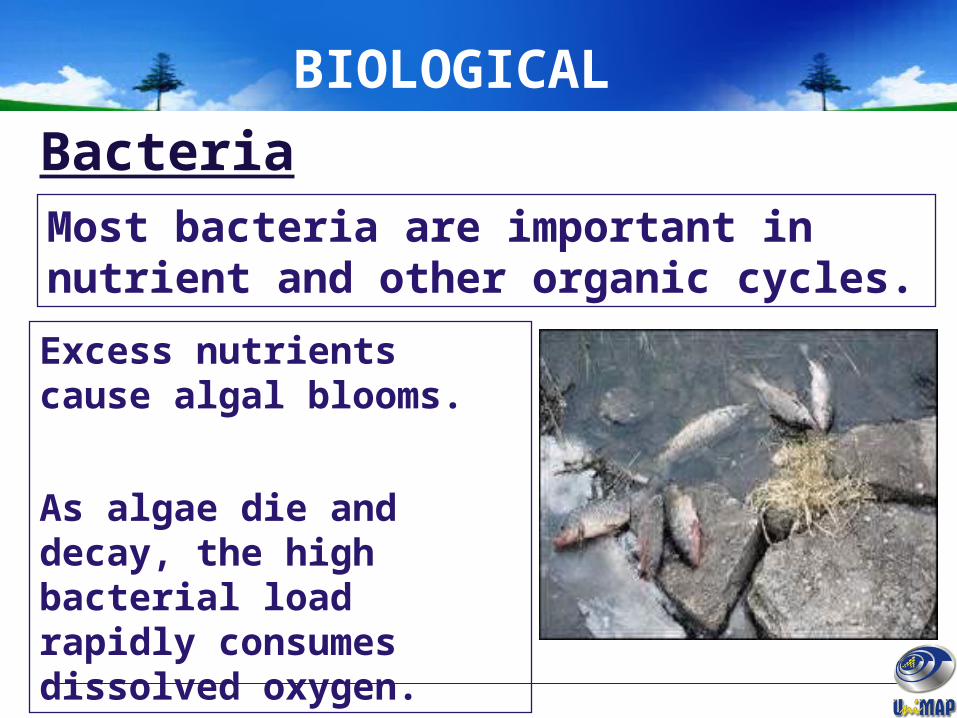
Eutrophication
Definition The enrichment of a lake or pond by inorganic
plant and algal nutrients such as phosphorus and nitrogen.
The additional nutrients are food for algae and fish, so the more eutrophic a lake is, the more living organisms it sustains.
When a lake becomes shallower from added sediment, even more plants can grow because the littoral area increases in overall percentage.
Eutrophication is a natural process that a lake goes through over hundreds to thousands of years.
Eutrophication is also sometimes referred to as lake aging.
Water Quality Indicator
PhysicalChemicalBiological
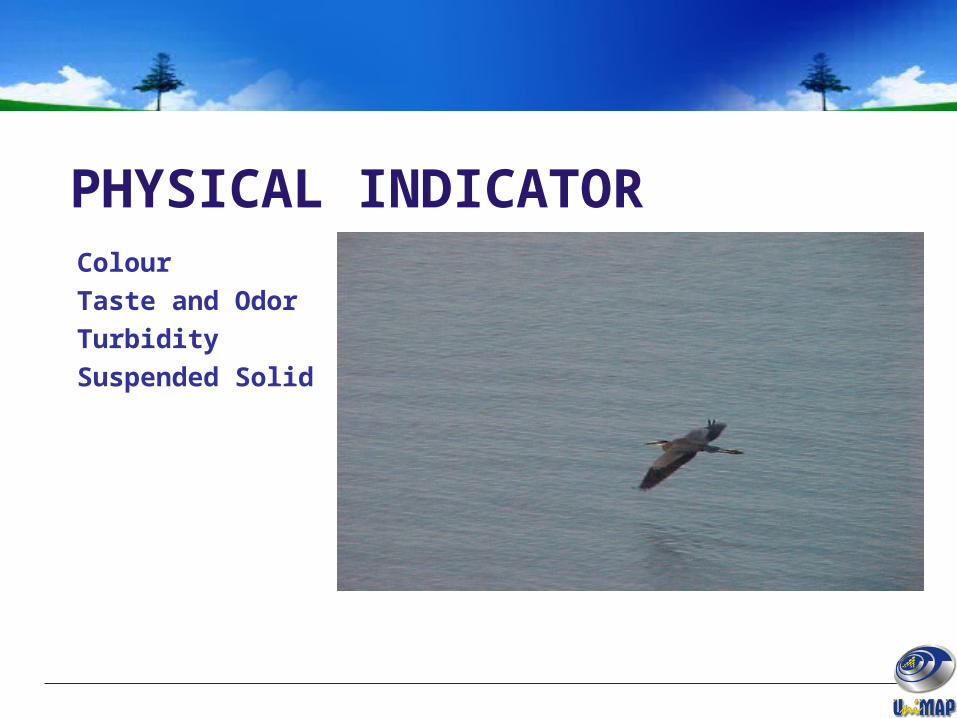
PHYSICAL INDICATOR ColourTaste and OdorTurbiditySuspended Solid
Colour
May be due to the presence of organic matter, metals (iron, manganese) or highly coloured industrial waste
Aesthetically displeasing
Taste and Odour
Mainly due to organic substances, biological activity, industrial pollution
Taste buds in the oral cavity specially detect inorganic compounds of metals like magnesium, calcium, sodium, copper, iron and zinc
Water should be free from objectionable taste and odour.
Turbidity
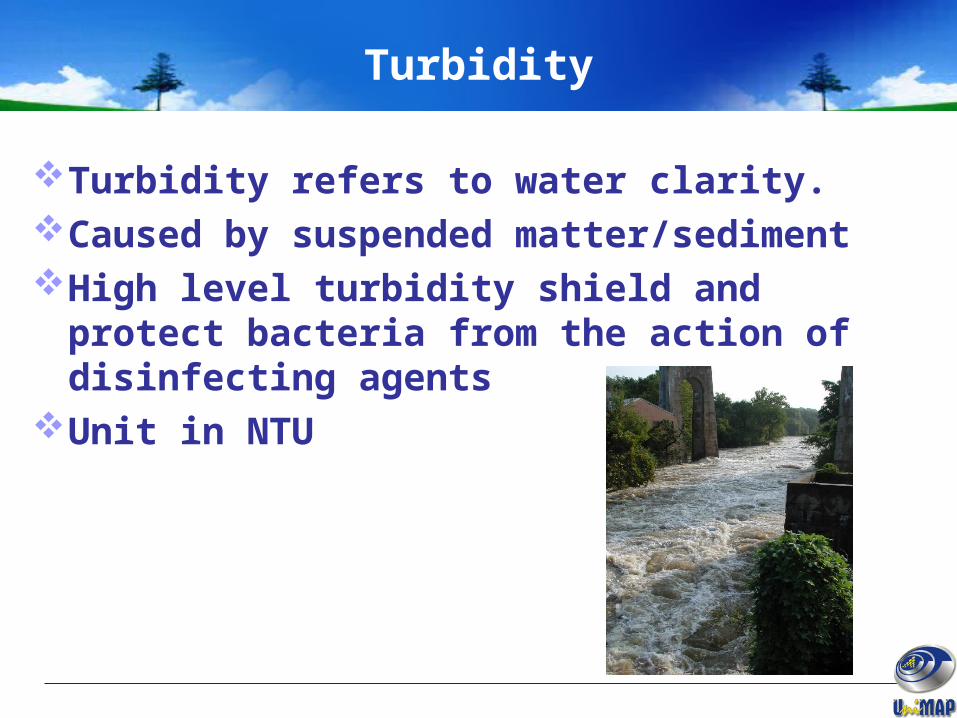
Turbidity refers to water clarity.Caused by suspended matter/sedimentHigh level turbidity shield and protect
bacteria from the action of disinfecting agents
Unit in NTU
Total Suspended Solid (TSS)
TSS is the measure of the sediment suspended in the
water.
TSS is related to turbidity.
Water with high TSS usually has high Total Dissolved Solids (TDS)
as well.
ORGANIC & CHEMICAL INDICATOR pHHardnessAlkalinity
Organic
Dissolved Oxygen (DO) The amount of oxygen gas dissolved in a
given volume of water at a particular temperature and pressure.
Organic
Biological Oxigen Demand (BOD) The amount of oxygen required by aerobic
microorganisms to decompose the organic matter in a sample of water, such as that polluted by sewage.
When BOD levels are high, dissolved oxygen (DO) levels decrease because the oxygen that is available in the water is being consumed by the bacteria.
Organic
Chemical Oxygen Demand (COD) A measure of the capacity of water to
consume oxygen during the decomposition of organic matter and the oxidation of inorganic chemicals such as ammonia and nitrite.
Another term that refers to COD is a measure of organic materials in a wastewater in terms of the oxygen required to oxidize the organic materials chemically.
pH
It is the measure of hydrogen ion concentration
Neutral water pH-7Acidic water has pH below 7 Basic water has pH above 7
Hardness
Capacity of water for reducing and destroying the lather of soap
It is total concentration of calcium and magnesium ions
Temporary hardness – Bicarbonates of Calcium and Magnesium
Permanent hardness – Sulphates, chlorides and nitrates of calcium and magnesium
Hardness
0 – 50 mg/l - soft50 – 150 mg/l - moderately hard150 – 300 mg/l - hard300 above - very hardSurface water is softer than ground
waterCauses encrustations in water supply
structures Note: heat can change hardness ->
forms scale on boilers, coffee pots
Alkalinity
Capacity to neutralise acidPresence of carbonates, bi-carbonates
and hydroxide compounds of Ca, Mg, Na and K
Alkalinity = hardness, Ca and Mg saltsAlkalinity > hardness - presence of
basic salts, Na, K along with Ca and Mg
Alkalinity < hardness – neutral salts of Ca & Mg present
Units expressed as CaCO32-
Iron
One of the earth’s most plentiful resource
High iron causes brown or yellow staining of laundry, household fixtures
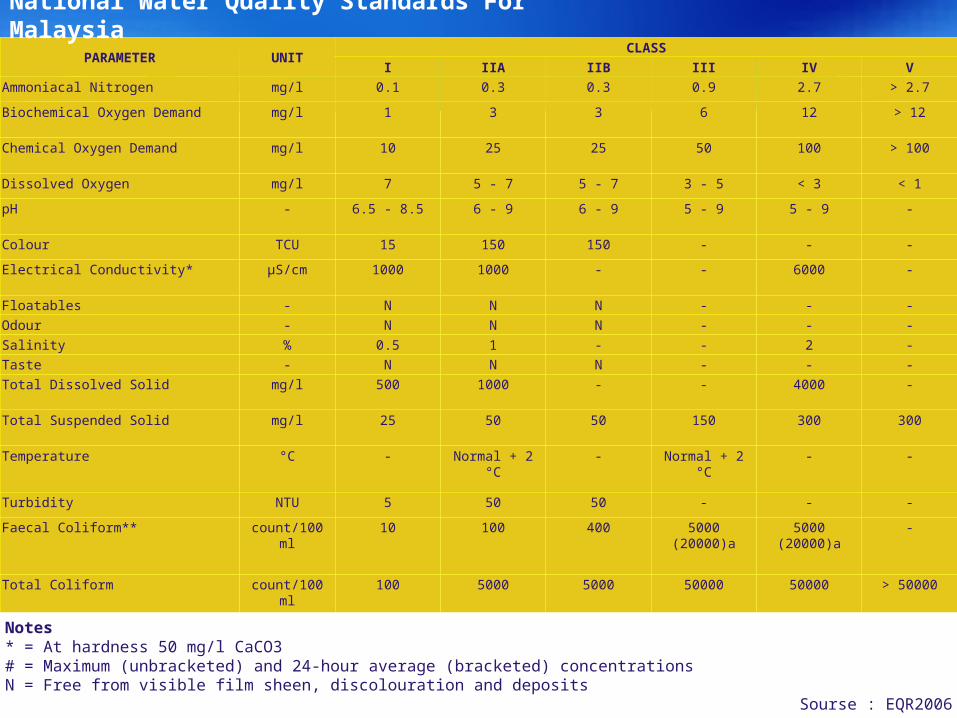
Total Coliform count/100 ml 100 5000 5000 50000 50000 > 50000
Notes* = At hardness 50 mg/l CaCO3# = Maximum (unbracketed) and 24-hour average (bracketed) concentrationsN = Free from visible film sheen, discolouration and deposits
Sourse : EQR2006
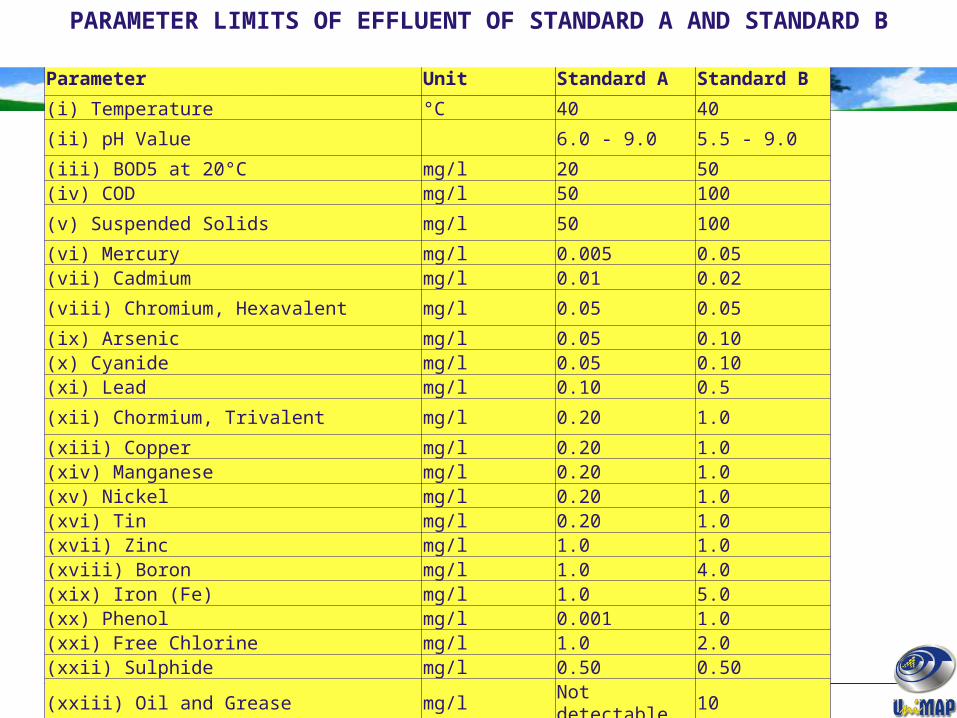
National Water Quality Standards For Malaysia
Parameter Unit Standard A Standard B(i) Temperature °C 40 40(ii) pH Value 6.0 - 9.0 5.5 - 9.0(iii) BOD5 at 20°C mg/l 20 50(iv) COD mg/l 50 100(v) Suspended Solids mg/l 50 100(vi) Mercury mg/l 0.005 0.05(vii) Cadmium mg/l 0.01 0.02(viii) Chromium, Hexavalent mg/l 0.05 0.05(ix) Arsenic mg/l 0.05 0.10(x) Cyanide mg/l 0.05 0.10(xi) Lead mg/l 0.10 0.5(xii) Chormium, Trivalent mg/l 0.20 1.0(xiii) Copper mg/l 0.20 1.0(xiv) Manganese mg/l 0.20 1.0(xv) Nickel mg/l 0.20 1.0(xvi) Tin mg/l 0.20 1.0(xvii) Zinc mg/l 1.0 1.0(xviii) Boron mg/l 1.0 4.0(xix) Iron (Fe) mg/l 1.0 5.0(xx) Phenol mg/l 0.001 1.0(xxi) Free Chlorine mg/l 1.0 2.0(xxii) Sulphide mg/l 0.50 0.50
(xxiii) Oil and Grease mg/lNot detectable
10
PARAMETER LIMITS OF EFFLUENT OF STANDARD A AND STANDARD B
Water Treatment
Water Treatment
Water treatment is a process of removing contaminants from raw water to produce water that is chemically and bacteriological safe for human consumption.
The water must also be aesthetically acceptable, free from apparent turbidity, colour, objectionable taste and odour.
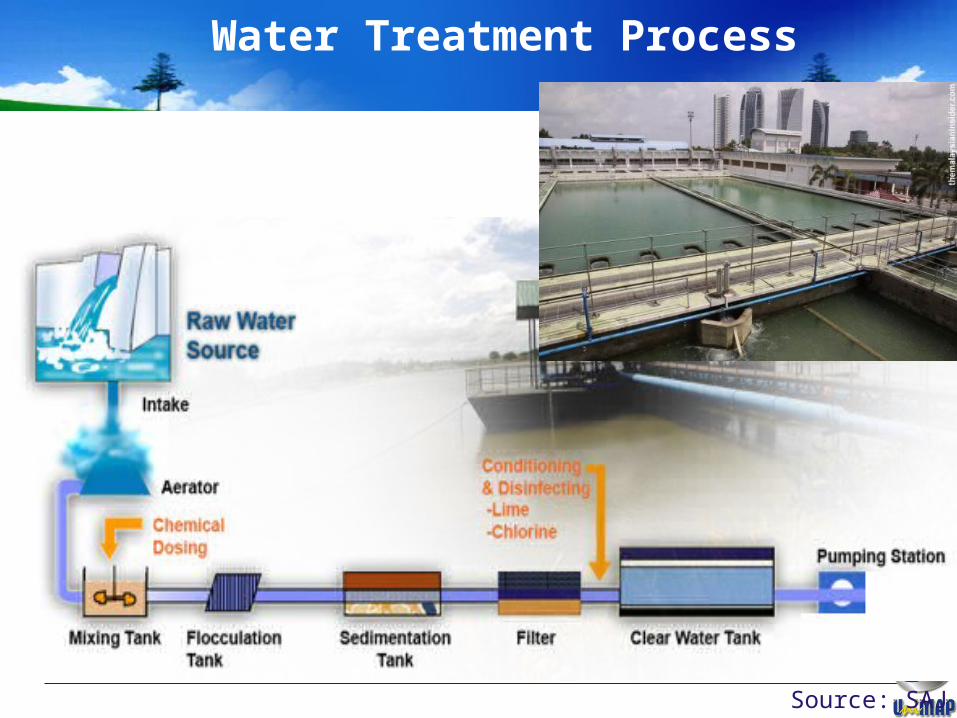
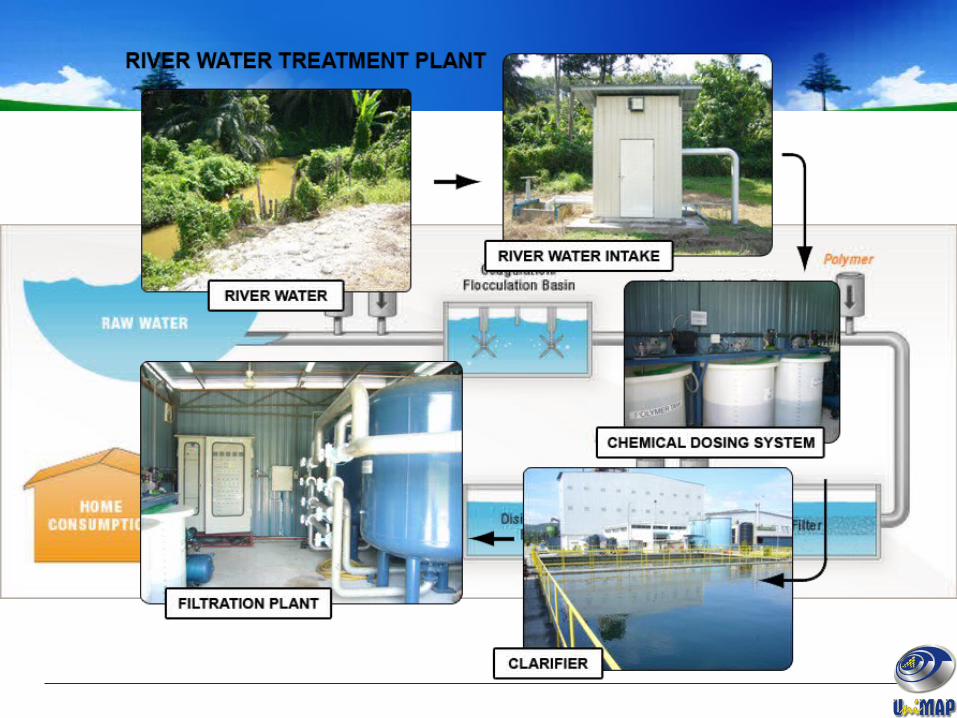
Water Treatment Process
Source: SAJ
Water Treatment Process
The conventional treatment plant comprises of the following processes:
1.Screening Floating debris such as woods, leaves,
aquatic plants and others are screened at the intake by coarse screen. After screening, the denser suspended matters are removed by allowing water to pass through chamber where it settles down to the bottom.
2. Aeration Raw water pumped from the intake is
mixed with air at the aerator. The aeration process provides oxygen from atmosphere for the oxidation of dissolved iron and manganese to their insoluble form thus enable their removal. The process also helps in the removal of taste and odour.
3. Coagulation / FlocculationCoagulants, usually alum, are added
leading to the formation of microscopic particles in water. This is followed by gentle agitation causing small particles in the water to collide and combine to become bigger settleable flocs.
4. SedimentationThe flocs are allowed to flow through the
sedimentation tank as uniform as possible for long enough period for them to settle. The clarified water will be collected from the top.
If the flocs are light, another process will apply. In this process minute air bubbles are introduced. The flocs will stick to the air bubbles and float to the top. The clarified water will be collected from the bottom.This process is called Dissolve Air Flotation.
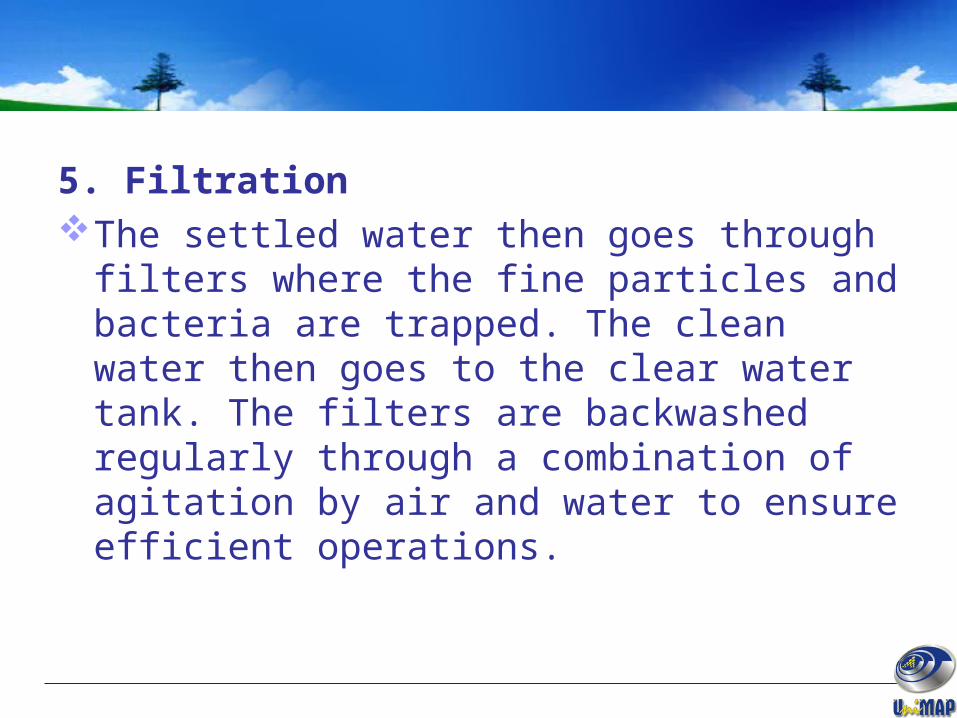
5. FiltrationThe settled water then goes through filters
where the fine particles and bacteria are trapped. The clean water then goes to the clear water tank. The filters are backwashed regularly through a combination of agitation by air and water to ensure efficient operations.
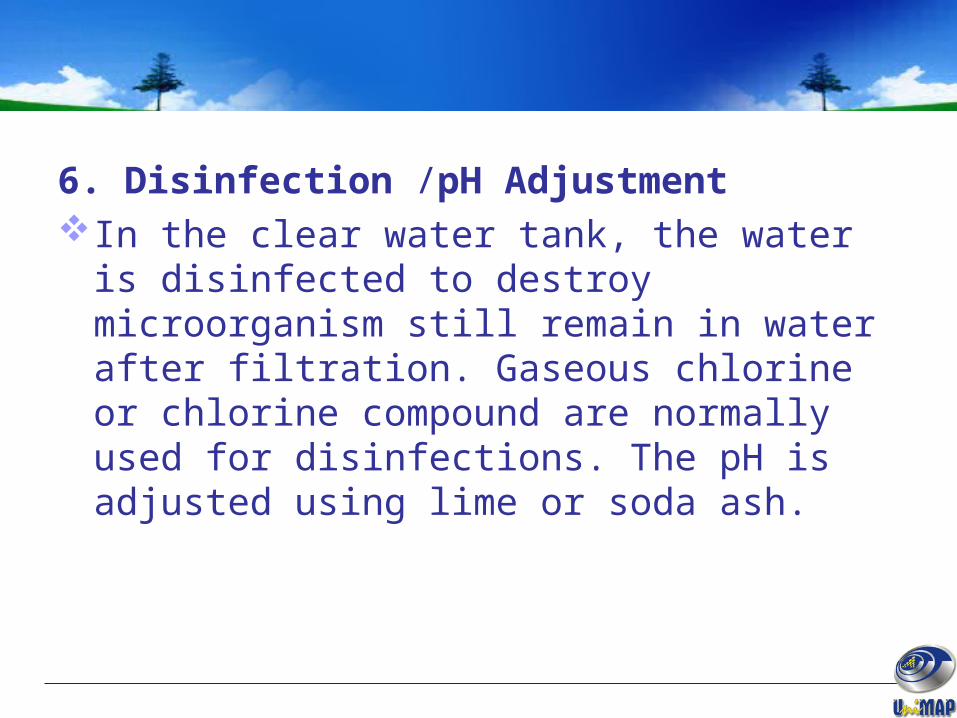
6. Disinfection /pH AdjustmentIn the clear water tank, the water is
disinfected to destroy microorganism still remain in water after filtration. Gaseous chlorine or chlorine compound are normally used for disinfections. The pH is adjusted using lime or soda ash.
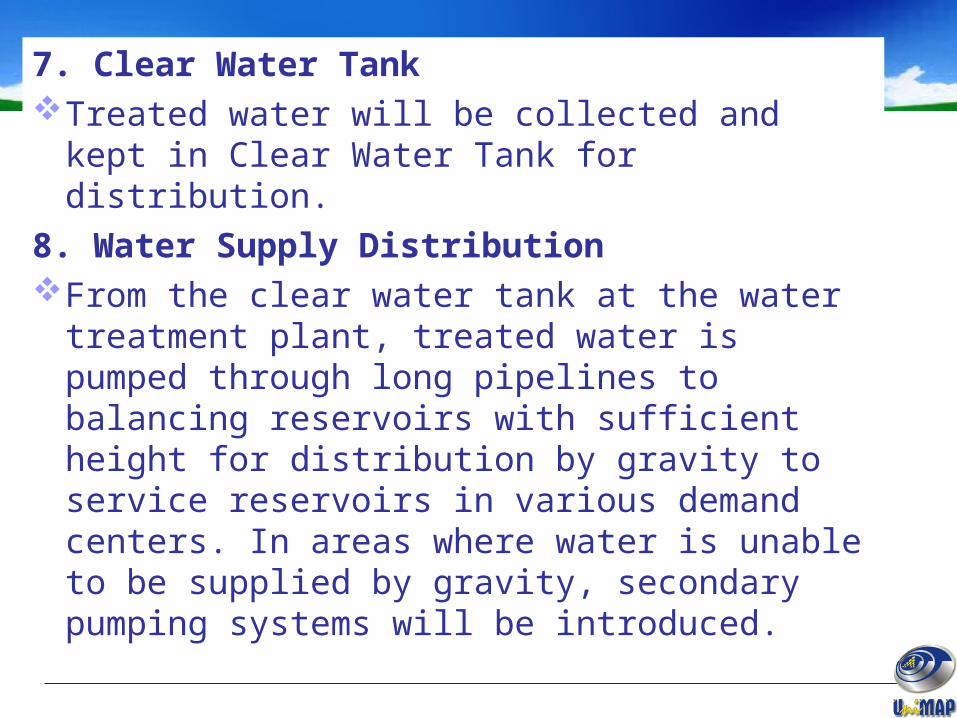
7. Clear Water TankTreated water will be collected and kept in
Clear Water Tank for distribution.8. Water Supply DistributionFrom the clear water tank at the water
treatment plant, treated water is pumped through long pipelines to balancing reservoirs with sufficient height for distribution by gravity to service reservoirs in various demand centers. In areas where water is unable to be supplied by gravity, secondary pumping systems will be introduced.
Alternative water quality treatment
Reverse Osmosis (RO)Membrane TreatmentUV SystemFiltration system