82
Publications of the Finnish Transport Infrastructure Agency 43/2019 ERTMS/ETCS LEVEL 2 CAPACITY BENEFITS ON THE CITY LINES OF THE HELSINKI REGION

Publications of the Finnish Transport Infrastructure Agency
43/2019
ERTMS/ETCS LEVEL 2 CAPACITY BENEFITS ON THE CITY LINES OF THE HELSINKI REGION

Alex Landex, Lars Wittrup Jensen, Anne Jokiranta, Maija Musto
ERTMS/ETCS level 2 capacity benefits on the city lines of the Helsinki Region
FTIA publications 43/2019
Finnish Transport Infrastructure Agency
Helsinki 2019

Cover photograph: Outi Jokela
Online publication pdf (www.vayla.fi) ISSN 2490-0745 ISBN 978-952-317-722-2
Finnish Transport Infrastructure Agency P.O. Box 33 FI 00521 HELSINKI Phone +358 (0)295 34 3000

FTIA publications 43/2019 3
Alex Landex, Lars Wittrup Jensen, Anne Jokiranta and Maija Musto: ERTMS/ETCS level 2 capacity benefits on the city lines of the Helsinki Region. Finnish Transport Infra-structure Agency. Helsinki 2019. FTIA publications 43/2019. 66 pages and 3 appendices. ISSN 2490-0745, ISBN 978-952-317-722-2. Key words: capacity, urban railway tracks, ERTMS/ETCS
Abstract The objective of the study was to analyse capacity benefits enabled by ERTMS/ ETCS level 2 on the Finnish city lines. ERTMS (European Rail Traffic Management System) and its ETCS (European Train Control System) are adopted by the European Union, aiming for an interoperable rail network in Europe, and the standard has since been adapted by many other countries outside Europe. Worldwide more than 95 000 km of tracks and 12 500 vehicles are contracted to be equipped with ERTMS/ETCS. The continuous supervision system ERTMS/ ETCS level 2 has traditionally been used for new high-speed lines, but an increasing number of conventional and suburban lines are being equipped with it. In the study the capacity differences between the automatic train protection systems; ATP-VR/RHK (JKV), ERTMS/ETCS level 1 and level 2 were studied on the city lines between Helsinki and Leppävaara as well as between Helsinki and Kerava. With ERTMS/ETCS level 2 it is possible to have shorter block sections and the location of block sections is more flexible as signal visibility is not required. This impacts the capacity and hence improved block sections has also been analysed for ERTMS/ETCS level 2. The evaluation of the results was done by comparing the minimum headways and capacity consumption between JKV and ERTMS/ETCS levels 1 and 2 with existing block section and ERTMS/ETCS level 2 with improved block sections. The capacity analyses are based on blocking times. With the existing block sections the headway times for ERTMS/ETCS are generally slightly longer than JKV due to the system delays. However, when block sections are improved, there is a significant improvement in capacity with ERTMS/ETCS level 2. The improvement in minimum line headway for the main line towards Kerava is on average 28% from Helsinki and 36% towards Helsinki. For the Coastal line (Rantarata), the average improvement from Helsinki is 24% and towards Helsinki 14%. A general capacity improvement is expected with Level 2 due to continuous update of the movement authority for both existing and improved block sections. The continuous update provides more flexibility in the operation especially when delays occur. To gain significant capacity benefits, more and shorter block sections are needed which typically require a refurbish-ment or renewal of interlocking. ERTMS/ETCS level 2 allows for much shorter block sections than ERTMS/ETCS level 1 and JKV (even if JKV is improved). Operation with shorter block sections has therefore, and due to time restrictions, not been analysed for ERTMS/ETCS level 1 and JKV. It is therefore to be expected that ERTMS/ETCS level 1 and JKV capacity can be improved with shorter block sections, although not to same level as ERTMS/ETCS level 2. Cost-benefit analysis between ERTMS/ETCS level 1 and 2 has not been part of the project.
FTIA publications 43/2019 4
One of the findings of the analysis was, that between Helsinki and Hiekkaharju the service can be operated with 3.75 minute planned headways all hours, keeping the capacity consumption below the recommendation of the Inter-national union of railways UIC (Fr. “Union Internationale des Chemins de fer”), 70%, during off-peak hours. Between Helsinki and Huopalahti the capacity consumption is higher, but still below 85% which is UIC’s recommendation for the maximum capacity consumption in peak hours.
In the analysis it was found, that for existing block sections, the main bottle-necks arise from long block sections with one or more stops in each as well as long approach times. Furthermore, Helsinki is limiting the capacity with ERTMS/ETCS level 2 and improved block sections due to the conflicting movements of trains at Helsinki and longer dwell times. Further improvements at Helsinki could improve capacity, especially for Coastal line (Rantarata) trains.

FTIA publications 43/2019 5
Alex Landex, Lars Wittrup Jensen, Anne Jokiranta ja Maija Musto: ERTMS/ETCS-tason 2 kapasiteettihyödyt Helsingin seudun kaupunkiraiteilla. Väylävirasto. Helsinki 2019. Väyläviraston julkaisuja 43/2019. 66 sivua ja 3 liitettä. ISSN 2490-0745, ISBN 978-952-317-722-2. Avainsanat: kapasiteetti, kaupunkirata, ETCS
Tiivistelmä
Selvitystyön tavoitteena oli tarkastella ERTMS/ETCS-tasolla 2 saavutettavia kapasiteettihyötyjä kaupunkiradoilla. ERTMS (eurooppalainen rautatieliikenteen hallintajärjestelmä, engl. European Rail Traffic Management System) ja sen ETCS (eurooppalainen junien kulunvalvontajärjestelmä, engl. European Train Control System) ovat Euroopan unionin ajamaa liikennepolitiikkaa, jolla pyritään yhtenäiseen eurooppalaiseen rautatiealueeseen, mutta vastaavia järjestelmiä on otettu käyttöön myös muissa maissa Euroopan ulkopuolella. ERTMS/ETCS-järjestelmiä tilattu yli 95 000 ratakilometrille maailmanlaajuisesti ja yli 12 500 veturia on tilattu ERTMS/ETCS-varusteluilla. Jatkuvatoimisen kulunvalvonnan järjestelmä ERTMS/ETCS taso 2 on käytössä pääosin suurnopeus radoilla, mutta myös joillain kaupunki- ja sekaliikenneradoilla. Nykyään ERTMS/ETCS tason 2 käyttöönottoja suunnitellaan myös tavanomaisille radoille ja kaupunkiradoille. Tutkimuksessa tarkasteltiin kapasiteettieroja eri junien kulunvalvontajärjestel-mien välillä; nykyisen junien kulunvalvonnan JKV:n, ERTMS/ETCS-tason 1 ja tason 2 välillä kaupunkiradoilla Helsingistä Leppävaaraan ja Keravalle. ERTMS/ ETCS tasolla 2 on mahdollista saavuttaa lyhyemmät suojastusvälit ja niiden sijoittelu on joustavampaa, sillä opastimien näkyvyys ei ole välttämätöntä. Tästä johtuen kapasiteettia tutkittiin myös lyhennetyillä suojastusväleillä ERTMS/ETCS tasolla 2. Tulosten arviointi tehtiin vertaamalla minimijunaväliä ja kapasiteetin käyttöä JKV:n ja ERTMS/ETCS tasojen 1 ja 2 välillä olemassa olevilla suojastusväleillä sekä parannetuilla suojastusväleillä tasolla 2. Kapasiteettiä analysoitiin juna-väliaikalaskennan avulla. Olemassa olevilla suojastusväleillä ERTMS/ETCS-tason 2 junavälit ovat tyypilli-sesti hieman pidemmät kuin JKV:lla järjestelmäviiveiden vuoksi. Kun suojastus-välejä parannetaan, saadaan kapasiteettia lisättyä huomattavasti ERTMS/ETCS tasolla 2. Minimijunaväli paranee pääradan kaupunkiraiteilla keskimäärin 28 prosenttia Helsingistä Keravalle ja 36 prosenttia Helsinkiin päin kuljettaessa. Rantaradan kaupunkiraiteilla keskimääräinen parannus Helsingistä poispäin on 24 prosenttia ja Helsinkiin päin kuljettaessa 14 prosenttia. ERTMS/ETCS tason 2 mahdollistaman jatkuvan kulunvalvonnan avulla saadaan lisähyötyjä sekä olemassa olevilla että parannetuilla suojastusväleillä. Jatkuvatoiminen kulun-valvonta mahdollistaa joustavuutta operointiin erityisesti häiriötilanteissa. Jotta hyödyt olisivat merkittävät, tulee suojastusvälejä parantaa ja optimoida, mikä edellyttää myös asetinlaitemuutoksia ja -uudistuksia. Taso 2 mahdollistaa lyhyemmät suojastusvälit kuin taso 1 tai nykyinen JKV, vaikka nykyisiä opastin-välejä olisi optimoitu. Projektin ajallisten rajoitteiden vuoksi liikennöintiä lyhennetyillä suojaväleillä ei analysoitu JKV:n ja ERTMS/ETCS tason 1 osalta. Voidaan olettaa, että myös niiden kapasiteettia voitaisiin parantaa opastinvälien lyhentämisellä, mutta ei yhtä merkittävästi kuin tasolla 2. Kustannus-hyöty-analyysi tasojen 1 ja 2 välillä ei kuulunut projektiin.
FTIA publications 43/2019 6
Analyysissä todettiin, että Helsingin ja Hiekkaharjun välillä voidaan liikennöidä tavoitellulla 3,75 minuutin vuorovälillä niin, että kapasiteetin käyttöaste on koko vuorokauden alle 70 prosenttia. Tämä on kansainvälisen rautatieliiton UIC:n (ransk. ”Union Internationale des Chemins de fer”) suositus kapasiteetin käyttö-asteelle ruuhka-aikojen ulkopuolella. Helsingin ja Huopalahden välillä kapasi-teetin käyttöaste on korkeampi, mutta alle 85 prosenttia, mikä on UIC:n suositun kapasiteetin käyttöasteelle ruuhkatunteina. Analyysin tuloksena saatiin, että olemassa olevilla suojastusväleillä suurimmat pullonkaulat ovat pitkät suojastusvälit, joissa on yksi tai useampi pysähdys ja pitkät lähestymisajat. Lisäksi Helsingissä suojastusvälien sijoittelu ERTMS/ETCS tasolla 2 on rajallista junien risteävien kulkuteiden ja pidempien asemapysäh-dysaikojen vuoksi. Lisäjärjestelyt Helsingissä voisivat parantaa kapasiteettia erityisesti Rantaradan liikenteessä.
FTIA publications 43/2019 7
Alex Landex, Lars Wittrup Jensen, Anne Jokiranta och Maija Musto: Kapacitetsnyttan av ERTMS/ETCS nivå 2 på stadsspår inom Helsingforsregionen. Trafikledsverket. Helsingfors 2019. Trafikledsverkets publikationer 43/2018. 66 sidor och 3 bilagor. ISSN 2490-0745, ISBN 978-952-317-722-2.
Sammanfattning Syftet med utredningsarbetet var att granska kapacitetsnyttan av ERTMS/ETCS nivå 2 på stadsbanor. ERTMS (det europeiska trafikstyrningssystemet för järn-vägen, eng. European Rail Traffic Management System) och ETCS (dess europeiska tågövervakningssystem, eng. European Train Control System) är trafikpolitik som förs av Europeiska unionen i syfte att skapa ett enhetligt järnvägsområde i Europa. Motsvarande system har införts också i andra länder utanför Europa. ERTMS/ETCS-system har beställts för mer än 95 000 ban-kilometer globalt och mer än 12 500 lok har beställts med ERTMS/ETCS-utrustning. Systemet ERTMS/ETCS nivå 2 för tågkontroll i kontinuerlig drift används huvudsakligen på banor avsedda för högre hastighet, men också på vissa stads- och blandtrafikbanor. Nuförtiden planeras införande av ERTMS/ ETCS nivå 2 också på sedvanliga banor och stadsbanor. I undersökningen granskades skillnader i kapacitet mellan tågkontrollsystem på olika tåg; det nuvarande tågkontrollsystemet av tåg mellan JKV, ERTMS/ETCS nivå 1 och nivå 2 på stadsbanorna från Helsingfors till Alberga och Kervo. Med ERTMS/ETCS nivå 2 är det möjligt att nå kortare blocksträckor och det går smidigare att placera ut dem, för det är inte nödvändigt att signalerna syns. På grund av detta undersöktes kapaciteten även på förkortade blocksträckor ERTMS/ETCS nivå 2. Av resultaten gjordes en utvärdering genom att jämföra det kortaste tåginter-vallet och kapacitetsutnyttjandet på blocksträckor mellan JKV och ERTMS/ETCS nivå 1 och 2 samt förbättrade blocksträckor på nivå 2. Kapaciteten analyserades med hjälp av en beräkning av tågintervaller. På existerande blocksträckor var tågintervaller enligt ERTMS/ETCS nivå 2 normalt en aning längre än enligt JKV på grund av systemförseningar. I och med att blocksträckorna förbättras, kommer kapaciteten att öka avsevärt enligt ERTMS/ETCS nivå 2. Det kortaste tågintervallet förbättras på stadsspåren på huvudbanan med i genomsnitt 28 procent från Helsingfors till Kervo och med 36 procent i riktning mot Helsingfors. På Kustbanans stadsbanor är den genom-snittliga förbättringen i riktning från Helsingfors 24 procent och i riktning mot Helsingfors 14 procent. Med hjälp av den kontinuerliga tågkontroll som ERTMS/ ETCS nivå 2 erbjuder får man ytterligare fördelar såväl med existerande som med förbättrade blocksträckor. Tågkontroll i kontinuerlig drift möjliggör flexibilitet i agerandet i synnerhet i störningssituationer. För att nyttan ska vara betydande, bör blocksträckorna förbättras och optimeras, vilket även förut-sätter att ställverk ändras och förnyas. Nivå 2 möjliggör kortare blocksträckor än nivå 1 eller nuvarande JKV, även om nuvarande signalsträckor skulle ha optimerats. På grund av tidsmässiga begränsningar med projektet analyserades inte trafik med förkortade blocksträckor i fråga om JKV och ERTMS/ETCS nivå 1. Man kan anta att även deras kapacitet kunde förbättras med en förkortning av signalsträckor, men inte på ett lika betydande sätt som på nivå 2. En kostnads-nyttoanalys mellan nivåerna 1 och 2 ingick inte i projektet.
FTIA publications 43/2019 8
I analysen konstaterades att man mellan Helsingfors och Sandkulla kan trafikera med en önskvärd turtäthet på 3,75 minuter, så att kapacitetsutnyttjandet ligger under 70 procent under hela dygnet. Detta är internationella järnvägsunionen UIC:s (fr. “Union Internationale des Chemins de fer”) rekommendation om kapacitetsutnyttjande utanför rusningstider. Mellan Helsingfors och Hoplax är kapacitetsutnyttjandet högre, men under 85 procent, vilket är det kapacitets-utnyttjande som UIC gynnar under rusningstimmar. Resultatet av analysen utvisade att de största flaskhalsarna i fråga om existerande blocksträckor var långa blocksträckor med ett eller flera uppehåll och långa retardationstider. I Helsingfors är dessutom placeringen av block-sträckor enligt ERTMS/ETCS nivå 2 begränsad på grund av gångvägar som korsar tågen och längre stationsuppehåll. Tilläggsarrangemang i Helsingfors kunde förbättra kapaciteten i synnerhet i trafiken på Kustbanan.

FTIA publications 43/2019 9
Prologue The Finnish Transport Infrastructure Agency (FTIA) carried out a previous related study: “Capacity benefits of ERTMS/ETCS Level 2 on double-track lines” back in 2018. It revealed that the ERTMS/ETCS level 2 is not a philosopher's stone in increasing capacity in mix freight and passenger traffic typical on Finnish double track lines. As the city commuter traffic is more homogeneous in terms of speed, the need for studying further the capacity benefits was recognised. Especially Helsinki Region Transport (HSL) was eager to study this subject, so this study was launched in late 2018. Due to the limitations of time, this study does not contain comparable results with all train control systems the JKV, the ERTMS/ETCS level 1 and 2, but instead it studied the improved block sections only for the ERTMS/ETCS level 2, which has most flexible possibilities for them. Somewhat similar capacity improvements can be realised for JKV by using shortened block sections and additionally for ERTMS/ETCS level 1 by using infill functionalities. The main writers of the study were Alex Landex (Chief Consultant Capacity Analysis at Rambøll Danmark), Lars Wittrup Jensen (Consulting Engineer at Rambøll Danmark), Anne Jokiranta (Project Manager at Ramboll Finland) and Maija Musto (Team Leader at Ramboll Finland). At the FTIA the study was steered by Aki Härkönen (Head of Railway Maintenance Services). As the availability of persons writing the study changed during the project, it was agreed, that the report is exceptionally written in English. During the study, several workshops were arranged, and they had active participants from HSL, Finrail, FTIA, Rambøll, VR Group and VR FleetCare. Helsinki, October 2019 Finnish Transport Infrastructure Agency Maintenance department, Railway Maintenance Services
FTIA publications 43/2019 10
Table of Contents DEFINITIONS ............................................................................................................................... 13
1 INTRODUCTION ............................................................................................................. 15
2 ERTMS/ETCS ROLLOUT .............................................................................................. 16 2.1 ERTMS/ETCS on suburban rail networks ............................................................ 16 2.2 ERTMS/ETCS in Europe ............................................................................................. 17 2.3 Implementation of ERTMS/ETCS Level 2 in the Nordics ................................ 18
2.3.1 Sweden............................................................................................................... 18 2.3.2 Denmark ............................................................................................................ 18 2.3.3 Norway ............................................................................................................... 18
2.4 ETCS in Finland ............................................................................................................. 19 2.4.1 Functional requirements specifications ................................................. 19 2.4.2 National values ............................................................................................... 19 2.4.3 Implementation plans ................................................................................... 19 2.4.4 On-board equipment of Rolling Stock .................................................... 20 2.4.5 Data transfer network .................................................................................. 21
3 CAPACITY ON ERTMS/ETCS ..................................................................................... 22 3.1 Definition of capacity ................................................................................................ 22 3.2 Differences of ERTMS/ETCS levels 1, 2 and 3 ....................................................23 3.3 Capacity benefits of ERTMS/ETCS ......................................................................... 25 3.4 Factors affecting capacity ....................................................................................... 26
3.4.1 Signal distances ............................................................................................. 26 3.4.2 ERTMS/ETCS Braking curves and comparison with JKV .................. 28 3.4.3 Response times .............................................................................................. 30
3.5 Transition between ERTMS/ETCS levels ............................................................. 31
4 CASE STUDIES ...............................................................................................................33 4.1 System description .....................................................................................................33
4.1.1 HelsinkiKerava ............................................................................................. 34 4.1.2 Helsinki–Leppävaara .................................................................................... 34 4.1.3 Helsinki railway yard ..................................................................................... 35
4.2 Preconditions, assumptions and exclusions ..................................................... 36 4.2.1 Infrastructure ................................................................................................. 36 4.2.2 System delays ................................................................................................. 37 4.2.3 Rolling stock ..................................................................................................... 37 4.2.4 Braking Curves ................................................................................................. 37 4.2.5 Human Factors ............................................................................................... 38 4.2.6 Dwell times ...................................................................................................... 38 4.2.7 Technical turnaround times in ERTMS/ETCS ....................................... 38
4.3 Method ........................................................................................................................... 39 4.3.1 Blocking time method .................................................................................. 39 4.3.2 Model ................................................................................................................ 40 4.3.3 Improved Block Section layout ................................................................. 40 4.3.4 Evaluation ......................................................................................................... 41
4.4 Analysis part 1 – Verifying parameters for the analysis ............................... 42 4.4.1 ERTMS/ETCS and JKV braking curves ..................................................... 42 4.4.2 Release speed ................................................................................................. 43 4.4.3 Arrive on red/green – effect on headway and running times ........ 44
FTIA publications 43/2019 11
4.5 Analysis part 2 Case studies – minimum headways and capacity consumption ................................................................................................................ 45 4.5.1 Minimum headway ........................................................................................ 45 4.5.2 Capacity consumption ................................................................................. 49 4.5.3 Bottlenecks limiting the operation .......................................................... 50
5 ADDITIONAL STRATEGIES TO IMPROVE CAPACITY ............................................ 53 5.1 Factors impacting to the capacity ......................................................................... 53 5.2 Timetable ....................................................................................................................... 53 5.3 Dwell times ................................................................................................................... 54 5.4 Infill as a capacity increaser for ERTMS/ETCS level 1 ....................................56 5.5 Automatic Train Operation (ATO)...........................................................................56
6 SUMMARY AND CONCLUSIONS ...............................................................................59 6.1 Summary ........................................................................................................................59 6.2 Conclusions ...................................................................................................................59
REFERENCES ............................................................................................................................... 61 APPENDICES Appendix 1 Recommendation for further studies Appendix 2 Block sections Appendix 3 Detailed results LIST OF FIGURES Figure 1 The Core Network Corridors [20]. ............................................................. 17 Figure 2 UIC definitions of capacity [49] left and [50] right. ............................ 22 Figure 3 Reliability is the most influential parameter between
theoretical and practical capacity. .......................................................... 22 Figure 4 Visualization of operation of ERTMS/ETCS level 1 [23]. ....................23 Figure 5 Visualization of the operation of ERTMS/ETCS level 2 [23]. ........... 24 Figure 6 Visualization of the operation of ERTMS/ETCS level 3 [23]. ........... 24 Figure 7 Increase in capacity for the conventional main line. .......................... 25 Figure 8 Possibility to increase the amount of trains by decreasing
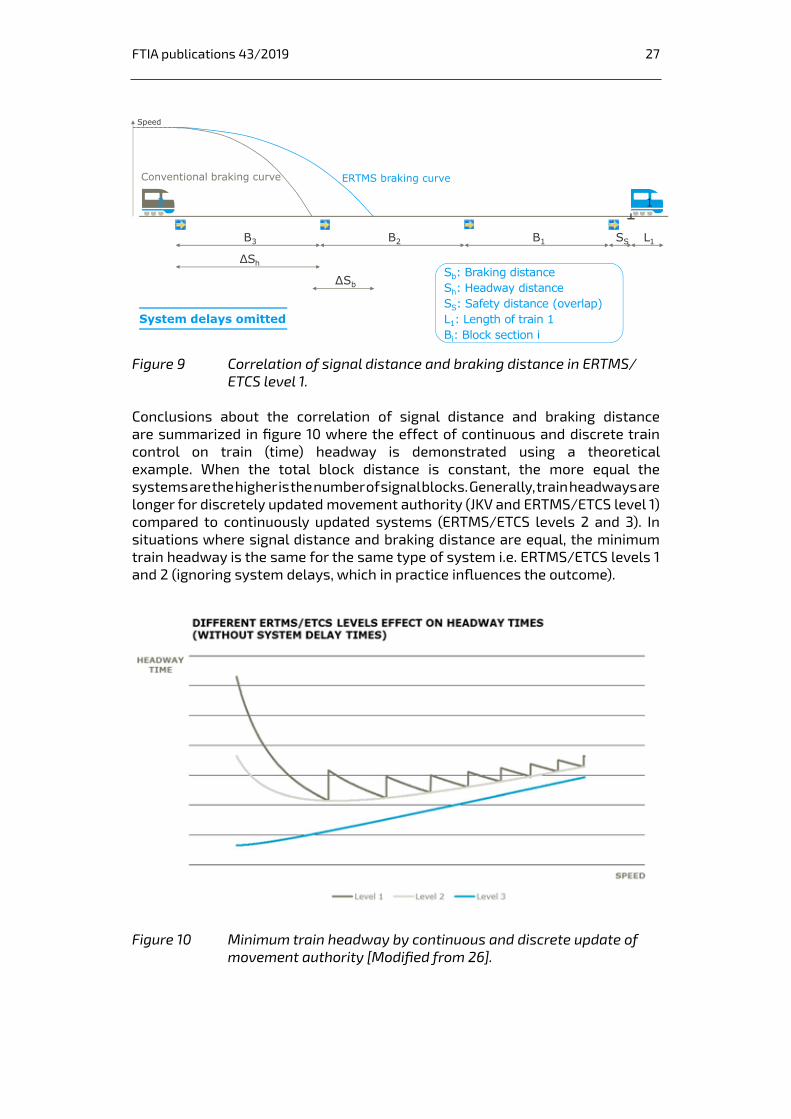
the minimum headway in homogenous traffic [2]. ............................ 26 Figure 9 Correlation of signal distance and braking distance in
ERTMS/ ETCS level 1. ..................................................................................... 27 Figure 10 Minimum train headway by continuous and discrete
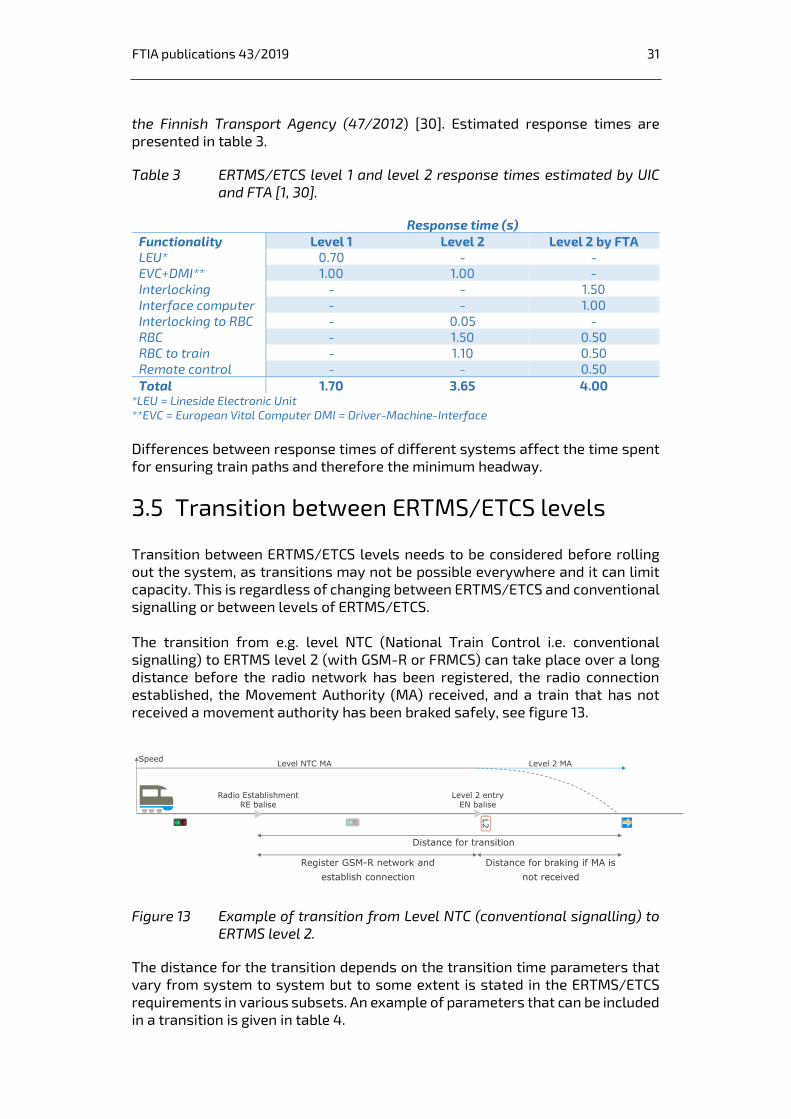
update of movement authority [Modified from 26]. ........................... 27 Figure 11 EBD curve and its related supervision limits [27]. .............................. 29 Figure 12 JKV braking curves and related supervision limits [28]. ................... 30 Figure 13 Example of transition from Level NTC (conventional
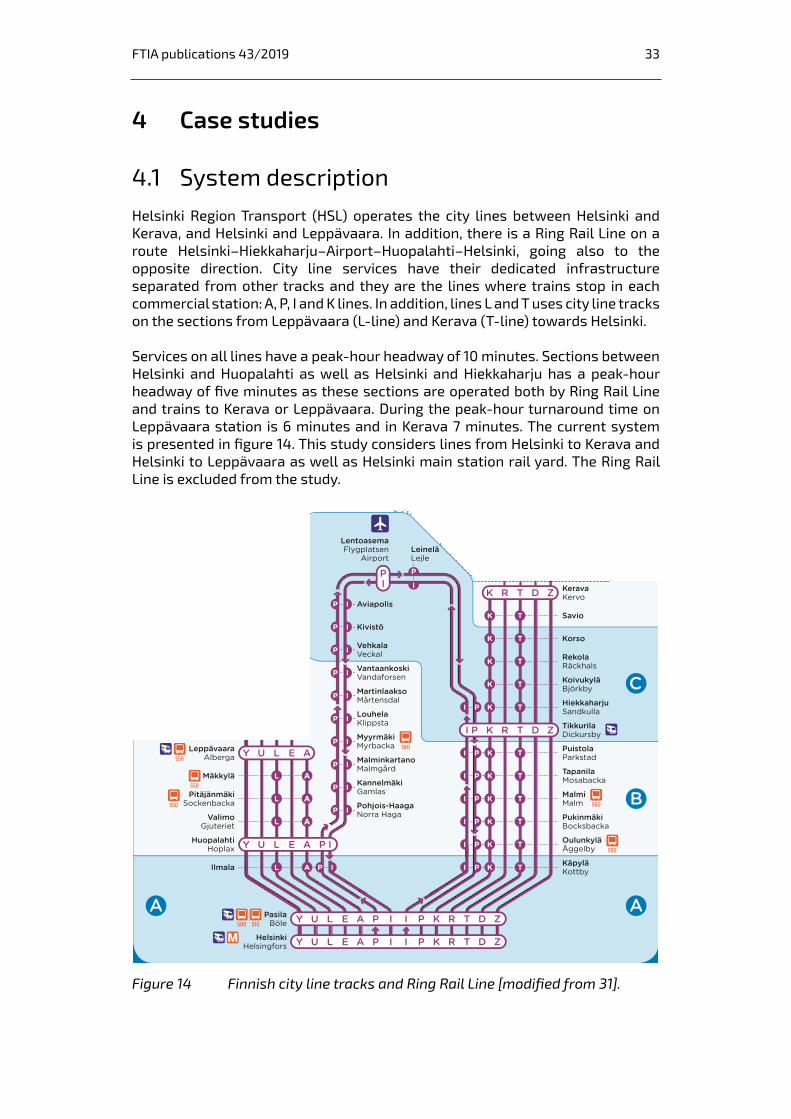
signalling) to ERTMS level 2. ...................................................................... 31 Figure 14 Finnish city line tracks and Ring Rail Line [modified from 31]. ........33 Figure 15 Helsinki–Kerava line map [32]. .................................................................. 34 Figure 16 Helsinki–Leppävaara line map [32]. ......................................................... 35 Figure 17 Speed profiles for Helsinki–Leppävaara with existing
signal/ marker board positions. ............................................................... 36 Figure 18 Speed profiles for Helsinki–Kerava with existing
signal/marker board positions. ................................................................ 36 Figure 19 Defining of train headway and blocking time of train path [48] ... 39
FTIA publications 43/2019 12
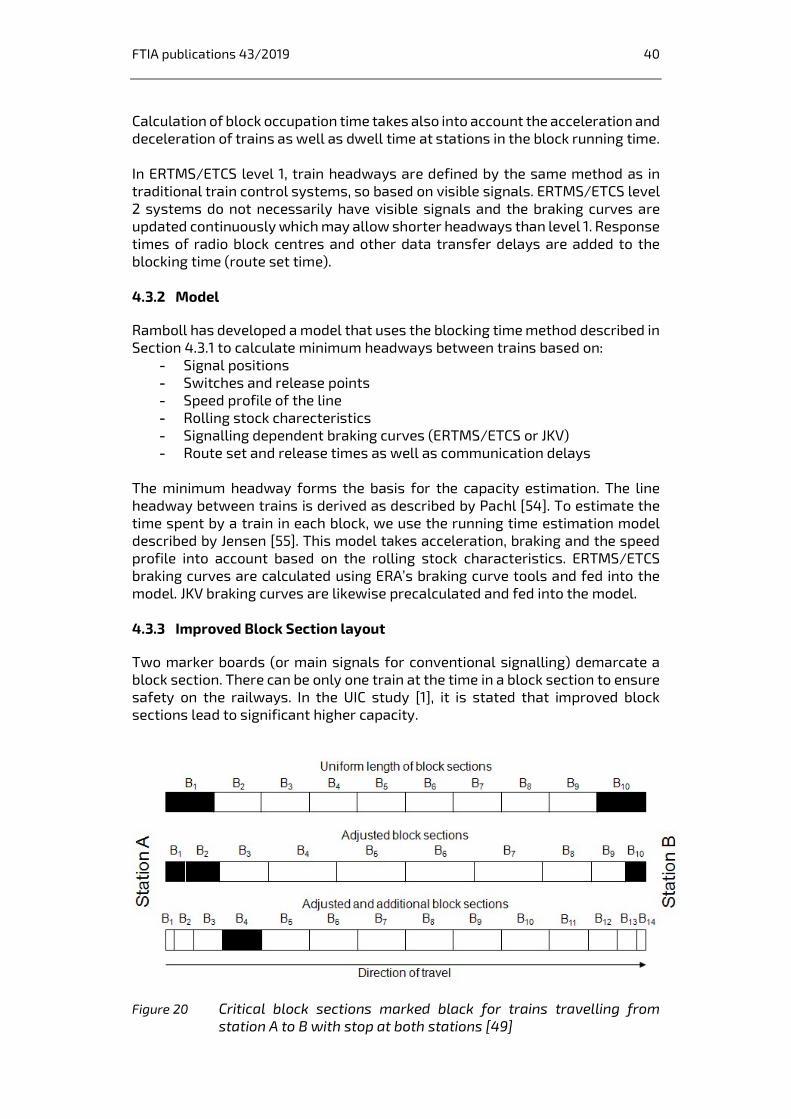
Figure 20 Critical block sections marked black for trains travelling from station A to B with stop at both stations [49] ........................... 40
Figure 21 ETCS braking curves for Sm5. .................................................................... 42 Figure 22 JKV braking curves for Sm5. ....................................................................... 42 Figure 23 Comparison of ERTMS/ETCS and JKV braking curves
for Sm5 used for the capacity analyses. ................................................ 43 Figure 24 Difference between release speeds (left: 15 km/h and
right: 40 km/h). .............................................................................................. 43 Figure 25 Difference arriving with continuous movement authority
(green) or movement authority ending at the end of the block section (red). ................................................................................................... 44
Figure 26 Signalling restricts (braking curves) braking increasing running times towards a stop. .................................................................. 45
Figure 27 Blocking stairs for a train to Kerava followed by a train to the airport and then another train to Kerava in Level 2 with existing block sections. ............................................................................... 46
Figure 28 Improvement in minimum line headway time for level 2 (without improved block sections) compared to JKV. ....................... 47
Figure 29 Improvement in minimum line headway time for level 2 with improved block sections compared to JKV. ................................. 48
Figure 30 Minimum line headway improvement in percent compared to JKV. ................................................................................................................ 48
Figure 31 Capacity consumption for the common section between Helsinki–Huopalahti and Helsinki–Hiekkaharju with ERTMS/ETCS level 2 and improved block sections. Capacity consumption numbers for JKV at 5 minutes frequency for reference. ................... 50
Figure 32 Main bottlenecks in JKV, ERTMS/ETCS levels 1 and 2 (marked purple) with existing block sections. Bottlenecks only applicable for JKV and ERTMS/ETCS level 1 are marked as red. ..... 51
Figure 33 Blocking stairs of two trains Helsinki–Kerava for level 2 with improved block sections. ................................................................... 52
Figure 34 Customer and capacity optimisation of the timetable [modified from 46]. ....................................................................................... 54
Figure 35 Time elements affecting the dwell time [40]. ...................................... 55 Figure 36 Principle of infill balises for ETCS Level 1 compared to
ETCS Level 2. ....................................................................................................56 Figure 37 Performance and Digitalisation of ATO Grades. ................................... 57 Figure 38 ERTMS/ETCS-ATO communications chart. ........................................... 58
FTIA publications 43/2019 13
Definitions
ATO: (Automatic Train Operation) ATO provides partial or complete automatic train piloting and driverless functionalities. Different not standardized ATO systems are subdivided into different grades of automation, see GoA. ATP-VR/RHK (Automatic Train Protection): Supplier and product neutral name of the current Finnish automatic train protection system (JKV). Automatic train protection or control ensures the following of speed limits and signals in rail traffic. If the driver does not react on speed limit or stopping signal on time, the ATP will do it automatically. System consists of on-board and track equipment. Balise: an electronic transponder placed between the rails. It is used for sending messages from the track-side automatic train control to the onboard equipment. CBTC: A CBTC system is a “continuous, automatic train control system utilizing high-resolution train location determination, independent of track circuits; continuous, high-capacity, bidirectional train-to-wayside data communications; and trainborne and wayside processors capable of implementing Automatic Train Protection (ATP) functions, as well as optional Automatic Train Operation (ATO) and Automatic Train Supervision (ATS) functions.”, as defined in the IEEE 1474 standard. DMI: Driver Machine Interface is the display and control panel in the train. EoM: End of Mission is a term used in ETCS to define when the train driver logs of the DMI to either shutdown the train or hand it over to another driver. ERA: European Union Agency for Railways. Formerly known as European Railway Agency. Founded 2004. The purpose of the agency is to form the technical specifications of interoperability, including ERTMS, and to promote the efficient operation of a uniform and borderless railway within Europe. The main tasks are to unify, register and supervise the technical specifications in the European railway network and define common safety requirements for the entire area. ERTMS: European Rail Traffic Management System. A European industrial project which aims for replacing of the national rail traffic management and automatic train control systems by a uniform interoperable system. The ERTMS has two basic parts: ETCS and GSM-R or in the future FRMCS. ETCS: European Train Control System, which will replace national train control systems in Europe. EVC: European Vital Computer is the on-board computer for ERTMS/ETCS. FRMCS. Future Railway Mobile Communication System is a worldwide railway telecommunication system designed by the UIC, in cooperation with the different stakeholders from the rail sector, as the successor of GSM-R. GoA: Grade of Automation: GoA 0: Manual operation, GoA 1: Non-automated operation (NTO), GoA 2: Semi-automatic operation (STO), GoA 3: Driverless operation (DTO), GoA 4: Unattended operation (UTO)
FTIA publications 43/2019 14
GSM-R: Global System for Mobile Communications – Railway. Radio system based on common GSM technology which uses frequencies reserved for railway traffic. GSM-R is used for creating a voice and data transfer connection between a train and its environment. JKV: The conventional national automatic train protection system used in Finland (Finnish Junien kulunvalvonta). LEU: Lineside Electronic Unit, encoder. MA: Movement Authority, a permission given to cross one or more block sections on the line. Marker board: In ETCS Level 2 marker boards replace conventional main signals. The position of the marker board defines the beginning of a block section. The signal aspect is only shown in the DMI. RBC: Radio Block Centre. Part of ERTMS/ETCS systems of levels 2 and 3. The task of RBC is to transmit permit to drive from interlocking to trains moving inside the area of the RBC. SoM: Start of Mission is a term used in ETCS to define when the train driver logs on the DMI to prepare the train for departure at the origin station. STM: Specific Transmission Module. An on-board equipment integrated into the EVC for reading the information supplied current national ATC or ATP system to the ERTMS/ETCS. TETRA: Terrestrial Trunked Radio; formerly known as Trans-European Trunked Radio. TETRA is a European Telecommunications Standards Institute (ETSI) standard. UIC: International union of railways, (Fr. Union Internationale des Chemins de fer). VIRVE: A TETRA (Terrestrial Trunked Radio) radio system used in Finland that has replaced GSM-R for railways.
FTIA publications 43/2019 15
1 Introduction
The current Finnish automatic train protection system (JKV) is planned to be replaced by the European Rail Traffic Management System (ERTMS) and its European Train Control System (ETCS). The main purpose of the ETCS is to implement a common European railway area, which that can open the rail signalling supply market and ease cross-border rail traffic within Europe. ERTMS/ETCS can be implemented in three different levels (level 1-3), where level 1 is the simplest level most like today’s signalling and level 3 is the most advanced system providing the most capacity. Level 3 is not yet fully commercialized as available products. In Finland the JKV system will be reaching the end of its lifecycle during 2020’s, which is the key driver to consider ERTMS/ETCS implementation in Finland [52]. In addition, ERTMS/ETCS has been considered as one possible solution to help increasing the capacity on the railways especially in the Finnish capital area. The aim of this work is to study the differences in capacity between the following systems on the city lines round Helsinki:
- The current JKV system with the current signalling layout - ETCS level 1 with the current signalling layout - ETCS level 2 with the current signalling layout - ETCS level 2 with improved signalling layout
The analyses are carried out on the city lines between Helsinki and Leppävaara as well as between Helsinki and Kerava where the benefits of ERTMS/ETCS is assumed to be high due to trains of the same type operating with the same stop pattern. Analysing the same signalling layout shows the differences in performance between the different systems. The ERTMS/ETCS level 2 makes it possibe to improve the signalling layout hence the capacity gain of improved block sections is analysed too for ERTMS/ETCS level 2 only. Due to the lack of time in the project, similar shorter block sections were not studied for the JKV and ERTMS/ETCS level 1. The results will be analysed and the main reasons causing variation between the systems will be described.

FTIA publications 43/2019 16
2 ERTMS/ETCS rollout
2.1 ERTMS/ETCS on suburban rail networks
There are altogether 95 589 km of ERTMS/ETCS equipped track contracted worldwide and 12 590 vehicles equipped with ERTMS/ETCS on-board systems [56]. While ERTMS/ETCS level 2 is mainly used for new high-speed lines, an increasing number of conventional and suburban lines are being equipped with ERTMS/ETCS level 2 to benefit from the capacity improvements it brings. Suburban networks in operation today with ERTMS/ETCS level 2 include the Thameslink Core area in central London. The Core area comprises five stations with a capacity of 24 trains per hour in each direction on the central part between Blackfriars and St. Pancras. ERTMS/ETCS level 2 operation has been introduced concurrently with new rolling stock on the network. [56] [57] In Spain a line of the Barcelona suburban network (Rodalies de Catalunya), a 56-kilometre-long section between L'Hospitalet de Llobregat and Mataró has been fitted with ERTMS/ETCS level 2. [56] [58] While there are not that many suburban lines (or mixed traffic lines with suburban traffic) with ERTMS/ETCS level 2 in operation today, several are planned or under implementation. Among others:
AUSTRALIA. Brisbane Suburban Network: 10.2 km new line across the river equipped with ERTMS/ETCS level 2 to be ready by 2024 [59]. Furthermore, the core part of the existing network is to be resignalled with ERTMS/ETCS level 2 between Milton and Northgate, a section with 11 stations. With the resignalling the capacity is increased by 20% (eight trains per hour). [60]
AUSTRALIA. Sydney Trains: Resignalling of the suburban network with ERTMS/ETCS level 2. The network consists of nine lines covering 813 kilo-meters of track and 175 stations. First lines to complete migration in the early 2020’s. [63]
UNITED KINGDOM. London: ERTMS/ETCS level 2 overlay to existing signalling Paddington-Heathrow/West Drayton under the Crossrail Project. ERTMS/ETCS signalling to be extended later to Maidenhead, Reading and Bristol. When Crossrail opens, trains are to operate under CBTC east of Paddington through central London. [56] [61] [62]
UNITED KINGDOM. ECML (East Coast Main Line): Resignalling of mixed traffic route. One of the first lines to be resignalled is the Moorgate branch that exclusive has suburban or metro traffic.
Several of the resignalling projects on the abovementioned suburban lines also include plans for ATO, e.g. Thameslink and Sydney Trains.

FTIA publications 43/2019 17
2.2 ERTMS/ETCS in Europe
Europe comprise the highest proportion of ERTMS/ETCS installations worldwide with 46% of the ETCS/ERTMS trackside contracts and 66% of vehicle onboard installations.
ERTMS/ETCS level 1 is already or is planned to be in operation in the following European countries: Austria, Belgium, Bulgaria, Croatia, Finland, France, Germany, Greece, Hungary, Italy, Luxembourg (full coverage of the net-work), North Macedonia, the Netherlands, Poland, Romania, Slovakia, Spain, Sweden, Switzerland (full coverage of the network with ERTMS/ETCS level 1 Limited Supervision). [19]
ERTMS/ETCS level 2 is already or is planned to be in operation in the following European countries: Austria, Belgium, Czech Republic, Denmark, France, Germany, Italy, the Netherlands, Norway, Poland, Romania, Slovakia, Spain, Sweden, Switzerland, United Kingdom. [19] The ERTMS European Deployment Plan has set deadlines for ERTMS/ETCS implementation along the main European rail routes. The Commission Implementing Regulation (EU) 2017/6 lays down timetable for ERTMS/ETCS deployments on nine core network corridors (CNC) connecting European cities to each other. These corridors are shown in figure 1. Finland is in two of the CNC’s; in Scandinavian-Mediterranean (SCM) and in North Sea- Baltic (NSB) corridor. [20]
Figure 1 The Core Network Corridors [20].
FTIA publications 43/2019 18
2.3 Implementation of ERTMS/ETCS Level 2 in the Nordics
2.3.1 Sweden
The Swedish National Implementation Plan for ERTMS/ETCS does not include which level of ERTMS/ETCS for the deployment strategy [64]. Level 2 technology has been chosen for the whole of Sweden, with exceptions of Level 1 being deployed at larger stations and railway yards with extensive shunting movements [12]. The first Swedish ERTMS/ETCS line was implemented to Bothnia line in 2010, altogether 190 km of new railway, with 140 bridges and 25 km of tunnels. Most of Swedish lines are expected to be equipped by 2035. [11]. A report “Nytt signalsystem för järnvägen – effektiviteten i införandet av ERTMS” was published in August 2018 by the Swedish National Audit Office Riksrevisionen [13]. The costs of the implementation have been much higher than anticipated. Previously the improvement of capacity was one of the key objectives of the project but the promised increase in capacity has not been realized. It has been found out that the same capacity improvements could be achieved with ATC system, although with greater cost. The results do indicate of increased reliability with ERTMS/ETCS. [13] 2.3.2 Denmark
Denmark has had challenges from many different and old train control systems, leading to an insufficient capacity and lack of knowledgeable maintenance staff. Therefore, the state-owned rail network infrastructure manager Banedanmark has decided to replace all the legacy systems with ERTMS/ETCS level 2, expecting to reach possible 25 % reduction in maintenance costs and 80% reduction on the signal-related delays. [14, 15] The first regional passenger services with ERTMS/ETCS level 2 started to operate between Lindholm (just north of Aalborg) and Frederikshavn on 21st October 2018 and is operated by Nordjyske Jernbaner. Banedanmark aims to complete the ETCS roll out by 2030. [16] Denmark has experienced problems rolling out the on-board equipment in the trains due to several stakeholders (operator, infrastructure manager and supplier) with different interests in the roll-out. It has furthermore, been more difficult than expected to equip the older trains with ERTMS/ETCS on-board system due to lack of space for the on-board equipment and variations within the same train types. 2.3.3 Norway
In Norway, the ERTMS/ETCS signalling system will be implemented to the main railway lines and Oslo S. The whole programme is due to be completed around 2034. The driver for the new signalling system is to update their current relay-based systems and a desire for early deployment of a country-wide Traffic Management System. The Norwegian rail network infrastructure manager Bane NOR has suggested a sequential ERTMS level 2 Baseline 3 implementation. [17, 18]
FTIA publications 43/2019 19
2.4 ETCS in Finland
2.4.1 Functional requirements specifications
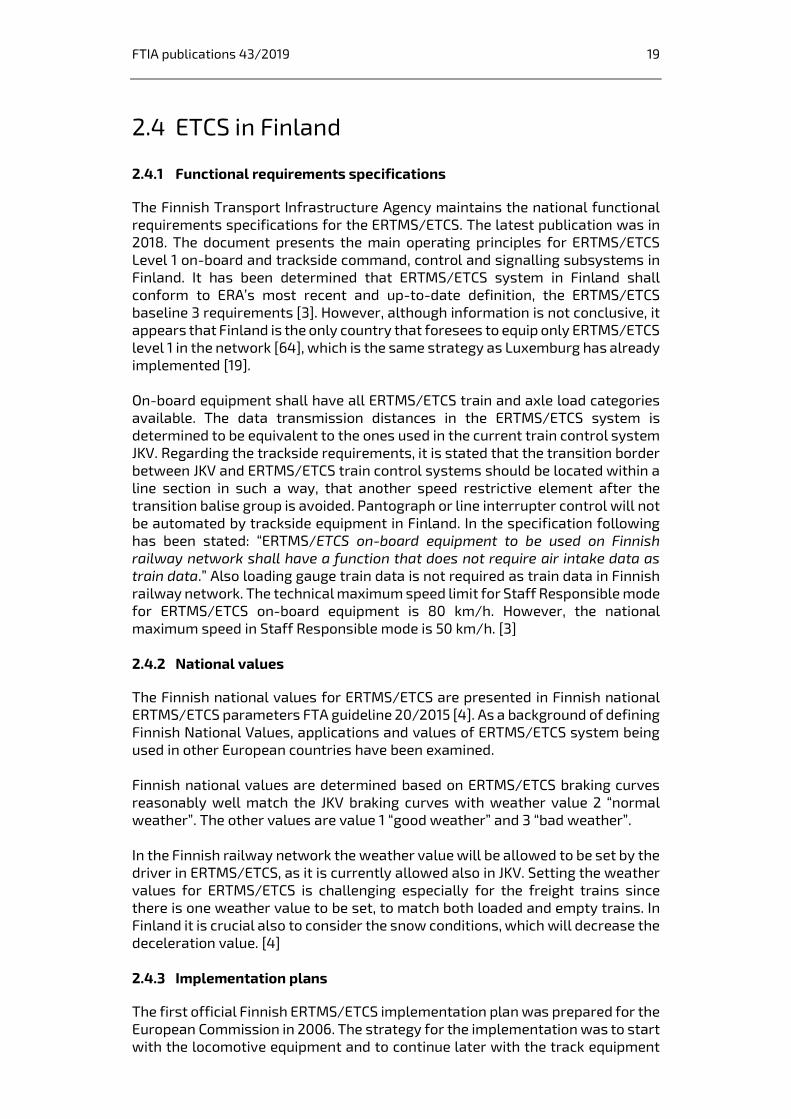
The Finnish Transport Infrastructure Agency maintains the national functional requirements specifications for the ERTMS/ETCS. The latest publication was in 2018. The document presents the main operating principles for ERTMS/ETCS Level 1 on-board and trackside command, control and signalling subsystems in Finland. It has been determined that ERTMS/ETCS system in Finland shall conform to ERA’s most recent and up-to-date definition, the ERTMS/ETCS baseline 3 requirements [3]. However, although information is not conclusive, it appears that Finland is the only country that foresees to equip only ERTMS/ETCS level 1 in the network [64], which is the same strategy as Luxemburg has already implemented [19]. On-board equipment shall have all ERTMS/ETCS train and axle load categories available. The data transmission distances in the ERTMS/ETCS system is determined to be equivalent to the ones used in the current train control system JKV. Regarding the trackside requirements, it is stated that the transition border between JKV and ERTMS/ETCS train control systems should be located within a line section in such a way, that another speed restrictive element after the transition balise group is avoided. Pantograph or line interrupter control will not be automated by trackside equipment in Finland. In the specification following has been stated: “ERTMS/ETCS on-board equipment to be used on Finnish railway network shall have a function that does not require air intake data as train data.” Also loading gauge train data is not required as train data in Finnish railway network. The technical maximum speed limit for Staff Responsible mode for ERTMS/ETCS on-board equipment is 80 km/h. However, the national maximum speed in Staff Responsible mode is 50 km/h. [3] 2.4.2 National values
The Finnish national values for ERTMS/ETCS are presented in Finnish national ERTMS/ETCS parameters FTA guideline 20/2015 [4]. As a background of defining Finnish National Values, applications and values of ERTMS/ETCS system being used in other European countries have been examined. Finnish national values are determined based on ERTMS/ETCS braking curves reasonably well match the JKV braking curves with weather value 2 “normal weather”. The other values are value 1 “good weather” and 3 “bad weather”. In the Finnish railway network the weather value will be allowed to be set by the driver in ERTMS/ETCS, as it is currently allowed also in JKV. Setting the weather values for ERTMS/ETCS is challenging especially for the freight trains since there is one weather value to be set, to match both loaded and empty trains. In Finland it is crucial also to consider the snow conditions, which will decrease the deceleration value. [4] 2.4.3 Implementation plans
The first official Finnish ERTMS/ETCS implementation plan was prepared for the European Commission in 2006. The strategy for the implementation was to start with the locomotive equipment and to continue later with the track equipment
FTIA publications 43/2019 20
when there would be enough rolling stock equipped with ETCS. The plan proposed implementation of GSM-R in rolling stock during 2008–2012, development and introduction of specific transmission module in 2013 as well as first sections to be equipped with ERTMS/ETCS during 2019–2025. [5] The new Finnish implementation plan of the ERTMS/ETCS was published in 2017 according to the Commission Regulation (EU) 2016/919, which obligates the Member States to draw up a national implementation plan, describing their actions to comply with the technical specification for interoperability (TSI). According to the Finnish national implementation plan of ERTMS/ETCS the deployment for railway network was due to begin with pilots during 2020–2023. After that the network would be equipped during 2024–2038 in six stages. Additionally, there was a plan to equip the remaining rolling stock with ERTMS/ETCS during 2025–2037. There were no binding decisions for the proposed timetable or the funding of the project. The strategy was to begin implementation with ERTMS/ETCS level 1 for less occupied lines and then study the benefits of the level 2 before implementing ERTMS/ETCS to the busy main lines in 2030s. [6] In 2019 the current Finnish implementation plan of the ERTMS/ETCS is being re-evaluated by a new study project launched by Minister of Transport and Communications in Finland with a more broad scope of digitalization. The study will be published in early 2020. 2.4.4 On-board equipment of Rolling Stock
Specification of the control, command and signalling, prepared by the Finnish Transport and Communications Agency Traficom, steers for early equipment of rolling stock. All the new operations have to follow 2016/919/EU Set of Specifications: Technical specification of the interoperability of control, command and signalling, meaning ERTMS Baseline 3 + GSM-R. The Traficom has prepared a regulation for the implementation of the ERTMS/ETCS equipment as follows:
- new rolling stock orders after 1.7.2015 - rolling stock refurbishments ordered after 1.1.2017 and - new or refurbished track equipment, which has been ordered after
1.1.2022 or implemented after 1.1.2025, must be equipped with ERTMS/ETCS. [7]
VR Group Ltd introduced the first locomotives equipped with ERTMS/ETCS in 2017. Locomotives of type Sr3 have been equipped with ERTMS/ETCS and STM, so they can be used in lines equipped with ERTMS/ETCS and JKV trackside systems. [8] Finnish Transport Infrastructure Agency (FTIA) built a test section on Kerava–Lahti line for the approval of rolling stock equipped with ERTMS/ETCS in 2015-2017. Test section is equipped with both ERTMS/ETCS level 1 and JKV. The section was given a permission from Traficom to test drive ERTMS/ETCS level, but not to operate commercial ERTMS/ETCS traffic on it. [9]

FTIA publications 43/2019 21
2.4.5 Data transfer network
In Finland the railway radio system GSM-R has been replaced by VIRVE network, which is based on TETRA technology. The shutdown of GSM-R is due to issues railway radio network has caused to the commercial radio networks, and vice versa. After the shutdown there is no separate radio network for railway traffic in Finland. [10]
FTIA publications 43/2019 22
3 Capacity on ERTMS/ETCS
3.1 Definition of capacity
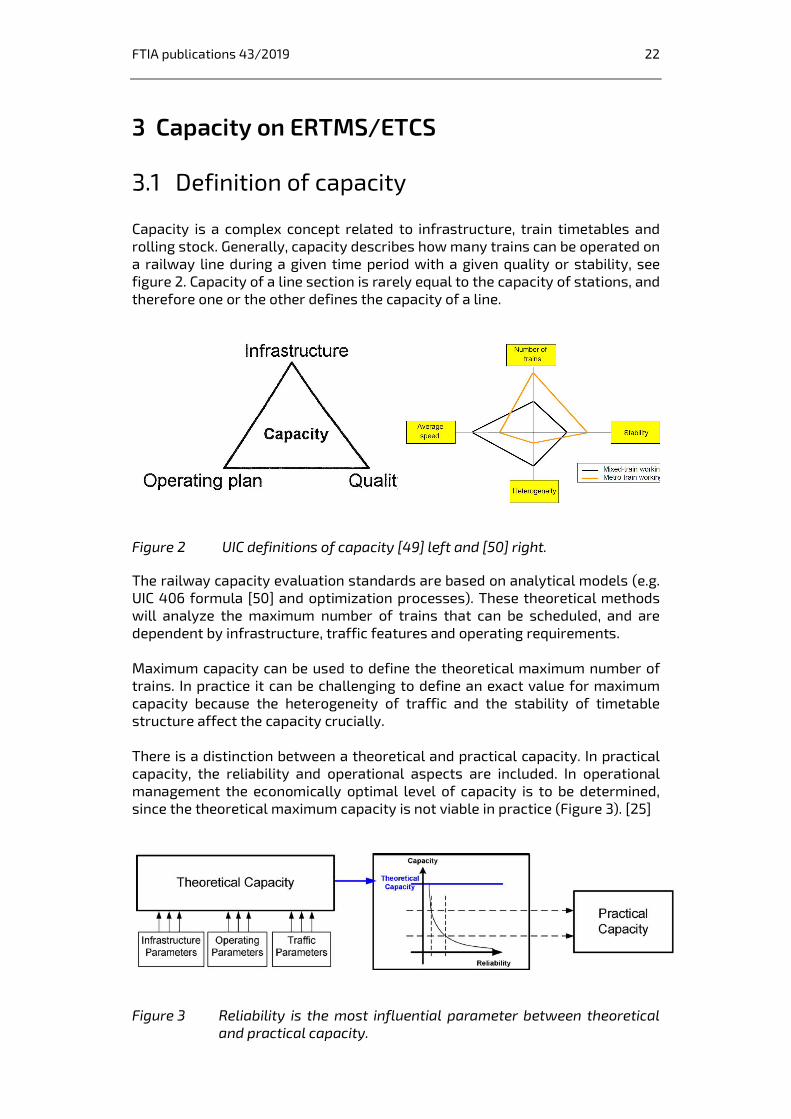
Capacity is a complex concept related to infrastructure, train timetables and rolling stock. Generally, capacity describes how many trains can be operated on a railway line during a given time period with a given quality or stability, see figure 2. Capacity of a line section is rarely equal to the capacity of stations, and therefore one or the other defines the capacity of a line.
Figure 2 UIC definitions of capacity [49] left and [50] right.
The railway capacity evaluation standards are based on analytical models (e.g. UIC 406 formula [50] and optimization processes). These theoretical methods will analyze the maximum number of trains that can be scheduled, and are dependent by infrastructure, traffic features and operating requirements. Maximum capacity can be used to define the theoretical maximum number of trains. In practice it can be challenging to define an exact value for maximum capacity because the heterogeneity of traffic and the stability of timetable structure affect the capacity crucially. There is a distinction between a theoretical and practical capacity. In practical capacity, the reliability and operational aspects are included. In operational management the economically optimal level of capacity is to be determined, since the theoretical maximum capacity is not viable in practice (Figure 3). [25]
Figure 3 Reliability is the most influential parameter between theoretical and practical capacity.

FTIA publications 43/2019 23
This report investigates the differences related to capacity between JKV and ERTMS/ETCS level 1 and level 2. There are several other aspects related to capacity, but this work considers only the capacity features that cause variation in capacity. These features are signal distances, braking curves and response times of the system.
3.2 Differences of ERTMS/ETCS levels 1, 2 and 3
Main differences of ERTMS/ETCS levels are related to the update of the movement authority (signal aspect). Level 1 has discrete update while level 2 has continuous update of the movement authority (signal aspect). In levels 1 and 2 the movement authority is based on fixed block sections. In ERTMS/ETCS Level 3, train monitors its own position and integrity continuously, introducing a “moving block” technology. [21] ERTMS/ETCS level 1 is similar to the current JKV system of Finland. In level 1 the movement authority of a train is updated discretely when train passes Euro-balises. The system requires visible signals and detection of track section occupation (figure 4). The on-board computer (EVC) continuously monitors and calculates the maximum speed and the braking curve from this data. The movement authority is given to the train by Eurobalises, making data trans-mission non-continuous. The main benefit with ERTMS/ETCS level 1 is the inter-operability between suppliers and countries. [22]
Figure 4 Visualization of operation of ERTMS/ETCS level 1 [23].
In ERTMS/ETCS level 2 the movement authorities are transmitted continuously from a radio block center (RBC) using the GSM-R network or similar like FRMCS (Figure 5). The system also requires detection of track section occupation using for example axle counters, but there is no need for visible signals. Balises are used to transmit fixed messages, relating to e.g. location, speed limit, gradient etc. Continuous data transfer allows improved capacity to discrete update of the movement authority in level 1, allowing the train to reach its optimal speed maintaining a safe braking distance. [21, 22]

FTIA publications 43/2019 24
Figure 5 Visualization of the operation of ERTMS/ETCS level 2 [23].
ERTMS/ETCS level 3 has also continuous train control like level 2. The significant difference is that there are no fixed blocks monitored using track circuits or axle counters. Thereby a single train forms its own moving block allowing increased capacity compared to level 2. The position of the train is reset by Eurobalises and odometer inside the train and this information is transmitted to the central control (Figure 6). ERTMS/ETCS level 3 needs reliable radio communication and a train integrity system to ensure the train is complete. These requirements have prevented implementation of pure ERTMS/ETCS level 3 systems. ERTMS/ETCS level 3 is not considered in this study. [21, 22]
Figure 6 Visualization of the operation of ERTMS/ETCS level 3 [23].
An overview of different functionalities for ERTMS/ETCS levels 1, 2 and 3 is presented in table 1. [24]

FTIA publications 43/2019 25
Table 1 Comparison of ERTMS/ETCS levels 1, 2 and 3 [24].
Level 1 Level 2 Level 3
Minimum block length
Short Short “No” blocks
Communication Discrete* Continuous Continuous
Signal visibility Usually needed Not needed No signals
Train detection in track
Needed Needed Limited (on train and switches)
Train integrity Not needed Not needed Crucial
Position known Block section Block section** “Exact” position
Gap in communication
– Possible Possible***
* Infill possible ** To some extent also to the exact balise *** Will result in longer headways
3.3 Capacity benefits of ERTMS/ETCS
UIC has engaged the RWTH Aachen University to study about influence of ERTMS/ETCS on line capacity. The results of the capacity analysis were based on UIC 406 and STRELE-formulas. A clear increase in capacity between ERTMS/ETCS levels 1 and 2 was observed in the case of high-speed lines with homogenous fast passenger traffic. There was only a slight increase in capacity compared to ERTMS/ETCS level 1 with level 2 in all cases; in high-speed line, conventional main line and regional line. It is stated that ETCS level 2 with 400 m block sections and ETCS level 3 have a high potential for capacity increase (Figure 7). [1]
Figure 7 Increase in capacity for the conventional main line.
FTIA publications 43/2019 26
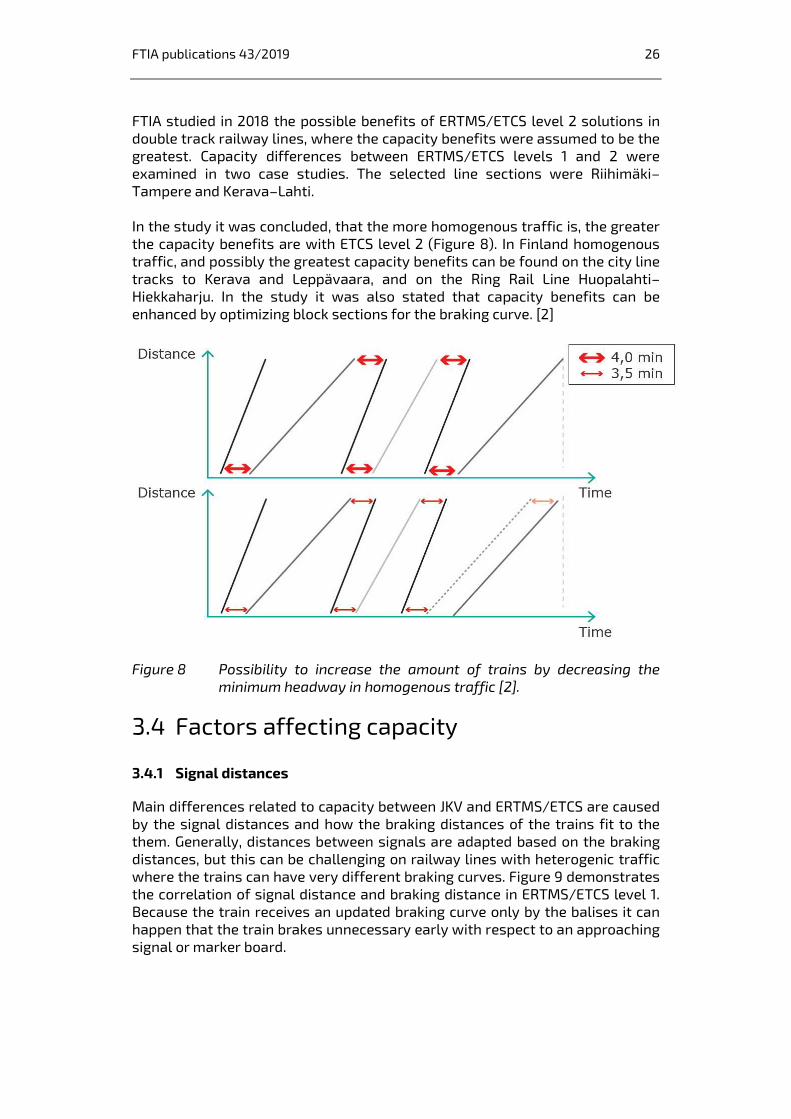
FTIA studied in 2018 the possible benefits of ERTMS/ETCS level 2 solutions in double track railway lines, where the capacity benefits were assumed to be the greatest. Capacity differences between ERTMS/ETCS levels 1 and 2 were examined in two case studies. The selected line sections were Riihimäki–Tampere and Kerava–Lahti. In the study it was concluded, that the more homogenous traffic is, the greater the capacity benefits are with ETCS level 2 (Figure 8). In Finland homogenous traffic, and possibly the greatest capacity benefits can be found on the city line tracks to Kerava and Leppävaara, and on the Ring Rail Line Huopalahti–Hiekkaharju. In the study it was also stated that capacity benefits can be enhanced by optimizing block sections for the braking curve. [2]
Figure 8 Possibility to increase the amount of trains by decreasing the minimum headway in homogenous traffic [2].
3.4 Factors affecting capacity
3.4.1 Signal distances
Main differences related to capacity between JKV and ERTMS/ETCS are caused by the signal distances and how the braking distances of the trains fit to the them. Generally, distances between signals are adapted based on the braking distances, but this can be challenging on railway lines with heterogenic traffic where the trains can have very different braking curves. Figure 9 demonstrates the correlation of signal distance and braking distance in ERTMS/ETCS level 1. Because the train receives an updated braking curve only by the balises it can happen that the train brakes unnecessary early with respect to an approaching signal or marker board.
FTIA publications 43/2019 27
∆Sb
∆Sh
B3 B2 B1 SS L1
1 2
Sb: Braking distance Sh: Headway distance SS: Safety distance (overlap) L1: Length of train 1 Bi: Block section i
ERTMS braking curve Conventional braking curve
Speed
System delays omitted
Figure 9 Correlation of signal distance and braking distance in ERTMS/ ETCS level 1.
Conclusions about the correlation of signal distance and braking distance are summarized in figure 10 where the effect of continuous and discrete train control on train (time) headway is demonstrated using a theoretical example. When the total block distance is constant, the more equal the systems are the higher is the number of signal blocks. Generally, train headways are longer for discretely updated movement authority (JKV and ERTMS/ETCS level 1) compared to continuously updated systems (ERTMS/ETCS levels 2 and 3). In situations where signal distance and braking distance are equal, the minimum train headway is the same for the same type of system i.e. ERTMS/ETCS levels 1 and 2 (ignoring system delays, which in practice influences the outcome).
Figure 10 Minimum train headway by continuous and discrete update of movementauthority[Modifiedfrom26].

FTIA publications 43/2019 28
3.4.2 ERTMS/ETCS Braking curves and comparison with JKV
As a part of the implementation of ERTMS/ETCS, the braking curves of the trains are equalized in order that there is no need for interfaces or software for several national practice and braking curves. In ERTMS/ETCS the braking curve is called EBD (Emergency Brake Deceleration) which depends on properties of both rolling stock and infrastructure. Based on EBD and the velocity of the train the ERTMS/ETCS computes the stopping distance many times per second taking also into account the uncertainty of the actual velocity and the eventual rise of velocity caused by acceleration. EBD-curves offer diverse control points for computing the braking curve to support driving and ensure smooth ride as possible. These points are indication (I), permitted speed (P), warning (W), service brake intervention (SBI) and emergency brake intervention (EBI). Figure 11 demonstrates the properties of EBD-curve and control points related to it. ERA has published an introduction to ERTMS/ETCS braking curves and defines the locations of the curves as follows:
- For the “I” supervision limit: leave the driver enough time to act on the service brake so that the train does not overpass the Permitted speed, when this latter will start to decrease. Without the indication it would not be possible for the driver to perform a transition from ceiling speed supervision to the target speed supervision without over-passing the Permitted speed.
- For the “P” supervision limit: in case of overspeed, to leave the driver an additional time to act on the service brake so that the train will not overpass the point beyond which ETCS will trigger the command of the brakes.
- For the “W” supervision limit, to give an additional audible warning after the Permitted speed has been overpassed.
- For the “SBI” supervision limit, to take into account the service brake build-up time so that the EBI supervision limit is not reached after the command by ETCS of the full service brake effort. The SBI supervision limit is facultative and can be implemented on-board the train in order to avoid too frequent emergency braking, which can be damaging for both the rolling stock and the track.
Same braking curves are used in both ERTMS/ETCS levels 1 and 2, but the effect of the braking curves on capacity is different because of the discrete or continuous train control. [27]

FTIA publications 43/2019 29
EBD curve
EBI
speed Assumed acceleration
during emergency brake build up time
Estimated speed
SBI P
W Speed measurement
inaccuracy
Displayed permitted speed
Max safe front
Driver time to avoid
overspeed
Service brake build
up time
Supervised location
distance
Driver time to avoid SB intervention
Estimated front
I
Figure 11 EBD curve and its related supervision limits [27].
Two different methods are used to calculate braking curves depending on the available data for the train. The more detailed calculation method is called Gamma method. For Gamma method, a number of predefined compositions like the nominal deceleration profiles, corresponding rolling stock correction factors and the brake build up time are required for the train. For the Lambda braking curve calculation method, the braking performance is calculated as a brake weight percentage, which is converted into deceleration data. The method is purely mathematical, being based on an algorithm developed by UIC’s extensive field tests with a large variety of train types. [27] An overview of the Gamma and Lambda braking curve calculations is presented in table 2.
Table 2 Overview of Gamma and Lambda braking curves.
Type Lambda Gamma Precision Low/limited High Number of parameters Few Many Generally used for Freight trains as exact
braking parameters are not known
Train units as braking performance is well-defined
Current Finnish Automatic Train Protection system, JKV, has five braking curves; Warning (A), alarm (B), application curve for service brake (C), service brake (D) and emergency braking curve (E) (Figure 12). The functionality of the curves is as follows:
- On the curve “A” the driver will get the first input on the stop sign ahead. The system recommends the driver to start braking.
- If the driver has missed the recommendation to start braking on the curve A, or is not braking enough, the curve “B” triggers a warning to the driver to start braking
- On the curve “C” the service brake is applied and will continue as long as the train reaches the supervised speed. The driver cannot change the braking of the train at this point.
- Curve “D” is a basic curve, which is used to calculate the other curves. - Curve “E” applies an emergency brake. The braking continues until the
speed is zero.

FTIA publications 43/2019 30
Figure 12 JKV braking curves and related supervision limits [28].
The maximum speed the driver sets to the system is based on the maximum speed received from the traffic control. Traffic control will base the maximum speed value on the braking ability requirements, track features, the maximum speed for the rolling stock and timetable circumstances. [29] The calculation methods between JKV and ERTMS/ETCS braking curves differ from each other. The calculation for ERTMS/ETCS is more precise and covers more uncertainties. For ERTMS/ETCS, the emergency braking curve is calculated to the target point at or behind the signal (to supervised location SvL). For JKV the emergency braking curve is calculated ending to the signal (End Of Authority EOA). [29] The emergency brake is applied for ERTMS/ETCS before in JKV system, due to the different philosophy of the systems. The service brake for JKV is safety critical whereas the emergency brake is only precautionary. In ERTMS/ETCS the emergency brake is safety critical brake, and service brake is introduced nationally. [29] 3.4.3 Response times
Response time means the time that is spent for the data transfer between different systems. Generally, it must be secured in any train control system that the response times do not become too high and therefore do not affect rail traffic safety negatively. ERTMS/ETCS level 2 response time is longer than response time of level 1. Level 2 has more systems and interfaces which leads to longer time of data transfer. International union of railways (UIC) has estimated the response times for ERTMS/ETCS levels 1 and 2 in report influence of ERTMS/ETCS on line capacity [1]. Response times of ERTMS/ETCS level 2 have also been evaluated by FTIA in the study: ”Implementing the Interface of Future Rail Traffic Management System (ERTMS) to Present Railway Signalling Systems”, Research reports of
FTIA publications 43/2019 31FTIA publications 43/2019 31
the Finnish Transport Agency (47/2012) [30]. Estimated response times are presented in table 3.
Table 3 ERTMS/ETCS level 1 and level 2 response times estimated by UIC and FTA [1, 30].
Response time (s) Functionality Level 1 Level 2 Level 2 by FTA LEU* 0.70 - - EVC+DMI** 1.00 1.00 - Interlocking - - 1.50 Interface computer - - 1.00 Interlocking to RBC - 0.05 - RBC - 1.50 0.50 RBC to train - 1.10 0.50 Remote control - - 0.50 Total 1.70 3.65 4.00
*LEU = Lineside Electronic Unit **EVC = European Vital Computer DMI = Driver-Machine-Interface Differences between response times of different systems affect the time spent for ensuring train paths and therefore the minimum headway.
3.5 Transition between ERTMS/ETCS levels
Transition between ERTMS/ETCS levels needs to be considered before rolling out the system, as transitions may not be possible everywhere and it can limit capacity. This is regardless of changing between ERTMS/ETCS and conventional signalling or between levels of ERTMS/ETCS. The transition from e.g. level NTC (National Train Control i.e. conventional signalling) to ERTMS level 2 (with GSM-R or FRMCS) can take place over a long distance before the radio network has been registered, the radio connection established, the Movement Authority (MA) received, and a train that has not received a movement authority has been braked safely, see figure 13.
Figure 13 Example of transition from Level NTC (conventional signalling) to ERTMS level 2.
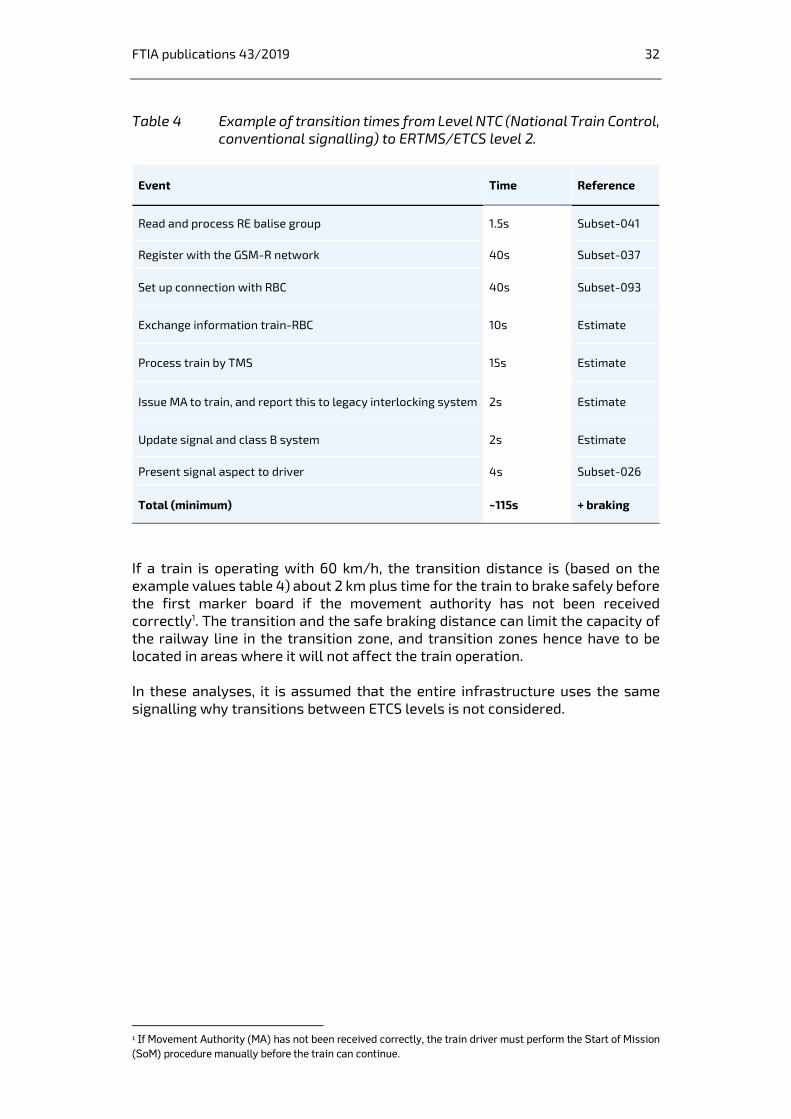
The distance for the transition depends on the transition time parameters that vary from system to system but to some extent is stated in the ERTMS/ETCS requirements in various subsets. An example of parameters that can be included in a transition is given in table 4.
Distance for braking if MA is not received
Level 2 MASpeed
L2
Level 2 entryEN balise
Radio EstablishmentRE balise
Level NTC MA
Register GSM-R network and establish connection
Distance for transition
FTIA publications 43/2019 32
Table 4 Example of transition times from Level NTC (National Train Control, conventional signalling) to ERTMS/ETCS level 2.
Event Time Reference
Read and process RE balise group 1.5s Subset-041
Register with the GSM-R network 40s Subset-037
Set up connection with RBC 40s Subset-093
Exchange information train-RBC 10s Estimate
Process train by TMS 15s Estimate
Issue MA to train, and report this to legacy interlocking system 2s Estimate
Update signal and class B system 2s Estimate
Present signal aspect to driver 4s Subset-026
Total (minimum) ~115s + braking
If a train is operating with 60 km/h, the transition distance is (based on the example values table 4) about 2 km plus time for the train to brake safely before the first marker board if the movement authority has not been received correctly1. The transition and the safe braking distance can limit the capacity of the railway line in the transition zone, and transition zones hence have to be located in areas where it will not affect the train operation. In these analyses, it is assumed that the entire infrastructure uses the same signalling why transitions between ETCS levels is not considered.
FTIA publications 43/2019 33
4 Case studies
4.1 System descriptionHelsinki Region Transport (HSL) operates the city lines between Helsinki and Kerava, and Helsinki and Leppävaara. In addition, there is a Ring Rail Line on a route Helsinki–Hiekkaharju–Airport–Huopalahti–Helsinki, going also to the opposite direction. City line services have their dedicated infrastructure separated from other tracks and they are the lines where trains stop in each commercial station: A, P, I and K lines. In addition, lines L and T uses city line tracks on the sections from Leppävaara (L-line) and Kerava (T-line) towards Helsinki.
Services on all lines have a peak-hour headway of 10 minutes. Sections between Helsinki and Huopalahti as well as Helsinki and Hiekkaharju has a peak-hour headway of five minutes as these sections are operated both by Ring Rail Line and trains to Kerava or Leppävaara. During the peak-hour turnaround time on Leppävaara station is 6 minutes and in Kerava 7 minutes. The current system is presented in figure 14. This study considers lines from Helsinki to Kerava and Helsinki to Leppävaara as well as Helsinki main station rail yard. The Ring Rail Line is excluded from the study.
Figure 14 Finnish city line tracks and Ring Rail Line [modified from 31].
FTIA publications 43/2019 34
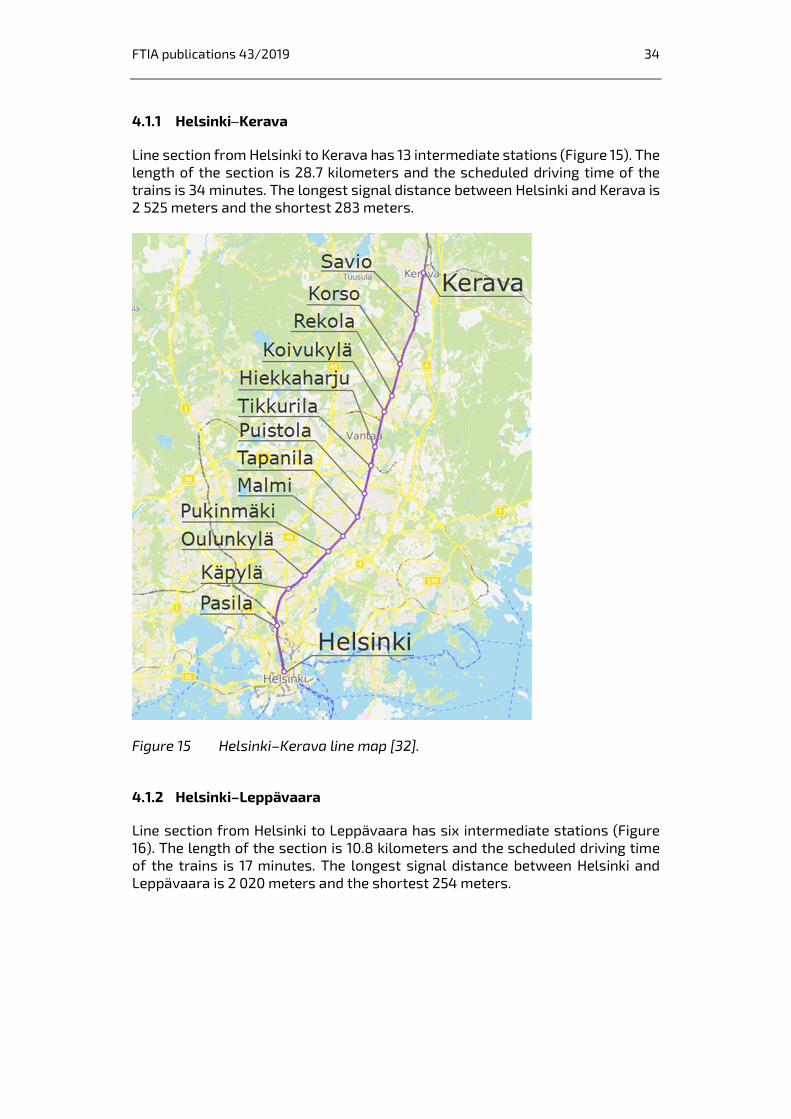
4.1.1 HelsinkiKerava
Line section from Helsinki to Kerava has 13 intermediate stations (Figure 15). The length of the section is 28.7 kilometers and the scheduled driving time of the trains is 34 minutes. The longest signal distance between Helsinki and Kerava is 2 525 meters and the shortest 283 meters.
Figure 15 Helsinki–Kerava line map [32].
4.1.2 Helsinki–Leppävaara
Line section from Helsinki to Leppävaara has six intermediate stations (Figure 16). The length of the section is 10.8 kilometers and the scheduled driving time of the trains is 17 minutes. The longest signal distance between Helsinki and Leppävaara is 2 020 meters and the shortest 254 meters.

FTIA publications 43/2019 35
Figure 16 Helsinki–Leppävaara line map [32].
4.1.3 Helsinki railway yard
Helsinki railway yard is the most important hub for the Finnish rail network. The majority of the passenger trains goes via Helsinki and Pasila stations. Nowadays there are over 70 trains running during the peak hours. In the future capacity and disruption recovery will need to be enhanced, to make sure that the stations can meet the growing capacity needs. The traffic in Helsinki and Pasila affects to the whole train traffic in Finland. The development of Helsinki-Pasila has been considered in many studies. Currently an additional track is being built to Pasila. In the same platform level there is no more room for other tracks or platforms in Pasila. There is also a project called HELRA on-going, which aims to improve the functionality and increase the disruption recovery means of the Helsinki railway yard. The additional track and the actions to be undertaken in HELRA project will enable traffic for 90 trains per hour. There are 19 platform tracks on Helsinki main station. The commuter trains are on the outermost platforms. The trains to Kerava and Ring Rail Track to the counter-clockwise direction departure mainly on tracks 1-3, and the trains to Leppävaara and Ring Rail Track to the clockwise direction departure mainly from the tracks 16-19. The Main line and Direct rail line (Oikorata) long distance and commuter trains are mainly on tracks 4-10. The tracks 11-15 are used by Coastal Railway. However, there is some flexibility on these principles.
FTIA publications 43/2019 36
There are eight line tracks between Helsinki and Pasila. The four tracks on the east side are used by main track and the four tracks on the west side are used by Coastal Railway. In the middle there are two service tracks to Ilmala. In this study only the tracks being used by city trains are being analysed, meaning two easternmost tracks and two westernmost tracks.
4.2 Preconditions, assumptions and exclusions
4.2.1 Infrastructure
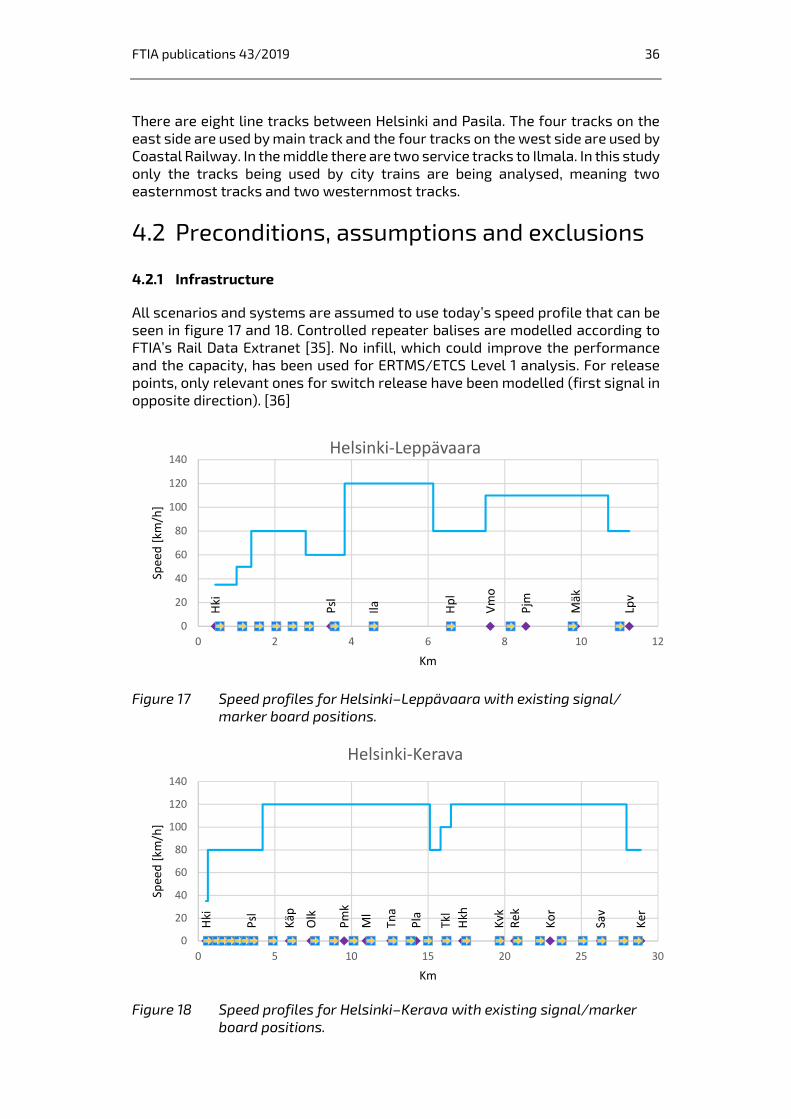
All scenarios and systems are assumed to use today’s speed profile that can be seen in figure 17 and 18. Controlled repeater balises are modelled according to FTIA’s Rail Data Extranet [35]. No infill, which could improve the performance and the capacity, has been used for ERTMS/ETCS Level 1 analysis. For release points, only relevant ones for switch release have been modelled (first signal in opposite direction). [36]
Figure 17 Speed profiles for Helsinki–Leppävaara with existing signal/ marker board positions.
Figure 18 Speed profiles for Helsinki–Kerava with existing signal/marker
board positions.
Hki
Psl
Ila Hpl
Vmo
Pjm
Mäk
Lpv
0
20
40
60
80
100
120
140
0 2 4 6 8 10 12
Spee
d [k
m/h
]
Km
Helsinki-Leppävaara
Hki
Psl
Käp
Olk
Pmk
Ml
Tna
Pla
Tkl
Hkh
Kvk
Rek
Kor
Sav
Ker
0
20
40
60
80
100
120
140
0 5 10 15 20 25 30
Spee
d [k
m/h
]
Km
Helsinki-Kerava

FTIA publications 43/2019 37
Main signal positions are modelled as in the existing situation for the analyses of JKV, ERTMS/ETCS levels 1 and 2. The signal positions have been retrieved from the FTIA’s Rail Data Extranet [35]. For level 2 an additional analysis with improved block sections has been made using additional block sections as described in section 4.3.3. 4.2.2 System delays
System delays generally vary depending on the local setup (design, equipment and supplier) but can also vary over time. For this study, the system delay times stated in table 5 are used. For ERTMS/ETCS, the system delays are based on the response times estimated by UIC [1] (see section 3.5), while the response time by JKV and route set and release times is based on expert assessment.
Table 5 System delay times for the study.
JKV Level 1 Level 2 Response times 0 seconds 1.70 seconds 3.65 seconds Route set time 9 seconds (without switches) Extra time for switches*
+ 5 seconds
Route release time 3 seconds * In the model, the extra route setting time for switches is included regardless if the switch is changing position
It should be noted, that there are uncertainties in the system delays, and they will vary depending on location and time. 4.2.3 Rolling stock
The study has been made using Sm5 train, since it is the only train in service on the city line tracks currently. It is also expected that if new rolling stock would be bought in the near future, it would be very similar with Sm5 train type. The length of Sm5 train unit is 75 202 mm, weight in working order 131.6 t, total laden weight 174 t, axle load 13.2 t and maximum speed 160 km/h. [37] For train driver deceleration towards open Movement Authority a value of 0.6 m/s2 has been used. The value of 1.2 m/s2. has been used for starting acceleration. For the running time estimations timetable supplements recommended by UIC [53] have been included. 4.2.4 Braking Curves
As described in Section 3.4.2 , there are two ways to calculate braking curves – Lambda and Gamma. The values to calculate the most accurate Gamma braking curves for Sm5 were not available. The less accurate Lambda method was therefore used to calculate the braking curves using a 158% brake weight percentage for the emergency brake and 135% for the service brake (Lambda model limitation). For calculation of ERTMS/ETCS, service brake interface was used and the Permitted (P) braking curve. For braking curve calculation ERA calculation tool was used and Finnish national values were applied in the tool, based on the publication “Suomen kansalliset ERTMS/ETCS-parametrit” [28].

FTIA publications 43/2019 38
For JKV, the values presented in Table 6 were used for Sm5 trains in the analysis.
Table 6 JKV parameters for Sm5.
JKV Parameter Value Brake weight percentage 158 % Safety factor 1 System delay 1 s Acceleration delay 5 s Braking time 3 s Braking curve B- curve
4.2.5 Human Factors
Human factors are not considered in the study. Migrating to the ERTMS/ETCS environment will impact train drivers and train operation, which may change the way they operate the system, affecting the capacity. [38] 4.2.6 Dwell times
Dwell times vary depending on the station, line and time of the day. In this analysis, a dwell time of 30 seconds is used for all stops between Helsinki and Kerava & Leppävaara respectively. 4.2.7 Technical turnaround times in ERTMS/ETCS
Technical times (without coupling times, brake tests and walking times) for ERTMS/ETCS, based on Danish empirical values, are stated in Table 7.
Table 7 Approximate technical times in ETCS level 1 and 2 when trains turn around for train units with automatic couplers.
Parameter Emperical value End of Mission (EoM) 5 seconds Start of Mission (SoM)
Turnaround without coupling/decoupling 90-130 seconds Turnaround with coupling 100-140 seconds Turnaround with decoupling 90-130 seconds (for first train) New engine driver + 10 seconds Unknown position + 90 seconds
It is assumed the technical times in Table 7 are similar to JKV or only slightly higher. On condition that the on-board ERTMS/ETCS unit remember the train’s position, it is thus presumed that today’s minimum layover times can be kept. In case the buffer time (as part of the layover time) is changed, it can affect the punctuality. However, an assessment of the punctuality is not part of this study.

FTIA publications 43/2019 39
4.3 Method
4.3.1 Blocking time method
Train headways are calculated using the so-called blocking time method. The same method is used for example by OpenTrack simulation software. The blocking time method is based on calculation of the time that a train reserves a single train path and the train path is blocked from other train traffic. Blocking time consists of following time intervals for each block in a train path (see Figure 19):
Route set time (interlocking, switch and possible communication) Time spent by driver for monitoring a signal Time spent by train approaching a signal (time it takes to cover the
required braking distance) Running time between signals (time in block section) Block clearing time Signal clearing time (route release time)
Figure 19 Defining of train headway and blocking time of train path [48]
FTIA publications 43/2019 40
Calculation of block occupation time takes also into account the acceleration and deceleration of trains as well as dwell time at stations in the block running time. In ERTMS/ETCS level 1, train headways are defined by the same method as in traditional train control systems, so based on visible signals. ERTMS/ETCS level 2 systems do not necessarily have visible signals and the braking curves are updated continuously which may allow shorter headways than level 1. Response times of radio block centres and other data transfer delays are added to the blocking time (route set time). 4.3.2 Model
Ramboll has developed a model that uses the blocking time method described in Section 4.3.1 to calculate minimum headways between trains based on:
Signal positions Switches and release points Speed profile of the line Rolling stock charecteristics Signalling dependent braking curves (ERTMS/ETCS or JKV) Route set and release times as well as communication delays
The minimum headway forms the basis for the capacity estimation. The line headway between trains is derived as described by Pachl [54]. To estimate the time spent by a train in each block, we use the running time estimation model described by Jensen [55]. This model takes acceleration, braking and the speed profile into account based on the rolling stock characteristics. ERTMS/ETCS braking curves are calculated using ERA’s braking curve tools and fed into the model. JKV braking curves are likewise precalculated and fed into the model. 4.3.3 Improved Block Section layout
Two marker boards (or main signals for conventional signalling) demarcate a block section. There can be only one train at the time in a block section to ensure safety on the railways. In the UIC study [1], it is stated that improved block sections lead to significant higher capacity.
Figure 20 Critical block sections marked black for trains travelling from station A to B with stop at both stations [49]

FTIA publications 43/2019 41
The length of the block sections on a line can be determined by the fastest trains with longest stopping distances. This prevents trains with shorter stopping distances to travel closer together. If the block sections are optimised for the trains with shorter stopping distances to improve the capacity on the line, reduced speed is required for the trains with longer stopping distances for safety reasons. By improving the block section layout to fit better with train types, braking curves, infrastructure and schedule on the line, more capacity can be gained. [41] Besides improving the block sections as shown in Figure 20, the impact of critical block sections at the stations can be reduced by shorter dwell times or by improved acceleration and braking capabilities of future trains. Both ways, the block section at the stations will be occupied for shorter time and hence be less critical. ETCS has the possibility to look more block sections ahead than the conventional Finnish signalling system. Furthermore, ETCS braking curves are different to the current JKV braking curves. It gives the possibility to increase capacity by improving the length of the block sections and adding more block sections. Improvement of the block sections (from the current conventional signalling layout) has been carried out for the case study in the following steps: 1. Locate marker boards at existing signals 2. Add extra block sections between stations
a. Generally, at least 300-meter long block sections b. Shorter block sections if larger improvement expected
3. Add extra block sections on selected stations respecting location of switches This method uses the current location of conventional signals as the starting point. Replacing the entire signalling system, there is potential for further improvement of the capacity if marker boards can be located freely. On the other hand, longer block sections may be preferred to reduce cost. Furthermore, changes in national values and braking curve parameters is expected before the ERTMS/ETCS is implemented on the city lines round Helsinki. The improved capacity based on the improved block sections is hence only indicative. 4.3.4 Evaluation
The JKV, the ERTMS/ETCS levels 1 and 2 and the ERTM/ETCS level 2 with improved block sections are compared and evaluated based on headways and capacity consumption calculated using the blocking time model. The calculated headways are evaluated and compared as both minimum line headways and headways between crossing movements at the terminal stations (Helsinki, Kerava, Leppävaara). The minimum line headway times express the ability of the signalling system to carry as many trains as possible following each other. While the minimum headway times between crossing movements express the signalling system and the position of switches to allow a certain amount of trains entering and leaving the terminal stations. Given the headways calculated and a given order of train, the capacity consumption is calculated for different operational frequencies. Trains alternate between a train going to the airport and to Kerava or Leppävaara. The minimum frequency tested is 3.75 minutes on the common sections Helsinki–Hiekkaharju
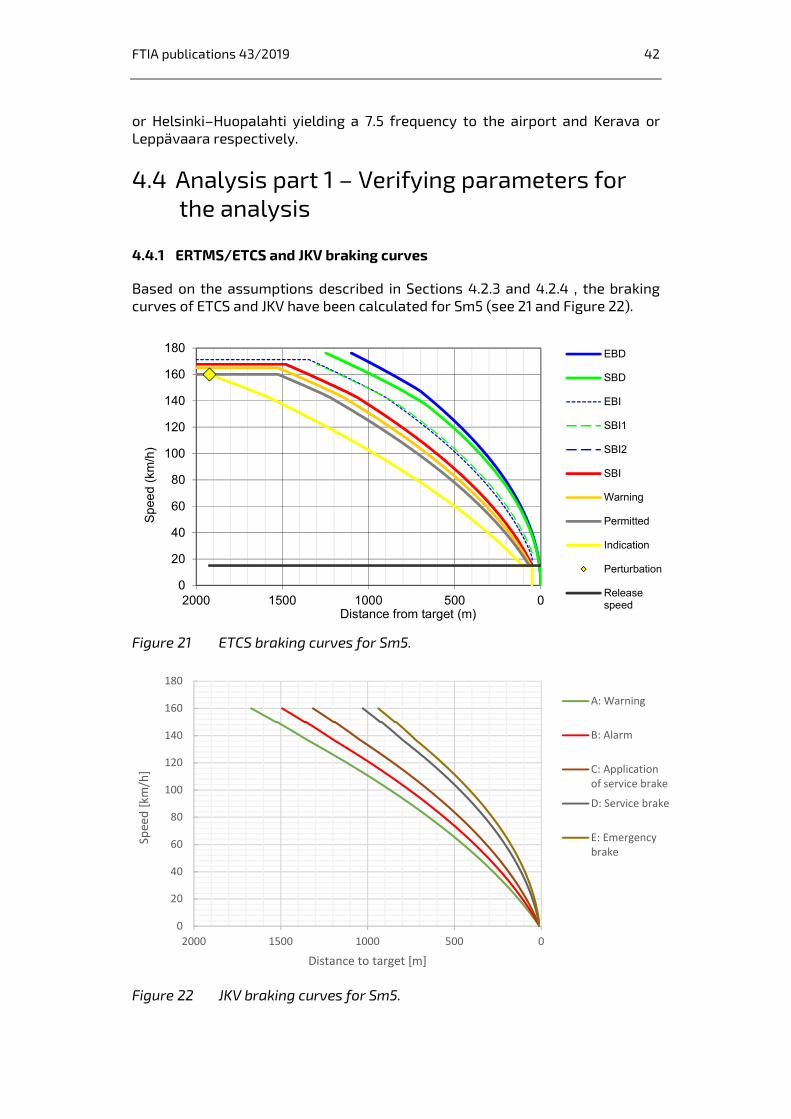
FTIA publications 43/2019 42
or Helsinki–Huopalahti yielding a 7.5 frequency to the airport and Kerava or Leppävaara respectively.
4.4 Analysis part 1 – Verifying parameters for the analysis
4.4.1 ERTMS/ETCS and JKV braking curves
Based on the assumptions described in Sections 4.2.3 and 4.2.4 , the braking curves of ETCS and JKV have been calculated for Sm5 (see 21 and Figure 22).
Figure 21 ETCS braking curves for Sm5.
Figure 22 JKV braking curves for Sm5.
0
20
40
60
80
100
120
140
160
180
0500100015002000
Sp
eed
(km
/h)
Distance from target (m)
EBD
SBD
EBI
SBI1
SBI2
SBI
Warning
Permitted
Indication
Perturbation
Releasespeed
0
20
40
60
80
100
120
140
160
180
0500100015002000
Spee
d [k
m/h
]
Distance to target [m]
A: Warning
B: Alarm
C: Applicationof service brake
D: Service brake
E: Emergencybrake

FTIA publications 43/2019 43
Figure 23 shows a comparison of the ERTMS/ETCS and JKV braking curves used for the capacity analyses. As the Figure shows the ERTMS/ETCS curve is longer than the JKV curve when braking from the maximum speed of the Sm5. From approximately 150 km/h, the JKV curve is marginally longer than the ERTMS/ ETCS curve. As the maximum speed on the city tracks is 120 km/h to Kerava and Leppävaara, the JKV curve is always longer than the ERTMS/ETCS curve in relation to the case studies carried out in this report.
Figure 23 Comparison of ERTMS/ETCS and JKV braking curves for Sm5 used for the capacity analyses.
4.4.2 Release speed
The Finnish national values for ERTMS/ETCS operates with a release speed of 15 km/h [29] which is lower than the default values of 40 km/h [29]. A lower release speed results longer braking time and hence reduced capacity, see Figure 24.
Figure 24 Difference between release speeds (left: 15 km/h and right: 40 km/h).
With release speed of 15 km/h time to brake from 80 km/h to 0 km/h takes 58 seconds, whereas with 40 km/h release speed it takes 47 seconds. With Sm5 trains with the characteristics described in Section 4.2.3 , the braking time can be reduced by 11 seconds if the release speed is increased from 15 to 40 km/h.
0
20
40
60
80
100
120
140
160
180
02004006008001000120014001600
Spee
d [K
m/h
]
Distance to target [meters]
ETCS Permitted curve JKV B-curve
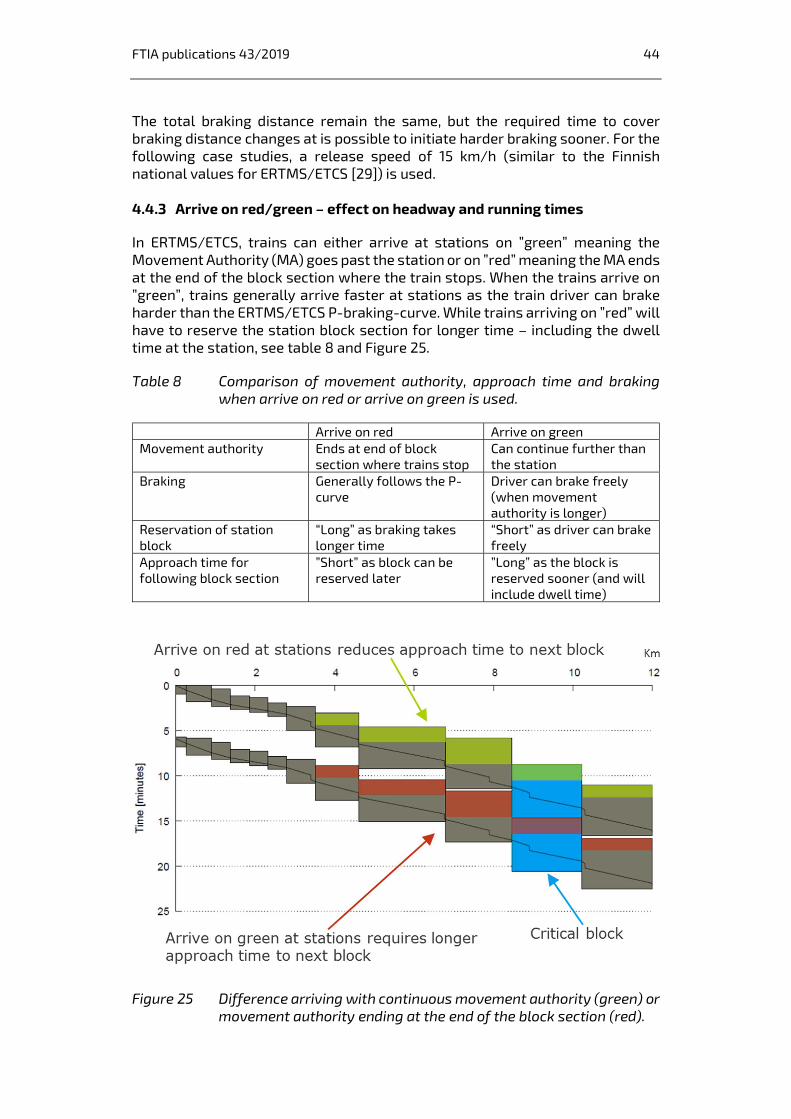
FTIA publications 43/2019 44
The total braking distance remain the same, but the required time to cover braking distance changes at is possible to initiate harder braking sooner. For the following case studies, a release speed of 15 km/h (similar to the Finnish national values for ERTMS/ETCS [29]) is used. 4.4.3 Arrive on red/green – effect on headway and running times
In ERTMS/ETCS, trains can either arrive at stations on ”green” meaning the Movement Authority (MA) goes past the station or on ”red” meaning the MA ends at the end of the block section where the train stops. When the trains arrive on ”green”, trains generally arrive faster at stations as the train driver can brake harder than the ERTMS/ETCS P-braking-curve. While trains arriving on ”red” will have to reserve the station block section for longer time – including the dwell time at the station, see table 8 and Figure 25.
Table 8 Comparison of movement authority, approach time and braking when arrive on red or arrive on green is used.
Arrive on red Arrive on green Movement authority Ends at end of block
section where trains stop Can continue further than the station
Braking Generally follows the P-curve
Driver can brake freely (when movement authority is longer)
Reservation of station block
“Long” as braking takes longer time
“Short” as driver can brake freely
Approach time for following block section
”Short” as block can be reserved later
”Long” as the block is reserved sooner (and will include dwell time)
Figure 25 Difference arriving with continuous movement authority (green) or movement authority ending at the end of the block section (red).

FTIA publications 43/2019 45
Generally, the extended approach time arriving on “green” is longer than the extended arrival time to the station following the P-curve when arriving on “red”. Therefore, arrival on “red” where the MA ends at the end of the block section where the train stops, generally has the highest possible capacity (shortest headway times). Additionally, the P-curve may only restrict the braking towards a stop if the marker board is sufficiently close when the train is arriving on “red”. As an example, braking is only restricted for three out of 14 stops between Helsinki and Kerava with arrive on “red” and a release speed of 35 km/h (see Figure 26). Note that a lower release speed, e.g. 15 km/h, will result in more restrictions. The difference in capacity thus depends on the exact location of marker boards, release speed as well as train types, speed profile and gradients round the stops.
Figure 26 Signalling restricts (braking curves) braking increasing running times towards a stop.
For the following analyses, arrival on ”red” where the MA ends at the end of the block section where the train stops, is therefore used as it generally results in the highest potential capacity.
4.5 Analysis part 2 Case studies – minimum headways and capacity consumption
4.5.1 Minimum headway
Minimum headway times have been calculated for the following scenarios for the city lines between Helsinki and Kerava or Leppävaara: • As-is with JKV • ERTMS/ETCS level 1 with existing block sections • ERTMS/ETCS level 2 with existing block sections • ERTMS/ETCS level 2 with shorter and improved block sections For JKV, the calculation of minimum headway times has been based on the JKV B-braking-curve while the other scenarios are based on the ERTMS/ETCS P-braking-curve. As described in Section 4.3.4 for each scenario, blocking stairs and minimum headway times have been calculated for all combinations of train courses on the two lines. E.g. trains between Helsinki and Kerava and trains between Helsinki and the airport as well as to and from different tracks at Helsinki, Kerava, and Leppävaara. Figure 27 shows the combination of a train

46FTIA publications 43/2019
from Helsinki to Kerava and Helsinki to the Airport via Hiekkaharju. Detailed headways are listed in Appendix 3.
Figure 27 Blocking stairs for a train to Kerava followed by a train to the airport and then another train to Kerava in Level 2 with existing block sections.
Without changing the block sections, it is (in Figure 28 and Appendix 3) seen that the line headway times for ERTMS/ETCS generally is slightly longer than JKV due to more system delays in ERTMS/ETCS. In some cases, ERTMS/ETCS is a bit better than JKV as the JKV braking curve is slight longer than the ERTMS/ETCS curve. Furthermore, arrival on ”red” where the MA ends at the end of the block section where the train stops for both JKV and ERTMS/ETCS generally result in improved capacity compared to arrival on ”green” meaning the Movement Authority (MA) goes past the station. However, at this is also done with JKV, there are no additional benefits when comparing JKV and ERTMS/ETCS.
0
5
10
15
20
25
30
35
40 0 5 10 15 20 25 30
Tim
e [m
inut
es]
Train run 1: Sm5, HKI01-KE05 and train run 3: Sm5, HKI01-Lento
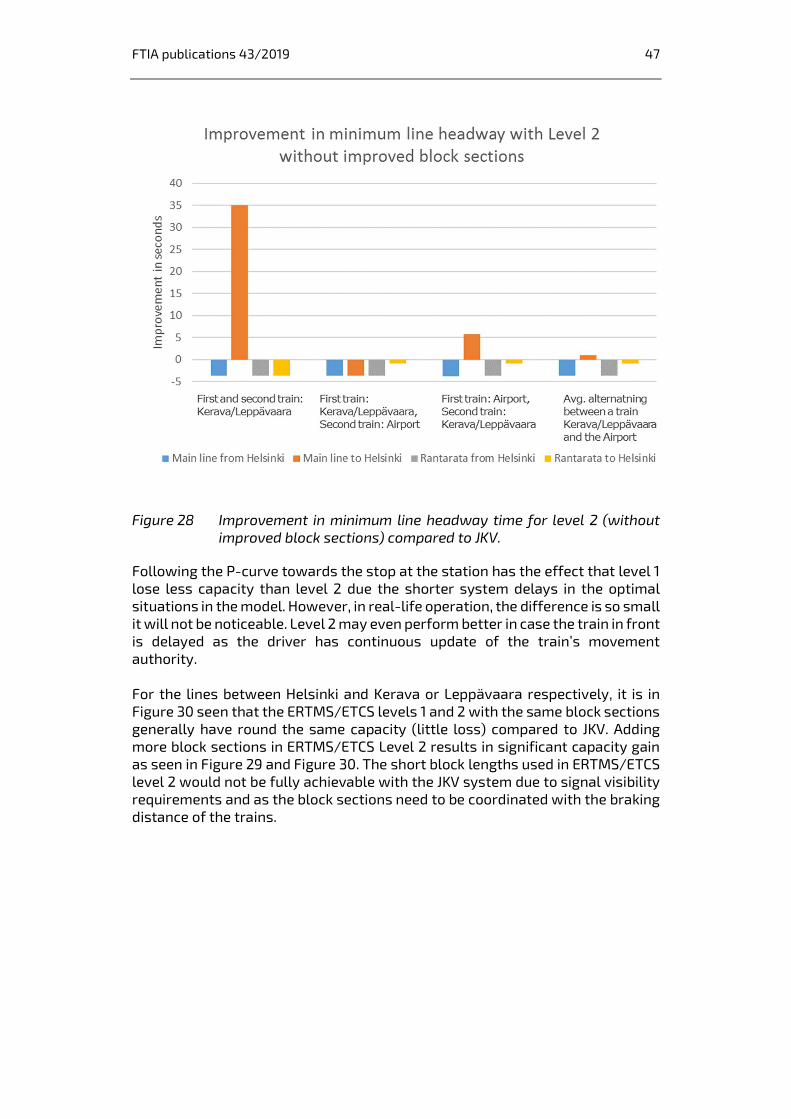
FTIA publications 43/2019 47
Figure 28 Improvement in minimum line headway time for level 2 (without improved block sections) compared to JKV.
Following the P-curve towards the stop at the station has the effect that level 1 lose less capacity than level 2 due the shorter system delays in the optimal situations in the model. However, in real-life operation, the difference is so small it will not be noticeable. Level 2 may even perform better in case the train in front is delayed as the driver has continuous update of the train’s movement authority. For the lines between Helsinki and Kerava or Leppävaara respectively, it is in Figure 30 seen that the ERTMS/ETCS levels 1 and 2 with the same block sections generally have round the same capacity (little loss) compared to JKV. Adding more block sections in ERTMS/ETCS Level 2 results in significant capacity gain as seen in Figure 29 and Figure 30. The short block lengths used in ERTMS/ETCS level 2 would not be fully achievable with the JKV system due to signal visibility requirements and as the block sections need to be coordinated with the braking distance of the trains.
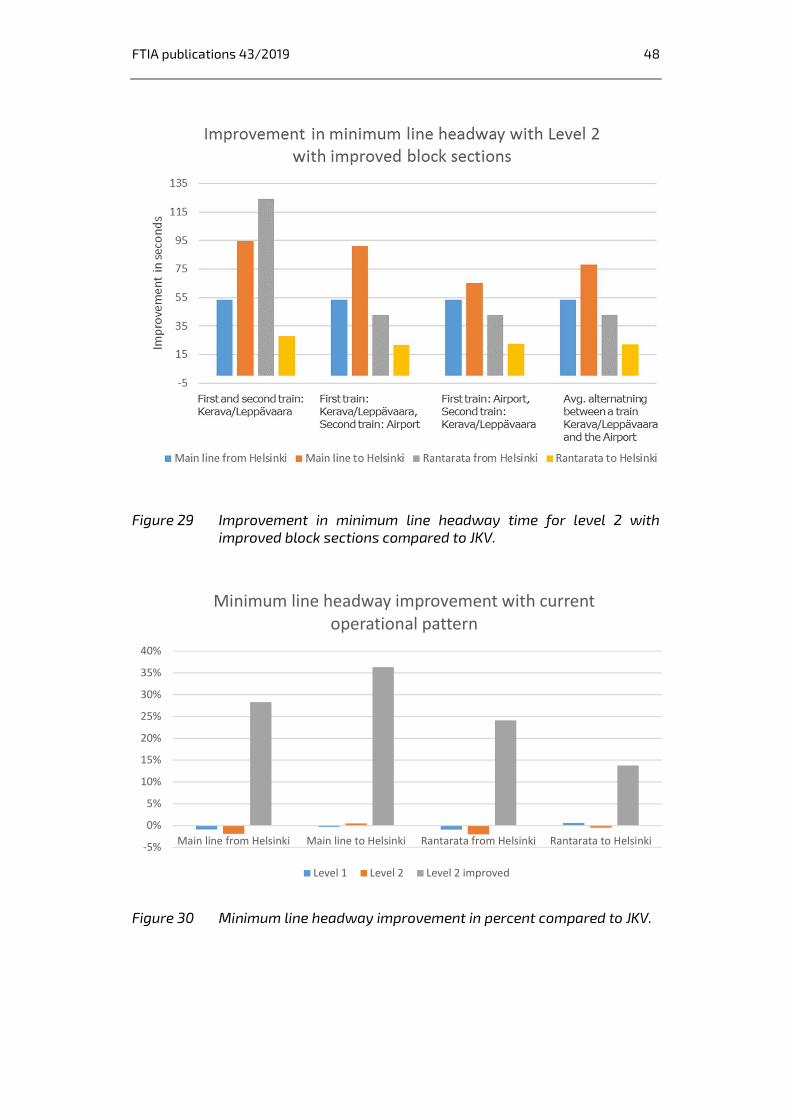
FTIA publications 43/2019 48
Figure 29 Improvement in minimum line headway time for level 2 with improved block sections compared to JKV.
Figure 30 Minimum line headway improvement in percent compared to JKV.
-5%
0%
5%
10%
15%
20%
25%
30%
35%
40%
Main line from Helsinki Main line to Helsinki Rantarata from Helsinki Rantarata to Helsinki
Minimum line headway improvement with current operational pattern
Level 1 Level 2 Level 2 improved
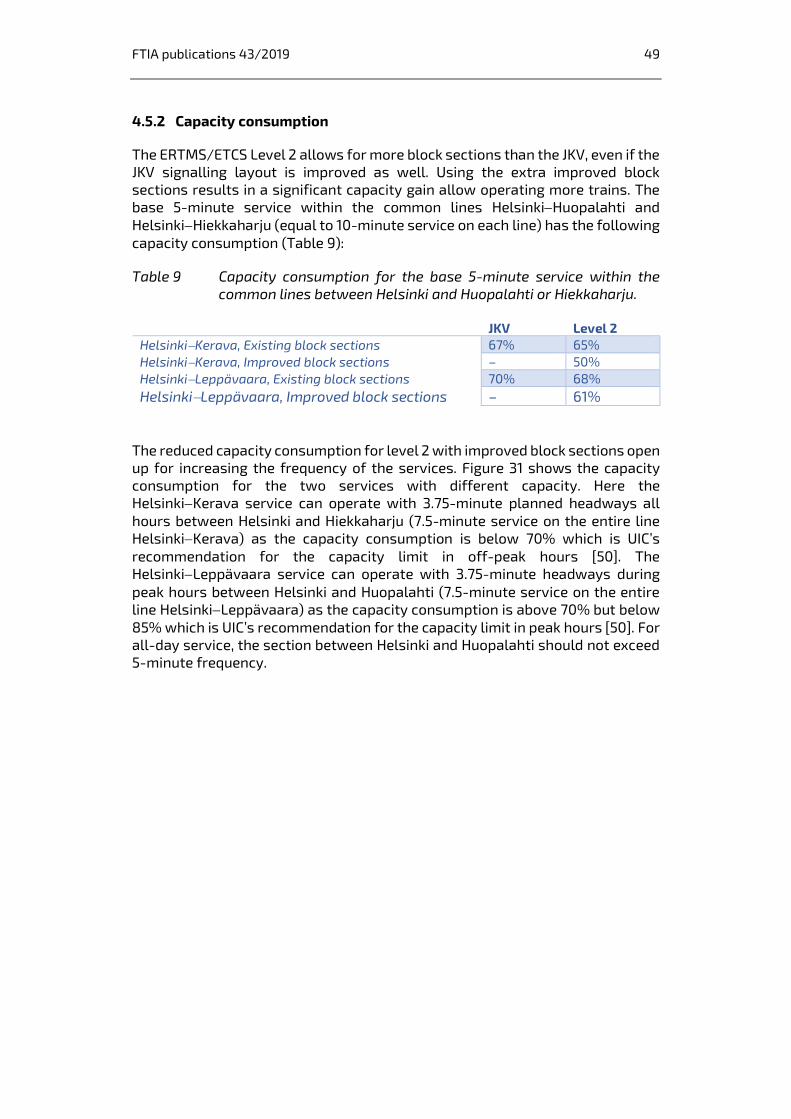
FTIA publications 43/2019 49
4.5.2 Capacity consumption
The ERTMS/ETCS Level 2 allows for more block sections than the JKV, even if the JKV signalling layout is improved as well. Using the extra improved block sections results in a significant capacity gain allow operating more trains. The base 5-minute service within the common lines HelsinkiHuopalahti and HelsinkiHiekkaharju (equal to 10-minute service on each line) has the following capacity consumption (Table 9):
Table 9 Capacity consumption for the base 5-minute service within the common lines between Helsinki and Huopalahti or Hiekkaharju.
JKV Level 2 HelsinkiKerava, Existing block sections 67% 65% HelsinkiKerava, Improved block sections – 50% HelsinkiLeppävaara, Existing block sections 70% 68% HelsinkiLeppävaara, Improved block sections – 61%
The reduced capacity consumption for level 2 with improved block sections open up for increasing the frequency of the services. Figure 31 shows the capacity consumption for the two services with different capacity. Here the HelsinkiKerava service can operate with 3.75-minute planned headways all hours between Helsinki and Hiekkaharju (7.5-minute service on the entire line HelsinkiKerava) as the capacity consumption is below 70% which is UIC’s recommendation for the capacity limit in off-peak hours [50]. The HelsinkiLeppävaara service can operate with 3.75-minute headways during peak hours between Helsinki and Huopalahti (7.5-minute service on the entire line HelsinkiLeppävaara) as the capacity consumption is above 70% but below 85% which is UIC’s recommendation for the capacity limit in peak hours [50]. For all-day service, the section between Helsinki and Huopalahti should not exceed 5-minute frequency.
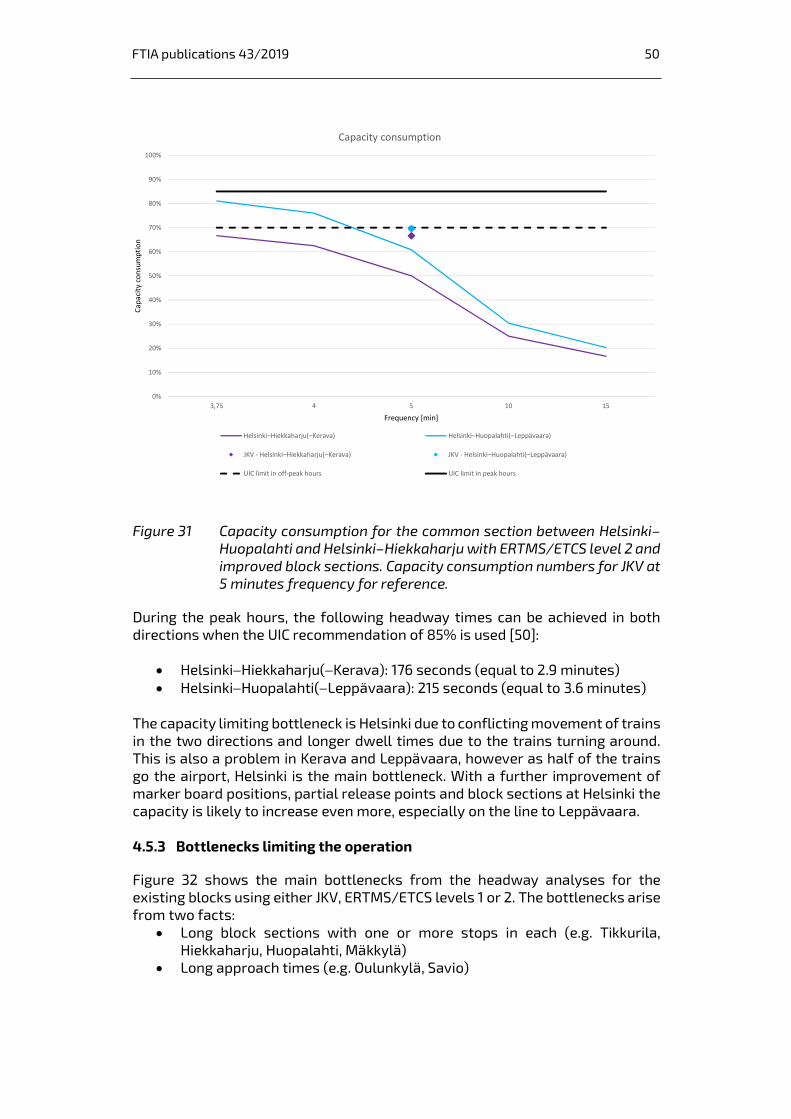
50FTIA publications 43/2019
0%
10%
20%
30%
40%
50%
60%
70%
80%
90%
100%
3,75 4 5 10 15
Capa
city
con
sum
ptio
n
Frequency [min]
Capacity consumption
Helsinki–Hiekkaharju(–Kerava) Helsinki–Huopalahti(–Leppävaara)
JKV - Helsinki–Hiekkaharju(–Kerava) JKV - Helsinki–Huopalahti(–Leppävaara)
UIC limit in off-peak hours UIC limit in peak hours
FTIA publications 43/2019 50
Figure 31 Capacity consumption for the common section between Helsinki–Huopalahti and Helsinki–Hiekkaharju with ERTMS/ETCS level 2 and improved block sections. Capacity consumption numbers for JKV at 5 minutes frequency for reference.
During the peak hours, the following headway times can be achieved in both directions when the UIC recommendation of 85% is used [50]:
HelsinkiHiekkaharju(Kerava): 176 seconds (equal to 2.9 minutes) HelsinkiHuopalahti(Leppävaara): 215 seconds (equal to 3.6 minutes)
The capacity limiting bottleneck is Helsinki due to conflicting movement of trains in the two directions and longer dwell times due to the trains turning around. This is also a problem in Kerava and Leppävaara, however as half of the trains go the airport, Helsinki is the main bottleneck. With a further improvement of marker board positions, partial release points and block sections at Helsinki the capacity is likely to increase even more, especially on the line to Leppävaara. 4.5.3 Bottlenecks limiting the operation
Figure 32 shows the main bottlenecks from the headway analyses for the existing blocks using either JKV, ERTMS/ETCS levels 1 or 2. The bottlenecks arise from two facts:
Long block sections with one or more stops in each (e.g. Tikkurila, Hiekkaharju, Huopalahti, Mäkkylä)
Long approach times (e.g. Oulunkylä, Savio)
0%
10%
20%
30%
40%
50%
60%
70%
80%
90%
100%
3,75 4 5 10 15
Capa
city
con
sum
ptio
n
Frequency [min]
Capacity consumption
Helsinki-Hiekkaharju(-Kerava) Helsinki-Huopalahti(-Leppävaara)
JKV - Helsinki-Hiekkaharju(-Kerava) JKV - Helsinki-Huopalahti(-Leppävaara)
UIC limit in off-peak hours UIC limit in peak hours
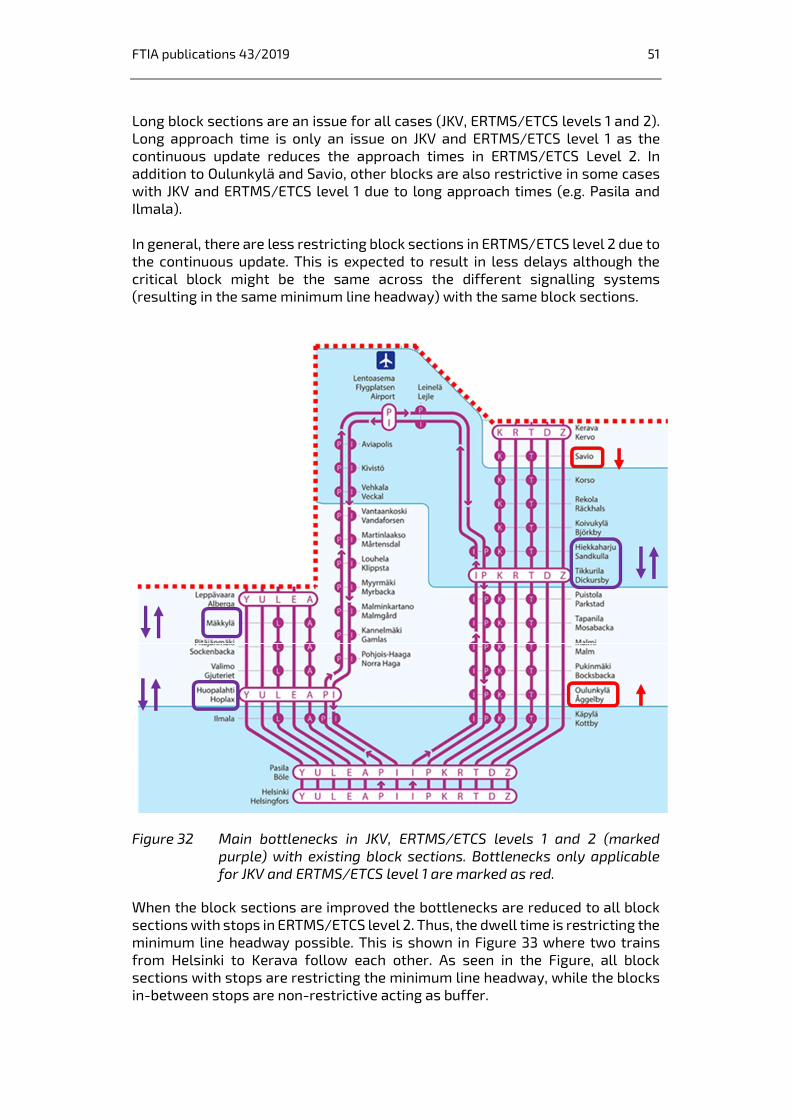
FTIA publications 43/2019 51
Long block sections are an issue for all cases (JKV, ERTMS/ETCS levels 1 and 2). Long approach time is only an issue on JKV and ERTMS/ETCS level 1 as the continuous update reduces the approach times in ERTMS/ETCS Level 2. In addition to Oulunkylä and Savio, other blocks are also restrictive in some cases with JKV and ERTMS/ETCS level 1 due to long approach times (e.g. Pasila and Ilmala). In general, there are less restricting block sections in ERTMS/ETCS level 2 due to the continuous update. This is expected to result in less delays although the critical block might be the same across the different signalling systems (resulting in the same minimum line headway) with the same block sections.
Figure 32 Main bottlenecks in JKV, ERTMS/ETCS levels 1 and 2 (marked purple) with existing block sections. Bottlenecks only applicable for JKV and ERTMS/ETCS level 1 are marked as red.
When the block sections are improved the bottlenecks are reduced to all block sections with stops in ERTMS/ETCS level 2. Thus, the dwell time is restricting the minimum line headway possible. This is shown in Figure 33 where two trains from Helsinki to Kerava follow each other. As seen in the Figure, all block sections with stops are restricting the minimum line headway, while the blocks in-between stops are non-restrictive acting as buffer.
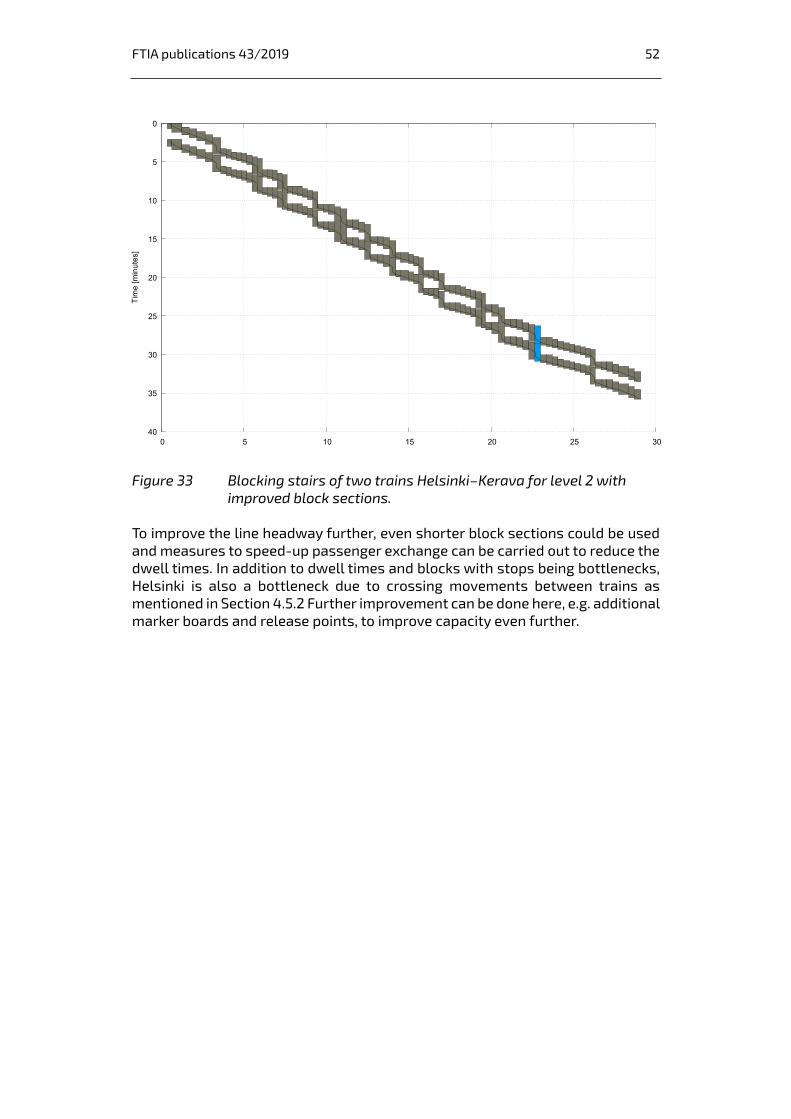
52FTIA publications 43/2019
0
5
10
15
20
25
30
35
40 0 5 10 15 20 25 30
Tim
e [m
inut
es]
Train run 1: Sm5, HKI01-KE05
Figure 33 Blocking stairs of two trains Helsinki–Kerava for level 2 with improved block sections.
To improve the line headway further, even shorter block sections could be used and measures to speed-up passenger exchange can be carried out to reduce the dwell times. In addition to dwell times and blocks with stops being bottlenecks, Helsinki is also a bottleneck due to crossing movements between trains as mentioned in Section 4.5.2 Further improvement can be done here, e.g. additional marker boards and release points, to improve capacity even further.
FTIA publications 43/2019 53
5 Additional strategies to improve capacity
5.1 Factors impacting to the capacity
In addition to the train control systems, there are other factors which impact to the capacity. The most important factors being dwell times, radio or loop infill in ERTMS/ETCS level 1, block section design, automatic train operation and timetable planning are factors, which can improve the capacity of a railway traffic.
5.2 Timetable
In principle, timetable planning is allocating railway capacity for the trains and infrastructure maintenance. Timetable planning impacts on multiple factors on railway travel; punctuality, connections, regularity of the schedule, travel time and frequency. In addition, the objectives of timetable planning often conflict; e.g. punctuality might increase travel time. [45, 46] Railway traffic is sensitive to disruptions due to the interdependencies between trains. One delayed train might delay other trains on the line and crossing lines. To gain some flexibility, buffer time is included in the timetable. Therefore, often this idle capacity cannot be used to operate more trains. [45, 47] In the study Railway Operation by A. Landex, published in 2006 following is stated: “A regular interval timetable, where all the trains are assigned a fixed departure interval, will often result in bad capacity utilization, as it is not possible to bundle trains with same driving behaviours.” In the figure 34 this situation is shown. If there is a lack of capacity on the line, it might be necessary to plan waiting time to the line to slow down fastest trains or add stops to their route to homogenize the operation. [46, 47]

FTIA publications 43/2019 54
Figure 34 Customer and capacity optimisation of the timetable [modified from 46].
The right side of figure 34 shows that trains with similar speed driving after each other results in less consuming traffic operation, since t,pas > t,. However, implementing this kind of schedule will lead to irregular departure interval, which might not align with the requirements of the clients. [46, 47]
5.3 Dwell times
Dwell time describes the time required for passengers to enter and leave the train. The factors affecting dwell times can be categorised to passenger volume, passenger profile, train design, station design and operational factors. If the dwell times are extended, it will lead to longer train and passenger journeys. [39] Many factors affect the dwell time, e.g. door opening and closing time, departure procedures and the passenger interchanges (see figure 35). [40] However, the main factor affecting to the dwell time is generally the number of passengers coming out and getting in to the train. The more passengers are standing in the train the slower the alighting and boarding is. Passenger profile impacts the boarding and alighting as well; passengers with luggage or passengers requiring special assistance will in average take longer to get in and out of the train. Regular passengers are likely to alight faster than those who travel less regularly or are unfamiliar with the stations.

FTIA publications 43/2019 55
Figure 35 Time elements affecting the dwell time [40].
Dwell time is also affected by the train design. Passengers can board and alight faster when the doors are wider. However, too wide doors might transfer the congestion further into narrow sections in the train. Other factors impacting dwell time is the time required for acceleration and braking of the train, the gap between train and the platform and the number of steps required to get in and out of the train. [39] However, it should be noted that there are no steps in the Sm5 trains analysed in the case study. Dwell times can be impacted also by ticketing system. If the ticketing machines are scattered along the wagon and platform instead of next to the doors, passengers can move forward on the isles and not form queues stamping the tickets near the door, obstructing other passengers to board. Similarly, a possibility to buy tickets beforehand will prevent queues and increased dwell time. The factors affecting to the capacity on the stations are the width of the platforms and number, capacity and location of stairs, escalators and lifts [39]. An operational factor impacting the dwell time is the timetable. The Dwell time increases if train arrives early, and if it is not allowed to departure before the scheduled time. Similar situations can occur with connecting trains, which need to wait for the passengers from another train to board. Irregular dwell times will lead to irregular headways. [39, 40]
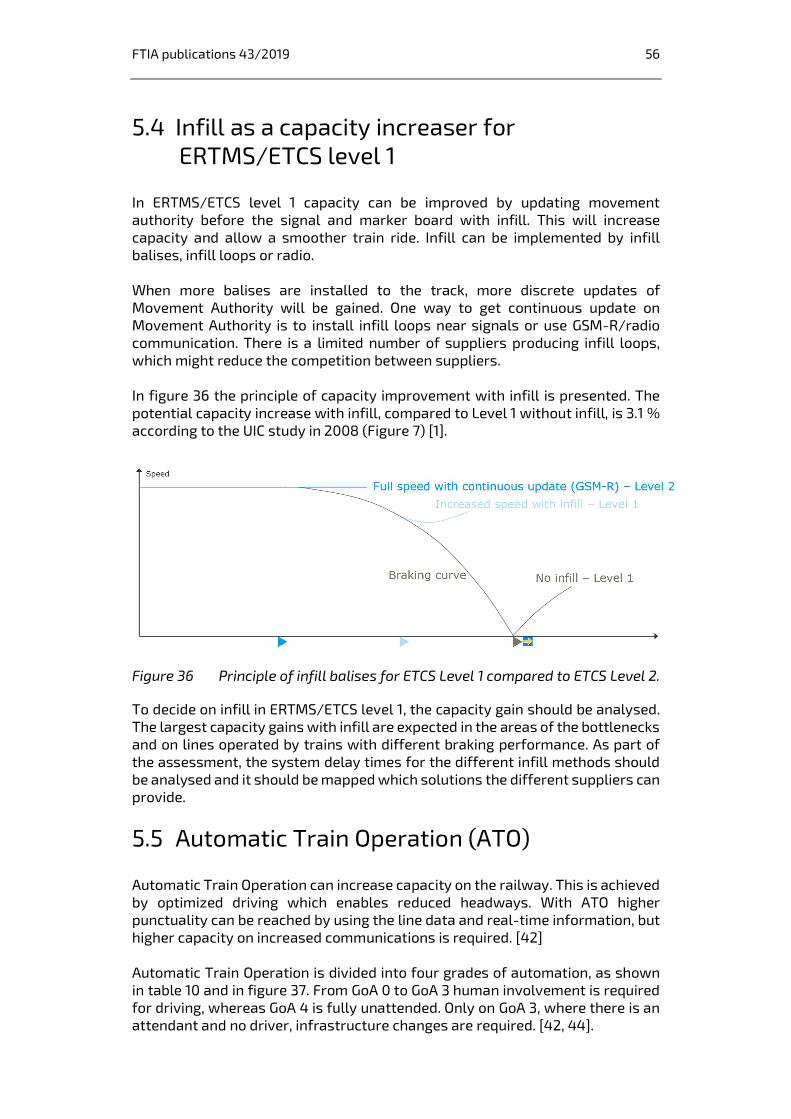
FTIA publications 43/2019 56
5.4 Infill as a capacity increaser for ERTMS/ETCS level 1
In ERTMS/ETCS level 1 capacity can be improved by updating movement authority before the signal and marker board with infill. This will increase capacity and allow a smoother train ride. Infill can be implemented by infill balises, infill loops or radio. When more balises are installed to the track, more discrete updates of Movement Authority will be gained. One way to get continuous update on Movement Authority is to install infill loops near signals or use GSM-R/radio communication. There is a limited number of suppliers producing infill loops, which might reduce the competition between suppliers. In figure 36 the principle of capacity improvement with infill is presented. The potential capacity increase with infill, compared to Level 1 without infill, is 3.1 % according to the UIC study in 2008 (Figure 7) [1].
Figure 36 Principle of infill balises for ETCS Level 1 compared to ETCS Level 2.
To decide on infill in ERTMS/ETCS level 1, the capacity gain should be analysed. The largest capacity gains with infill are expected in the areas of the bottlenecks and on lines operated by trains with different braking performance. As part of the assessment, the system delay times for the different infill methods should be analysed and it should be mapped which solutions the different suppliers can provide.
5.5 Automatic Train Operation (ATO)
Automatic Train Operation can increase capacity on the railway. This is achieved by optimized driving which enables reduced headways. With ATO higher punctuality can be reached by using the line data and real-time information, but higher capacity on increased communications is required. [42] Automatic Train Operation is divided into four grades of automation, as shown in table 10 and in figure 37. From GoA 0 to GoA 3 human involvement is required for driving, whereas GoA 4 is fully unattended. Only on GoA 3, where there is an attendant and no driver, infrastructure changes are required. [42, 44].

FTIA publications 43/2019 57
Table 10 Grades of Automation.
Grade of Automation
Train operation
ATP system Starting Driving &
stopping Door closure
Operation during disruption
GoA 0 Manual No Driver Driver Driver Driver
GoA 1 Non-automated (NTO)
Yes Driver Driver Driver Driver
GoA 2 Semi-automatic (STO)
Yes Driver/ Automatic Automatic Driver Driver
GoA 3 Driverless (DTO) Yes Automatic Automatic Attendant/A
utomatic Attendant
GoA 4 Unattended (UTO) Yes Automatic Automatic Automatic Automatic
Figure 37 Performance and Digitalisation of ATO Grades.
There exists ERTMS/ETCS level 2 lines (e.g. Thameslink in London) that are running GoA 2. To reach level GoA 4, video and infrared cameras and sufficient image processing system will need to be linked to the braking system for emergency brake function. Remote control is also required to the video circuit, and evolved data transmission system. The possibilities of adding ATO on top of ERTMS/ETCS is presented in a conceptual level on figure 38. [43]
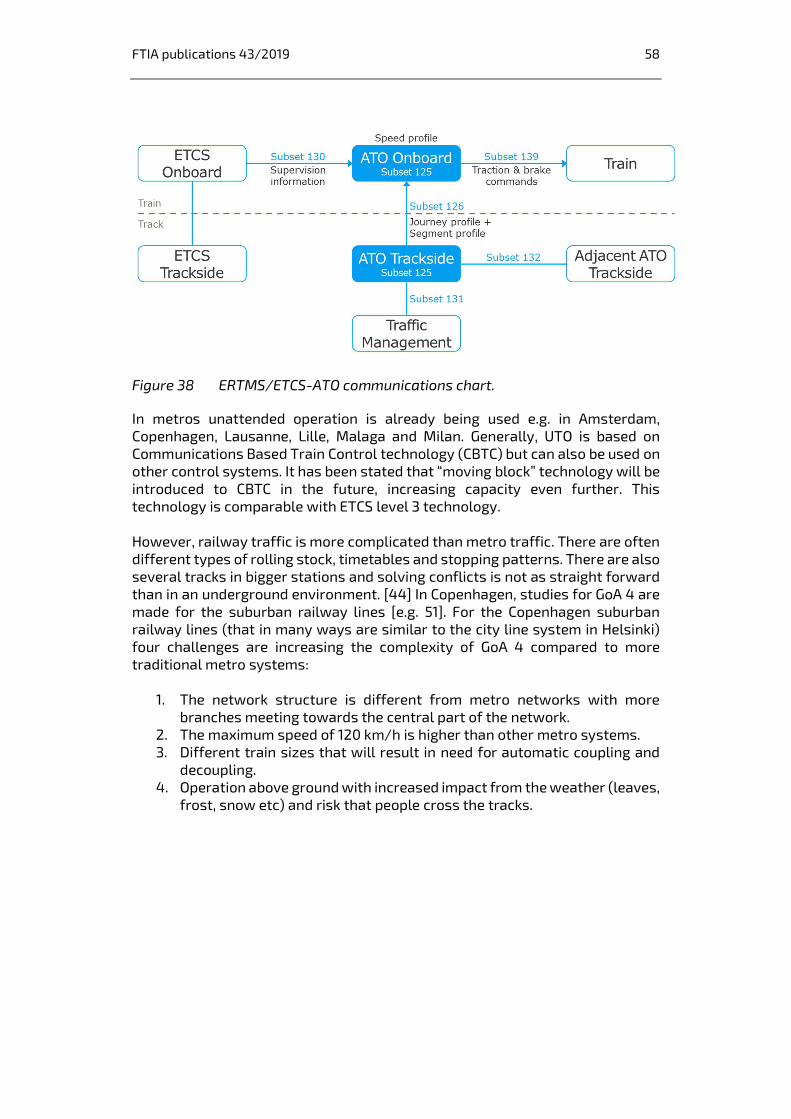
FTIA publications 43/2019 58
Figure 38 ERTMS/ETCS-ATO communications chart.
In metros unattended operation is already being used e.g. in Amsterdam, Copenhagen, Lausanne, Lille, Malaga and Milan. Generally, UTO is based on Communications Based Train Control technology (CBTC) but can also be used on other control systems. It has been stated that “moving block” technology will be introduced to CBTC in the future, increasing capacity even further. This technology is comparable with ETCS level 3 technology. However, railway traffic is more complicated than metro traffic. There are often different types of rolling stock, timetables and stopping patterns. There are also several tracks in bigger stations and solving conflicts is not as straight forward than in an underground environment. [44] In Copenhagen, studies for GoA 4 are made for the suburban railway lines [e.g. 51]. For the Copenhagen suburban railway lines (that in many ways are similar to the city line system in Helsinki) four challenges are increasing the complexity of GoA 4 compared to more traditional metro systems:
1. The network structure is different from metro networks with more branches meeting towards the central part of the network.
2. The maximum speed of 120 km/h is higher than other metro systems. 3. Different train sizes that will result in need for automatic coupling and
decoupling. 4. Operation above ground with increased impact from the weather (leaves,
frost, snow etc) and risk that people cross the tracks.
FTIA publications 43/2019 59
6 Summary and conclusions
6.1 Summary
The ERTMS/ETCS comes in three levels 1, 2 and 3. Level 1 is the most similar to the current Finnish signalling and Automatic Train Protection (ATP) system with block sections and discrete update of the train’s Movement Authority (MA). ERTMS/ETCS level 2 still has block sections but can result in more capacity due to continuous update of the train’s Movement Authority (MA) while the future development system, the not yet commercially available level 3 operates with moving blocks and hence can result in even more capacity. This work has analysed the capacity differences between the conventional Finnish signalling and Automatic Train Protection (ATP) system and ERTMS / ETCS level 1 and 2 by analysing the following scenarios:
As-is with JKV ETCS level 1 with existing block sections ETCS level 2 with existing block sections ETCS level 2 with shorter or improved block sections
The capacity analyses performed in this study are divided into general analyses and case studies for the urban railway lines between Helsinki and Kerava/ Leppävaara. These lines are chosen due to high capacity consumption and the plans to operate even more trains in the future. Besides, the urban railway lines with homogeneous operation is expected to result in the highest capacity benefits if changing from JKV to ERTMS /ETCS.
6.2 Conclusions
The case studies show only smaller capacity and line headway differences between JKV, and ETCS level 1 and 2 when the existing block sections are used. For JKV (and ETCS level 1) signal visibility limits the signal locations, and the lengths of block sections need to be coordinated with the braking distance. ERTMS/ETCS level 2 does not have the same limitations, why it is possible to have shorter block sections that can improve the capacity significantly. The case studies show that the minimum line headway can be reduced by 14% to 48%. The capacity consumption with the current operational pattern can be reduced from 67% with JKV to 50% on the Helsinki–Kerava line and from 70% to 61% on the Helsinki–Leppävaara line. The reduced capacity consumption with ERTMS/ETCS level 2 and improved block sections allows for a reduction in planned headway from 5 minutes to 3.75 minutes in the peak hours. With the improved block sections, the capacity limiting bottleneck the conflicting train movements in opposite directions at Helsinki central station, especially for trains to and from Leppävaara. This is to some extent also a limiting factor at Kerava and Leppävaara, however as half of the trains go the airport, Helsinki is the main bottleneck. With a further improvement of the block sections and partial release points at Helsinki central station, the capacity is likely to increase even more, especially on the line to Leppävaara.
FTIA publications 43/2019 60
The case study assumes trains arrive on “red” at stations (Movement Authority ending at the station). At the stations, where the signal or marker board is located close to the stopping location, this can result in extended arrival time as the driver is following the ERTMS/ETCS braking curve instead of braking freely. Arriving on “green” at stations (Movement Authority past the station) would allow faster approach to the station but with total longer block occupation times. Thereby, arriving on “red” (Movement Authority ending at the station) results in the highest capacity for high-density lines. In Finland the JKV and the ERTMS/ETCS braking curves used are very similarly. This is a main reason for the small capacity differences between JKV and ERTMS/ETCS level 1 when using the same block sections – when the block sections are adapted for JKV, the differences to ERTMS/ETCS level 2 are also minor if the block sections remain unchanged – however shorter or improved block sections can increase the capacity as described previously. A difference between JKV and ERTMS/ETCS is the release speed in braking curve for ERTMS/ETCS. Finland has decided a national value for the release speed of 15 km/h while the default value is 40 km/h. The analyses show the approach time to the stop of Sm5 trains can be reduced by 11 seconds if the release speed is raised to 40 km/h.
FTIA publications 43/2019 61
References
[1] Influence of ETCS on line capacity – Generic study, UIC 2008. Available: https://uic.org/cdrom/2011/05_ERTMS_training2011/docs/Capacity-generic-study.pdf (date of reference 17.7.2019) [2] ERTMS/ETCS-tason 2 kapasiteettihyödyt kaksiraiteisilla radoilla, Liikenne-viraston tutkimuksia ja selvityksiä 41/2018, Liikennevirasto, Helsinki 2018. Available: https://julkaisut.vayla.fi/pdf8/lts_2018-41_ertms_etcs-tason_web.pdf (date of reference 17.7.2019) [3] Functional Requirement Specifications for the ERTMS/ETCS System in Finland (ETCS FI-FRS), Guidelines of the Finnish Transport Agency 40eng/2018, Finnish Transport Agency, Helsinki 2018. Available: http://www.doria.fi/bitstream/handle/10024/165173/lo_2018-40_frs_eng_web.pdf?sequence=1&isAllowed=y (date of reference 17.7.2019) [4] Suomen kansalliset ERTM/ETCS-parametrit, Liikenneviraston ohjeita 20/2015. Available: https://julkaisut.vayla.fi/pdf8/lo_2015-20_suomen_kansalliset_web.pdf (date of reference 22.7.2019) [5] Eurooppalaisen rautatieliikenteen hallintajärjestelmän (ERTMS) Suomen kansallinen toteuttamissuunnitelma, Ratahallintokeskus, Rataverkko-osasto, Helsinki 2006. Available: https://ec.europa.eu/transport/sites/transport/files/national_implementation_plan_finland_0.pdf (date of reference 17.7.2019) [6] Eurooppalaisen rautatieliikenteen hallintajärjestelmän (ERTMS/ETCS) käyt-töönotto Suomessa, Suomen kansallinen täytäntöönpanosuunnitelma Euroo-pan komissioon vuonna 2017, Liikenneviraston ohjeita (42/2017). Available https://julkaisut.liikennevirasto.fi/pdf8/lts_2017-42_ertms_kayttoonotto_web.pdf (viitattu 3.5.2019) [7] 21.06.2016 Trafi/14975/03.04.02.00/2016 Raideliikenne: Ohjaus-, hallinta- ja merkinanto-osajärjestelmä, Trafi 2016. Available: file:///C:/Users/AJOKI/Downloads/TRAFI_14975_03_04_02_00_2016_FI_ohjaus-,_hallinta-_ja_merkinanto_-osajarjestelma.pdf (date of reference 17.7.2019) [8] Sr3-sähköveturit ovat tavaraliikenteessä 100% käytössä, VR Group Uutiset ja tiedotteet 8.1.2019, VR Group 2019. https://www.vrgroup.fi/fi/vrgroup/uutishuone/uutiset-ja-tiedotteet/sr3-sahkoveturit-ovat-tavaraliikenteessa-100-kaytossa-080120190847/ (date of reference 17.7.2019) [9] ERTMS/ETCS-järjestelmä siis tulee – kokemuksia Oikoradalta, Toni Jukuri 23.1.2018, VR Track 2018. Available: https://vayla.fi/documents/20485/417826/Jukuri_Toni_ERTMS+ETCS+-+j%C3%A4rjestelm%C3%A4+siis+tulee-+kokemuksia+Oikoradalta+-seminaariesitys.pdf/b9f48084-b1a5-4bf6-9ce3-b66d1b017d9b (date of reference 17.7.2019) [10] 15.04.2016 Trafi/26490/03.04.02.00/2014 Raideliikenne: Rautateiden viestintäjärjestelmä, Trafi 2016. Available: https://www.finlex.fi/fi/viranomaiset/normi/499001/42519 (date of reference 17.7.2019)
FTIA publications 43/2019 62
[11] The Bothnia Line is built for the future!, Railway Review 2009, Available: https://www.globalrailwayreview.com/article/3139/the-bothnia-line-is-built-for-the-future/ (date of reference 22.7.2019) [12] ERTMS Deployment in Sweden, ERTMS Factsheet #18, Available: http://www.ertms.net/wp-content/uploads/2018/10/18-ERTMS-deployment-in-Sweden.pdf (date of reference 17.7.2019) [13] Nytt signalsystem för järnvägen – effektiviteten i införandet av ERTMS, RIR 2018:21, Riksrevisionen 2018. Available: https://www.riksrevisionen.se/download/18.65d707c31647e67ea3698656/1534879060217/RiR_2018_21_ANPASSAD.PDF [14] ERTMS Deployment in Denmark, ERTMS Factsheets #19, Available: http://www.ertms.net/wp-content/uploads/2014/09/ERTMS_Factsheet_19_ERTMS_deployment_in_Denmark.pdf (date of reference 17.7.2019) [15] The Signalling Programme – A total renewal of the Danish signalling infrastructure, Banedanmark, 2nd edition, Copenhagen 2010. [16] Danish ETCS pilot route goes live, Railway Gazette 2018, Available: https://www.railwaygazette.com/news/infrastructure/single-view/view/danish-etcs-pilot-route-goes-live.html (date of reference 17.7.2019) [17] ERTMS National Implementation, Bane NOR SF 2015. Available: https://www.banenor.no/en/startpage1/Projects/ERTMS-National-Implementation/ (date of reference: 22.7.2019) [18] Norway’s ERTMS programme moves forward, Railway Gazette 2018. Available: https://www.railwaygazette.com/news/infrastructure/single-view/view/norways-ertms-programme-moves-forward.html (date of reference: 22.7.2019) [19] ERTMS Deployment World Map, The European Rail Traffic Management System. Available: http://www.ertms.net/?page_id=55 (date of reference 17.7.2019) [20] Rail – European Deployment Plan and National Implementation Plans, European Comission 2017. Available: https://ec.europa.eu/transport/modes/rail/ertms/ertms_deployment_en (date of reference 19.7.2019) [21] Rail – ERTMS-Levels and Modes, Transport Modes, European Comission. Available: https://ec.europa.eu/transport/modes/rail/ertms/what-is-ertms/levels_and_modes_en (date of reference 18.7.2019) [22] ERTMS Levels – different levels to match customer’s needs, ERTMS Factsheet #3, Available: http://www.ertms.net/wp-content/uploads/2018/10/3-ERTMS-Levels1.pdf (date of reference 18.7.2019) [23] European Train Control System, Wikipedia. Available: https://en.wikipedia.org/wiki/European_Train_Control_System (date of reference 19.7.2019)
FTIA publications 43/2019 63
[24] Infrastructure Capacity in the ERTMS Signalling System, A. Landex, L.W. Jensen, Rail Norrköping (organised by IAROR) 2019, 2019. [25] An assessment of railway capacity, M. Abril, F. Barer, L. Ingolotti, M.A. Salido, P. Tormos, A. Lova, Transportation Research Part E 44, 2007. [26] Planning the most suitable travel speed for high frequency railway lines, A. Landex, A.H. Kaas, DTU 2005. Available: https://orbit.dtu.dk/files/2677925/Paper_Final.pdf (date of reference 19.7.2019) [27] Introduction to ETCS Braking Curves, ERTMS UNIT, ERA_ERTMS_040026, European Railway Agency 2016. Available: https://www.era.europa.eu/sites/default/files/activities/docs/introduction_to_etcs_braking_curves_en.doc (date of reference 18.7.2019) [28] Kaukoliikenteen henkilöjunien jarrutuskykyvaatimusten tarkastaminen, Valtteri Mäntyjärvi, Opinnäytetyö 2/2017, Liikennevirasto, Helsinki 2017. Available: http://www.doria.fi/bitstream/handle/10024/144051/opin_2017-02_978-952-317-451-1.pdf?sequence=1&isAllowed=y (date of reference 18.7.2019) [29] Suomen kansalliset ERTMS/ETCS-parametrit, Yleisohjeistus, Liikenne-viraston ohjeita 20/2015, Liikennevirasto 2015. Available: https://julkaisut.vayla.fi/pdf8/lo_2015-20_suomen_kansalliset_web.pdf (date of reference 19.7.2019) [30] Tulevaisuuden junien kulunvalvontajärjestelmän (ERTMS) rajapinnan sovittaminen nykyisiin rautateiden turvalaitteisiin, Liikenneviraston tutkimuksia ja selvityksiä (47/2012), Liikennevirasto 2012, Available: https://julkaisut.liikennevirasto.fi/pdf3/lts_2012-47_tulevaisuuden_junien_web.pdf (Date of reference 19.7.2019) [31] Lähiliikenteen reittikartta, VR 2019. Available: https://www.vr.fi/cs/vr/fi/lahiliikenteen-reittikartta-fi (date of reference 19.7.2019) [32] moovitapp, Available: https://moovitapp.com/index/fi/julkinen_liikenne-line-A-Helsinki-1084-10220-217015-0 (date of reference 19.7.2019) [33] Helsingin välityskyvyn jatkotarkastelu, Juha Niminen, Liikenneviraston tutkimuksia ja selvityksiä 43/2010. Available: https://julkaisut.vayla.fi/pdf3/lts_2010-43_helsingin_valityskyvyn_web.pdf (date of reference 19.7.2019) [34] Helsingin ratapihan toiminnallisuuden parantaminen, Liikenneviraston suunnitelmia 1/2014. Available: https://vayla.fi/documents/20473/22970/Helra_l%C3%A4ht%C3%B6kohdat.pdf/ae8d6425-68b9-4d6d-8076-687db6de60e1 (date of reference 22.7.2019) [35] HELRA – Helsingin ratapihan toimivuuden parantaminen, Väylävirasto 2019. Available: https://vayla.fi/helra#.XTWYfOgzYuU (date of reference 22.7.2019) [36] Ratatiedon Extranet, Available: https://vayla.fi/palveluntuottajat/aineistot/ratatiedon-extranet#.XTgohegzaUl (date of reference 24.7.2019)

FTIA publications 43/2019 64
[37] Kalusto, Suomen Raitiotieseura Ry, Available: https://www.raitio.org/lahijunat/paakaupunkiseutu-hsl/kalusto/ (date of reference 24.7.2019) [38] ERTMS roll out from a train driver’s perspective, R. Van Der Weide, Sixth International Human Factors Rail Conference, 2017 Available: https://www.intergo.eu/public/Publicaties/12/bestand/2017_ERTMS%20roll%20out%20from%20a%20train%20driver's%20perspective.pdf (date of reference 24.7.2019) [39] Train Dwell Time Models for Rail Passenger Service, Hor Peay San and Mohd Idrus Mohd Masirin, EPD Sciences 2016, DOI: 10.1051/matecconf/ 20165703005. Available: https://www.matec-conferences.org/articles/matecconf/pdf/2016/10/matecconf_iconcees2016_03005.pdf (date of reference 24.7.2019) [40] Measures for track complexity and robustness of operation at stations, A. Landex, L.W. Jensen, Technical University of Denmark & Ramboll, 2013. Available: https://www.sciencedirect.com/science/article/pii/S221097061300019X?via%3Dihub#! (date of reference 1.8.2019) [41] Moving Block Signalling, Parliamentary Office of Science and Technology, United Kingdom, 2016. Available: https://medium.com/@POST_UK/moving-block-signalling-b9b0b9f498c2 (date of reference 29.7.2019) [42] The application of the upcoming standard on ATO over ETCS, R. Costa, M. Villalba, CAF Signalling, International Congress on High-speed Rail: Technologies and Long Term Impacts – Ciudad Real, Spain, 2018. Available: https://www.tecnica-vialibre.es/documentos/Articulos/360AV05_3.6.CostaVillalba.pdf (date of reference 30.7.2019) [43] Towards Automatic Train Operation for long distance services: State-of-the art and challenges, D. Emert, Conference paper STRC 2017, 2017. Available: http://www.strc.ch/2017/Emery.pdf (date of reference: 30.7.2019) [44] Junien autonominen ajo- Signal+Draht-lehden kongressi 10.-11.11.2016 Fuldassa, A.Härkönen, L. Matikainen, Rautatietekniikka 4, 2016. [45] Aikataulusuunnittelu ja rautatieliikenteen täsmällisyys, M. Mukula, Ratahallintokeskuksen julkaisuja A 1/2008, Ratahallintokeskus, 2008. Available: https://julkaisut.vayla.fi/pdf4/rhk_2008-a1_aikataulusuunnittelu_ja_web.pdf (date of reference 31.7.2019) [46] Railway Operation, A. Landex, A. H. Kaas, S. Hansen, Centre for Traffic and Transport, Technical University of Denmark, 2006. Available: https://orbit.dtu.dk/files/2470840/Teknisk%20rapport.pdf (date of reference 31.7.2019) [47] Methods to estimate railway capacity and passenger delays, A. Landex, Technical University of Denmark, 2008. Available: https://orbit.dtu.dk/files/4958696/Methods%20to%20estimate%20railway%20capacity%20and%20passenger%20delays(al).pdf (date of reference 31.7.2019) [48] Rail Traffic Engineering – Spring 2014, A. Landex

FTIA publications 43/2019 65
[49] UIC Code 405, Links between railway infrastructure capacity and the qualityof operations, International Union of Railways (UIC), 1996.
[50] UIC code 406, Capacity, International Union of Railways (UIC), 2004.
[51] Reorganisation of the S-bane for driveless operation, Ramboll/Parsons,Ministry of Transport, Buildings and Housing in Denmark, 2017. Available:https://www.trm.dk/en/publications/2017/reorganisation-of-the-s-bane-for-driverless-operation (date of reference 7.8.2019)
[52] ERTMS/ETCS-järjestelmä tulee Suomeen – miksi?, Aki Härkönen, Liikenne-virasto, 2018. Available:https://vayla.fi/documents/20485/417826/H%C3%A4rk%C3%B6nen_Aki_170123_ERTMS_RATA_2018.pdf/9aa7edbb-4a4f-49a1-99ae-5f8e6a3161a6 (date of reference 7.8.2019)
[53] Union International des Chemins de fer, UIC CODE 451-1 OR, Timetablerecovery margins to guarantee timekeeping – Recovery margins, 4th Edition,2000
[54] Timetable Design Principles, Pachl J., Eurailpress, 2008.
[55] Robustness indicators and capacity models for railway networks, L. W.Jensen, Technical University of Denmark, 2015. Available:https://orbit.dtu.dk/files/127799736/Lars_Wittrup_Jensen_PhD_thesis.pdf (date of referen-ce: 13.8.2019)
[56] ERTMS Deployment map, Available: http://www.ertms.net/?page_id=55 (date ofreference: 11.9.2019)
[57] Thameslink Programme, Available: https://www.thameslinkprogramme.co.uk/(date of reference: 11.9.2019)
[58] European Comission, Mobility and Transport, News 29/05/2017, Available:https://ec.europa.eu/transport/themes/infrastructure/news/new-ertms-signalling-system-installed-barcelona-suburban-rail-route_en (date of reference: 11.9.2019)
[59] CrossRiverRail, Available: https://crossriverrail.qld.gov.au/(date of reference: 11.9.2019)
[60] Railway/Pro, Queensland to invest in ETCS signalling system, 17/06/2016,Available: https://www.railwaypro.com/wp/queensland-to-invest-in-etcs-signalling-system/ (date of reference: 11.9.2019)
[61] ETCS & CBTC Interfaces – Crossrail Signalling, D. Milburn, MENA Conference,December 2015, Available: https://www.networkrailconsulting.com/news-and-publications/publications/etcs-and-cbtc-interfaces-crossrail-signalling/download (date ofreference: 11.9.2019)
[62] RailEngineer, Signalling Crossrail, D. Bickell Mirse, 08/01/2016, Available:https://www.railengineer.co.uk/2016/01/08/signalling-crossrail/ (date of reference: 11.9.2019)
FTIA publications 43/2019 66
[63] Transport for NSW, Digital Systems to transform Sydney’s rail network, 10/12/2018, Available: https://www.transport.nsw.gov.au/news-and-events/media-releases/digital-systems-to-transform-sydneys-rail-network (date of reference: 11.9.2019) [64] Synthesis report on NIP, Provision of Services to the European Commission in the field of nº MOVE/B2/2014‐670: “Services of technical support for the deployment of ERTMS along the core network corridors”, March 2, 2018, available: https://ec.europa.eu/transport/sites/transport/files/rail-nip/20180302-synthesis-report-on-nip.pdf (date of reference: 11.9.2019)
FTIA publications 43/2019 Appendix 1 / 1 (1)
Recommendation for further studies Speed profile
Conventional signalling and ATP systems may limit the speed of certain or all train types. This may be caused by a limited amount of block sections that can be supervised in front of the train resulting in restrictions on speed to decrease braking distance. Speed restrictions may also be caused by reduced signal visibility. With ERTMS/ETCS level 2, and to some extent ERTMS/ETCS level 1, such speed restrictions may be removed to allow faster running times. Further studies in to ERTMS/ETCS and line speed profiles will uncover which speed restrictions may be removed or relaxed on existing lines.
Optimised block sections With further improvement of block sections, release points and possibly different release speeds, even higher capacity may be possible on the lines to Kerava and Leppävaara studied in this project. Furthermore, some block sections are not critical or restricting and can be longer to save cost. Further studies into marker board positions and block sections will result in a more detailed design revealing detailed benefits and costs related to block sectioning.
Cost-Benefit analysis Replacing an already functional signalling system has a cost that must be offset by the benefits with the new system such as running time reductions, increased frequency and less delays resulting in reduced travel time, as well as reduced maintenance cost and increased safety. A cost-benefit analysis to uncover the cost and benefits is thus recommended for further studies.
Human Factors As the ERTMS/ETCS gives more information on movement authority than a conventional signalling system, the driver may be able to drive the train more optimally (e.g. not braking too early). This is not captured by capacity simulation software why the benefit in ERTMS/ETCS level 2 compared to JKV may be underestimated in some situations. A suggestion for further studies is therefore to study the driving behaviour of train drivers for both JKV and ERTMS/ETCS level 2 (in a simulator) as well as collecting experience from other countries to reveal how human factors affect the driving under JKV and ERTMS/ETCS.
ERTMS/ETCS Level 1 optimising block sections and using infill possibilities ERTMS/ETCS level 1 with improved block sections may result in capacity benefits compared to JKV and is therefore a suggestion for further studies. Similarly the usage of infill can improve capacity.
ERTMS/ETCS Level 3 and hybrid Level 2/3
Compared to ERTMS/ETCS level 2 or 3 or a level 2/3 hybrid may yield an additional capacity increase. A hybrid system may be used for the long-distance tracks where trains such as freight trains will operate under ERTMS/ETCS level 2 (as train integrity cannot be guaranteed under level 3) and certain passenger trains (e.g. multiple units) may be operated under level 3. In the city line tracks, level 3 may be used. Further studies of other ERTMS/ETCS levels may therefore reveal additional benefits to be achieved compared to a pure level 2 implementation.
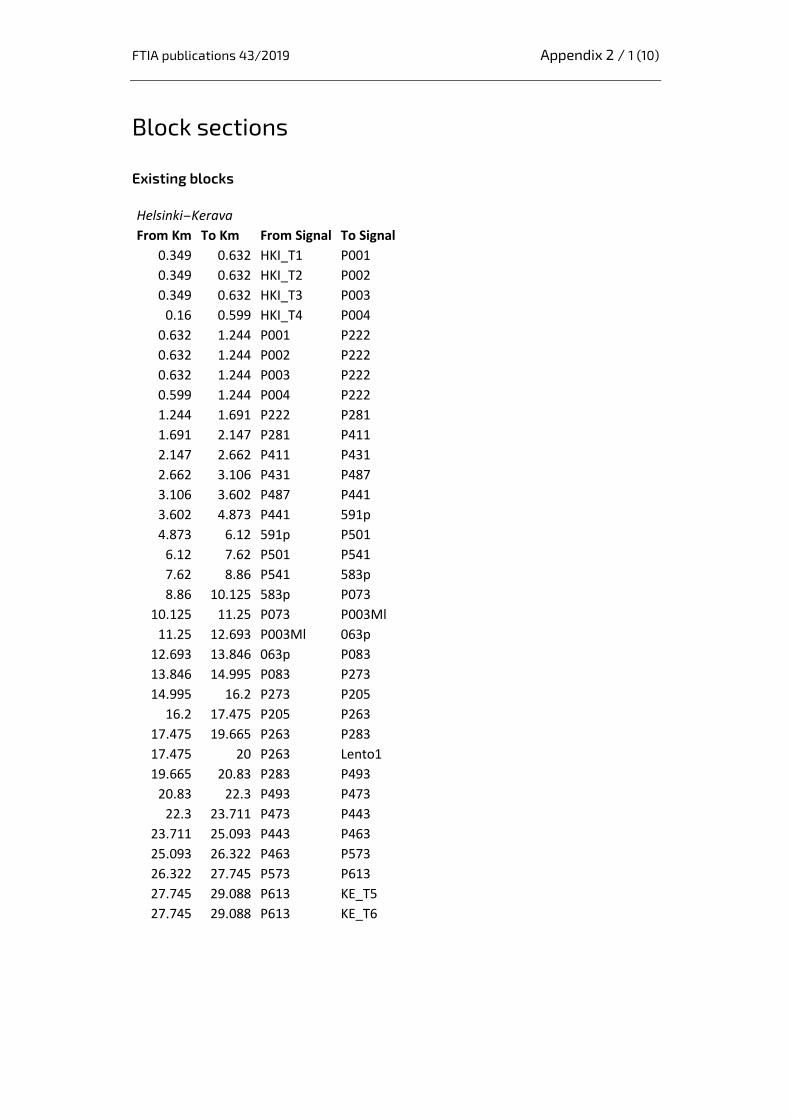
FTIA publications 43/2019 Appendix 2 / 1 (10)
Block sections Existing blocks Helsinki–Kerava From Km To Km From Signal To Signal
0.349 0.632 HKI_T1 P001 0.349 0.632 HKI_T2 P002 0.349 0.632 HKI_T3 P003
0.16 0.599 HKI_T4 P004 0.632 1.244 P001 P222 0.632 1.244 P002 P222 0.632 1.244 P003 P222 0.599 1.244 P004 P222 1.244 1.691 P222 P281 1.691 2.147 P281 P411 2.147 2.662 P411 P431 2.662 3.106 P431 P487 3.106 3.602 P487 P441 3.602 4.873 P441 591p 4.873 6.12 591p P501
6.12 7.62 P501 P541 7.62 8.86 P541 583p 8.86 10.125 583p P073
10.125 11.25 P073 P003Ml 11.25 12.693 P003Ml 063p
12.693 13.846 063p P083 13.846 14.995 P083 P273 14.995 16.2 P273 P205
16.2 17.475 P205 P263 17.475 19.665 P263 P283 17.475 20 P263 Lento1 19.665 20.83 P283 P493
20.83 22.3 P493 P473 22.3 23.711 P473 P443
23.711 25.093 P443 P463 25.093 26.322 P463 P573 26.322 27.745 P573 P613 27.745 29.088 P613 KE_T5 27.745 29.088 P613 KE_T6

FTIA publications 43/2019 Appendix 2 / 2 (10)
Kerava–Helsinki From Km To Km From Signal To Signal
29.088 28.682 KE_T5 E605 28.682 26.322 E605 E614 29.088 28.682 KE_T6 E606 28.682 26.322 E606 E614 26.322 25.093 E614 E574 25.093 23.711 E574 E464 23.711 22.3 E464 E444
22.3 20.83 E444 E474 20.83 19.665 E474 E494
19.665 18.151 E494 E284 18.151 16.757 E284 E264
20 17.981 Lento2 E286 17.981 16.757 E286 E264 16.757 15.823 E264 E206 15.823 14.5 E206 274e
14.5 13.16 274e E084 13.16 11.961 E084 E064
11.961 10.747 E064 004e 10.747 9.729 004e E074
9.729 8.585 E074 E584 8.585 6.948 E584 540e 6.948 5.657 540e E500 5.657 4.729 E500 E480 4.729 3.161 E480 E440 3.161 2.753 E440 E486 2.753 2.328 E486 E430 2.328 1.92 E430 E410
1.92 1.443 E410 E280 1.443 1.01 E280 E220
1.01 0.344 E220 HKI_T1 1.01 0.344 E220 HKI_T2 1.01 0.344 E220 HKI_T3 1.01 0.16 E220 HKI_T4
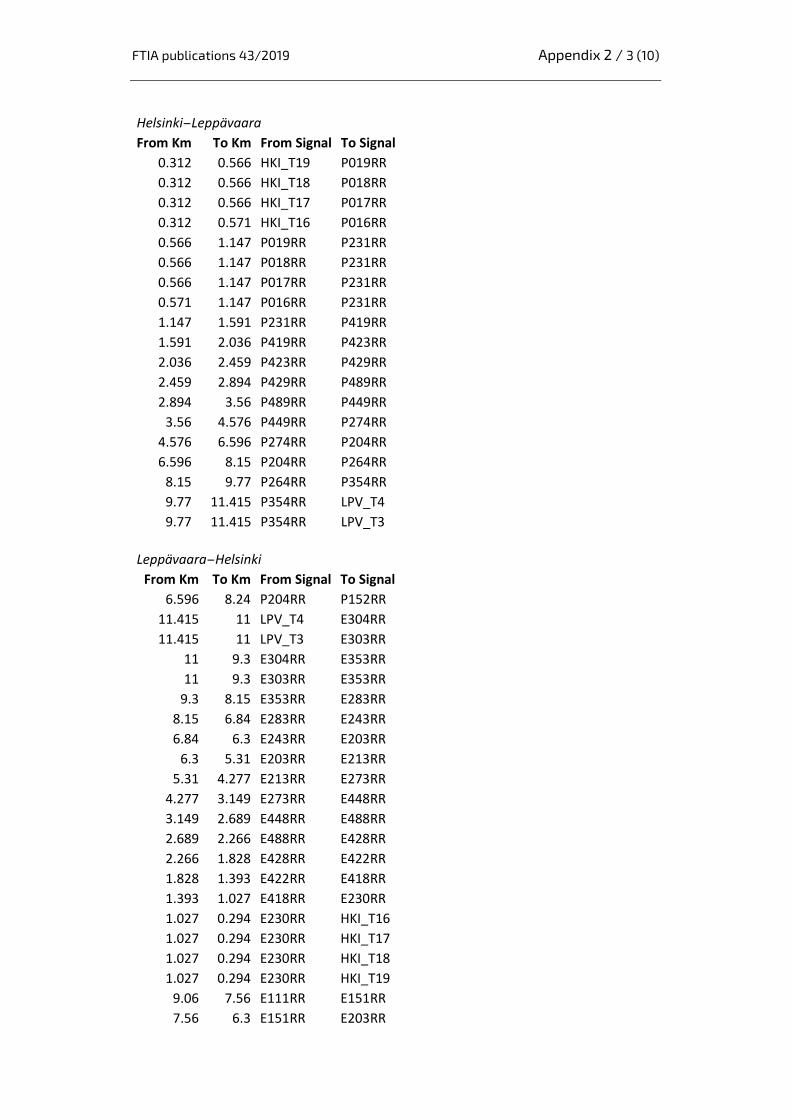
FTIA publications 43/2019 Appendix 2 / 3 (10)
Helsinki–Leppävaara From Km To Km From Signal To Signal
0.312 0.566 HKI_T19 P019RR 0.312 0.566 HKI_T18 P018RR 0.312 0.566 HKI_T17 P017RR 0.312 0.571 HKI_T16 P016RR 0.566 1.147 P019RR P231RR 0.566 1.147 P018RR P231RR 0.566 1.147 P017RR P231RR 0.571 1.147 P016RR P231RR 1.147 1.591 P231RR P419RR 1.591 2.036 P419RR P423RR 2.036 2.459 P423RR P429RR 2.459 2.894 P429RR P489RR 2.894 3.56 P489RR P449RR
3.56 4.576 P449RR P274RR 4.576 6.596 P274RR P204RR 6.596 8.15 P204RR P264RR
8.15 9.77 P264RR P354RR 9.77 11.415 P354RR LPV_T4 9.77 11.415 P354RR LPV_T3
Leppävaara–Helsinki
From Km To Km From Signal To Signal 6.596 8.24 P204RR P152RR
11.415 11 LPV_T4 E304RR 11.415 11 LPV_T3 E303RR
11 9.3 E304RR E353RR 11 9.3 E303RR E353RR
9.3 8.15 E353RR E283RR 8.15 6.84 E283RR E243RR 6.84 6.3 E243RR E203RR
6.3 5.31 E203RR E213RR 5.31 4.277 E213RR E273RR
4.277 3.149 E273RR E448RR 3.149 2.689 E448RR E488RR 2.689 2.266 E488RR E428RR 2.266 1.828 E428RR E422RR 1.828 1.393 E422RR E418RR 1.393 1.027 E418RR E230RR 1.027 0.294 E230RR HKI_T16 1.027 0.294 E230RR HKI_T17 1.027 0.294 E230RR HKI_T18 1.027 0.294 E230RR HKI_T19
9.06 7.56 E111RR E151RR 7.56 6.3 E151RR E203RR
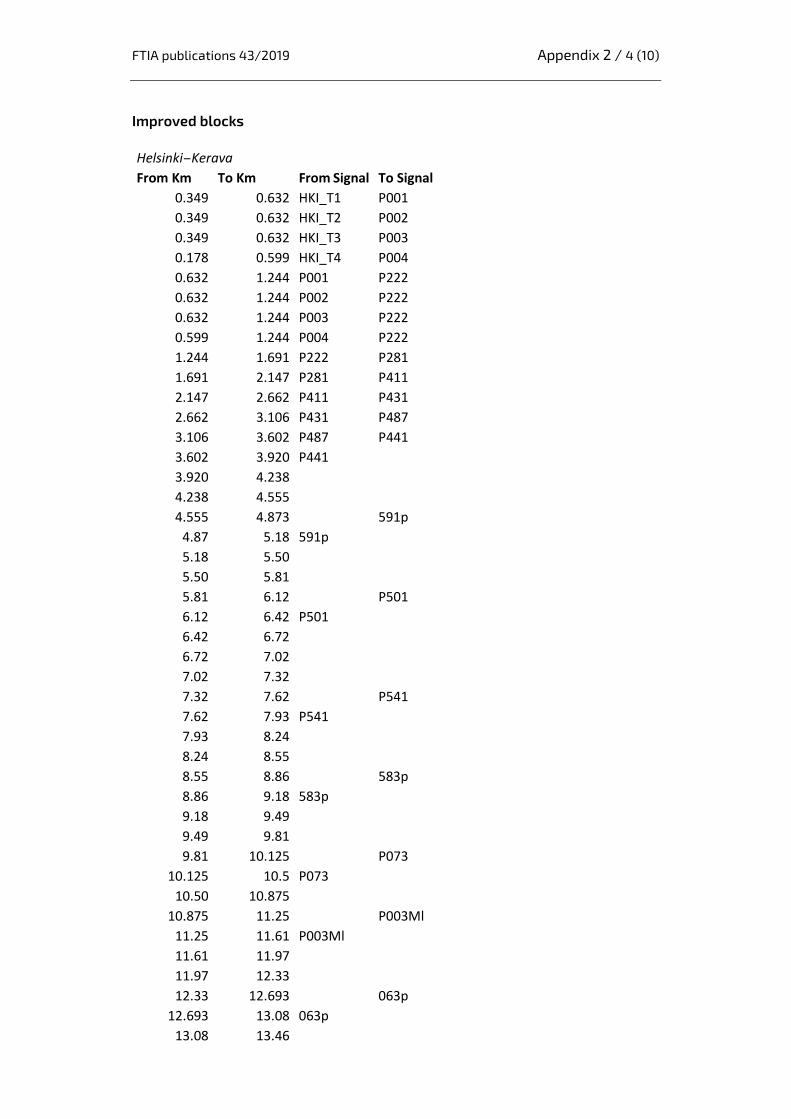
FTIA publications 43/2019 Appendix 2 / 4 (10)
Improved blocks Helsinki–Kerava From Km To Km From Signal To Signal
0.349 0.632 HKI_T1 P001 0.349 0.632 HKI_T2 P002 0.349 0.632 HKI_T3 P003 0.178 0.599 HKI_T4 P004 0.632 1.244 P001 P222 0.632 1.244 P002 P222 0.632 1.244 P003 P222 0.599 1.244 P004 P222 1.244 1.691 P222 P281 1.691 2.147 P281 P411 2.147 2.662 P411 P431 2.662 3.106 P431 P487 3.106 3.602 P487 P441 3.602 3.920 P441 3.920 4.238 4.238 4.555 4.555 4.873 591p
4.87 5.18 591p 5.18 5.50 5.50 5.81 5.81 6.12 P501
6.12 6.42 P501 6.42 6.72 6.72 7.02 7.02 7.32 7.32 7.62 P541
7.62 7.93 P541 7.93 8.24 8.24 8.55 8.55 8.86 583p
8.86 9.18 583p 9.18 9.49 9.49 9.81 9.81 10.125 P073
10.125 10.5 P073 10.50 10.875
10.875 11.25 P003Ml 11.25 11.61 P003Ml 11.61 11.97 11.97 12.33 12.33 12.693 063p
12.693 13.08 063p 13.08 13.46

FTIA publications 43/2019 Appendix 2 / 5 (10)
Helsinki–Kerava From Km To Km From Signal To Signal
13.46 13.846 P083
13.846 14.23 P083 14.23 14.5 14.50 14.995 P273
14.995 15.30 P273 15.30 15.60 15.60 15.90 15.90 16.2 P205
16.2 16.52 P205 16.52 16.84 16.84 17.16 17.16 17.475 P263
17.475 17.83 P263 17.83 18.143 18.14 18.456 18.46 18.769 18.77 19.081 19.08 19.394 19.39 19.665 P283
17.475 17.83 P263 17.83 18.1 18.10 18.42 18.42 18.8 18.80 19.12 19.12 19.43 19.43 19.75 19.75 20
19.665 20.05 P283 20.05 20.44 20.44 20.83 P493
20.83 21.20 P493 21.20 21.57 21.57 21.93 21.93 22.3 P473
22.3 22.65 P473 22.65 23.01 23.01 23.36 23.36 23.711 P443
23.711 24.06 P443 24.06 24.40 24.40 24.75 24.75 25.093 P463
25.093 25.40 P463 25.40 25.71 25.71 26.01
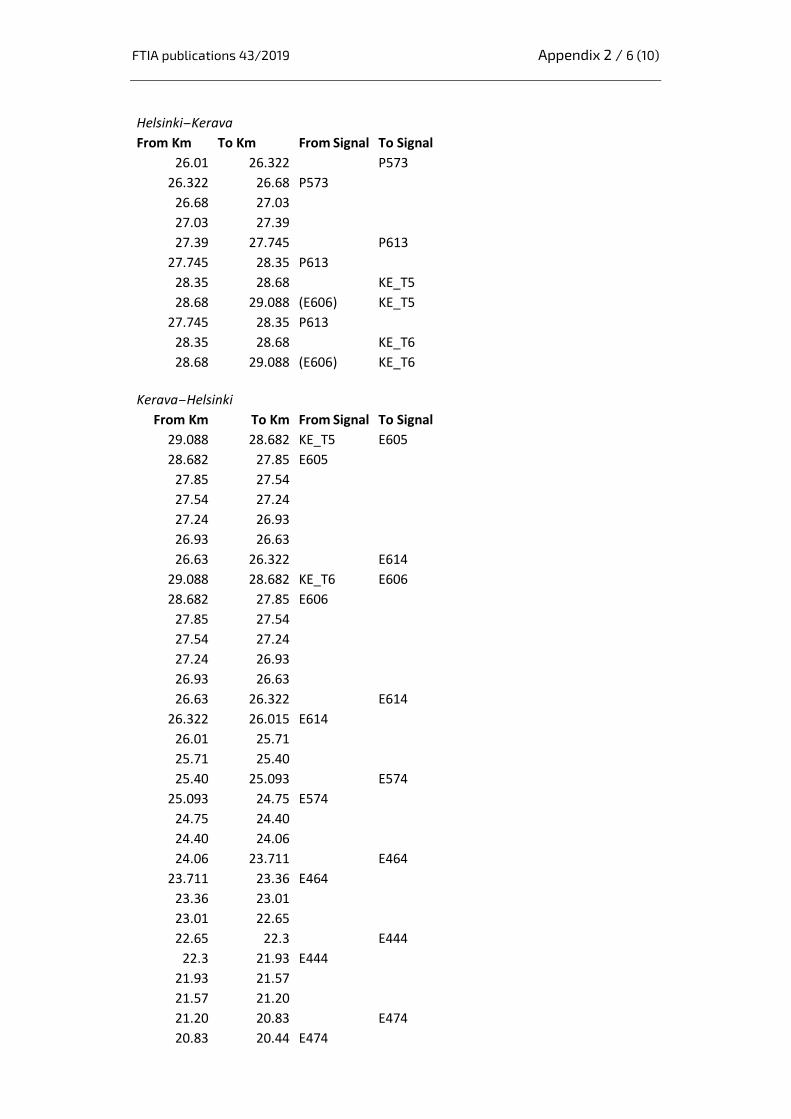
FTIA publications 43/2019 Appendix 2 / 6 (10)
Helsinki–Kerava From Km To Km From Signal To Signal
26.01 26.322 P573
26.322 26.68 P573 26.68 27.03 27.03 27.39 27.39 27.745 P613
27.745 28.35 P613 28.35 28.68 KE_T5
28.68 29.088 (E606) KE_T5 27.745 28.35 P613
28.35 28.68 KE_T6
28.68 29.088 (E606) KE_T6 Kerava–Helsinki
From Km To Km From Signal To Signal 29.088 28.682 KE_T5 E605 28.682 27.85 E605
27.85 27.54 27.54 27.24 27.24 26.93 26.93 26.63 26.63 26.322 E614
29.088 28.682 KE_T6 E606 28.682 27.85 E606
27.85 27.54 27.54 27.24 27.24 26.93 26.93 26.63 26.63 26.322 E614
26.322 26.015 E614 26.01 25.71 25.71 25.40 25.40 25.093 E574
25.093 24.75 E574 24.75 24.40 24.40 24.06 24.06 23.711 E464
23.711 23.36 E464 23.36 23.01 23.01 22.65 22.65 22.3 E444
22.3 21.93 E444 21.93 21.57 21.57 21.20 21.20 20.83 E474
20.83 20.44 E474
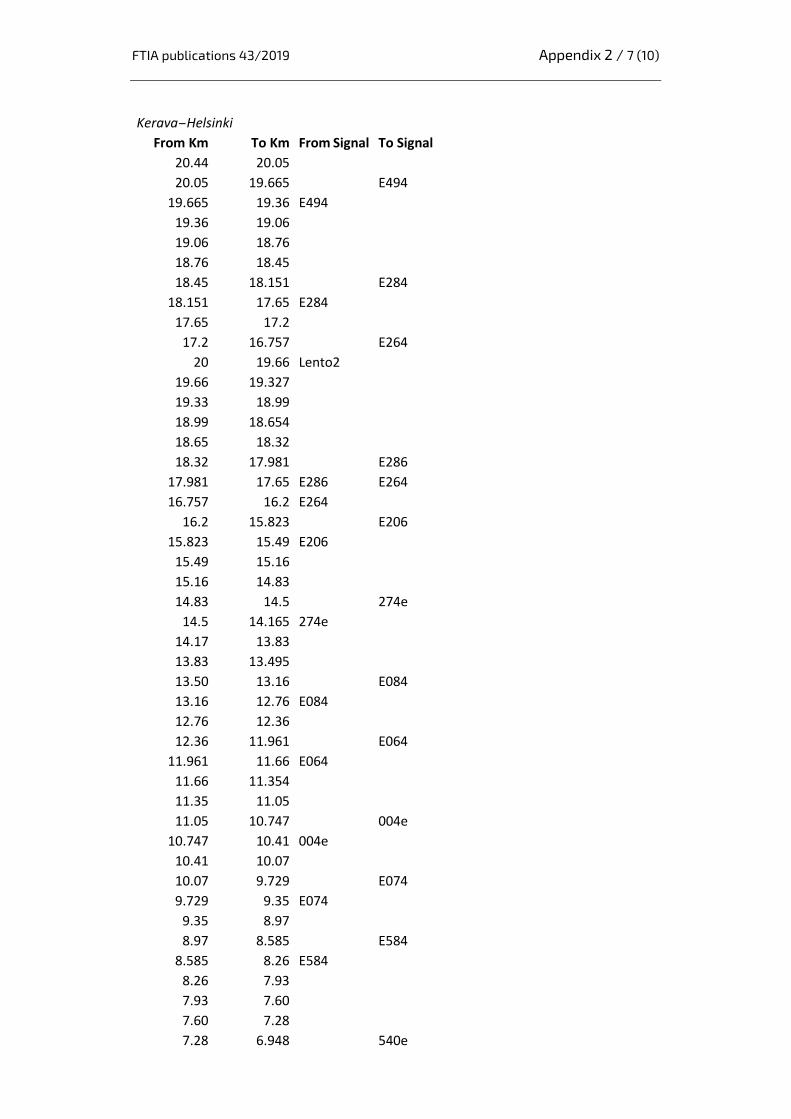
FTIA publications 43/2019 Appendix 2 / 7 (10)
Kerava–Helsinki From Km To Km From Signal To Signal
20.44 20.05 20.05 19.665 E494
19.665 19.36 E494 19.36 19.06 19.06 18.76 18.76 18.45 18.45 18.151 E284
18.151 17.65 E284 17.65 17.2
17.2 16.757 E264
20 19.66 Lento2 19.66 19.327 19.33 18.99 18.99 18.654 18.65 18.32 18.32 17.981 E286
17.981 17.65 E286 E264 16.757 16.2 E264
16.2 15.823 E206
15.823 15.49 E206 15.49 15.16 15.16 14.83 14.83 14.5 274e
14.5 14.165 274e 14.17 13.83 13.83 13.495 13.50 13.16 E084
13.16 12.76 E084 12.76 12.36 12.36 11.961 E064
11.961 11.66 E064 11.66 11.354 11.35 11.05 11.05 10.747 004e
10.747 10.41 004e 10.41 10.07 10.07 9.729 E074
9.729 9.35 E074 9.35 8.97 8.97 8.585 E584
8.585 8.26 E584 8.26 7.93 7.93 7.60 7.60 7.28 7.28 6.948 540e
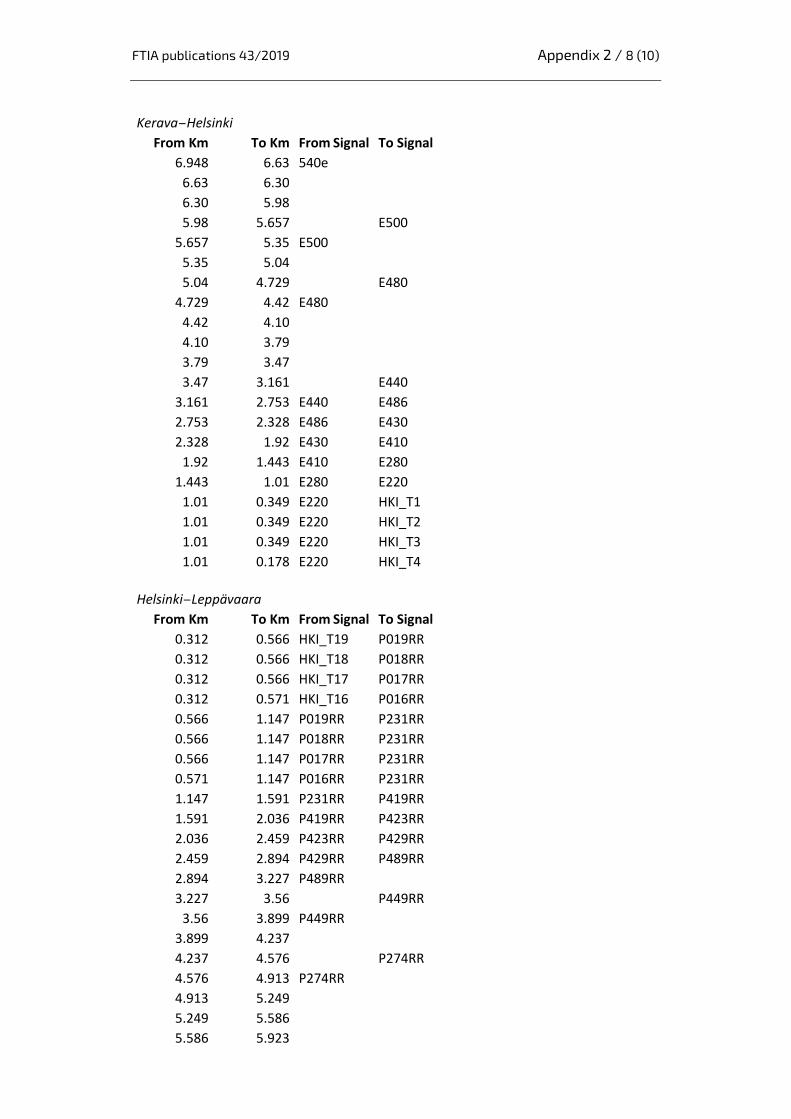
FTIA publications 43/2019 Appendix 2 / 8 (10)
Kerava–Helsinki From Km To Km From Signal To Signal
6.948 6.63 540e 6.63 6.30 6.30 5.98 5.98 5.657 E500
5.657 5.35 E500 5.35 5.04 5.04 4.729 E480
4.729 4.42 E480 4.42 4.10 4.10 3.79 3.79 3.47 3.47 3.161 E440
3.161 2.753 E440 E486 2.753 2.328 E486 E430 2.328 1.92 E430 E410
1.92 1.443 E410 E280 1.443 1.01 E280 E220
1.01 0.349 E220 HKI_T1 1.01 0.349 E220 HKI_T2 1.01 0.349 E220 HKI_T3 1.01 0.178 E220 HKI_T4
Helsinki–Leppävaara
From Km To Km From Signal To Signal 0.312 0.566 HKI_T19 P019RR 0.312 0.566 HKI_T18 P018RR 0.312 0.566 HKI_T17 P017RR 0.312 0.571 HKI_T16 P016RR 0.566 1.147 P019RR P231RR 0.566 1.147 P018RR P231RR 0.566 1.147 P017RR P231RR 0.571 1.147 P016RR P231RR 1.147 1.591 P231RR P419RR 1.591 2.036 P419RR P423RR 2.036 2.459 P423RR P429RR 2.459 2.894 P429RR P489RR 2.894 3.227 P489RR 3.227 3.56 P449RR
3.56 3.899 P449RR 3.899 4.237 4.237 4.576 P274RR
4.576 4.913 P274RR 4.913 5.249 5.249 5.586 5.586 5.923
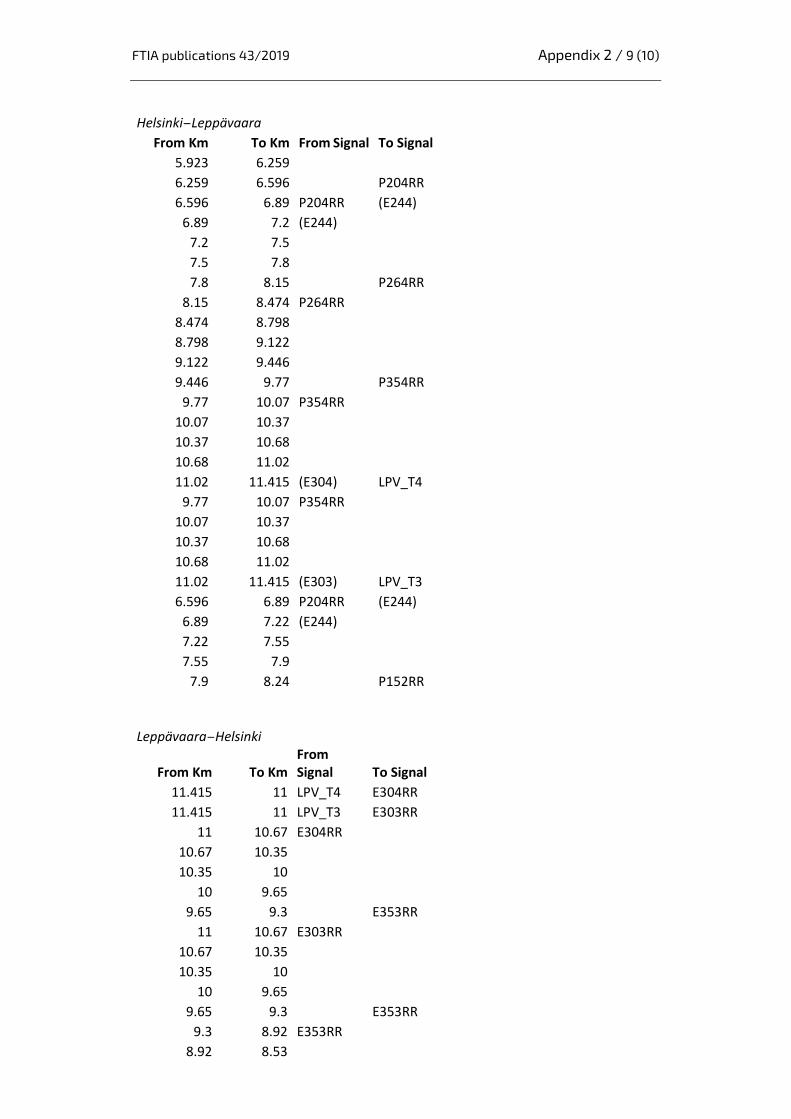
FTIA publications 43/2019 Appendix 2 / 9 (10)
Helsinki–Leppävaara From Km To Km From Signal To Signal
5.923 6.259 6.259 6.596 P204RR
6.596 6.89 P204RR (E244) 6.89 7.2 (E244)
7.2 7.5 7.5 7.8 7.8 8.15 P264RR
8.15 8.474 P264RR 8.474 8.798 8.798 9.122 9.122 9.446 9.446 9.77 P354RR
9.77 10.07 P354RR 10.07 10.37 10.37 10.68 10.68 11.02 11.02 11.415 (E304) LPV_T4
9.77 10.07 P354RR 10.07 10.37 10.37 10.68 10.68 11.02 11.02 11.415 (E303) LPV_T3 6.596 6.89 P204RR (E244)
6.89 7.22 (E244) 7.22 7.55 7.55 7.9
7.9 8.24 P152RR Leppävaara–Helsinki
From Km To Km From Signal To Signal
11.415 11 LPV_T4 E304RR 11.415 11 LPV_T3 E303RR
11 10.67 E304RR 10.67 10.35 10.35 10
10 9.65 9.65 9.3 E353RR
11 10.67 E303RR 10.67 10.35 10.35 10
10 9.65 9.65 9.3 E353RR
9.3 8.92 E353RR 8.92 8.53
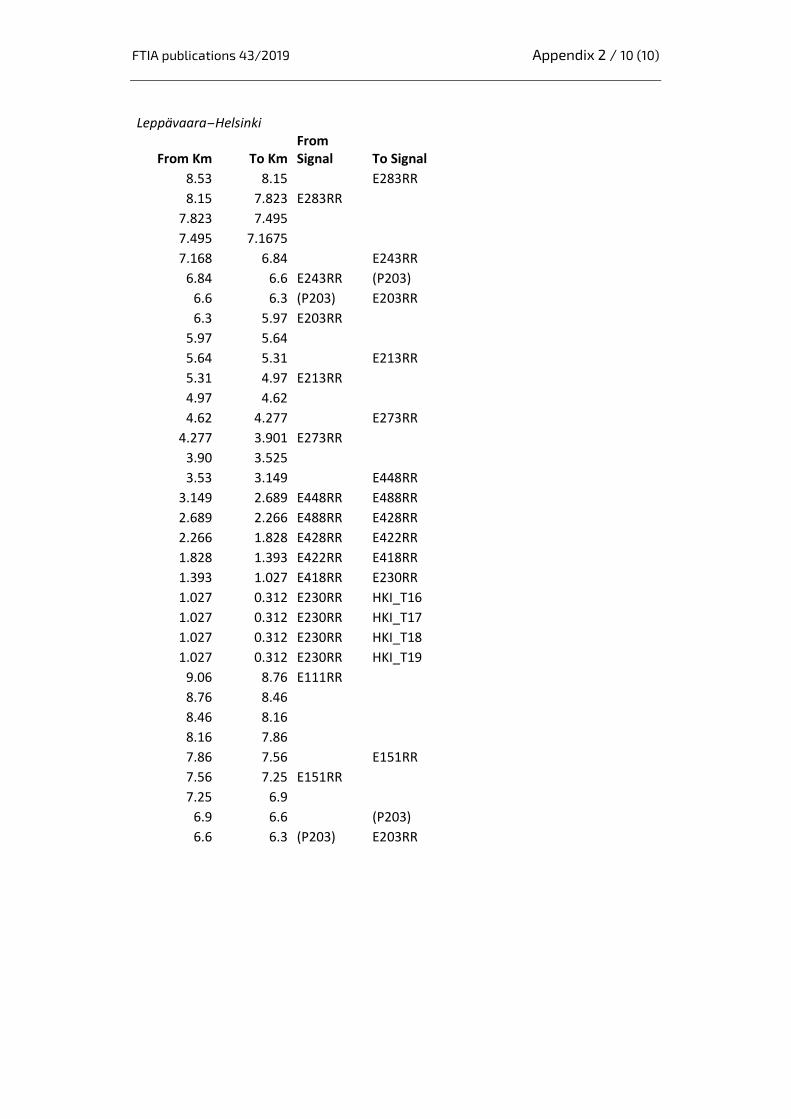
FTIA publications 43/2019 Appendix 2 / 10 (10)
Leppävaara–Helsinki
From Km To Km From Signal To Signal
8.53 8.15 E283RR
8.15 7.823 E283RR 7.823 7.495 7.495 7.1675 7.168 6.84 E243RR
6.84 6.6 E243RR (P203) 6.6 6.3 (P203) E203RR 6.3 5.97 E203RR
5.97 5.64 5.64 5.31 E213RR
5.31 4.97 E213RR 4.97 4.62 4.62 4.277 E273RR
4.277 3.901 E273RR 3.90 3.525 3.53 3.149 E448RR
3.149 2.689 E448RR E488RR 2.689 2.266 E488RR E428RR 2.266 1.828 E428RR E422RR 1.828 1.393 E422RR E418RR 1.393 1.027 E418RR E230RR 1.027 0.312 E230RR HKI_T16 1.027 0.312 E230RR HKI_T17 1.027 0.312 E230RR HKI_T18 1.027 0.312 E230RR HKI_T19
9.06 8.76 E111RR 8.76 8.46 8.46 8.16 8.16 7.86 7.86 7.56 E151RR
7.56 7.25 E151RR 7.25 6.9
6.9 6.6 (P203) 6.6 6.3 (P203) E203RR

FTIA publications 43/2019 Appendix 3 / 1 (2)
Detailed results Minimum line headway times in seconds:
Section Main line from
Helsinki Main line to
Helsinki Rantarata
from Helsinki Rantarata to
Helsinki
Exis
ting
bloc
k se
ctio
ns
JKV
First and second train: Kerava/Leppävaara 191.2 235.0 260.3 166.8 First train: Kerava/Leppävaara, Second train: Airport 189.31 226.6 177.684 160.689 First train: Airport, Second train: Kerava/Leppävaara 189.252 203.54 177.684 161.72 Avg. alternatning between a train Kerava/Leppävaara and the Airport 189.3 215.1 177.7 161.2
Level 1
First and second train: Kerava/Leppävaara 192.932 236.703 262.034 168.467 First train: Kerava/Leppävaara, Second train: Airport 190.952 228.3 179.384 162.389 First train: Airport, Second train: Kerava/Leppävaara 191.01 203.24 179.384 158.179 Avg. alternatning between a train Kerava/Leppävaara and the Airport 191.0 215.8 179.4 160.3
Level 2
First and second train: Kerava/Leppävaara 194.882 199.911 263.984 170.417 First train: Kerava/Leppävaara, Second train: Airport 192.902 230.3 181.334 161.513 First train: Airport, Second train: Kerava/Leppävaara 192.96 197.77 181.334 162.545 Avg. alternatning between a train Kerava/Leppävaara and the Airport 192.9 214.0 181.3 162.0
Impr
oved
bl
ock
sect
ions
Level 2 improved
First and second train: Kerava/Leppävaara 137.7 140.4 136.3 139.0 First train: Kerava/Leppävaara, Second train: Airport 135.7 135.6 134.887 139.015 First train: Airport, Second train: Kerava/Leppävaara 135.7 138.26 134.887 139.015
Avg. alternatning between a train Kerava/Leppävaara and the Airport 135.7 136.9 134.9 139.0

FTIA publications 43/2019 Appendix 3 / 2 (2)
Existing block sections Improved block sections
Level 1 Level 2 Level 2
Firs
t and
sec
ond
trai
n:
Kera
va/L
eppä
vaar
a Fi
rst t
rain
: Ke
rava
/Lep
päva
ara,
Sec
ond
trai
n: A
irpor
t Fi
rst t
rain
: Airp
ort,
Seco
nd
trai
n: K
erav
a/Le
ppäv
aara
Av
g. a
ltern
atni
ng b
etw
een
a tr
ain
Kera
va/L
eppä
vaar
a an
d th
e Ai
rpor
t Fi
rst a
nd s
econ
d tr
ain:
Ke
rava
/Lep
päva
ara
Firs
t tra
in:
Kera
va/L
eppä
vaar
a, S
econ
d tr
ain:
Airp
ort
Firs
t tra
in: A
irpor
t, Se
cond
tr
ain:
Ker
ava/
Lepp
ävaa
ra
Avg.
alte
rnat
ning
bet
wee
n a
trai
n Ke
rava
/Lep
päva
ara
and
the
Airp
ort
Fi
rst a
nd s
econ
d tr
ain:
Ke
rava
/Lep
päva
ara
Firs
t tra
in:
Kera
va/L
eppä
vaar
a, S
econ
d tr
ain:
Airp
ort
Firs
t tra
in: A
irpor
t, Se
cond
tr
ain:
Ker
ava/
Lepp
ävaa
ra
Avg.
alte
rnat
ning
bet
wee
n a
trai
n Ke
rava
/Lep
päva
ara
and
the
Airp
ort
Impr
ovem
ent
[sec
s]
Section Main line from Helsinki -1.7 -1.6 -1.8 -1.7 -3.7 -3.6 -3.7 -3.6 53.5 53.6 53.6 53.6 Main line to Helsinki -1.7 -1.7 0.3 -0.7 35.1 -3.7 5.8 1.1 94.6 91.0 65.3 78.1 Rantarata from Helsinki -1.7 -1.7 -1.7 -1.7 -3.6 -3.7 -3.7 -3.7 124.1 42.8 42.8 42.8 Rantarata to Helsinki -1.7 -1.7 3.5 0.9 -3.7 -0.8 -0.8 -0.8 27.8 21.7 22.7 22.2
Rela
tive
impr
ovem
ent Section
Main line from Helsinki -0.9% -0.9% -0.9% -0.9% -1.9% -1.9% -2.0% -1.9% 28.0% 28.3% 28.3% 28.3% Main line to Helsinki -0.7% -0.8% 0.1% -0.3% 14.9% -1.6% 2.8% 0.5% 40.3% 40.2% 32.1% 36.3% Rantarata from Helsinki -0.7% -1.0% -1.0% -1.0% -1.4% -2.1% -2.1% -2.1% 47.7% 24.1% 24.1% 24.1% Rantarata to Helsinki -1.0% -1.1% 2.2% 0.6% -2.2% -0.5% -0.5% -0.5% 16.6% 13.5% 14.0% 13.8%
ISSN 2490-0745 ISBN 978-952-317-722-2www.vayla.fi


![ERTMS UNIT ASSIGNMENT OF VALUES TO ETCS … · In its role as system authority [1] for ERTMS, the European Railway Agency is responsible for the assignment of values to ETCS …](https://static.documents.pub/doc/80x56/5b5e280f7f8b9a310a8be306/ertms-unit-assignment-of-values-to-etcs-in-its-role-as-system-authority-1.jpg)


