122
ESADE Barcelona February 6 th 2014

ESADE Barcelona
February 6th 2014
1. Technical sheet
2. Winter 2014 transfer window: Premier League vs
other top European leagues
3. La Liga on going season review
4. European football table 2013/14
5. Case study: Impact of UEFA’s Financial Fair Play
6. Conclusions
7. Annexes
SOCCEREX TRANSFER REVIEW 2014- WINTER WINDOW
2
CONTENT
MISSION
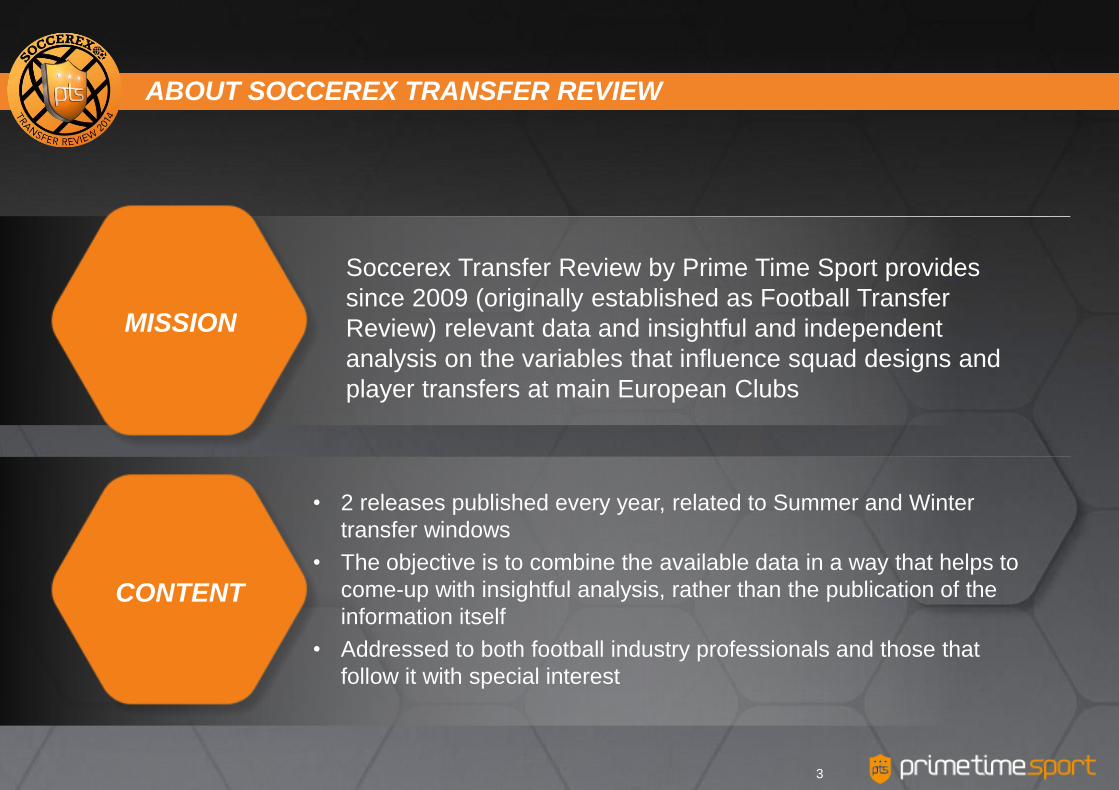
Soccerex Transfer Review by Prime Time Sport provides
since 2009 (originally established as Football Transfer
Review) relevant data and insightful and independent
analysis on the variables that influence squad designs and
player transfers at main European Clubs
• 2 releases published every year, related to Summer and Winter
transfer windows
• The objective is to combine the available data in a way that helps to
come-up with insightful analysis, rather than the publication of the
information itself
• Addressed to both football industry professionals and those that
follow it with special interest
ABOUT SOCCEREX TRANSFER REVIEW
3
SPECIFICATIONS
TEAM
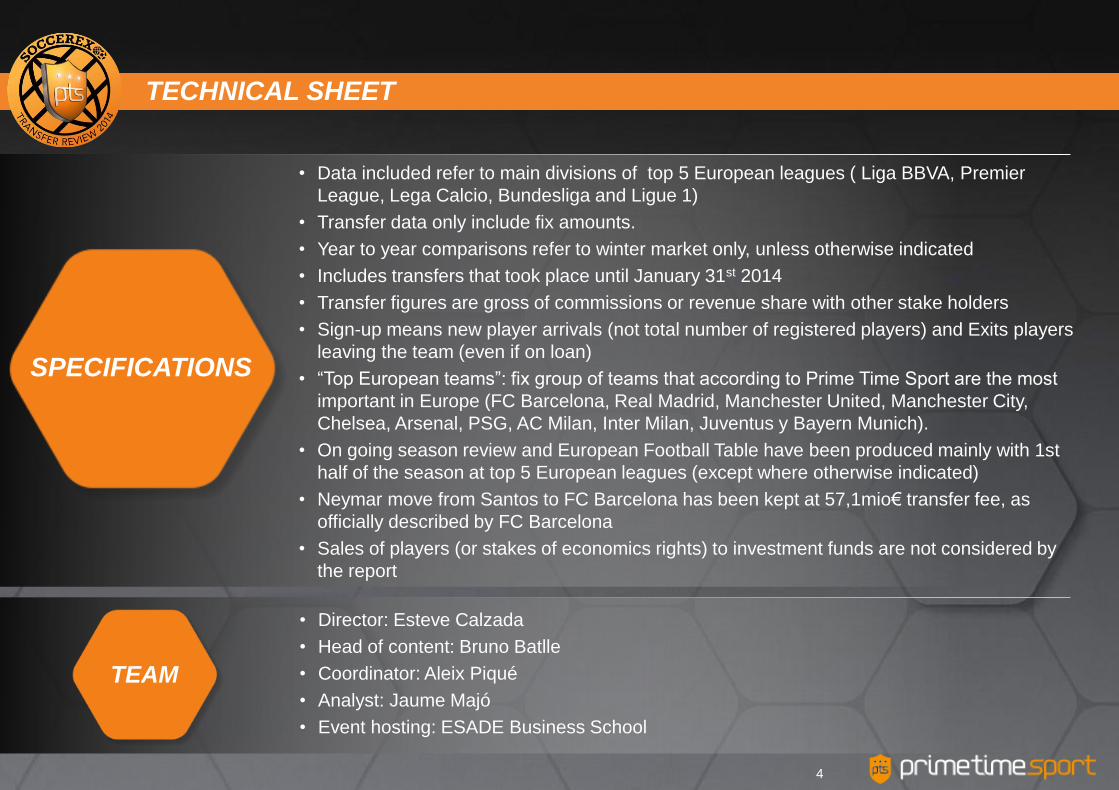
• Data included refer to main divisions of top 5 European leagues ( Liga BBVA, Premier
League, Lega Calcio, Bundesliga and Ligue 1)
• Transfer data only include fix amounts.
• Year to year comparisons refer to winter market only, unless otherwise indicated
• Includes transfers that took place until January 31st 2014
• Transfer figures are gross of commissions or revenue share with other stake holders
• Sign-up means new player arrivals (not total number of registered players) and Exits players
leaving the team (even if on loan)
• “Top European teams”: fix group of teams that according to Prime Time Sport are the most
important in Europe (FC Barcelona, Real Madrid, Manchester United, Manchester City,
Chelsea, Arsenal, PSG, AC Milan, Inter Milan, Juventus y Bayern Munich).
• On going season review and European Football Table have been produced mainly with 1st
half of the season at top 5 European leagues (except where otherwise indicated)
• Neymar move from Santos to FC Barcelona has been kept at 57,1mio€ transfer fee, as
officially described by FC Barcelona
• Sales of players (or stakes of economics rights) to investment funds are not considered by
the report
• Director: Esteve Calzada
• Head of content: Bruno Batlle
• Coordinator: Aleix Piqué
• Analyst: Jaume Majó
• Event hosting: ESADE Business School
TECHNICAL SHEET
4
SOCCEREX TRANSFER REVIEW 2014- WINTER WINDOW
5
1. Technical sheet
2. Winter 2014 transfer window: Premier League vs
other top European leagues
3. La Liga on going season review
4. European football table 2013/14
5. Case study: Impact of UEFA’s Financial Fair Play
6. Conclusions
7. Annexes
1. Review Top 5 European leagues
2. La Liga BBVA
WINTER 2014 TRANSFER WINDOW TOP 5 EUROPEAN LEAGUES
6
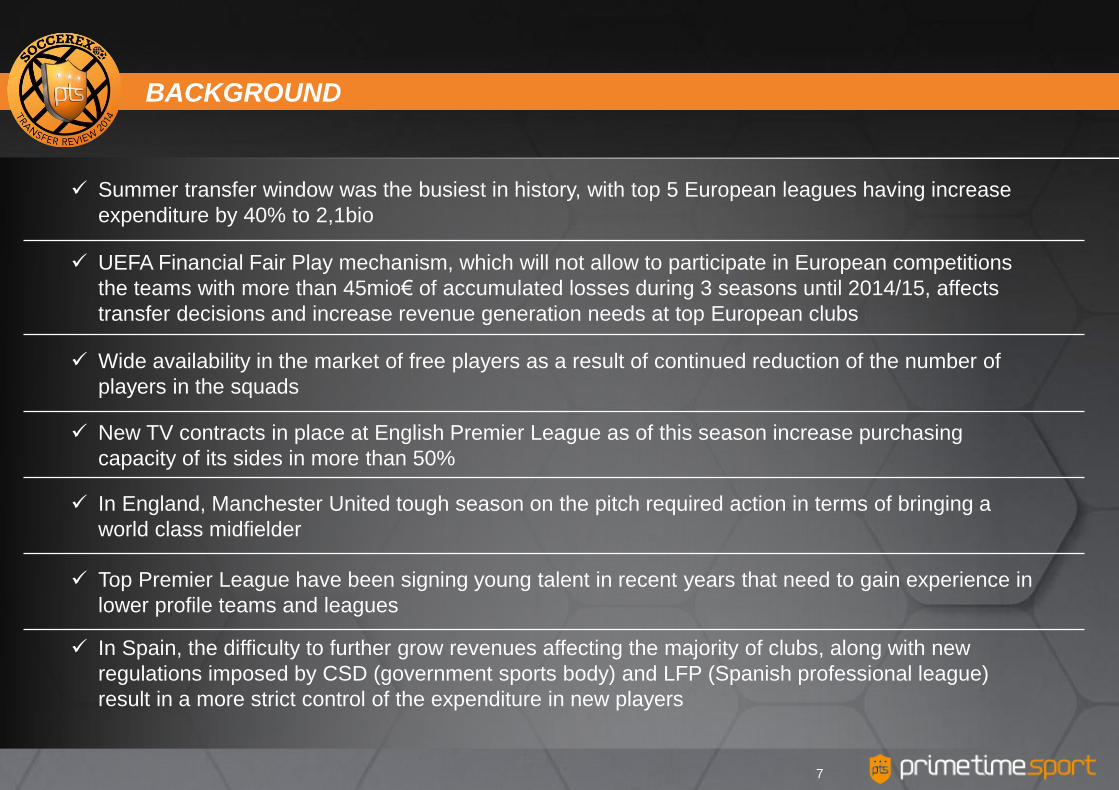
Summer transfer window was the busiest in history, with top 5 European leagues having increase
expenditure by 40% to 2,1bio
UEFA Financial Fair Play mechanism, which will not allow to participate in European competitions
the teams with more than 45mio€ of accumulated losses during 3 seasons until 2014/15, affects
transfer decisions and increase revenue generation needs at top European clubs
Wide availability in the market of free players as a result of continued reduction of the number of
players in the squads
New TV contracts in place at English Premier League as of this season increase purchasing
capacity of its sides in more than 50%
In England, Manchester United tough season on the pitch required action in terms of bringing a
world class midfielder
Top Premier League have been signing young talent in recent years that need to gain experience in
lower profile teams and leagues
In Spain, the difficulty to further grow revenues affecting the majority of clubs, along with new
regulations imposed by CSD (government sports body) and LFP (Spanish professional league)
result in a more strict control of the expenditure in new players
BACKGROUND
7
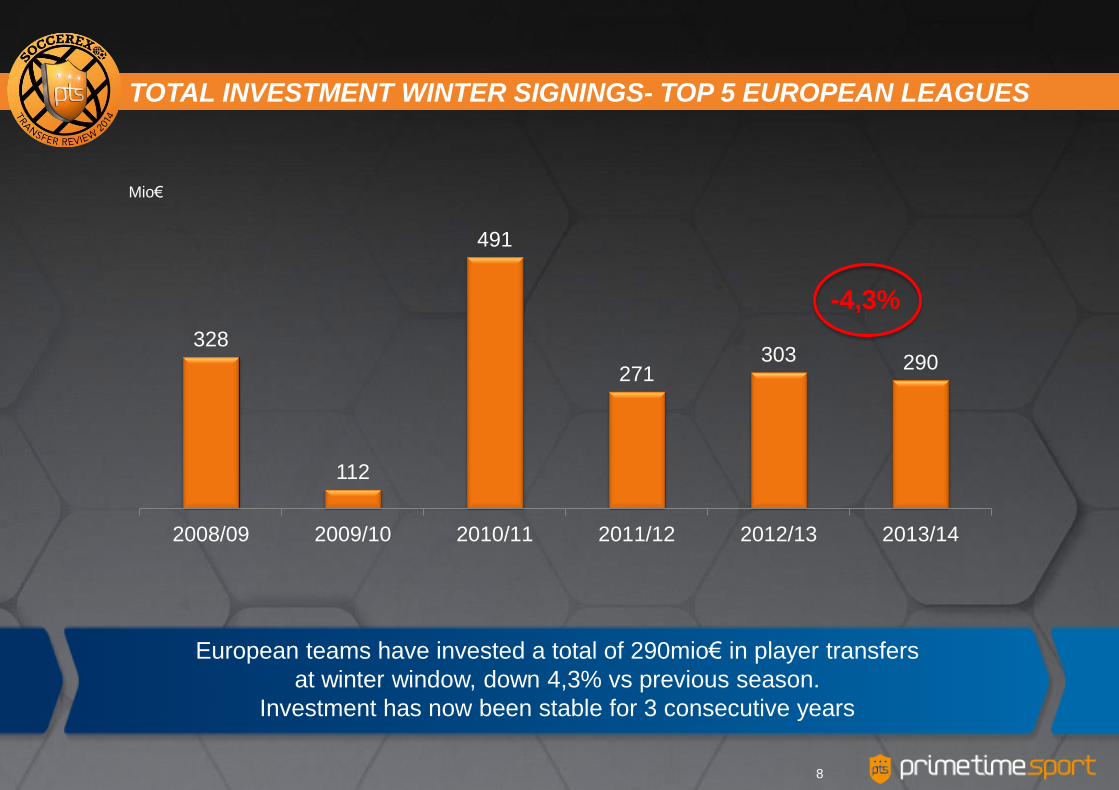
European teams have invested a total of 290mio€ in player transfers
at winter window, down 4,3% vs previous season.
Investment has now been stable for 3 consecutive years
328
112
491
271 303 290
2008/09 2009/10 2010/11 2011/12 2012/13 2013/14
Mio€
-4,3%
TOTAL INVESTMENT WINTER SIGNINGS- TOP 5 EUROPEAN LEAGUES
8
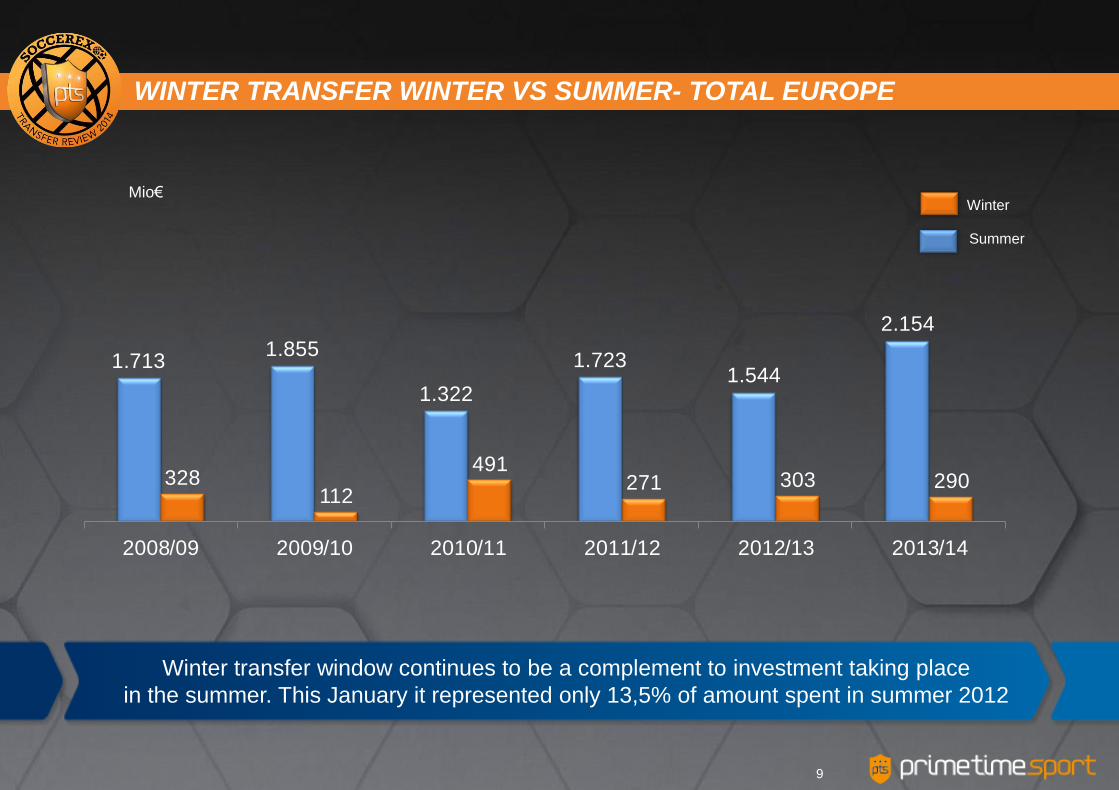
Winter transfer window continues to be a complement to investment taking place
in the summer. This January it represented only 13,5% of amount spent in summer 2012
1.713 1.855
1.322
1.723 1.544
2.154
328 112
491 271 303 290
2008/09 2009/10 2010/11 2011/12 2012/13 2013/14
Winter
Summer
Mio€
WINTER TRANSFER WINTER VS SUMMER- TOTAL EUROPE
9
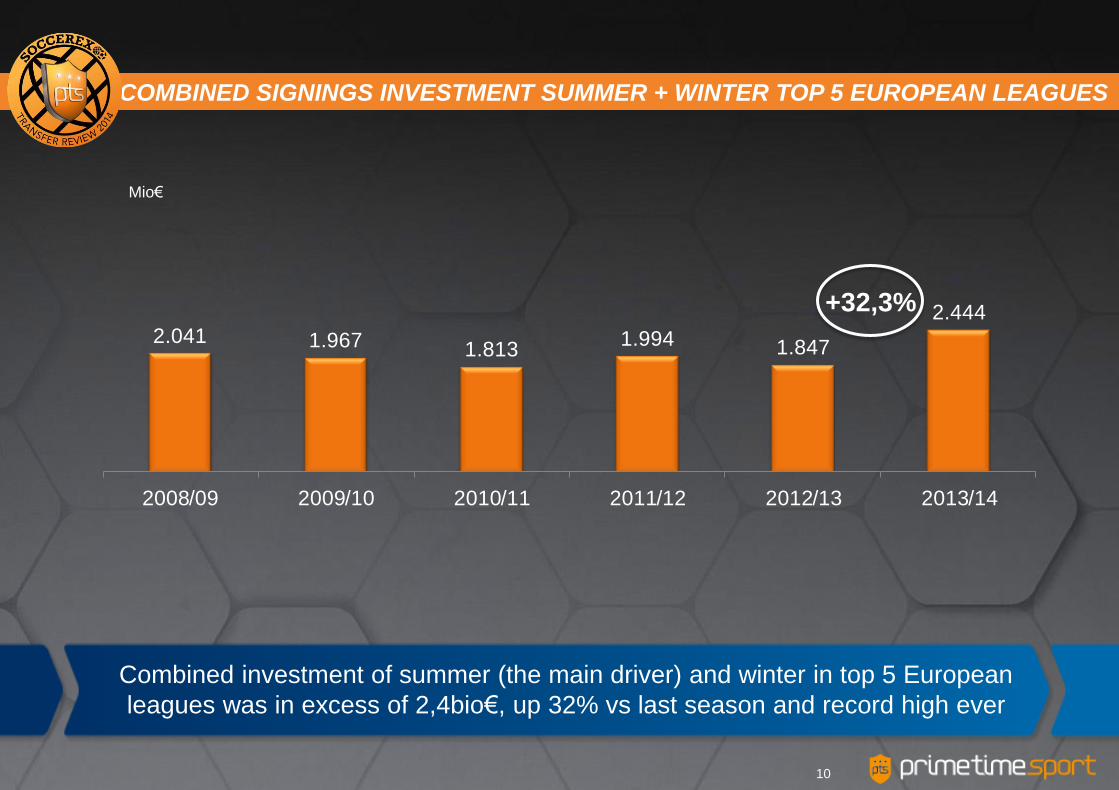
Combined investment of summer (the main driver) and winter in top 5 European
leagues was in excess of 2,4bio€, up 32% vs last season and record high ever
2.041 1.967 1.813 1.994 1.847
2.444
2008/09 2009/10 2010/11 2011/12 2012/13 2013/14
+32,3%
Mio€
COMBINED SIGNINGS INVESTMENT SUMMER + WINTER TOP 5 EUROPEAN LEAGUES
10
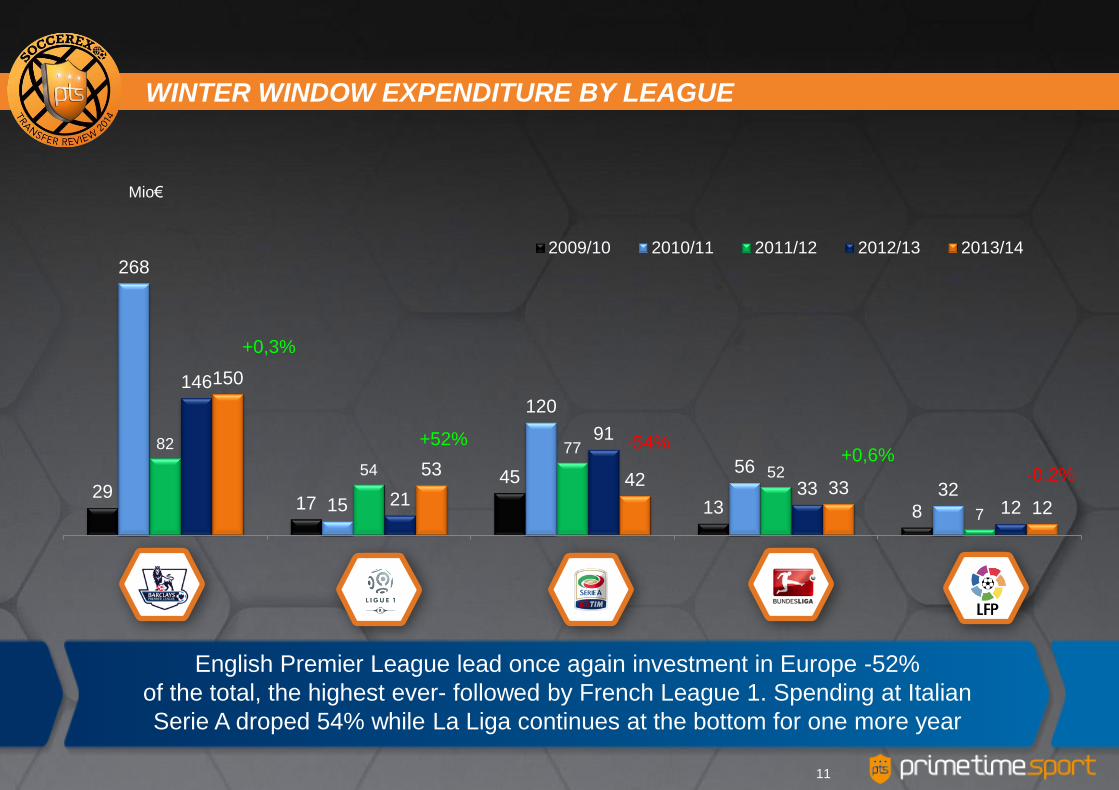
English Premier League lead once again investment in Europe -52%
of the total, the highest ever- followed by French League 1. Spending at Italian
Serie A droped 54% while La Liga continues at the bottom for one more year
29 17
45
13 8
268
15
120
56
32
82
54
77
52
7
146
21
91
33 12
150
53 42 33
12
2009/10 2010/11 2011/12 2012/13 2013/14
+0,3%
+52% -54%
Mio€
WINTER WINDOW EXPENDITURE BY LEAGUE
11
+0,6% -0,2%
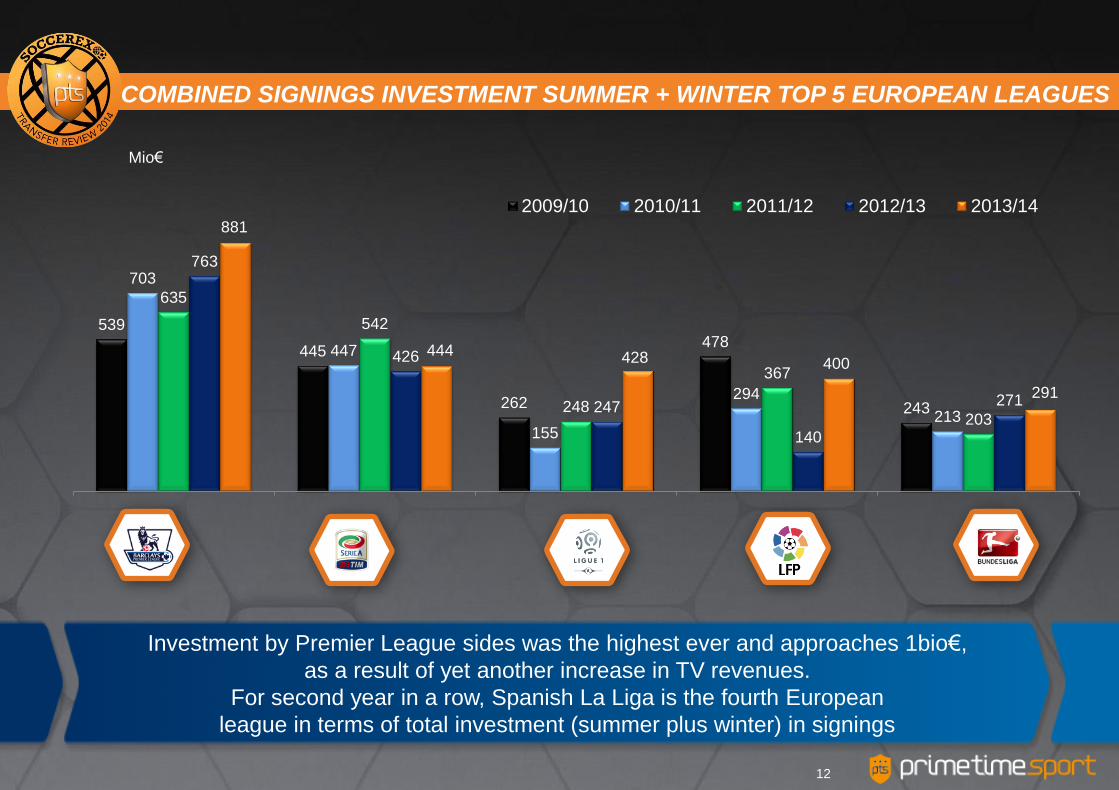
Investment by Premier League sides was the highest ever and approaches 1bio€,
as a result of yet another increase in TV revenues.
For second year in a row, Spanish La Liga is the fourth European
league in terms of total investment (summer plus winter) in signings
539
445
262
478
243
703
447
155
294
213
635
542
248
367
203
763
426
247
140
271
2009/10 2010/11 2011/12 2012/13 2013/14
Mio€
COMBINED SIGNINGS INVESTMENT SUMMER + WINTER TOP 5 EUROPEAN LEAGUES
12
444 428 400
291
881
% of total summer + winter
28,7%38,2% 39,2%
61,2%73,2%
CONCENTRATION OF INVESTMENT BY TOP SPENDING TEAMS 2013/14
13
TOP 2
TOP 4
49,8% 57,1%
62,8%
78,6%
86,7%
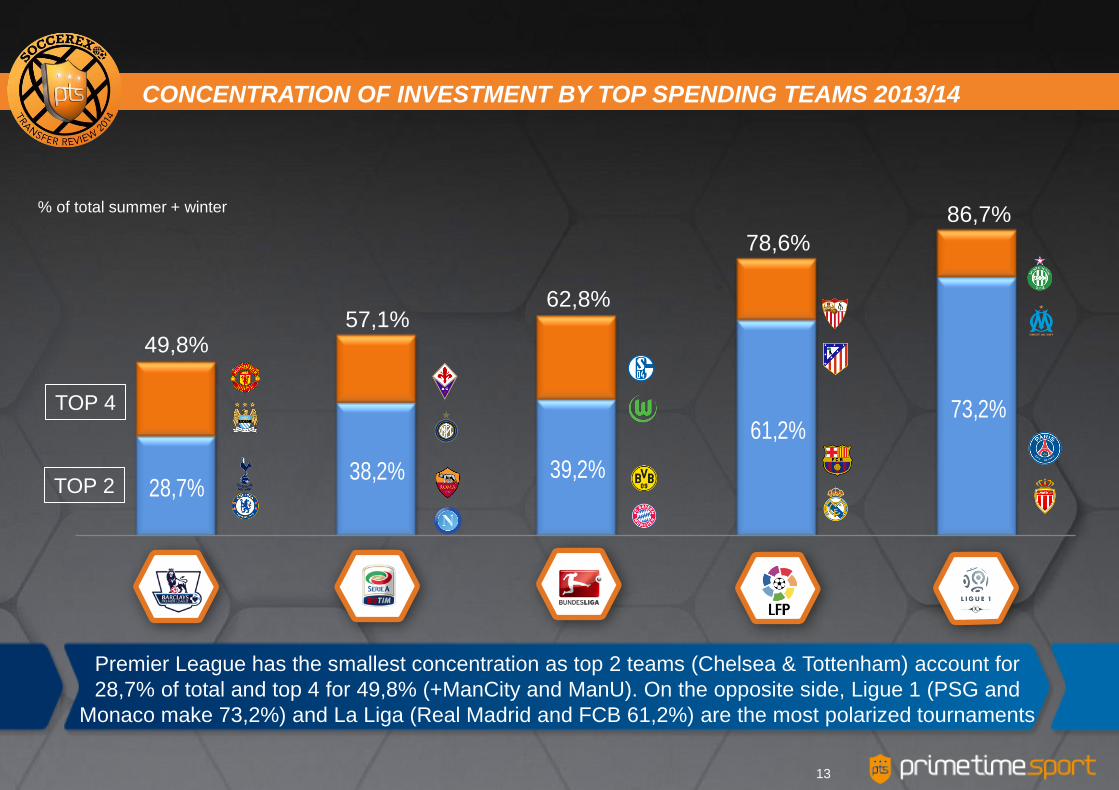
Premier League has the smallest concentration as top 2 teams (Chelsea & Tottenham) account for
28,7% of total and top 4 for 49,8% (+ManCity and ManU). On the opposite side, Ligue 1 (PSG and
Monaco make 73,2%) and La Liga (Real Madrid and FCB 61,2%) are the most polarized tournaments
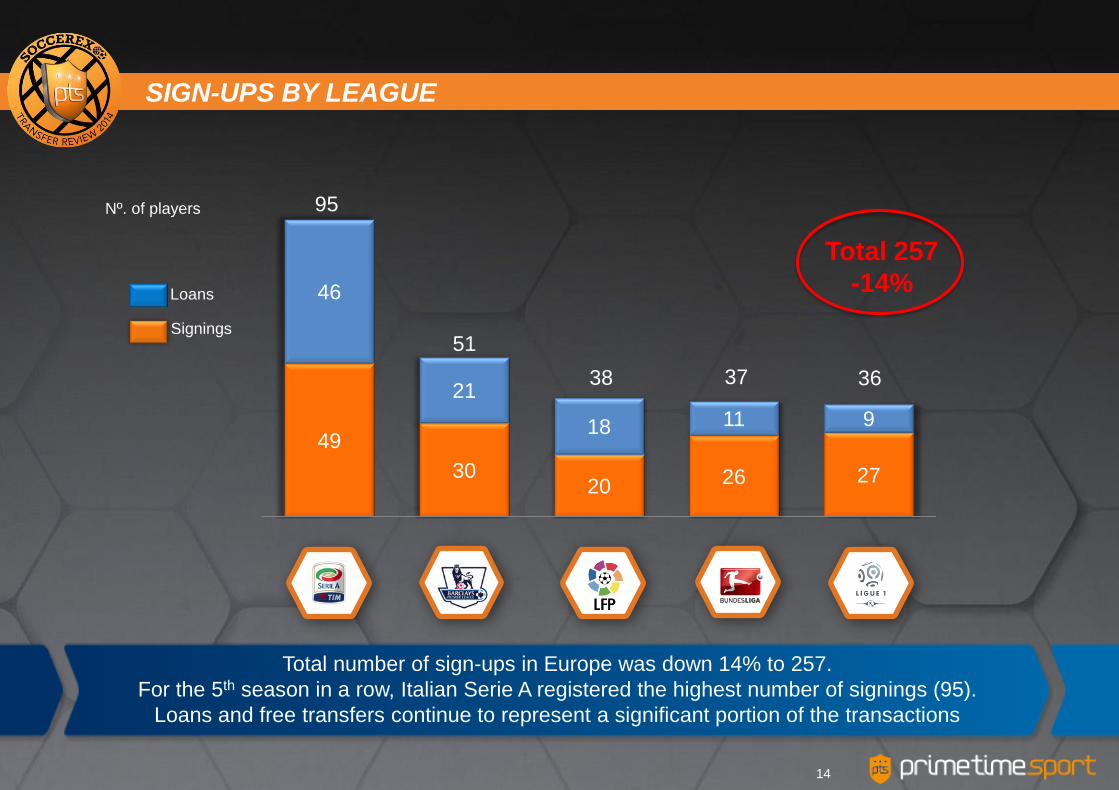
Total number of sign-ups in Europe was down 14% to 257.
For the 5th season in a row, Italian Serie A registered the highest number of signings (95).
Loans and free transfers continue to represent a significant portion of the transactions
Nº. of players
49
30 20 26 27
46
21
18 11 9
Loans
Signings
95
51
38 36 37
SIGN-UPS BY LEAGUE
14
Total 257
-14%
Nº. of players
49 51 27 13 23
163
83
24 32 21
Loans
Signings
212
134
51 44 45
PLAYER EXITS BY LEAGUE
15
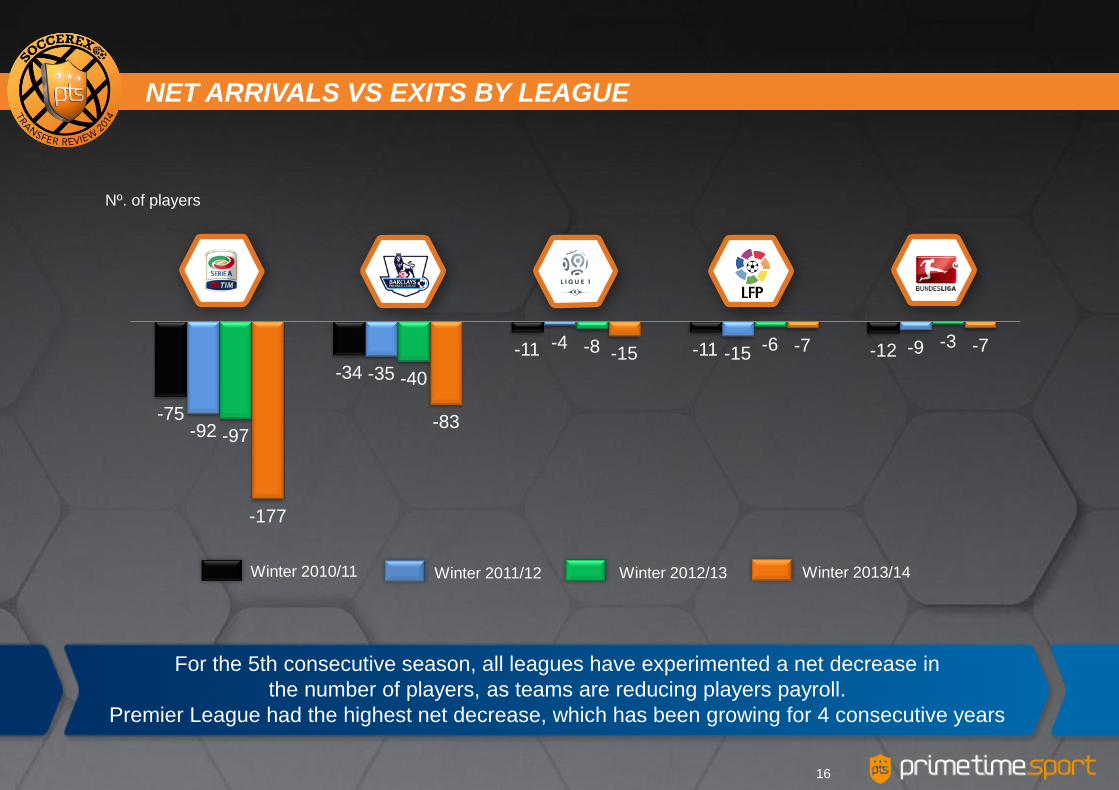
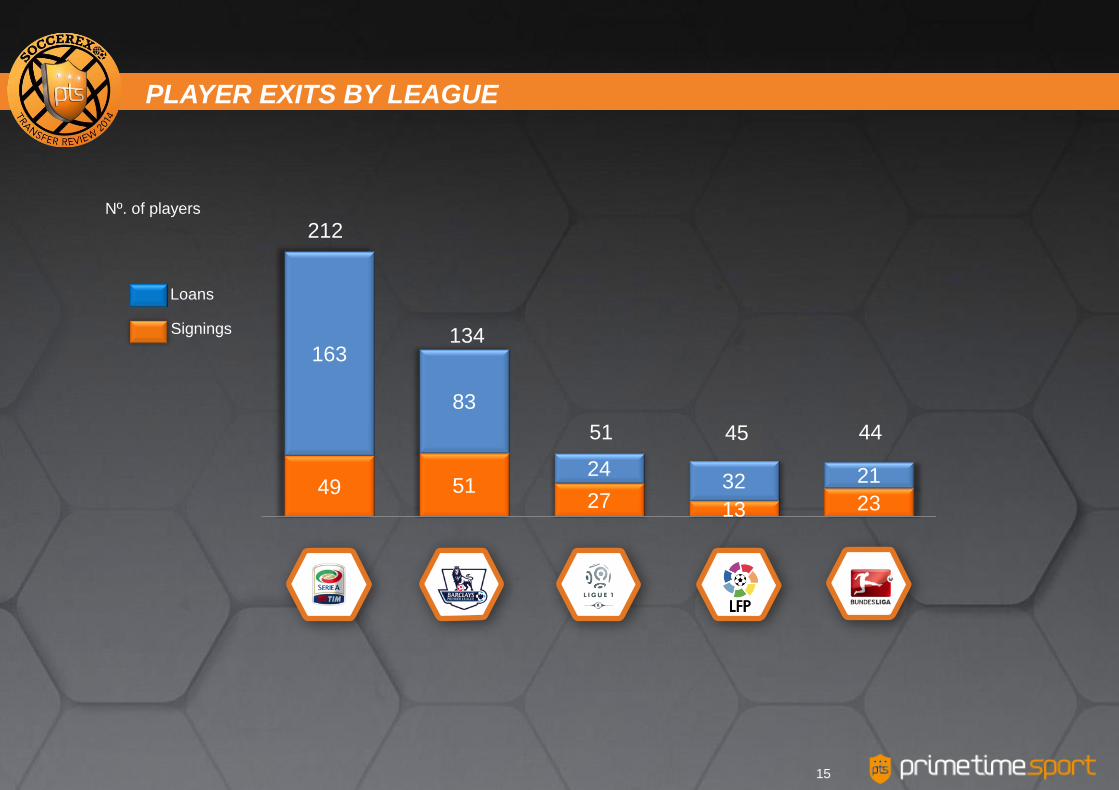
For the 5th consecutive season, all leagues have experimented a net decrease in
the number of players, as teams are reducing players payroll.
Premier League had the highest net decrease, which has been growing for 4 consecutive years
Nº. of players
-75
-34
-11 -11 -12
-92
-35
-4 -15 -9
-97
-40
-8 -6 -3
-177
-83
-15 -7 -7
Winter 2011/12 Winter 2012/13 Winter 2010/11 Winter 2013/14
NET ARRIVALS VS EXITS BY LEAGUE
16
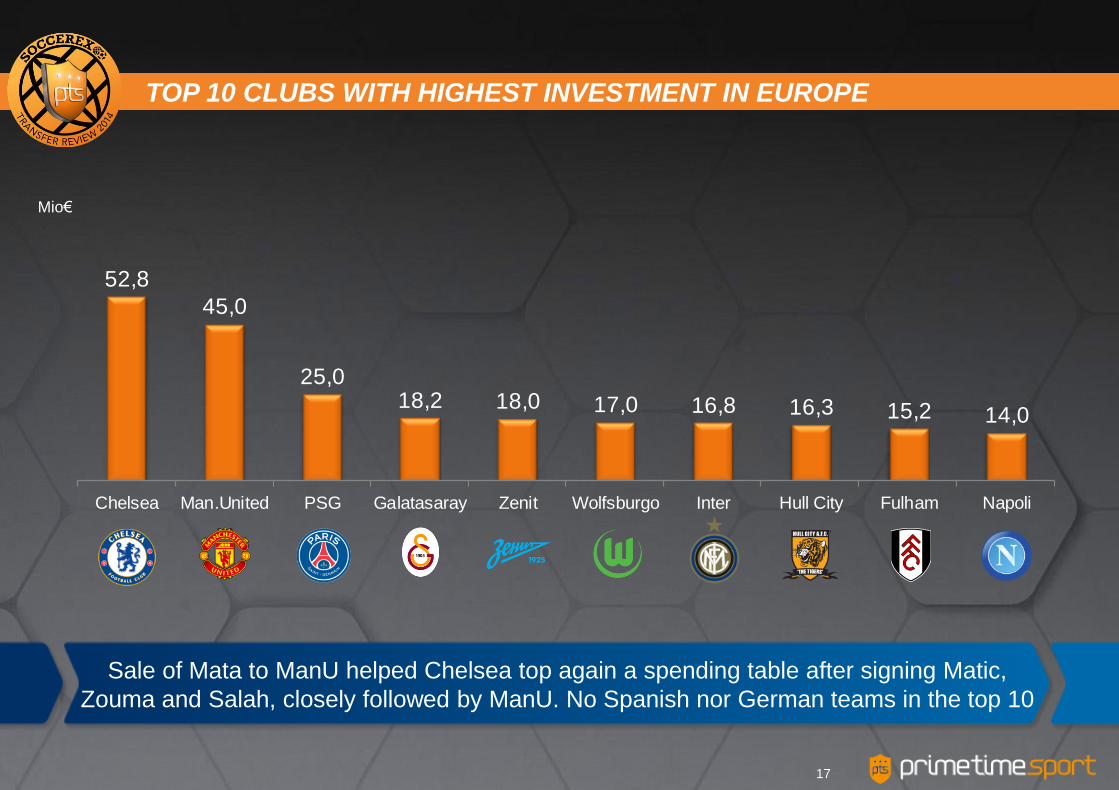
Sale of Mata to ManU helped Chelsea top again a spending table after signing Matic,
Zouma and Salah, closely followed by ManU. No Spanish nor German teams in the top 10
Mio€
52,8
45,0
25,0 18,2 18,0 17,0 16,8 16,3 15,2 14,0
Chelsea Man.United PSG Galatasaray Zenit Wolfsburgo Inter Hull City Fulham Napoli
TOP 10 CLUBS WITH HIGHEST INVESTMENT IN EUROPE
17
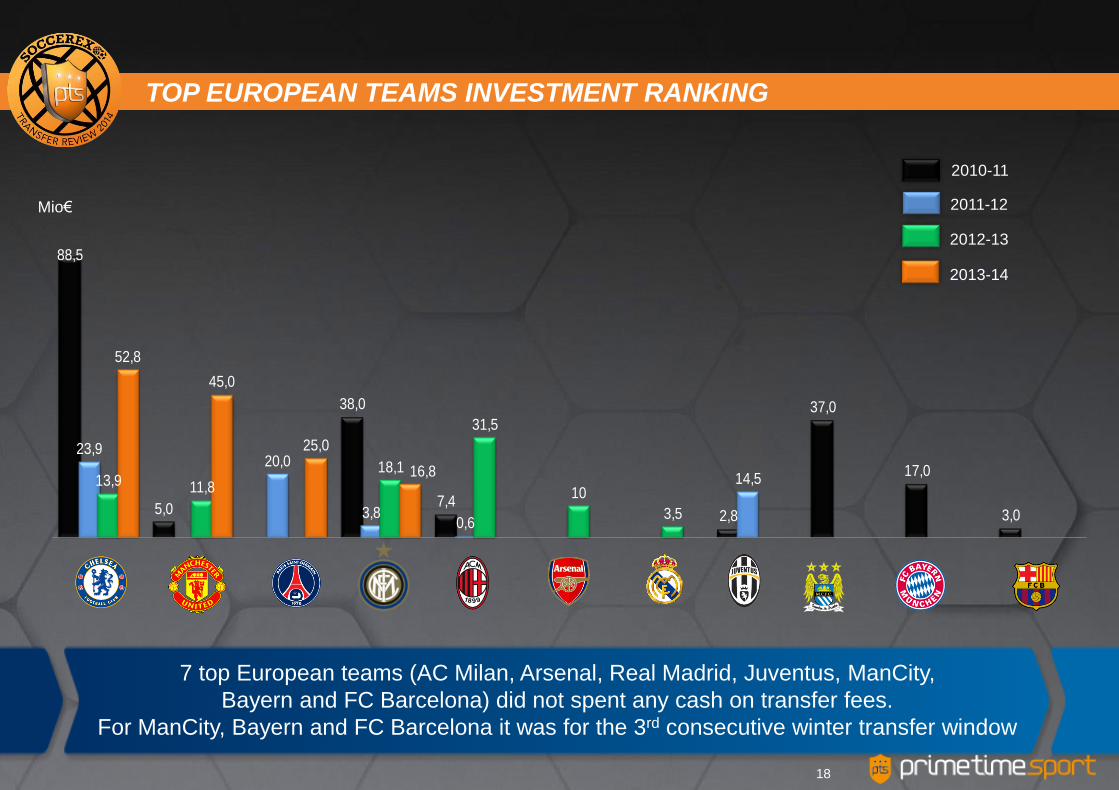
7 top European teams (AC Milan, Arsenal, Real Madrid, Juventus, ManCity,
Bayern and FC Barcelona) did not spent any cash on transfer fees.
For ManCity, Bayern and FC Barcelona it was for the 3rd consecutive winter transfer window
Mio€
88,5
5,0
38,0
7,4 2,8
37,0
17,0
3,0
23,9 20,0
3,8 0,6
14,5 13,9 11,8
18,1
31,5
10
3,5
52,8
45,0
25,0
16,8
2010-11
2011-12
2012-13
2013-14
TOP EUROPEAN TEAMS INVESTMENT RANKING
18
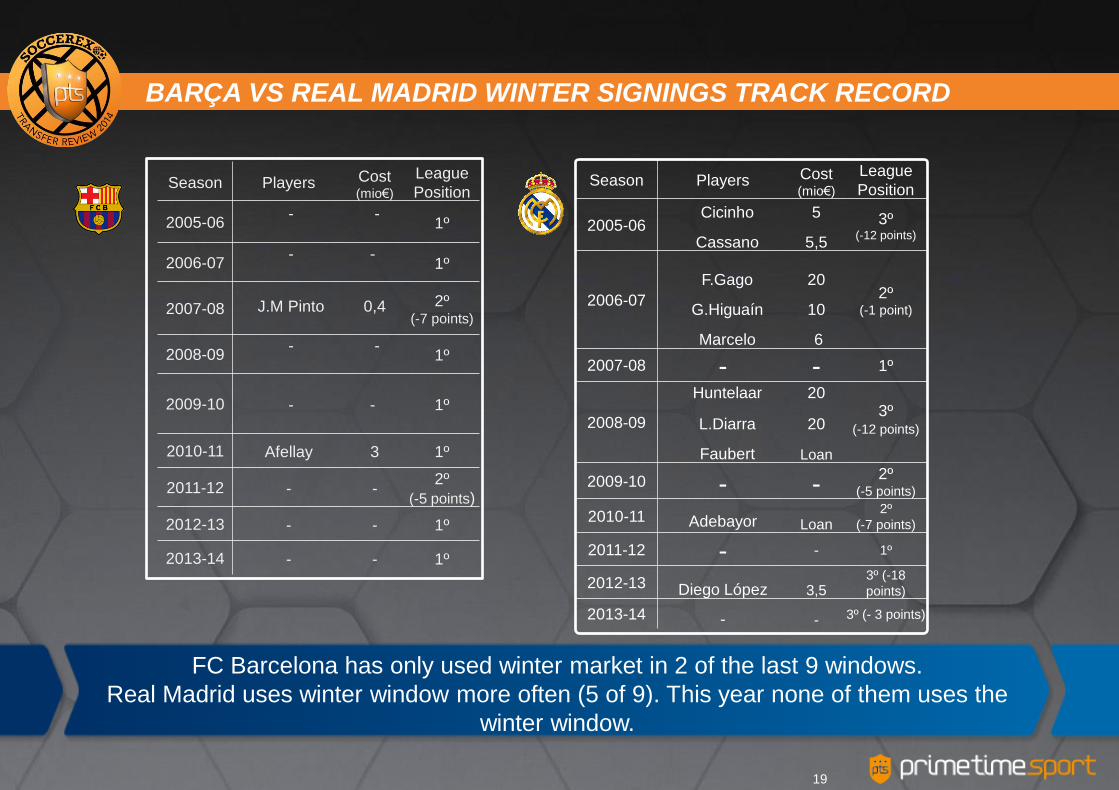
FC Barcelona has only used winter market in 2 of the last 9 windows.
Real Madrid uses winter window more often (5 of 9). This year none of them uses the
winter window.
Season Players Cost (mio€)
League
Position
2005-06 -
-
1º
2006-07 -
-
1º
2007-08 J.M Pinto
0,4
2º (-7 points)
2008-09 -
-
1º
2009-10 - - 1º
2010-11 Afellay 3 1º
2011-12 - - 2º
(-5 points)
2012-13 - - 1º
2013-14 - - 1º
Season Players Cost (mio€)
League
Position
2005-06 Cicinho 5 3º
(-12 points) Cassano 5,5
2006-07
F.Gago 20 2º
(-1 point) G.Higuaín 10
Marcelo 6
2007-08 - - 1º
2008-09
Huntelaar 20 3º
(-12 points)
L.Diarra 20
Faubert Loan
2009-10 - - 2º
(-5 points)
2010-11 Adebayor Loan 2º
(-7 points)
2011-12 - - 1º
2012-13 Diego López 3,5 3º (-18
points)
2013-14 - - 3º (- 3 points)
BARÇA VS REAL MADRID WINTER SIGNINGS TRACK RECORD
19
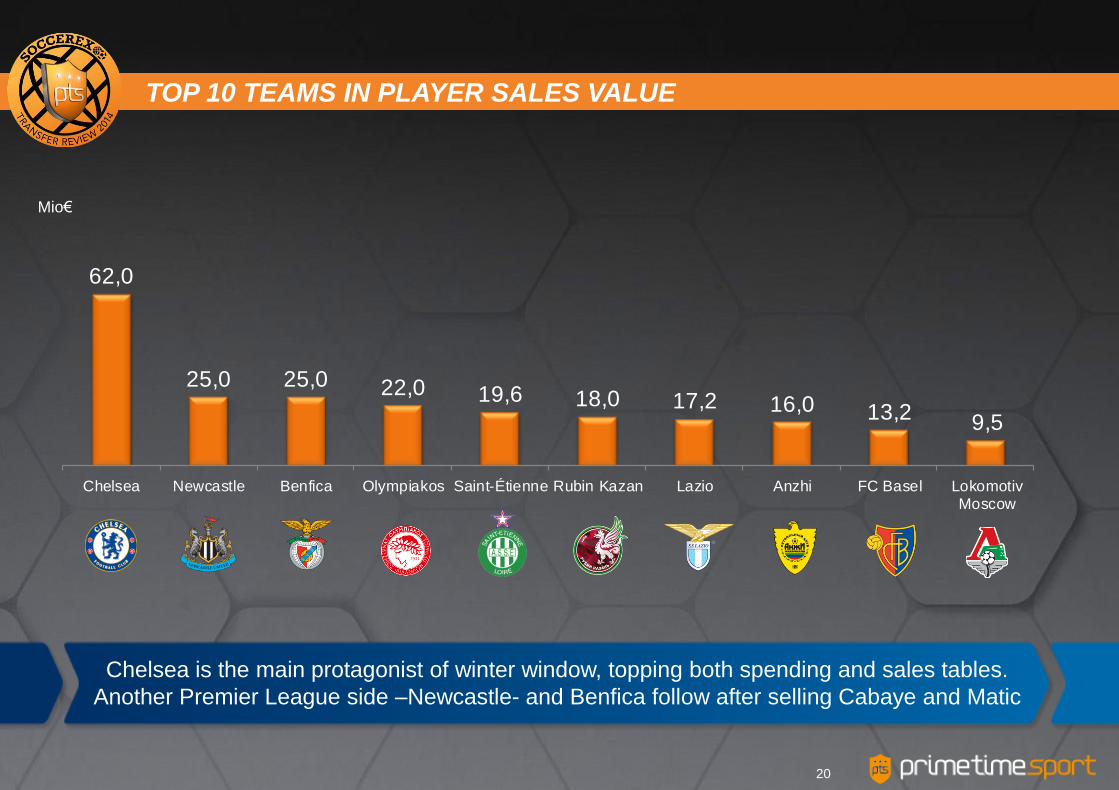
Chelsea is the main protagonist of winter window, topping both spending and sales tables.
Another Premier League side –Newcastle- and Benfica follow after selling Cabaye and Matic
Mio€
62,0
25,0 25,0 22,0 19,6 18,0 17,2 16,0 13,2 9,5
Chelsea Newcastle Benfica Olympiakos Saint-Étienne Rubin Kazan Lazio Anzhi FC Basel LokomotivMoscow
TOP 10 TEAMS IN PLAYER SALES VALUE
20
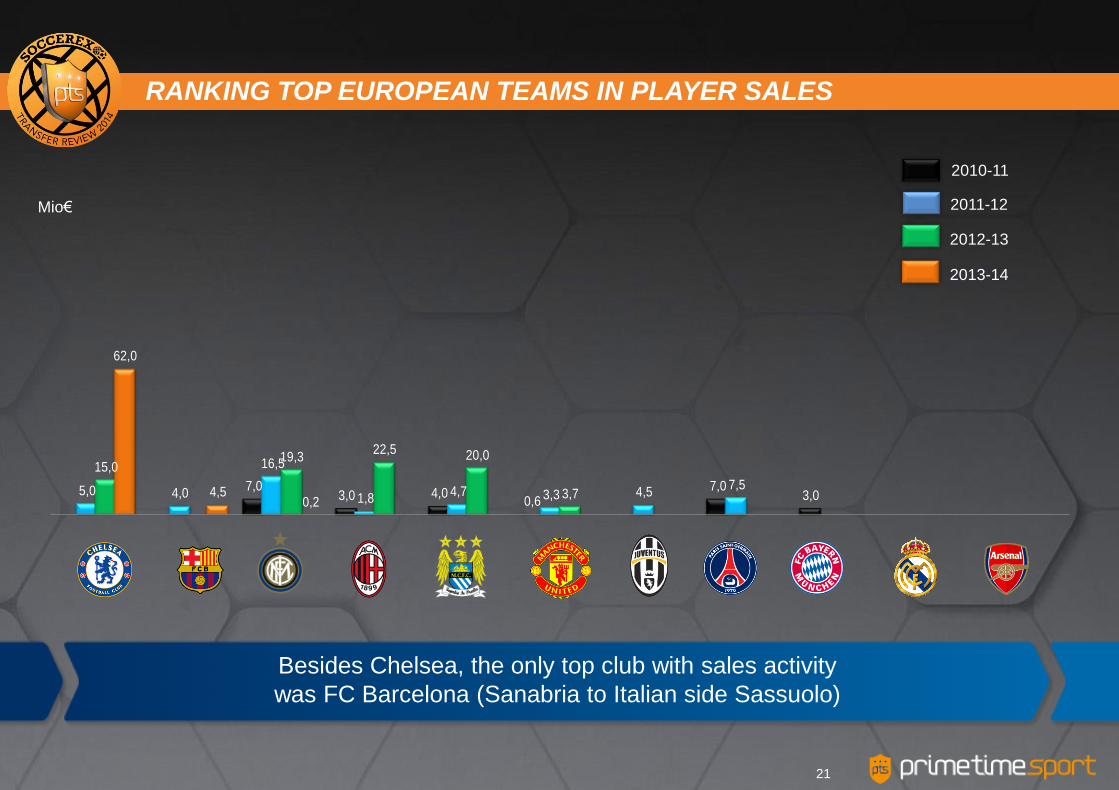
Besides Chelsea, the only top club with sales activity
was FC Barcelona (Sanabria to Italian side Sassuolo)
Mio€
7,0 3,0 4,0
0,6 7,0
3,0 5,0 4,0
16,5
1,8 4,7 3,3 4,5
7,5
15,0 19,3
22,5 20,0
3,7
62,0
4,5 0,2
2010-11
2011-12
2012-13
2013-14
RANKING TOP EUROPEAN TEAMS IN PLAYER SALES
21
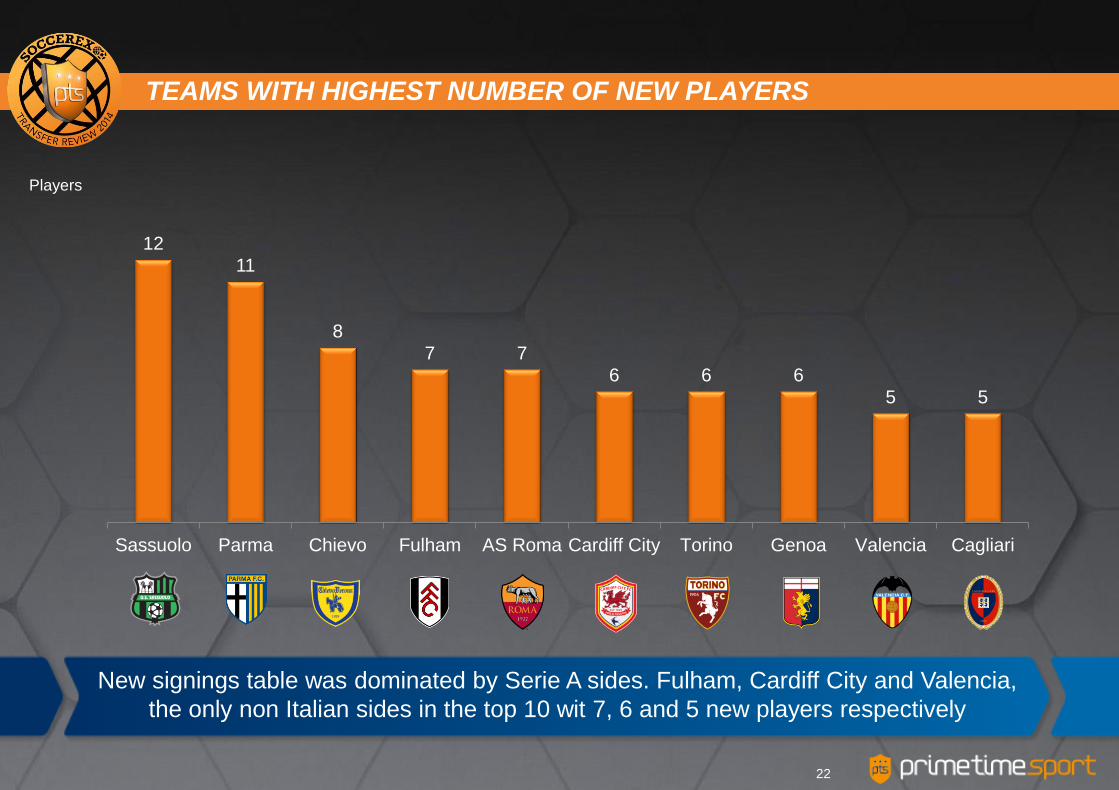
Players
12
11
8
7 7
6 6 6
5 5
Sassuolo Parma Chievo Fulham AS Roma Cardiff City Torino Genoa Valencia Cagliari
TEAMS WITH HIGHEST NUMBER OF NEW PLAYERS
22
New signings table was dominated by Serie A sides. Fulham, Cardiff City and Valencia,
the only non Italian sides in the top 10 wit 7, 6 and 5 new players respectively
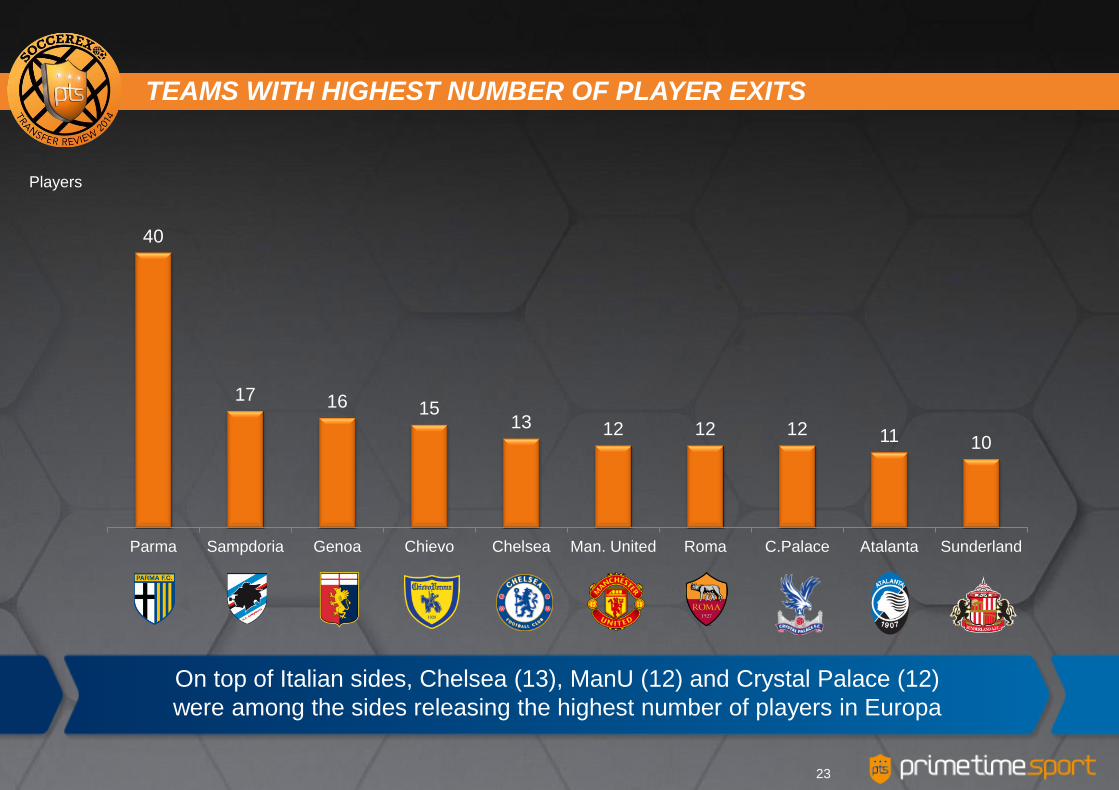
Players
40
17 16 15 13 12 12 12 11 10
Parma Sampdoria Genoa Chievo Chelsea Man. United Roma C.Palace Atalanta Sunderland
TEAMS WITH HIGHEST NUMBER OF PLAYER EXITS
23
On top of Italian sides, Chelsea (13), ManU (12) and Crystal Palace (12)
were among the sides releasing the highest number of players in Europa
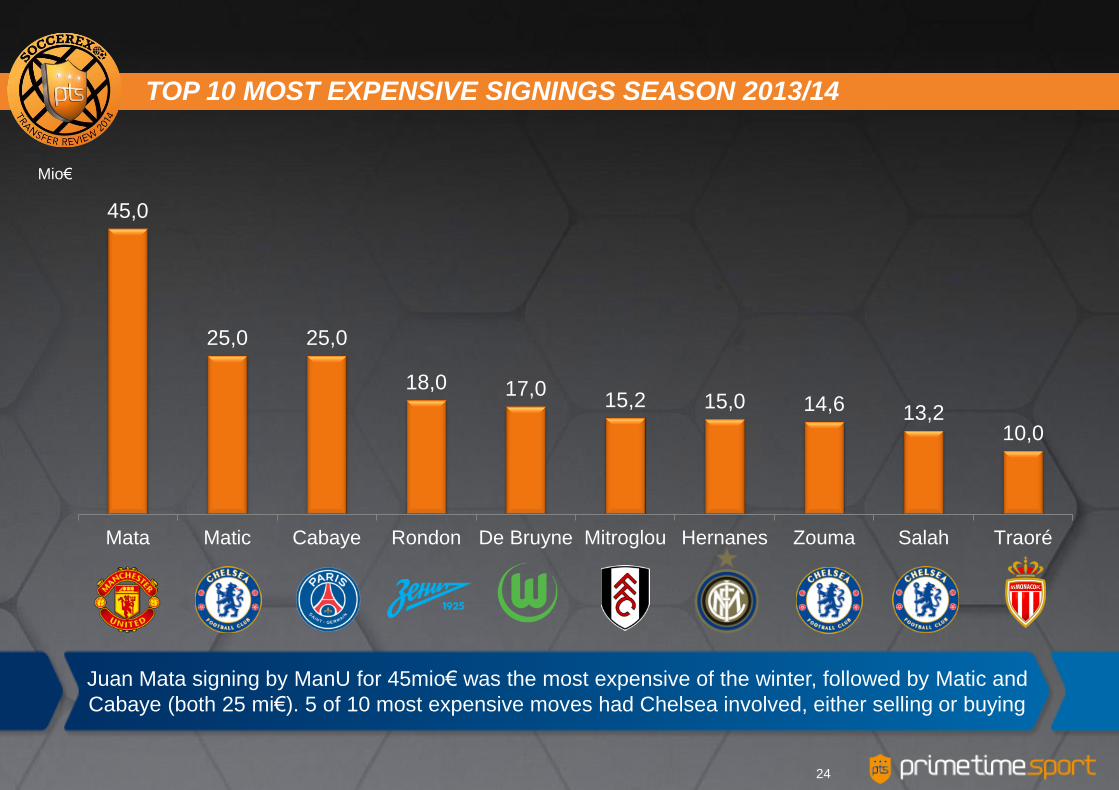
45,0
25,0 25,0
18,0 17,0 15,2 15,0 14,6 13,2
10,0
Mata Matic Cabaye Rondon De Bruyne Mitroglou Hernanes Zouma Salah Traoré
Mio€
TOP 10 MOST EXPENSIVE SIGNINGS SEASON 2013/14
24
Juan Mata signing by ManU for 45mio€ was the most expensive of the winter, followed by Matic and
Cabaye (both 25 mi€). 5 of 10 most expensive moves had Chelsea involved, either selling or buying
Mio€
2009-10
2010-11
2011-12
2012-13
2013-14
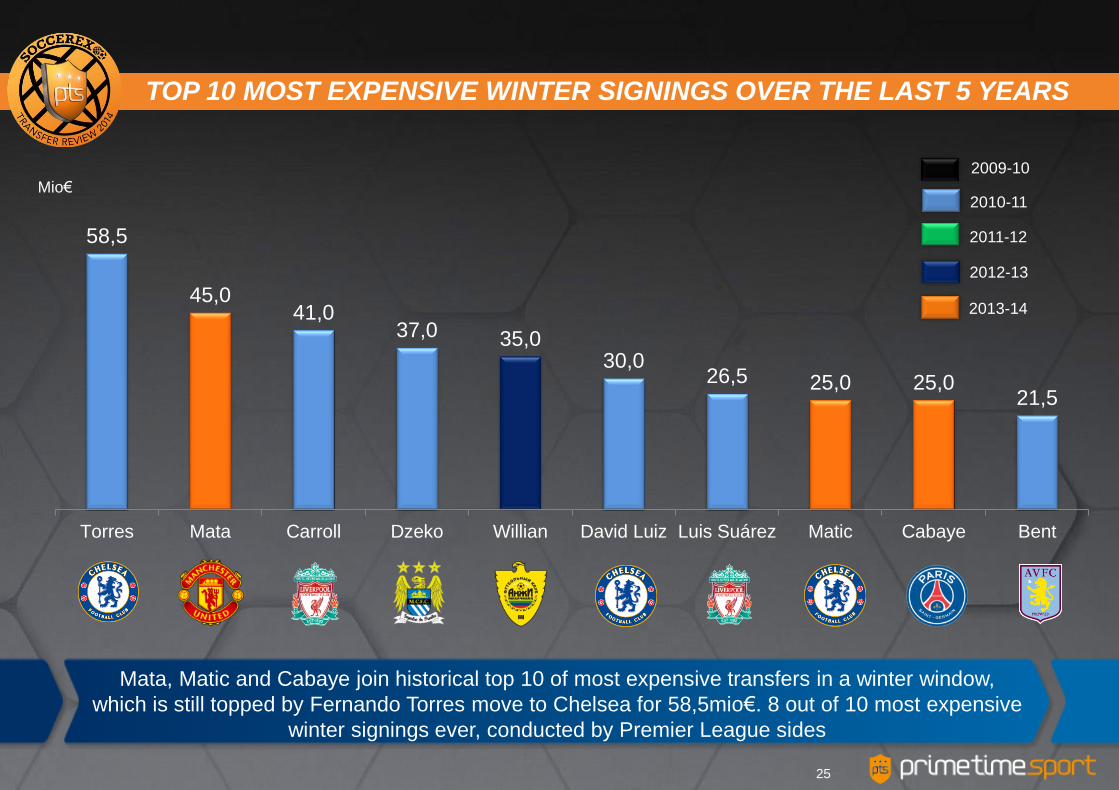
TOP 10 MOST EXPENSIVE WINTER SIGNINGS OVER THE LAST 5 YEARS
25
58,5
45,0 41,0
37,0 35,0 30,0
26,5 25,0 25,0 21,5
Torres Mata Carroll Dzeko Willian David Luiz Luis Suárez Matic Cabaye Bent
Mata, Matic and Cabaye join historical top 10 of most expensive transfers in a winter window,
which is still topped by Fernando Torres move to Chelsea for 58,5mio€. 8 out of 10 most expensive
winter signings ever, conducted by Premier League sides
Mio€
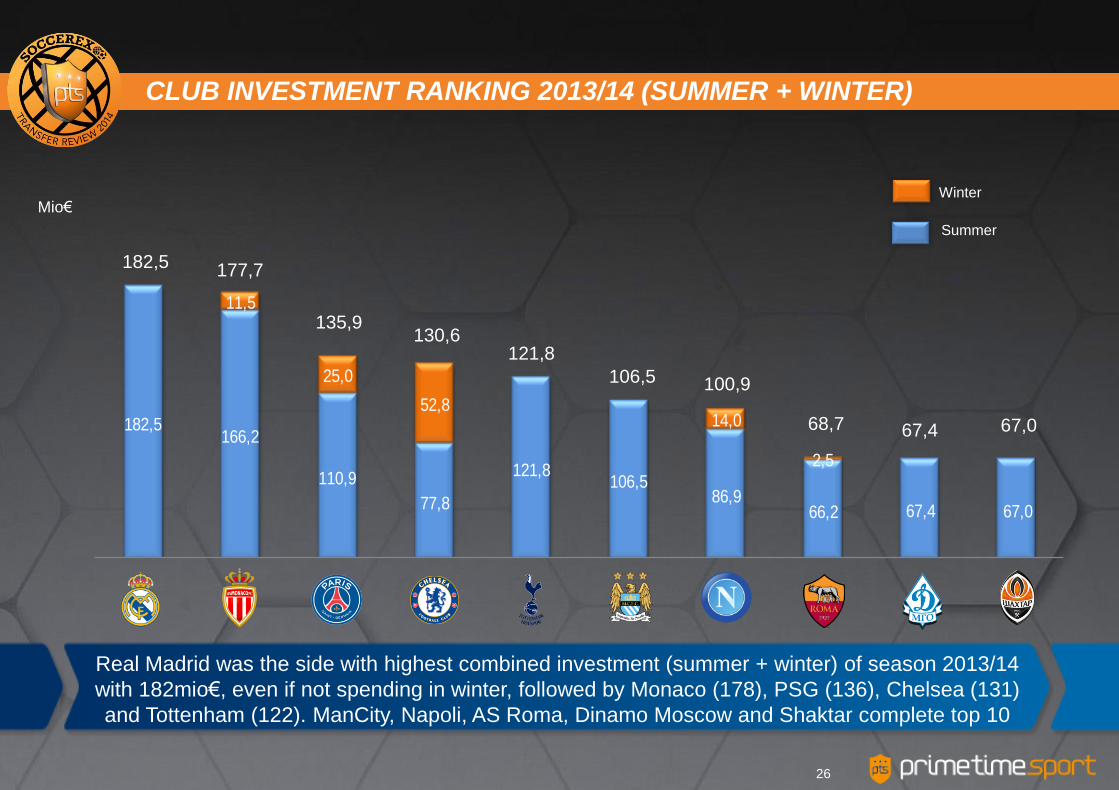
182,5 166,2
110,9
77,8
121,8 106,5
86,9 66,2 67,4 67,0
11,5
25,0
52,8 14,0
2,5
Winter
Summer
182,5 177,7
135,9 130,6
121,8
106,5 100,9
68,7 67,4 67,0
Real Madrid was the side with highest combined investment (summer + winter) of season 2013/14
with 182mio€, even if not spending in winter, followed by Monaco (178), PSG (136), Chelsea (131)
and Tottenham (122). ManCity, Napoli, AS Roma, Dinamo Moscow and Shaktar complete top 10
CLUB INVESTMENT RANKING 2013/14 (SUMMER + WINTER)
26

1. Review Top 5 leagues
2. La Liga BBVA
WINTER 2014 TRANSFER WINDOW TOP 5 EUROPEAN LEAGUES
27
Mio€
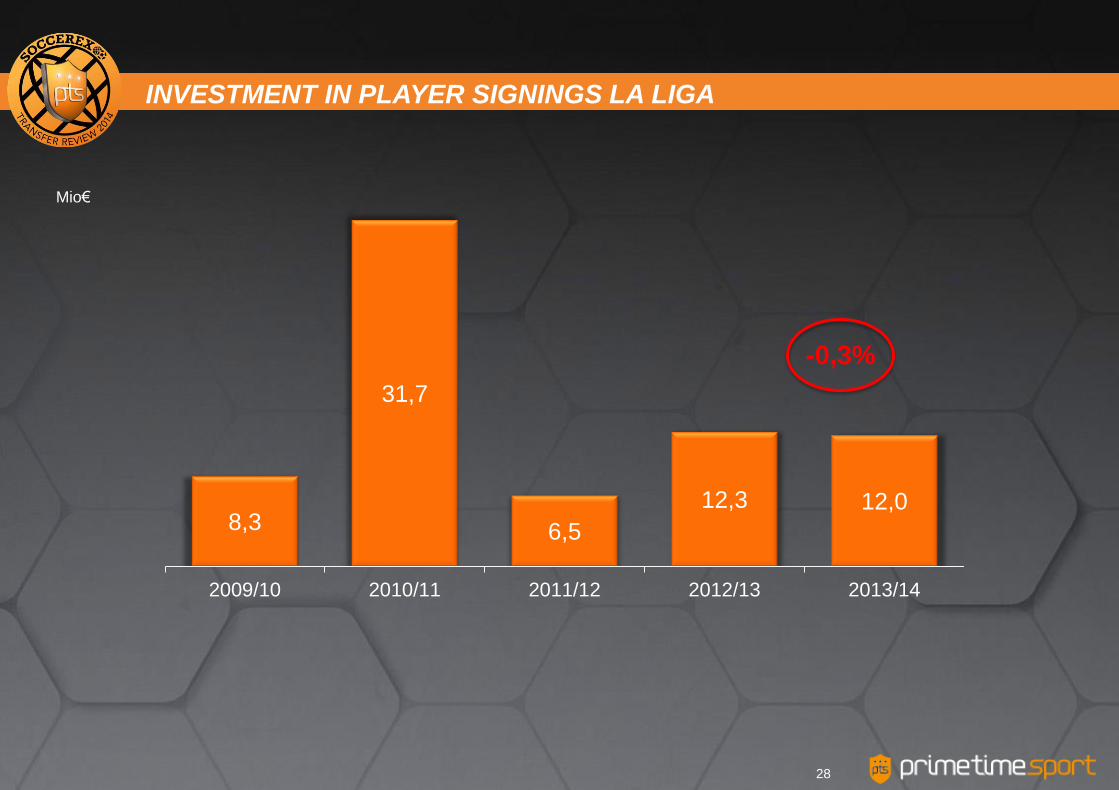
8,3
31,7
6,5
12,3 12,0
2009/10 2010/11 2011/12 2012/13 2013/14
-0,3%
INVESTMENT IN PLAYER SIGNINGS LA LIGA
28
Mio€
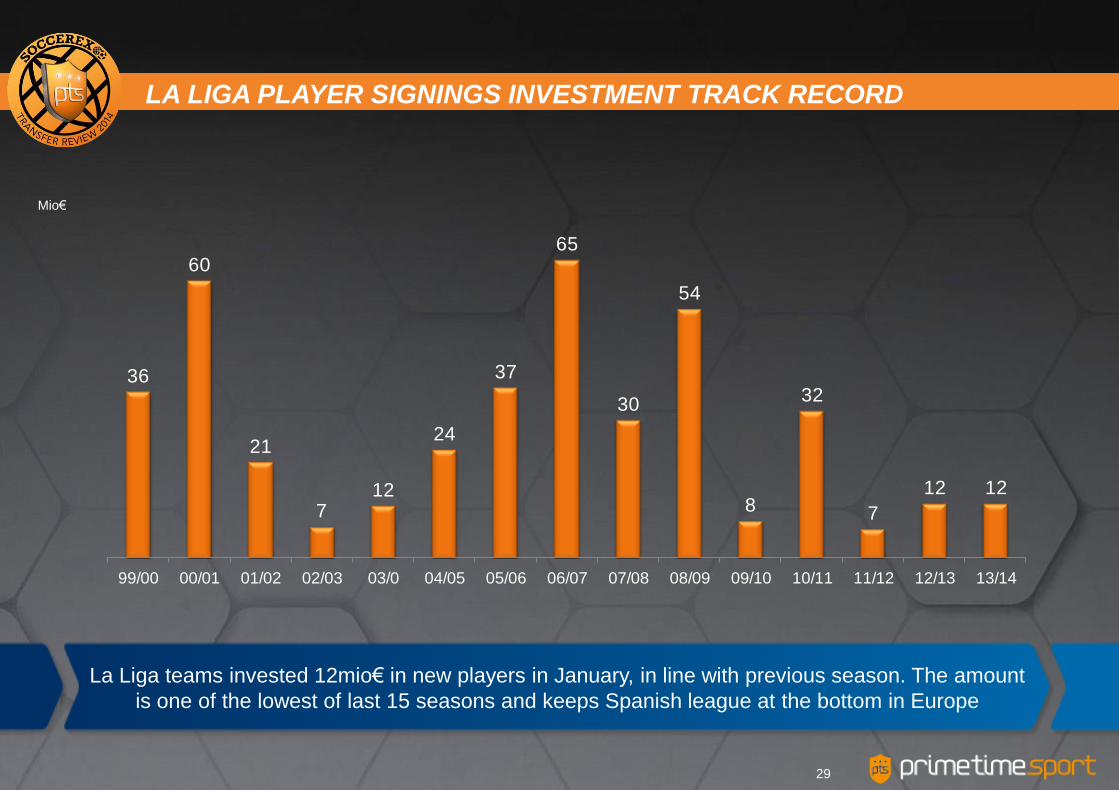
36
60
21
7 12
24
37
65
30
54
8
32
7
12 12
99/00 00/01 01/02 02/03 03/0 04/05 05/06 06/07 07/08 08/09 09/10 10/11 11/12 12/13 13/14
La Liga teams invested 12mio€ in new players in January, in line with previous season. The amount
is one of the lowest of last 15 seasons and keeps Spanish league at the bottom in Europe
LA LIGA PLAYER SIGNINGS INVESTMENT TRACK RECORD
29

Mio€
The main portion of investment of the season was conducted in the summer.
As a result, investment in January represented only 3% of the summer expenditure at La Liga
270
470
262
360
128
388
54 8
32 7 12 12
2008-09 2009-10 2010-11 2011-12 2012-13 2013-14
Summer
Winter
WINTER VS SUMMER TRANSFER WINDOWS- LA LIGA
30
Mio€
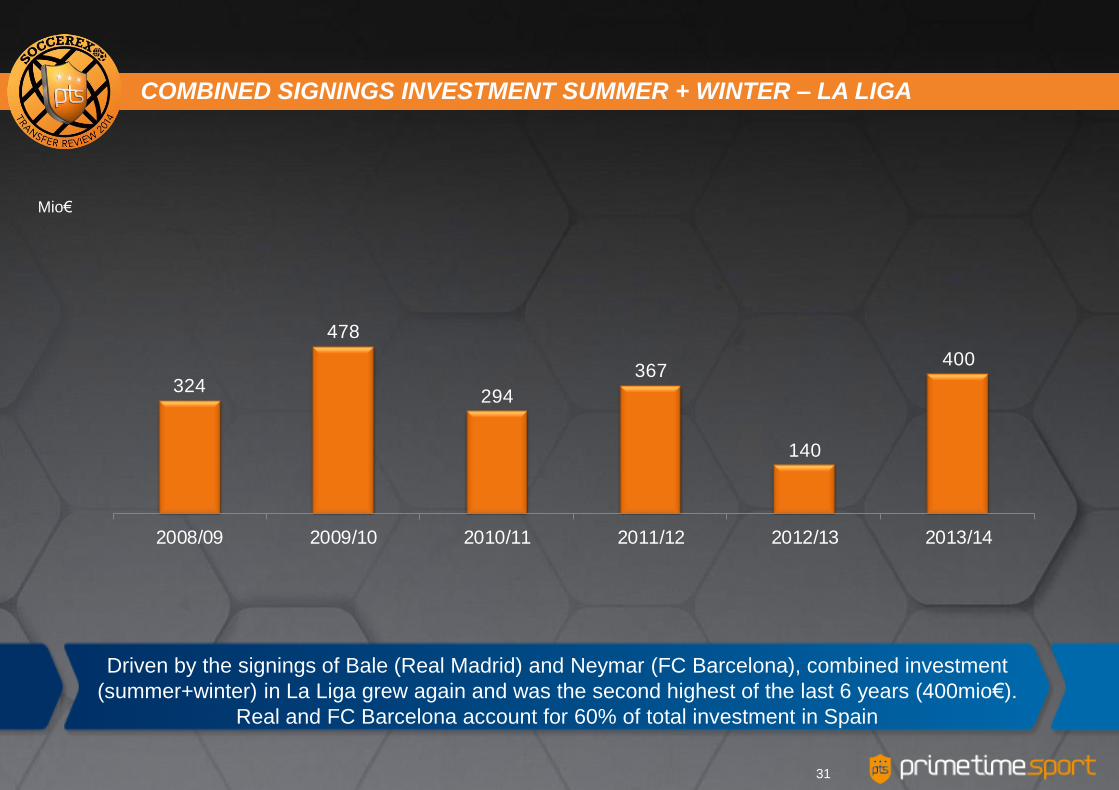
Driven by the signings of Bale (Real Madrid) and Neymar (FC Barcelona), combined investment
(summer+winter) in La Liga grew again and was the second highest of the last 6 years (400mio€).
Real and FC Barcelona account for 60% of total investment in Spain
324
478
294
367
140
400
2008/09 2009/10 2010/11 2011/12 2012/13 2013/14
COMBINED SIGNINGS INVESTMENT SUMMER + WINTER – LA LIGA
31
Mio€
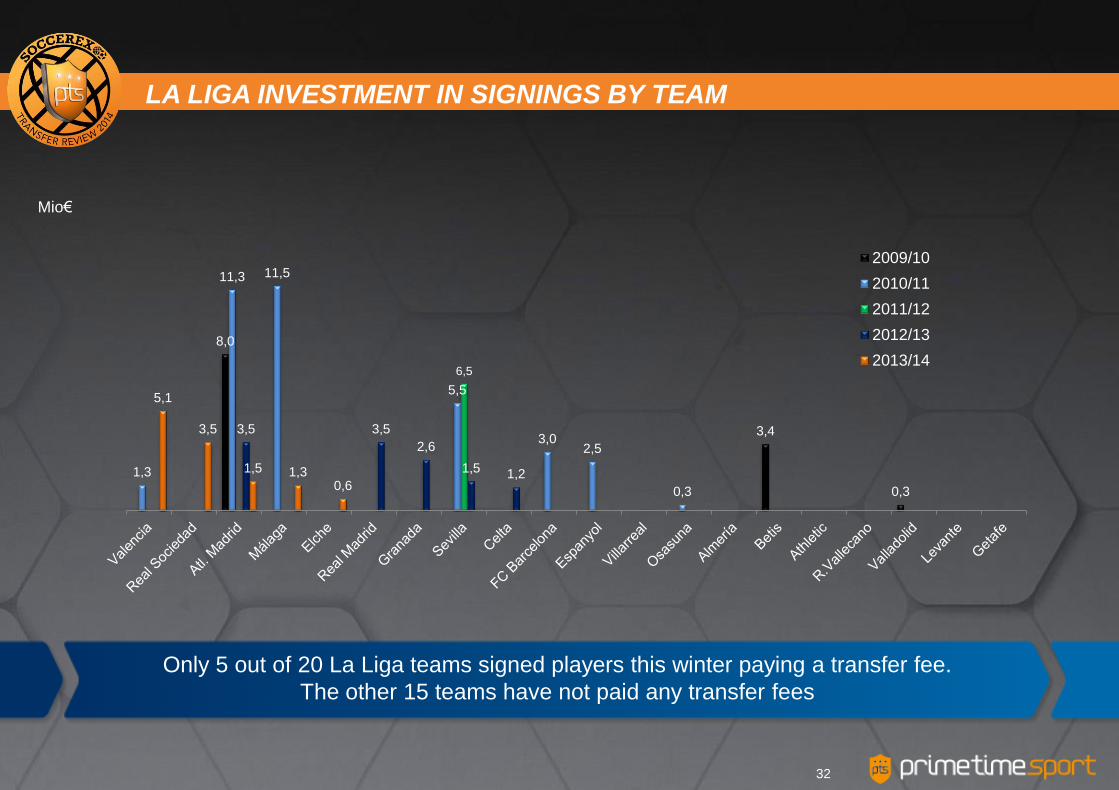
Only 5 out of 20 La Liga teams signed players this winter paying a transfer fee.
The other 15 teams have not paid any transfer fees
8,0
3,4
0,3
1,3
11,3 11,5
5,5
3,0 2,5
0,3
6,5
3,5 3,5
2,6
1,5 1,2
5,1
3,5
1,5 1,3 0,6
2009/10
2010/11
2011/12
2012/13
2013/14
LA LIGA INVESTMENT IN SIGNINGS BY TEAM
32
Mio€
24,3
13,5 12,8
6,43,5 3,5 3,4 3,0 2,6 2,5
At. Madrid Sevilla Málaga Valencia R. Sociedad R. Madrid Betis FC Barcelona
Granada Espanyol
*Summer window not included
ACCUMULATED 5 YEAR SPENDING OF TEAMS- LIGA BBVA
33
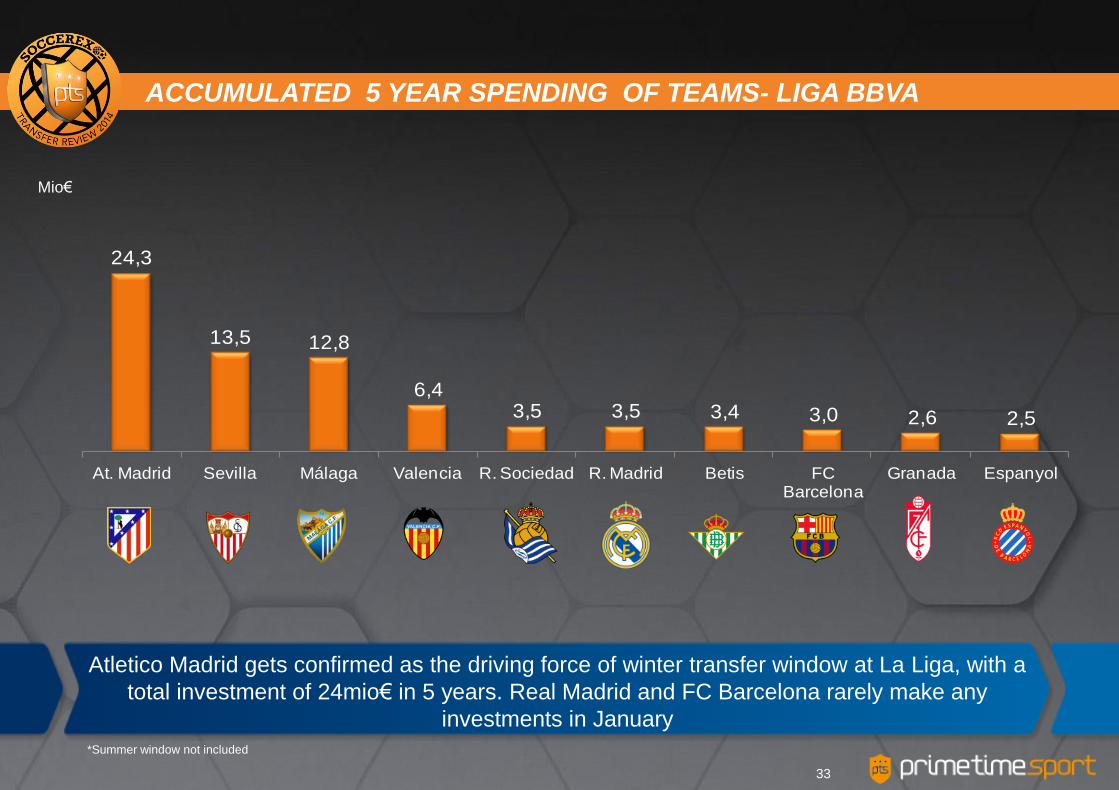
Atletico Madrid gets confirmed as the driving force of winter transfer window at La Liga, with a
total investment of 24mio€ in 5 years. Real Madrid and FC Barcelona rarely make any
investments in January
Mio€
TOP 10 SIGNINGS LA LIGA WINTER 2014
3,5 3,5
1,6 1,5
1,0
0,6 0,3
S.Canales V.Araújo Vezo Diego P.Pérez Rodrigues Rescaldini
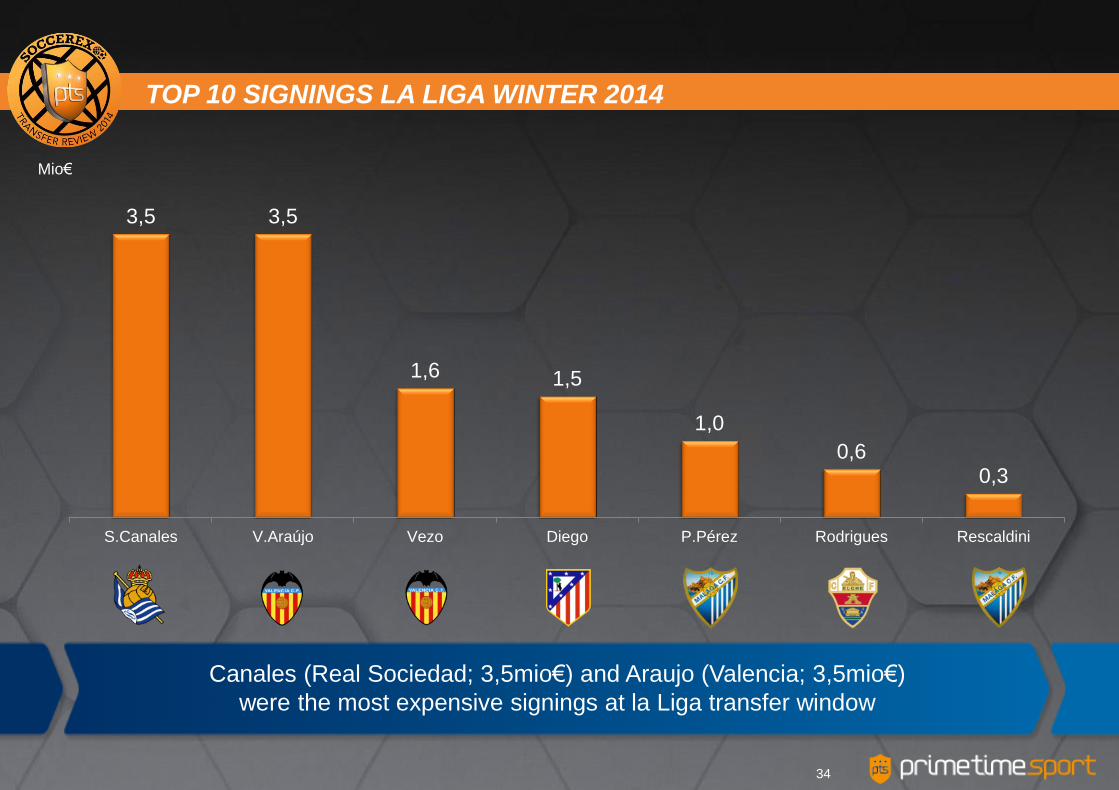
Canales (Real Sociedad; 3,5mio€) and Araujo (Valencia; 3,5mio€)
were the most expensive signings at la Liga transfer window
34
Mio€
27,0
21,3 21,0 20,5 20,0 18,0
12,0
9,0 9,0 8,7
Huntelaar Aimar Geovanni Gago Diarra Baneha Higuaín Zé Roberto R.Oliveira M.Fernández
TOP 10 MOST EXPENSIVE WINTER SIGNINGS – LIGA BBVA
35
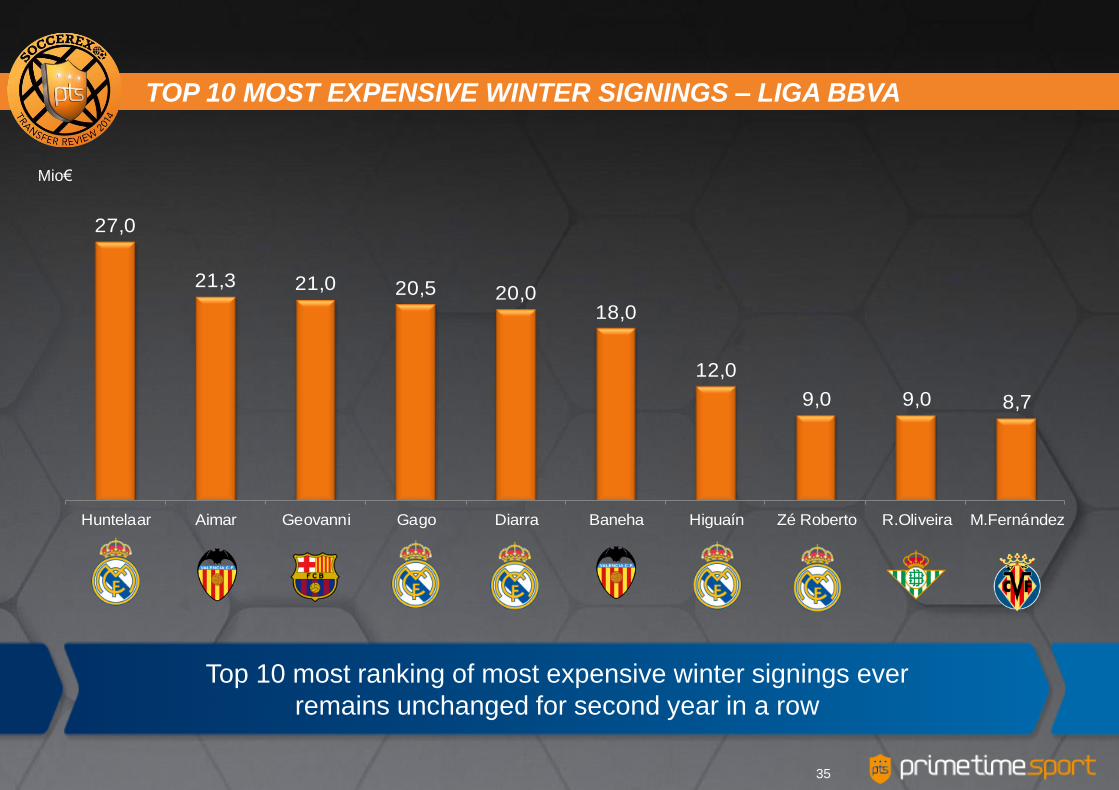
Top 10 most ranking of most expensive winter signings ever
remains unchanged for second year in a row
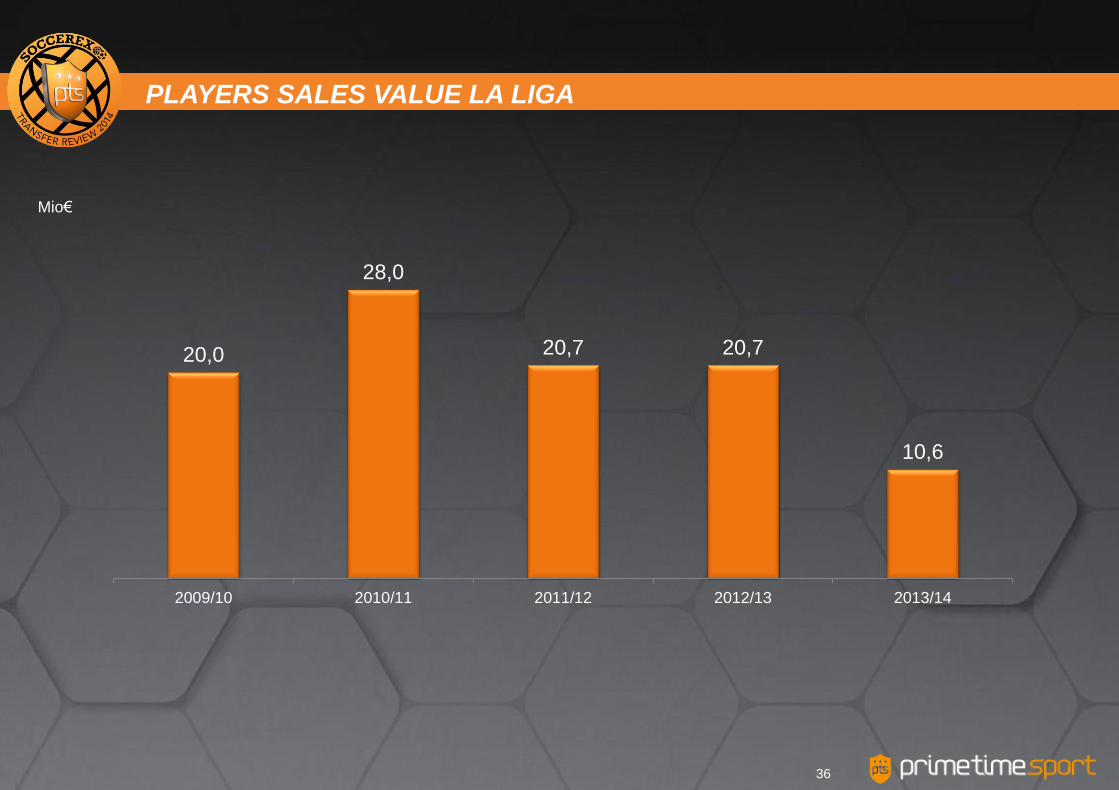
Mio€
20,0
28,0
20,7 20,7
10,6
2009/10 2010/11 2011/12 2012/13 2013/14
PLAYERS SALES VALUE LA LIGA
36
Mio€
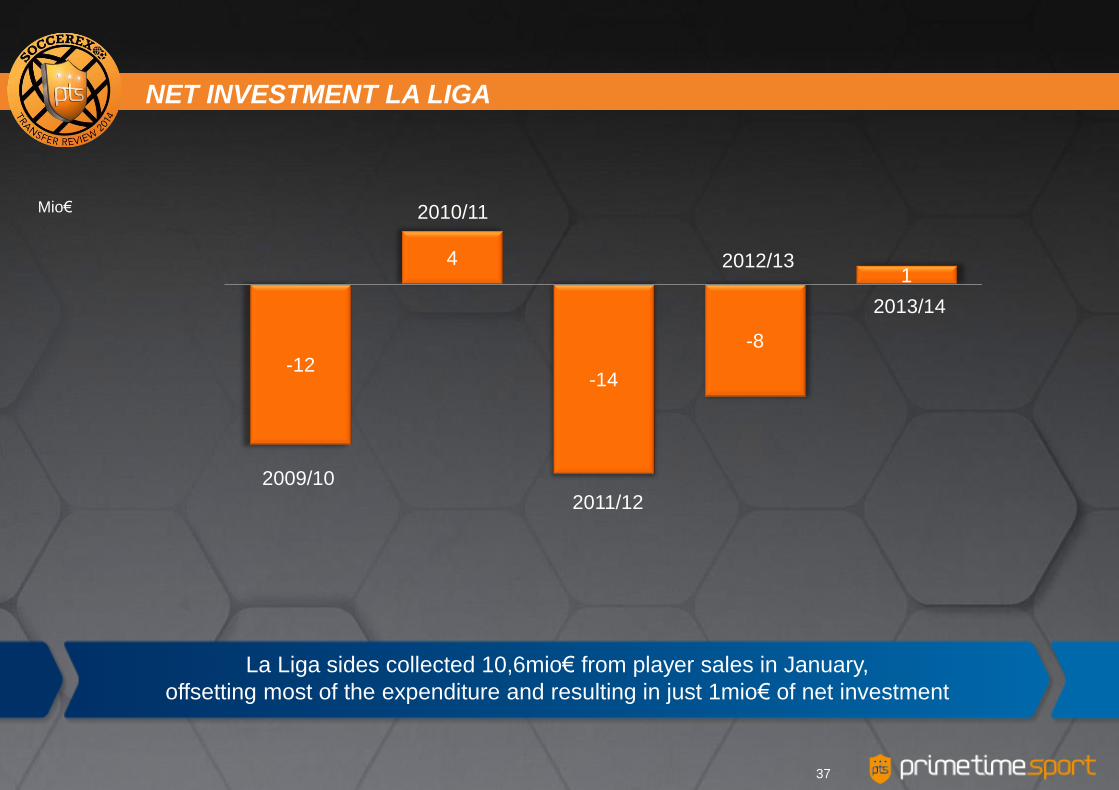
La Liga sides collected 10,6mio€ from player sales in January,
offsetting most of the expenditure and resulting in just 1mio€ of net investment
-12
4
-14
-8
1
2009/10
2010/11
2011/12
2012/13
2013/14
NET INVESTMENT LA LIGA
37

Mio€
FC Barcelona toped the list of revenues from players transfers after
selling youngster Toni Sanabria to Sassuolo for 4,5mio€. Valencia (3,5mio€)
and Villarreal (2,5) were the only other sides that collected money from player sales
3,4
0,3 0,5
8,0
0,9 0,8
6,0
2,4
0,9
12,5
4,3 4,0
9,5
3,5 3,0
0,5
12,3
3,5 3,0
1,2
0,4
4,5
3,5
2,5
0,1
2009/10
2010/11
2011/12
2012/13
2013/14
PLAYER SALES VALUE BY TEAM- LA LIGA
38
Mio€
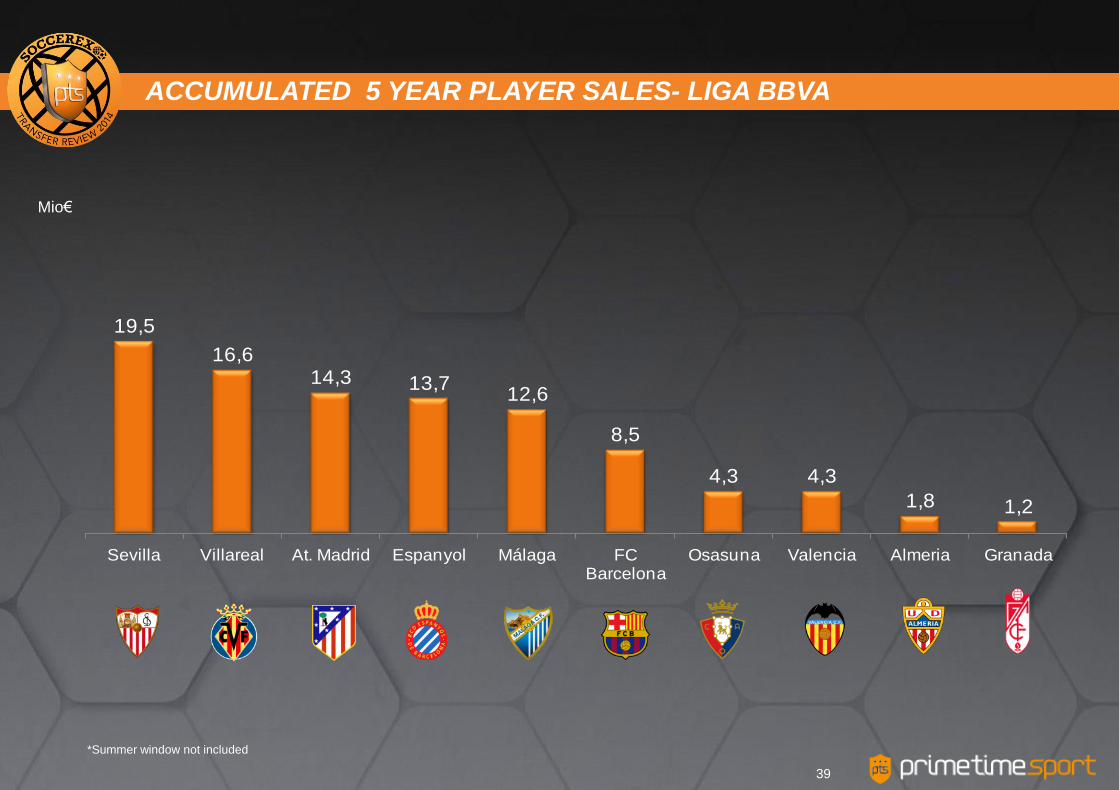
19,5
16,614,3 13,7
12,6
8,5
4,3 4,3
1,8 1,2
Sevilla Villareal At. Madrid Espanyol Málaga FC Barcelona
Osasuna Valencia Almeria Granada
*Summer window not included
ACCUMULATED 5 YEAR PLAYER SALES- LIGA BBVA
39
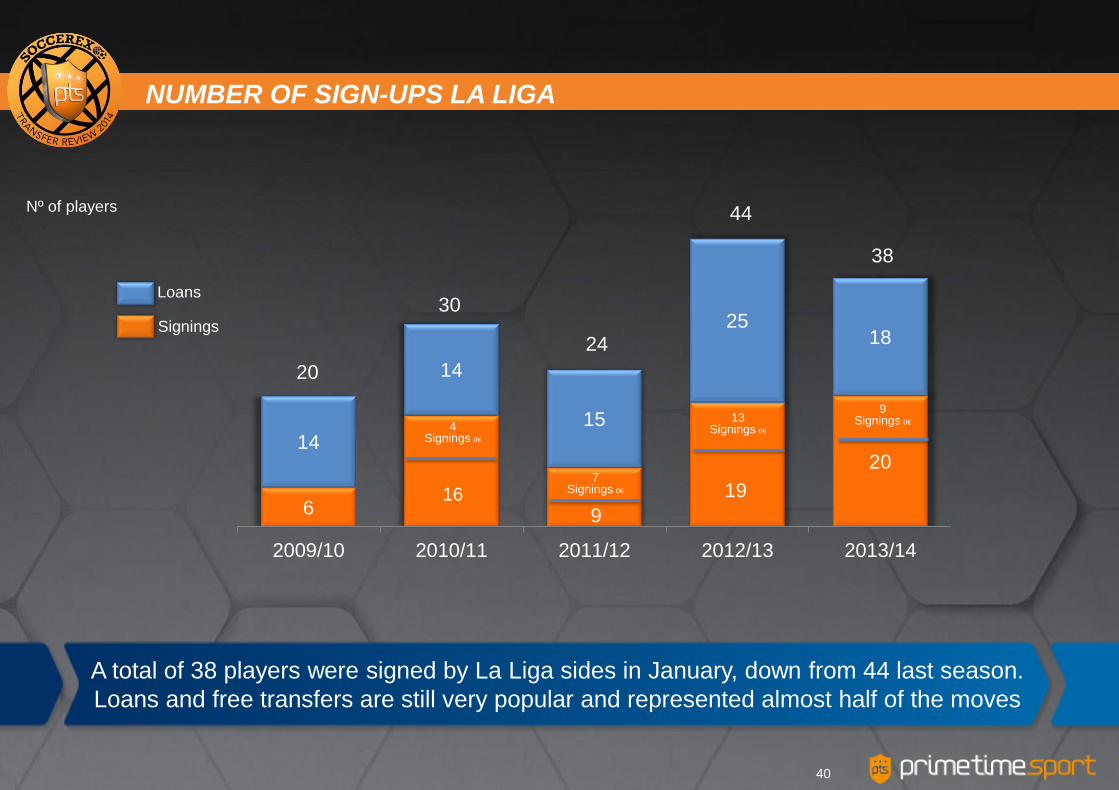
A total of 38 players were signed by La Liga sides in January, down from 44 last season.
Loans and free transfers are still very popular and represented almost half of the moves
Nº of players
Loans
Signings
6 19
20 14
14
15
25 18
2009/10 2010/11 2011/12 2012/13 2013/14
20
30
16
24
4 Signings 0€
7 Signings 0€
9
13 Signings 0€
44
NUMBER OF SIGN-UPS LA LIGA
38
9 Signings 0€
40
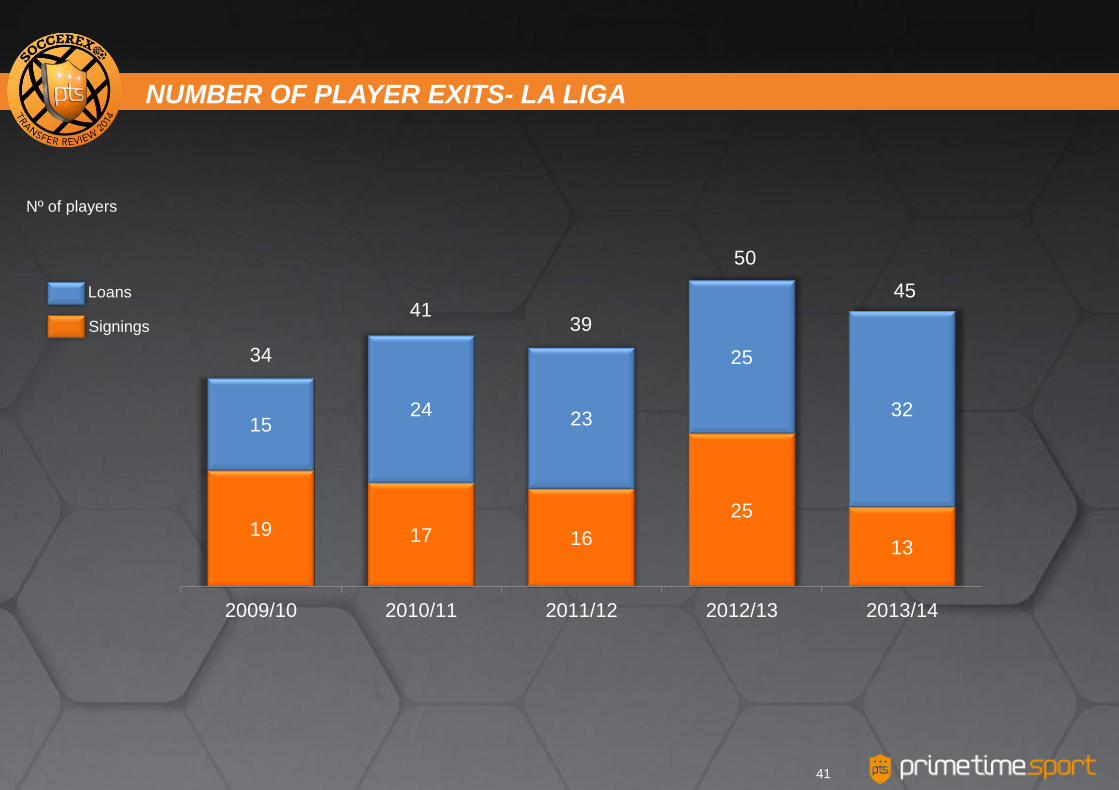
Nº of players
19 17 16
25
13
15 24 23
25
32
2009/10 2010/11 2011/12 2012/13 2013/14
34
41 39
50
NUMBER OF PLAYER EXITS- LA LIGA
Loans
Signings
45
41
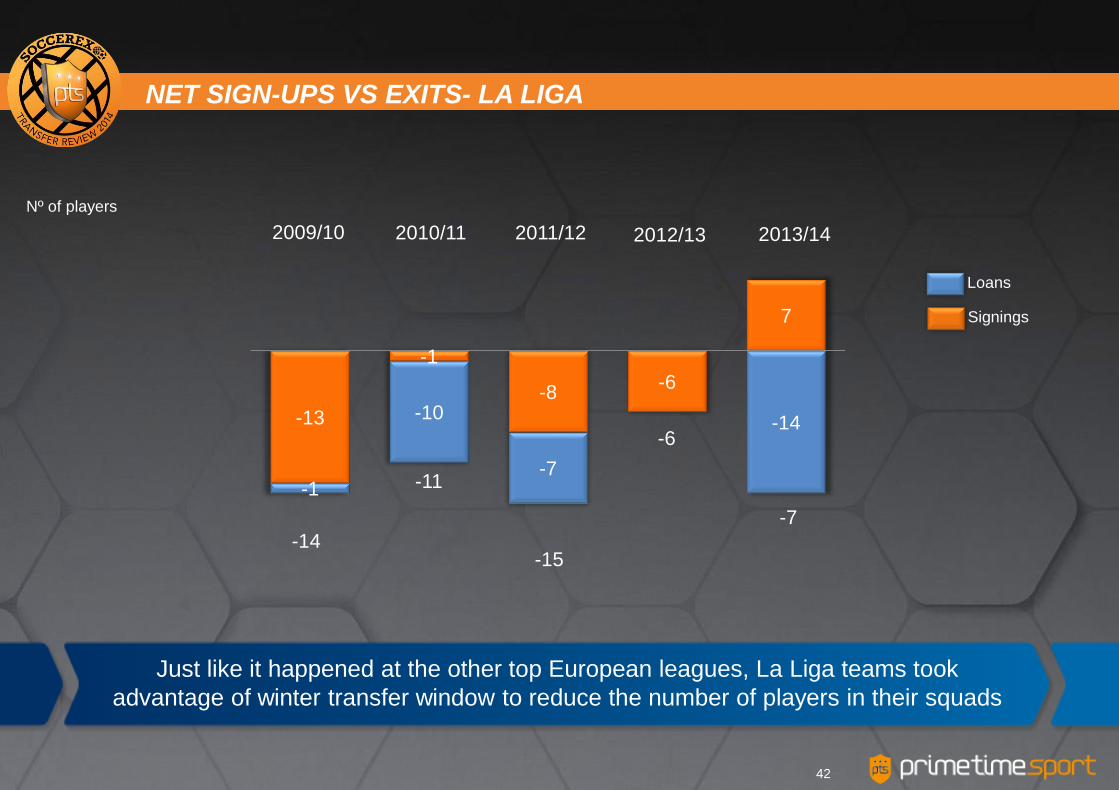
Just like it happened at the other top European leagues, La Liga teams took
advantage of winter transfer window to reduce the number of players in their squads
Nº of players
-13
-1
-8 -6
7
-1
-10
-7
-14
-14
-11
2009/10
Loans
Signings
2010/11 2011/12
-15
2012/13
-6
NET SIGN-UPS VS EXITS- LA LIGA
-7
2013/14
42
Nº of players
2
1
4
3
1
2
3
6
4 4
3
2 2
3 3
2
1
2 2
1 1
5
4 4
3 3 3 3
2 2 2 2 2
1 1 1
2011/12
2012/13
2013/14
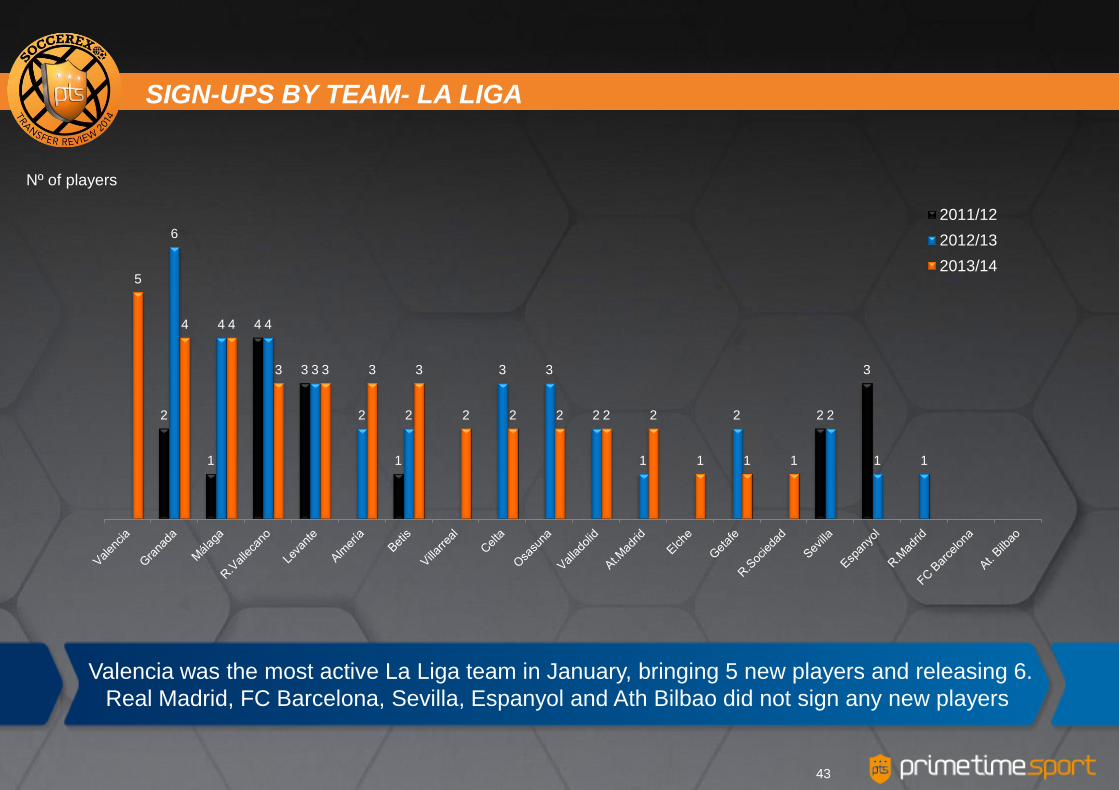
SIGN-UPS BY TEAM- LA LIGA
Valencia was the most active La Liga team in January, bringing 5 new players and releasing 6.
Real Madrid, FC Barcelona, Sevilla, Espanyol and Ath Bilbao did not sign any new players
43
Nº of players
3
4
3
2
4 4
2
3 3
1
2 2
3
1
8
5
4
3 3 3 3
1
4
3
2
1 1 1
7
6
5
3 3 3 3 3 3
2 2
1 1 1 1 1
2011/12
2012/13
2013/14
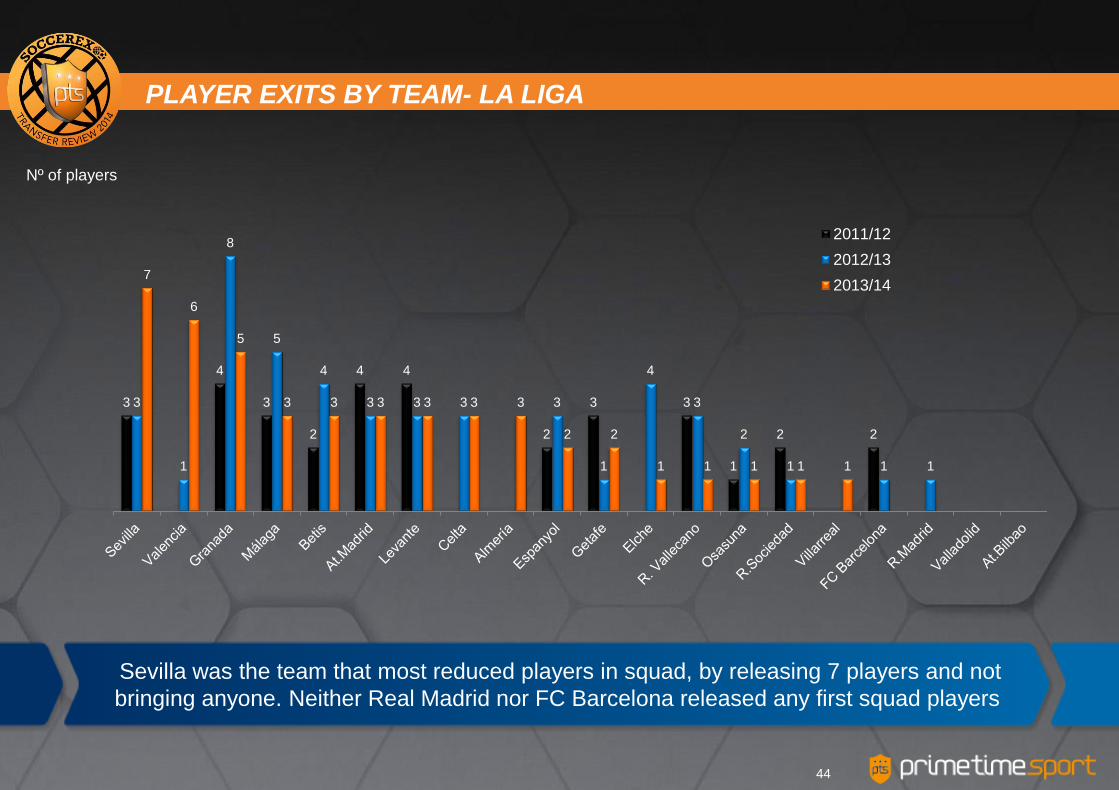
PLAYER EXITS BY TEAM- LA LIGA
Sevilla was the team that most reduced players in squad, by releasing 7 players and not
bringing anyone. Neither Real Madrid nor FC Barcelona released any first squad players
44

Nº of players
2 2
1 1 1
0 0 0 0 0 0 0
-1 -1 -1 -1 -1
-2
-7
NET SIGN-UPS VS EXITS BY TEAM- LA LIGA
45
SOCCEREX TRANSFER REVIEW 2014- WINTER WINDOW
46
1. Technical sheet
2. Winter 2014 transfer window: Premier League vs
other top European leagues
3. La Liga on going season review
4. European football table 2013/14
5. Case study: Impact of UEFA’s Financial Fair Play
6. Conclusions
7. Annexes
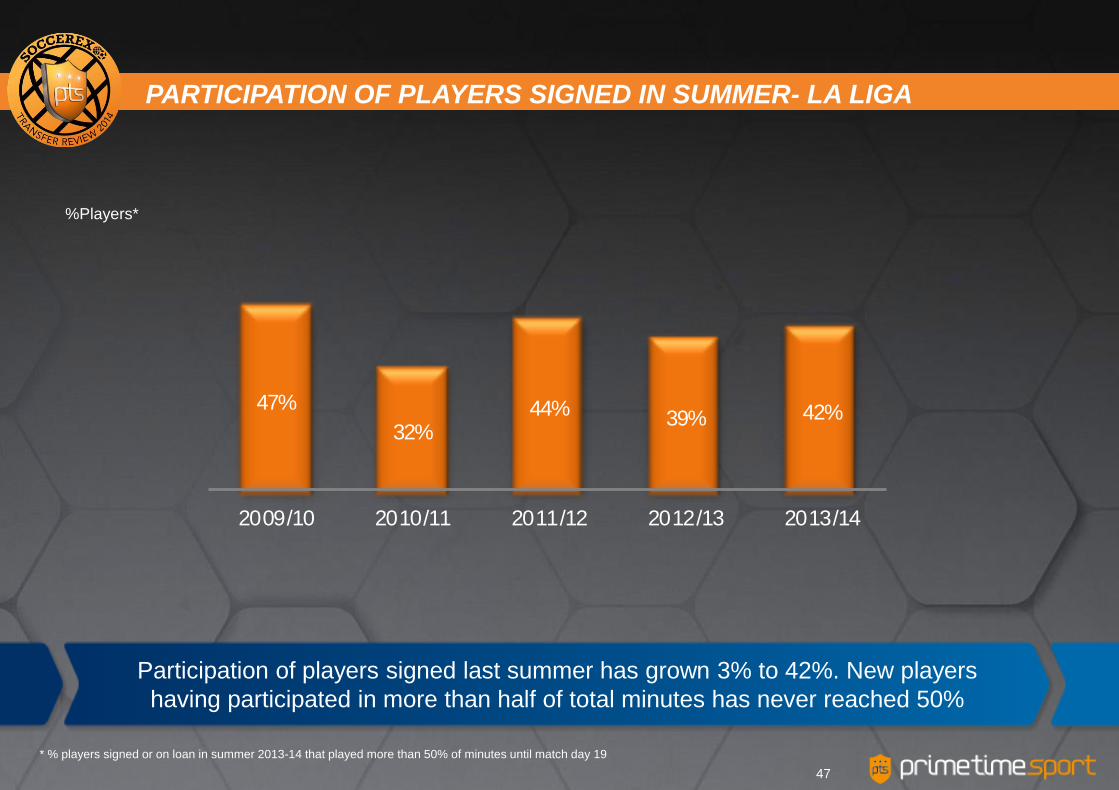
Participation of players signed last summer has grown 3% to 42%. New players
having participated in more than half of total minutes has never reached 50%
47%
32% 44% 39% 42%
2009/10 2010/11 2011/12 2012/13 2013/14
%Players*
* % players signed or on loan in summer 2013-14 that played more than 50% of minutes until match day 19
PARTICIPATION OF PLAYERS SIGNED IN SUMMER- LA LIGA
47
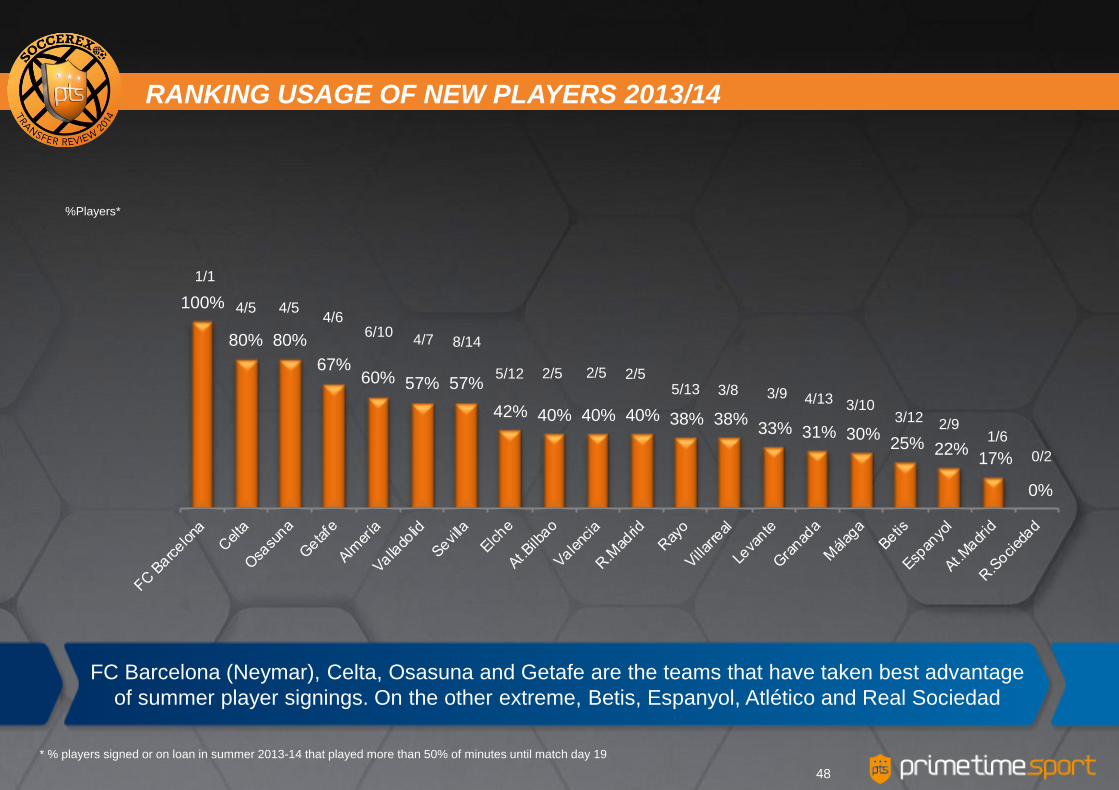
FC Barcelona (Neymar), Celta, Osasuna and Getafe are the teams that have taken best advantage
of summer player signings. On the other extreme, Betis, Espanyol, Atlético and Real Sociedad
%Players*
* % players signed or on loan in summer 2013-14 that played more than 50% of minutes until match day 19
100%
80% 80%
67% 60% 57% 57%
42% 40% 40% 40% 38% 38% 33% 31% 30%
25% 22% 17%
0%
1/6 2/9
1/1
4/6
4/7 8/14
5/12 5/13 3/8 3/9
3/10 3/12
0/2
4/5 4/5
6/10
2/5
4/13
2/5 2/5
RANKING USAGE OF NEW PLAYERS 2013/14
48
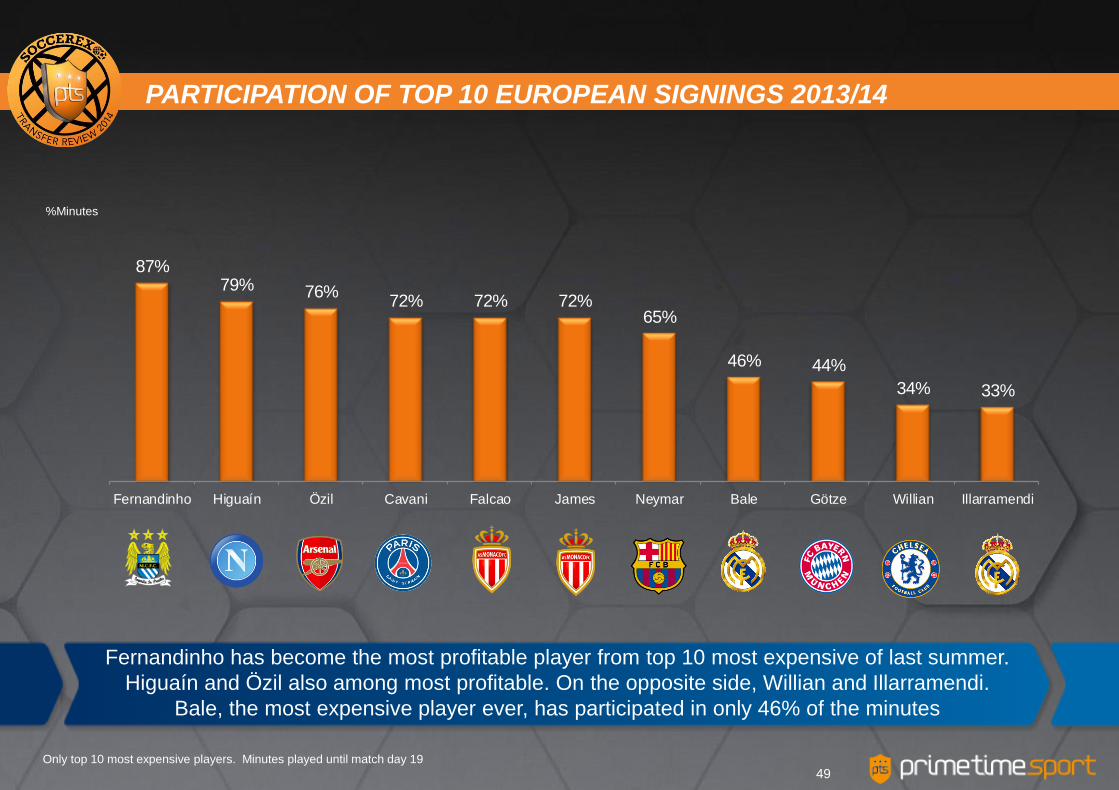
Fernandinho has become the most profitable player from top 10 most expensive of last summer.
Higuaín and Özil also among most profitable. On the opposite side, Willian and Illarramendi.
Bale, the most expensive player ever, has participated in only 46% of the minutes
87% 79% 76%
72% 72% 72% 65%
46% 44%
34% 33%
Fernandinho Higuaín Özil Cavani Falcao James Neymar Bale Götze Willian Illarramendi
%Minutes
PARTICIPATION OF TOP 10 EUROPEAN SIGNINGS 2013/14
Only top 10 most expensive players. Minutes played until match day 19
49
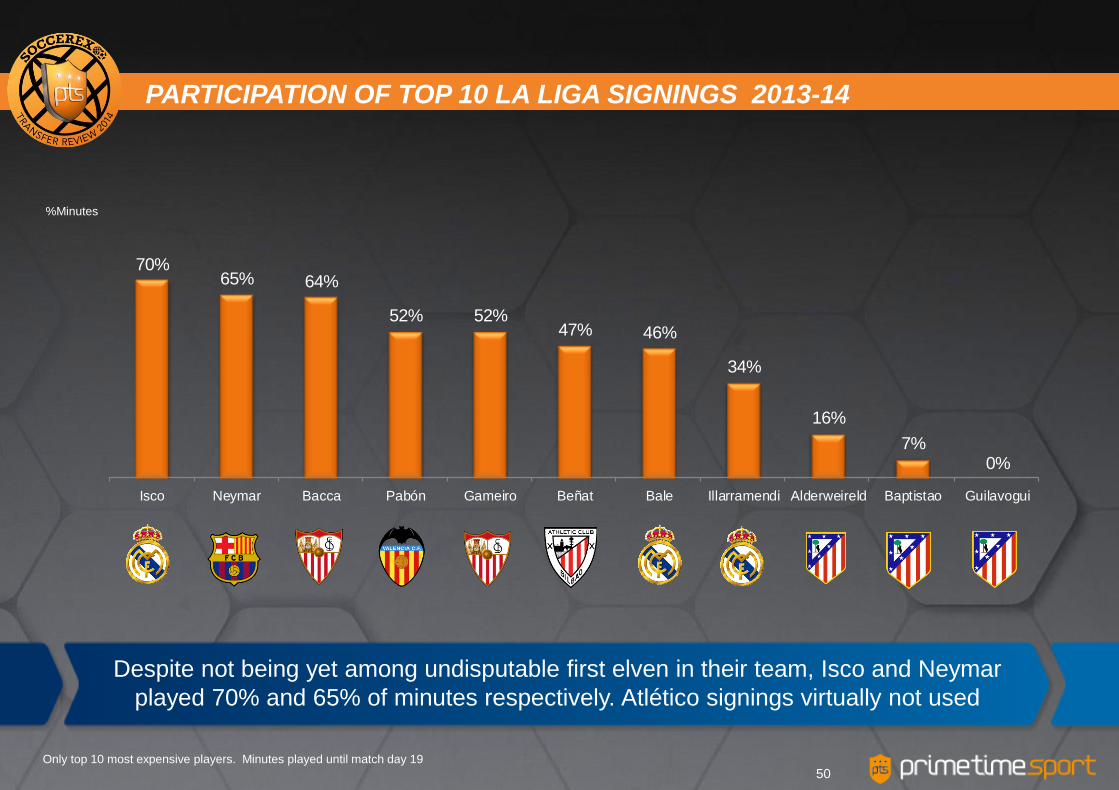
Despite not being yet among undisputable first elven in their team, Isco and Neymar
played 70% and 65% of minutes respectively. Atlético signings virtually not used
%Minutes
Only top 10 most expensive players. Minutes played until match day 19
70% 65% 64%
52% 52% 47% 46%
34%
16%
7% 0%
Isco Neymar Bacca Pabón Gameiro Beñat Bale Illarramendi Alderweireld Baptistao Guilavogui
PARTICIPATION OF TOP 10 LA LIGA SIGNINGS 2013-14
50
Club Player Matches
played
Minutes
played
% of
minutes
Matches
1st 11 Goals
Cost
(mio€)
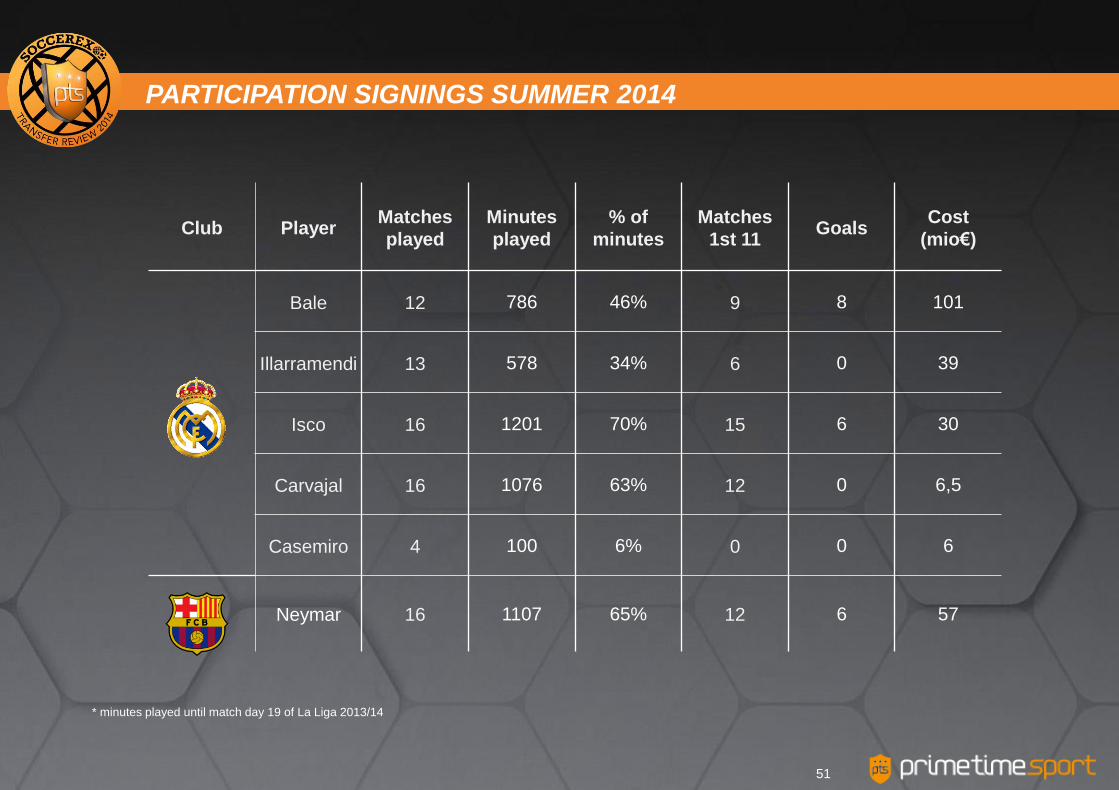
Bale 12 786 46% 9 8 101
Illarramendi 13 578 34% 6 0 39
Isco 16 1201 70% 15 6 30
Carvajal 16 1076 63% 12 0 6,5
Casemiro 4 100 6% 0 0 6
Neymar 16 1107 65% 12 6 57
* minutes played until match day 19 of La Liga 2013/14
PARTICIPATION SIGNINGS SUMMER 2014
51
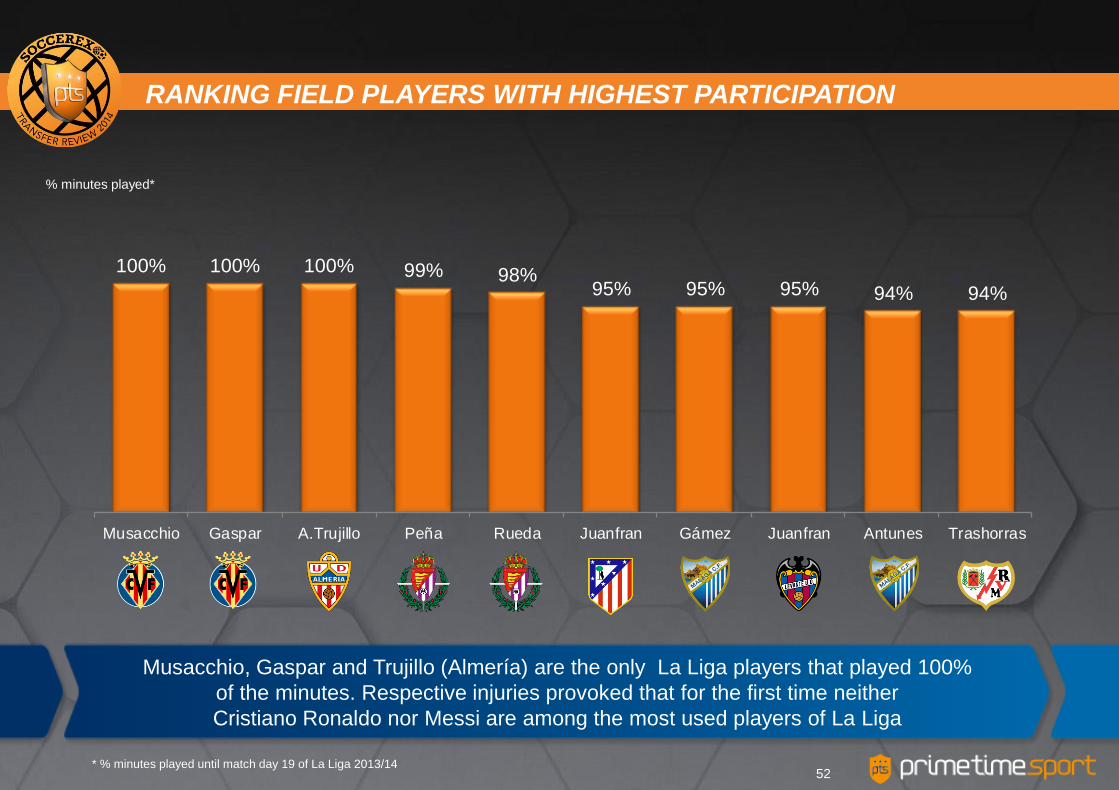
Musacchio, Gaspar and Trujillo (Almería) are the only La Liga players that played 100%
of the minutes. Respective injuries provoked that for the first time neither
Cristiano Ronaldo nor Messi are among the most used players of La Liga
100% 100% 100% 99% 98% 95% 95% 95% 94% 94%
Musacchio Gaspar A.Trujillo Peña Rueda Juanfran Gámez Juanfran Antunes Trashorras
% minutes played*
* % minutes played until match day 19 of La Liga 2013/14
RANKING FIELD PLAYERS WITH HIGHEST PARTICIPATION
52
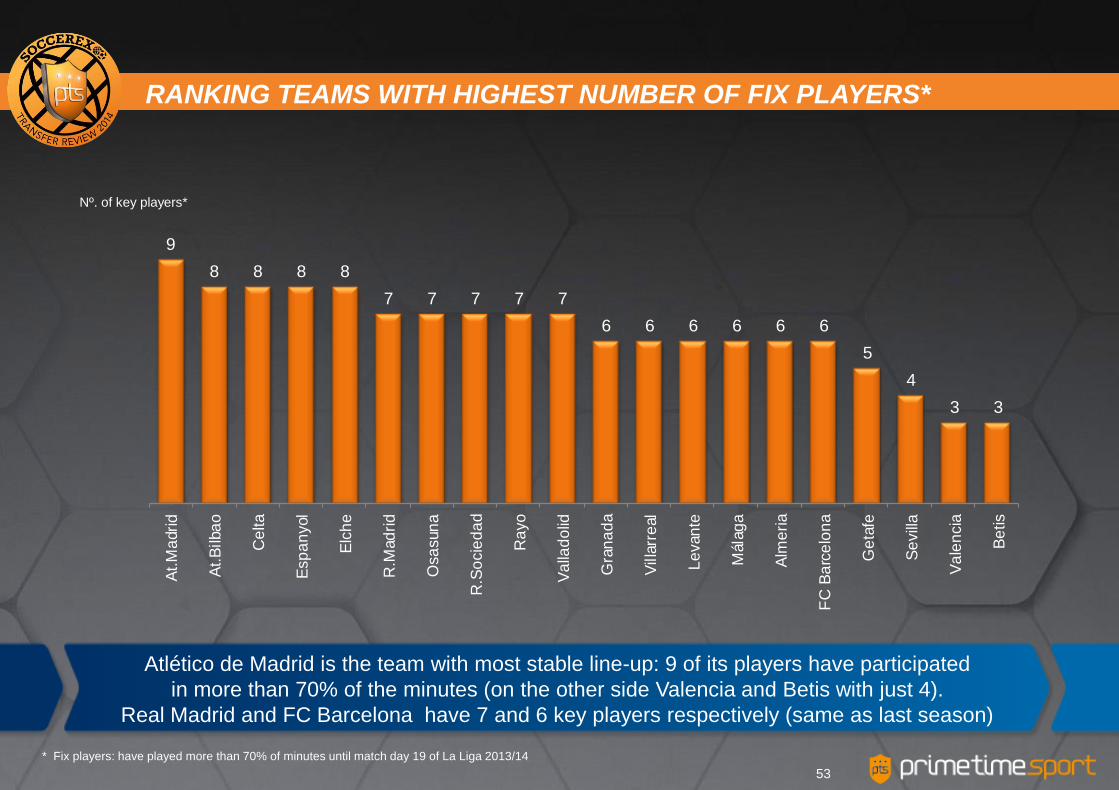
Atlético de Madrid is the team with most stable line-up: 9 of its players have participated
in more than 70% of the minutes (on the other side Valencia and Betis with just 4).
Real Madrid and FC Barcelona have 7 and 6 key players respectively (same as last season)
9
8 8 8 8
7 7 7 7 7
6 6 6 6 6 6
5
4
3 3
At.
Ma
dri
d
At.
Bilba
o
Ce
lta
Esp
an
yol
Elc
he
R.M
ad
rid
Osa
sun
a
R.S
ocie
da
d
Ra
yo
Va
llad
olid
Gra
na
da
Villa
rre
al
Le
van
te
Mála
ga
Alm
eri
a
FC
Ba
rce
lon
a
Ge
tafe
Se
vill
a
Va
len
cia
Be
tis
Nº. of key players*
* Fix players: have played more than 70% of minutes until match day 19 of La Liga 2013/14
RANKING TEAMS WITH HIGHEST NUMBER OF FIX PLAYERS*
53
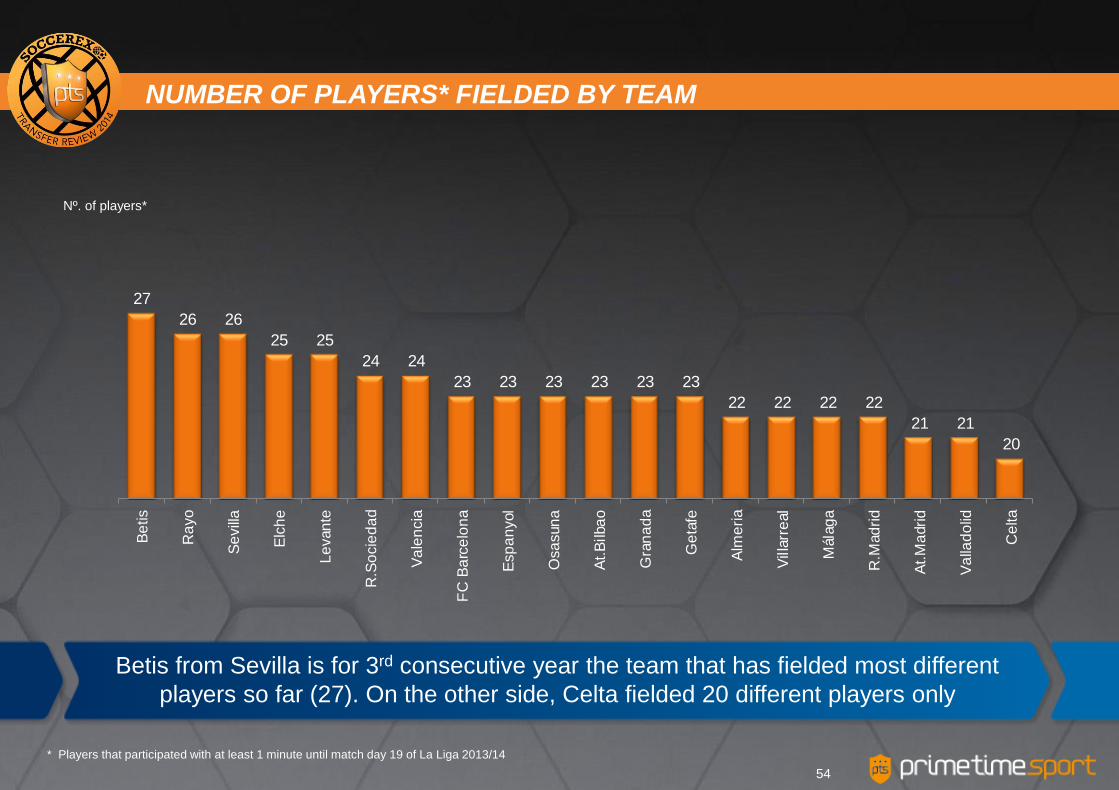
Betis from Sevilla is for 3rd consecutive year the team that has fielded most different
players so far (27). On the other side, Celta fielded 20 different players only
27
26 26
25 25
24 24
23 23 23 23 23 23
22 22 22 22
21 21
20
Be
tis
Ra
yo
Se
vill
a
Elc
he
Le
van
te
R.S
ocie
da
d
Va
len
cia
FC
Ba
rce
lon
a
Esp
an
yol
Osa
sun
a
At.
Bilba
o
Gra
na
da
Ge
tafe
Alm
eri
a
Villa
rre
al
Mála
ga
R.M
ad
rid
At.
Ma
dri
d
Va
llad
olid
Ce
lta
Nº. of players*
* Players that participated with at least 1 minute until match day 19 of La Liga 2013/14
NUMBER OF PLAYERS* FIELDED BY TEAM
54
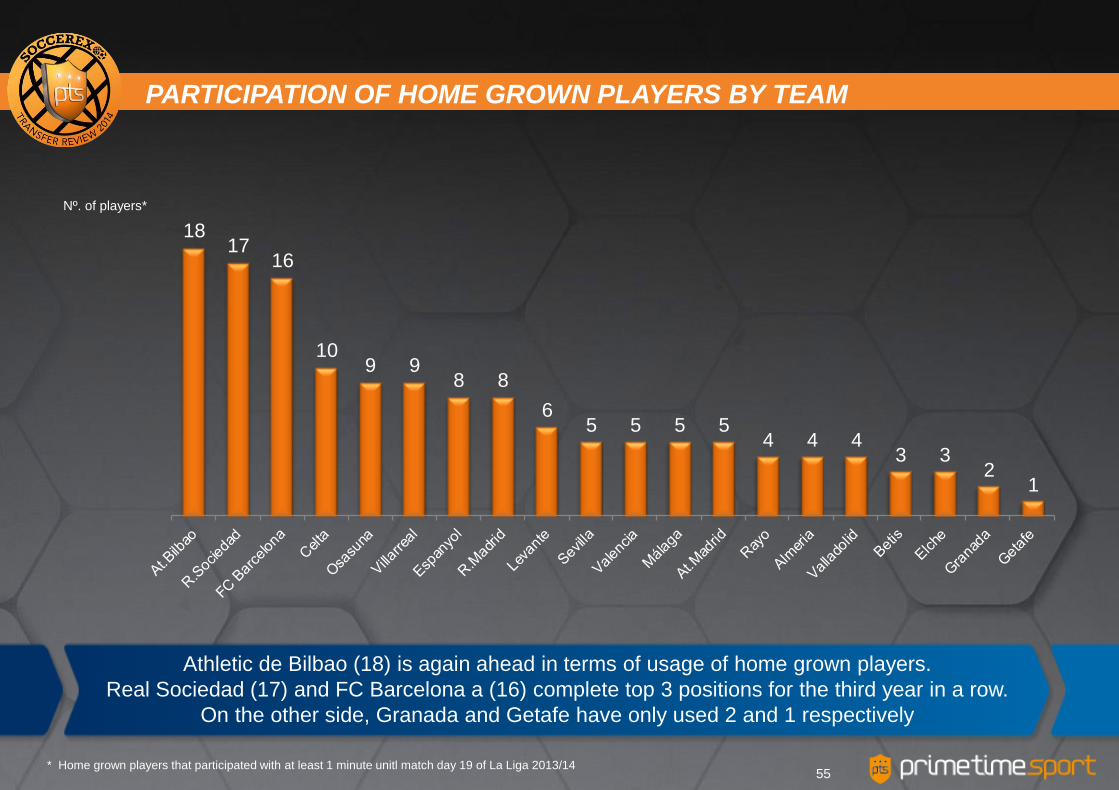
Athletic de Bilbao (18) is again ahead in terms of usage of home grown players.
Real Sociedad (17) and FC Barcelona a (16) complete top 3 positions for the third year in a row.
On the other side, Granada and Getafe have only used 2 and 1 respectively
Nº. of players*
18 17
16
10 9 9
8 8
6 5 5 5 5
4 4 4 3 3
2 1
* Home grown players that participated with at least 1 minute unitl match day 19 of La Liga 2013/14
PARTICIPATION OF HOME GROWN PLAYERS BY TEAM
55
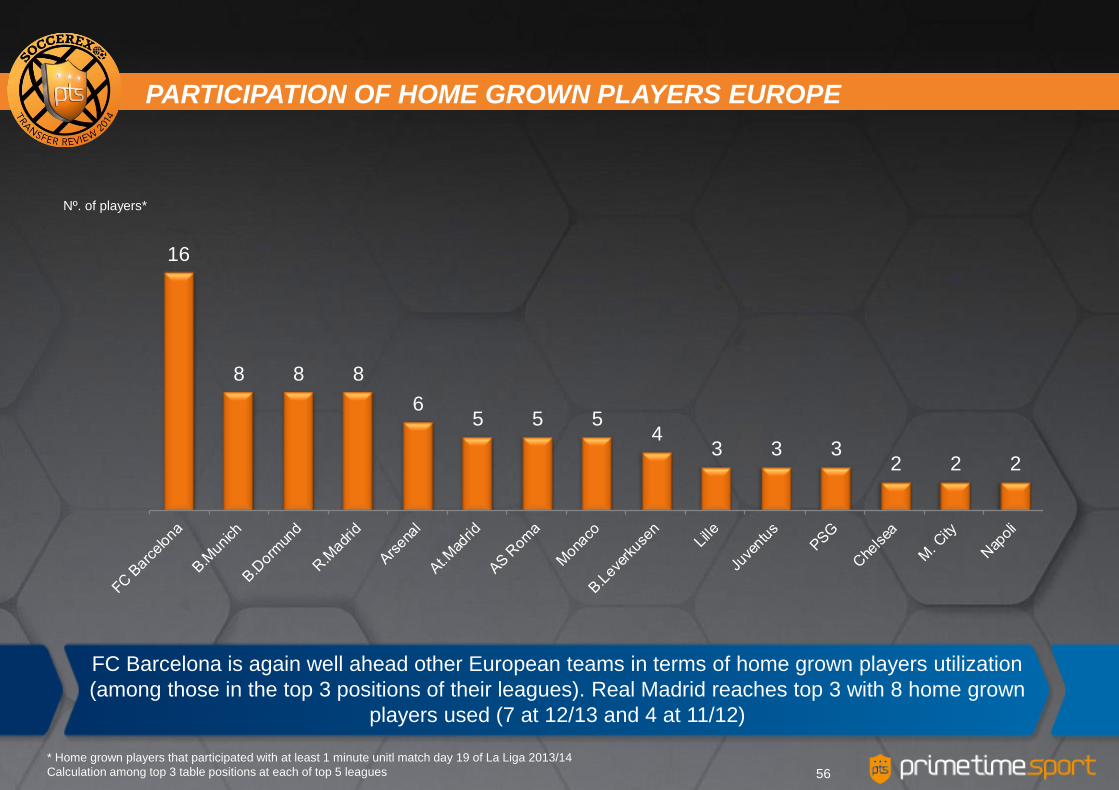
FC Barcelona is again well ahead other European teams in terms of home grown players utilization
(among those in the top 3 positions of their leagues). Real Madrid reaches top 3 with 8 home grown
players used (7 at 12/13 and 4 at 11/12)
Nº. of players*
16
8 8 8
6 5 5 5
4 3 3 3
2 2 2
* Home grown players that participated with at least 1 minute unitl match day 19 of La Liga 2013/14
Calculation among top 3 table positions at each of top 5 leagues
PARTICIPATION OF HOME GROWN PLAYERS EUROPE
56
SOCCEREX TRANSFER REVIEW 2014- WINTER WINDOW
57
1. Technical sheet
2. Winter 2014 transfer window: Premier League vs
other top European leagues
3. La Liga on going season review
4. European football table 2013/14
5. Case study: Impact of UEFA’s Financial Fair Play
6. Conclusions
7. Annexes

1. Top 5 European leagues combined
2. Top scorers and assists
SOCCEREX TRANSFER REVIEW 2014- WINTER WINDOW
58
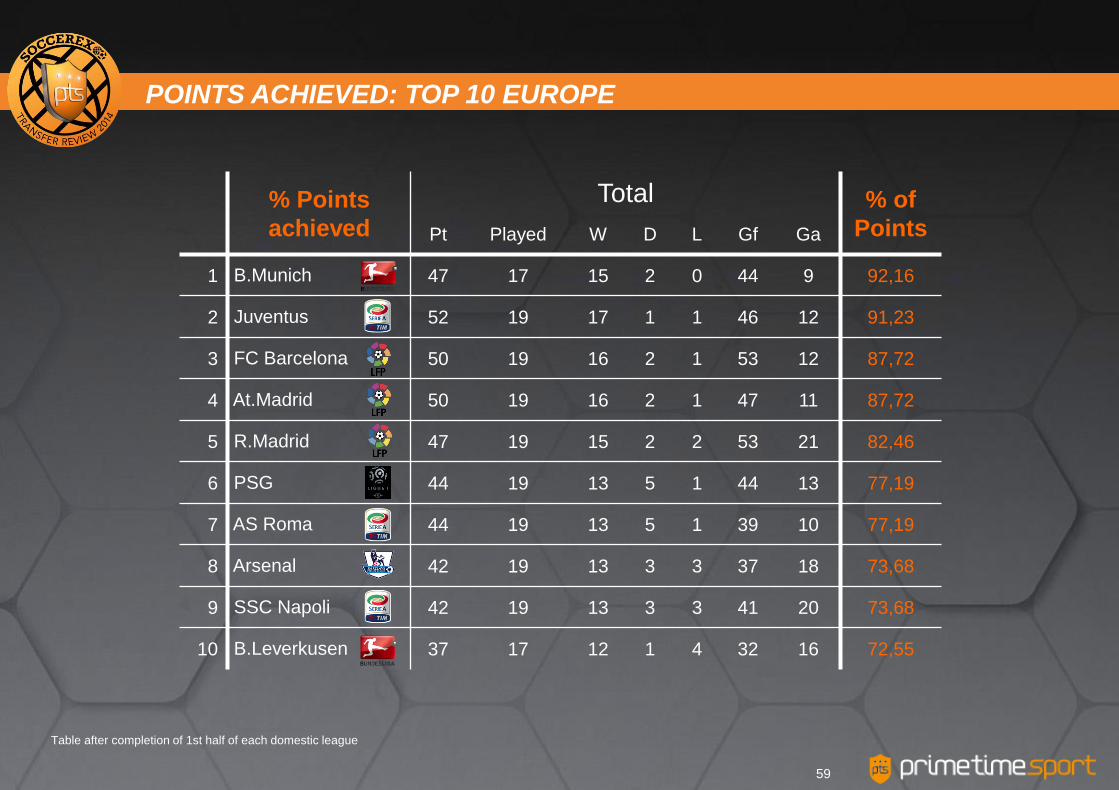
Table after completion of 1st half of each domestic league
% Points
achieved
Total % of
Points Pt Played W D L Gf Ga
1 B.Munich 47 17 15 2 0 44 9 92,16
2 Juventus 52 19 17 1 1 46 12 91,23
3 FC Barcelona 50 19 16 2 1 53 12 87,72
4 At.Madrid 50 19 16 2 1 47 11 87,72
5 R.Madrid 47 19 15 2 2 53 21 82,46
6 PSG 44 19 13 5 1 44 13 77,19
7 AS Roma 44 19 13 5 1 39 10 77,19
8 Arsenal 42 19 13 3 3 37 18 73,68
9 SSC Napoli 42 19 13 3 3 41 20 73,68
10 B.Leverkusen 37 17 12 1 4 32 16 72,55
POINTS ACHIEVED: TOP 10 EUROPE
59
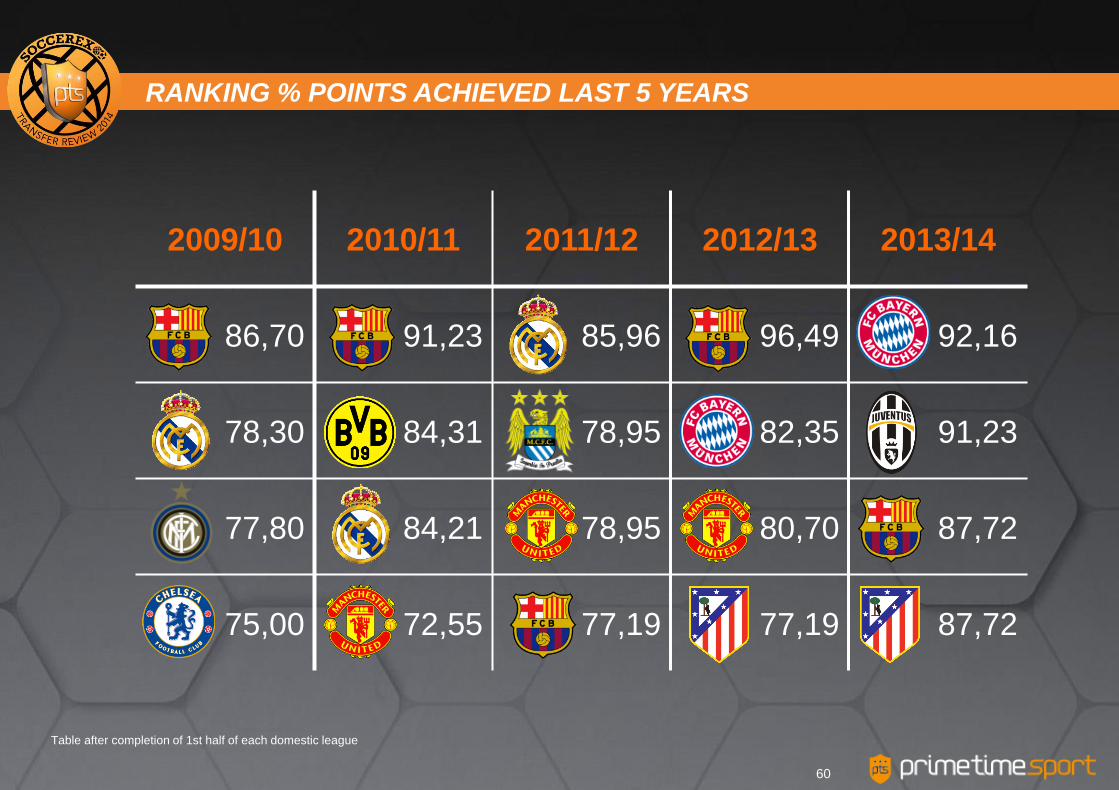
Table after completion of 1st half of each domestic league
2009/10 2010/11 2011/12 2012/13 2013/14
86,70 91,23 85,96 96,49 92,16
78,30 84,31 78,95 82,35 91,23
77,80 84,21 78,95 80,70 87,72
75,00 72,55 77,19 77,19 87,72
RANKING % POINTS ACHIEVED LAST 5 YEARS
60
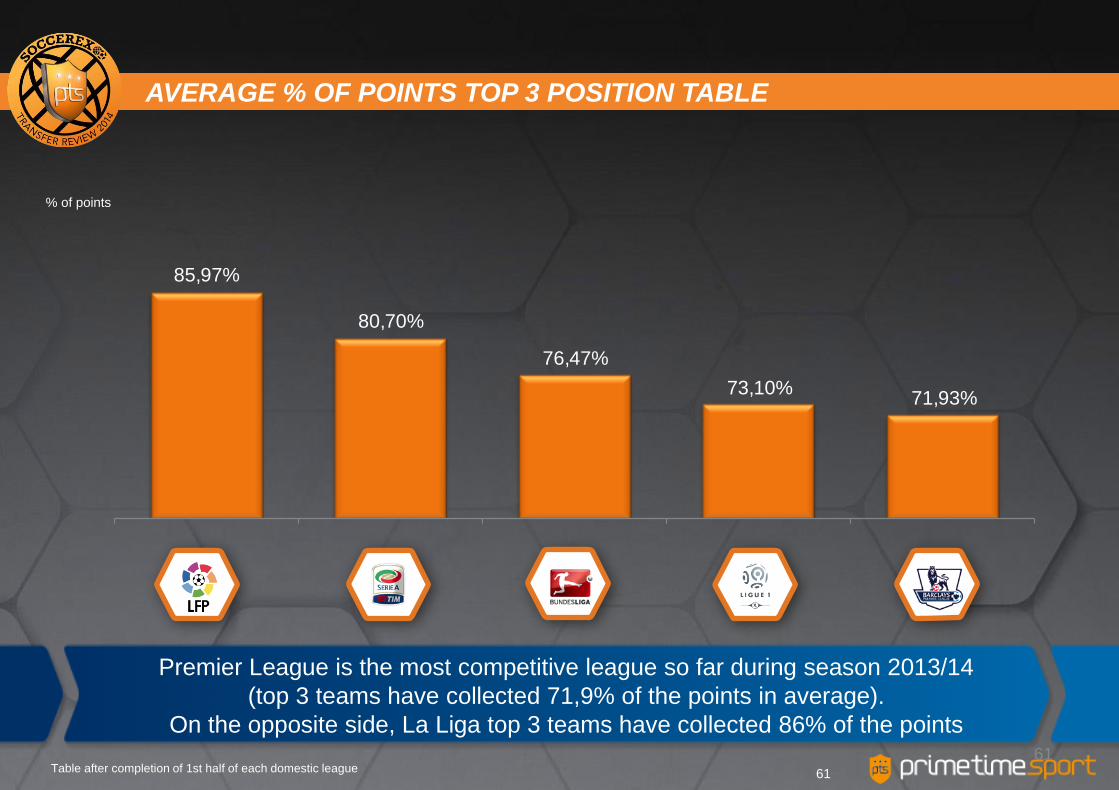
85,97%
80,70%
76,47%
73,10% 71,93%
% of points
AVERAGE % OF POINTS TOP 3 POSITION TABLE
61 Table after completion of 1st half of each domestic league 61
Premier League is the most competitive league so far during season 2013/14
(top 3 teams have collected 71,9% of the points in average).
On the opposite side, La Liga top 3 teams have collected 86% of the points
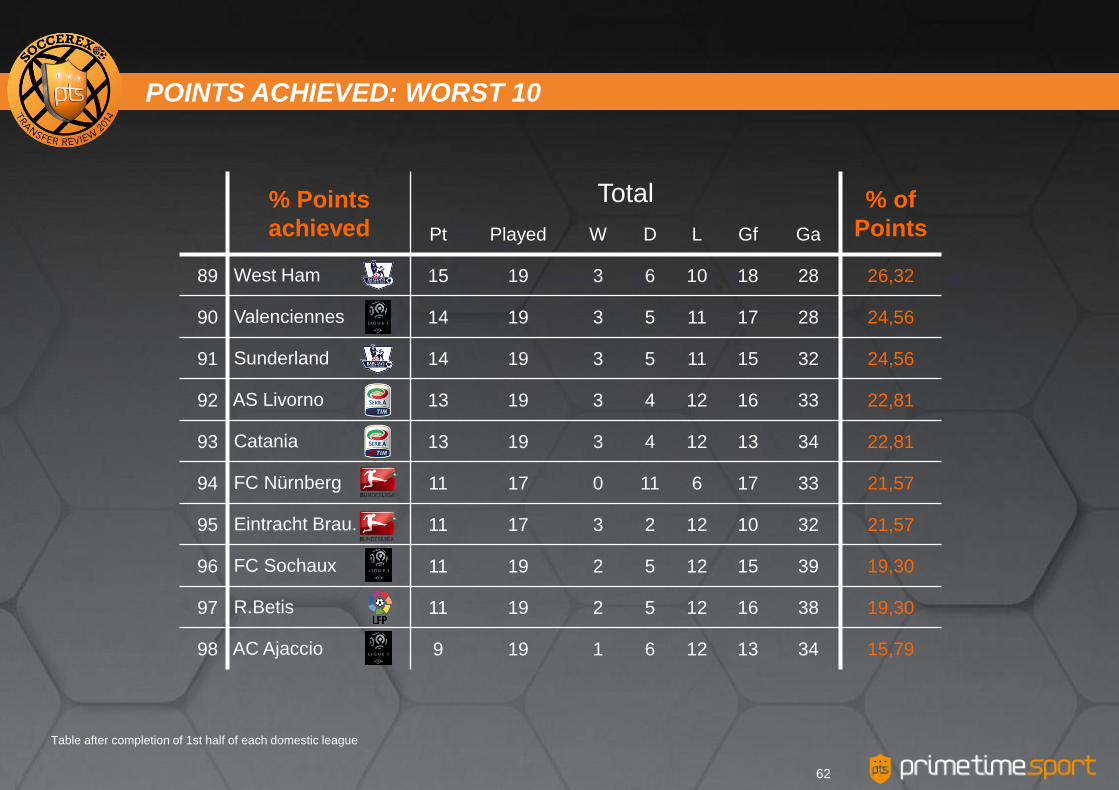
Table after completion of 1st half of each domestic league
% Points
achieved
Total % of
Points Pt Played W D L Gf Ga
89 West Ham 15 19 3 6 10 18 28 26,32
90 Valenciennes 14 19 3 5 11 17 28 24,56
91 Sunderland 14 19 3 5 11 15 32 24,56
92 AS Livorno 13 19 3 4 12 16 33 22,81
93 Catania 13 19 3 4 12 13 34 22,81
94 FC Nürnberg 11 17 0 11 6 17 33 21,57
95 Eintracht Brau. 11 17 3 2 12 10 32 21,57
96 FC Sochaux 11 19 2 5 12 15 39 19,30
97 R.Betis 11 19 2 5 12 16 38 19,30
98 AC Ajaccio 9 19 1 6 12 13 34 15,79
POINTS ACHIEVED: WORST 10
62
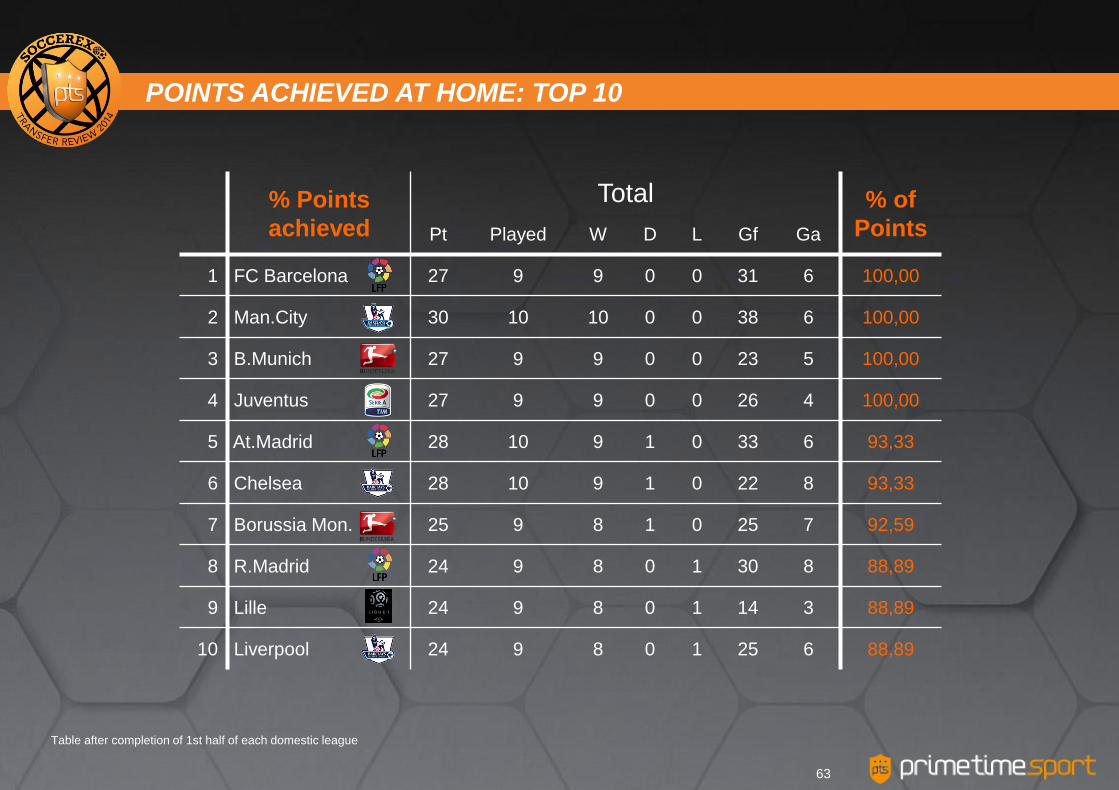
Table after completion of 1st half of each domestic league
% Points
achieved
Total % of
Points Pt Played W D L Gf Ga
1 FC Barcelona 27 9 9 0 0 31 6 100,00
2 Man.City 30 10 10 0 0 38 6 100,00
3 B.Munich 27 9 9 0 0 23 5 100,00
4 Juventus 27 9 9 0 0 26 4 100,00
5 At.Madrid 28 10 9 1 0 33 6 93,33
6 Chelsea 28 10 9 1 0 22 8 93,33
7 Borussia Mon. 25 9 8 1 0 25 7 92,59
8 R.Madrid 24 9 8 0 1 30 8 88,89
9 Lille 24 9 8 0 1 14 3 88,89
10 Liverpool 24 9 8 0 1 25 6 88,89
POINTS ACHIEVED AT HOME: TOP 10
63
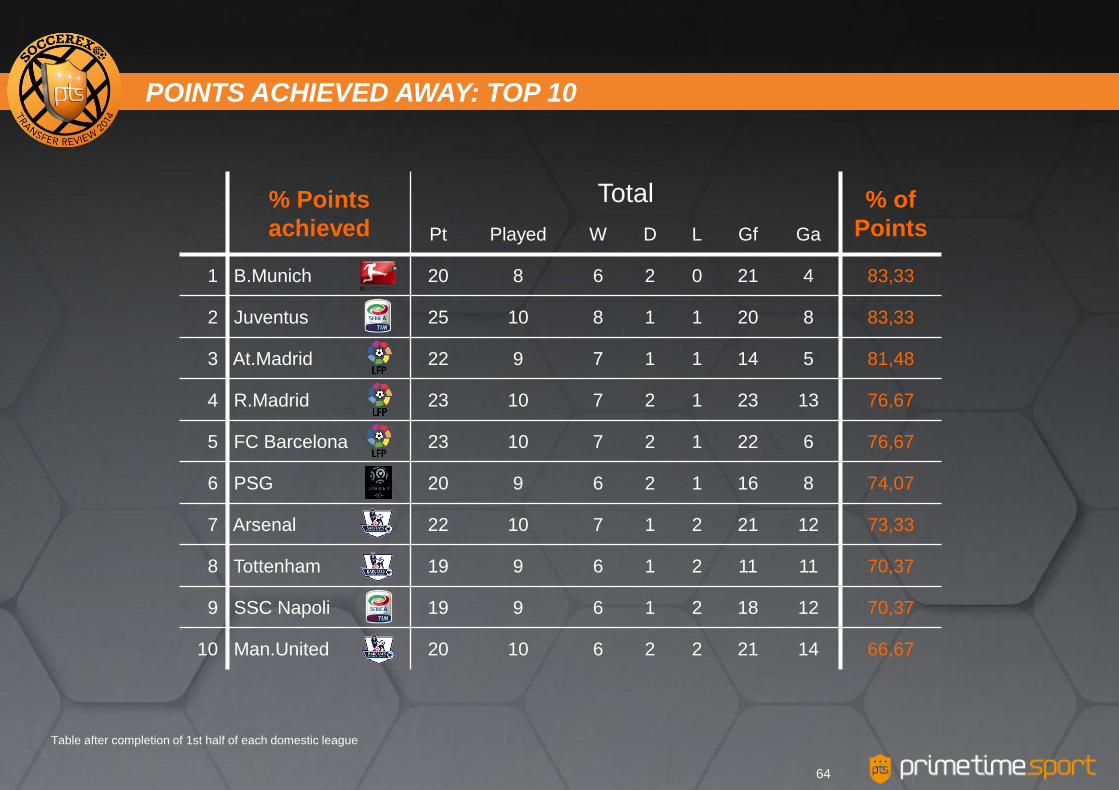
Table after completion of 1st half of each domestic league
% Points
achieved
Total % of
Points Pt Played W D L Gf Ga
1 B.Munich 20 8 6 2 0 21 4 83,33
2 Juventus 25 10 8 1 1 20 8 83,33
3 At.Madrid 22 9 7 1 1 14 5 81,48
4 R.Madrid 23 10 7 2 1 23 13 76,67
5 FC Barcelona 23 10 7 2 1 22 6 76,67
6 PSG 20 9 6 2 1 16 8 74,07
7 Arsenal 22 10 7 1 2 21 12 73,33
8 Tottenham 19 9 6 1 2 11 11 70,37
9 SSC Napoli 19 9 6 1 2 18 12 70,37
10 Man.United 20 10 6 2 2 21 14 66,67
POINTS ACHIEVED AWAY: TOP 10
64

Table after completion of 1st half of each domestic league
Average goals
favor
Total Avge
Gf Pt Played W D L Gf Ga
1 Man.City 41 19 13 2 4 54 21 2,84
2 FC Barcelona 50 19 16 2 1 53 12 2,79
3 R.Madrid 47 19 15 2 2 53 21 2,79
4 B.Munich 47 17 15 2 0 44 9 2,59
5 At.Madrid 50 19 16 2 1 47 11 2,47
6 Juventus 52 19 17 1 1 46 12 2,42
7 PSG 44 19 13 5 1 44 13 2,32
8 Liverpool 36 19 11 3 5 44 23 2,32
9 B.Dormund 32 17 10 2 5 38 20 2,24
10 SSC Napoli 42 19 13 3 3 41 20 2,16
AVERAGE GOALS SCORED: TOP 10
65
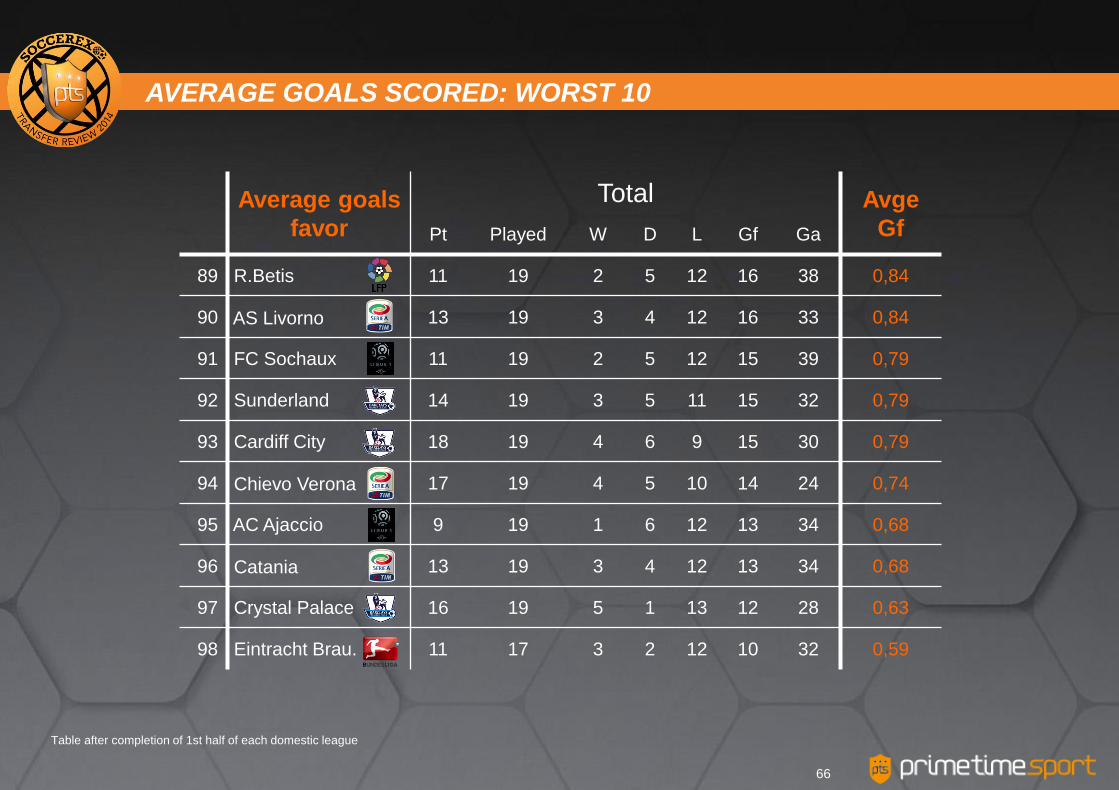
Table after completion of 1st half of each domestic league
Average goals
favor
Total Avge
Gf Pt Played W D L Gf Ga
89 R.Betis 11 19 2 5 12 16 38 0,84
90 AS Livorno 13 19 3 4 12 16 33 0,84
91 FC Sochaux 11 19 2 5 12 15 39 0,79
92 Sunderland 14 19 3 5 11 15 32 0,79
93 Cardiff City 18 19 4 6 9 15 30 0,79
94 Chievo Verona 17 19 4 5 10 14 24 0,74
95 AC Ajaccio 9 19 1 6 12 13 34 0,68
96 Catania 13 19 3 4 12 13 34 0,68
97 Crystal Palace 16 19 5 1 13 12 28 0,63
98 Eintracht Brau. 11 17 3 2 12 10 32 0,59
AVERAGE GOALS SCORED: WORST 10
66
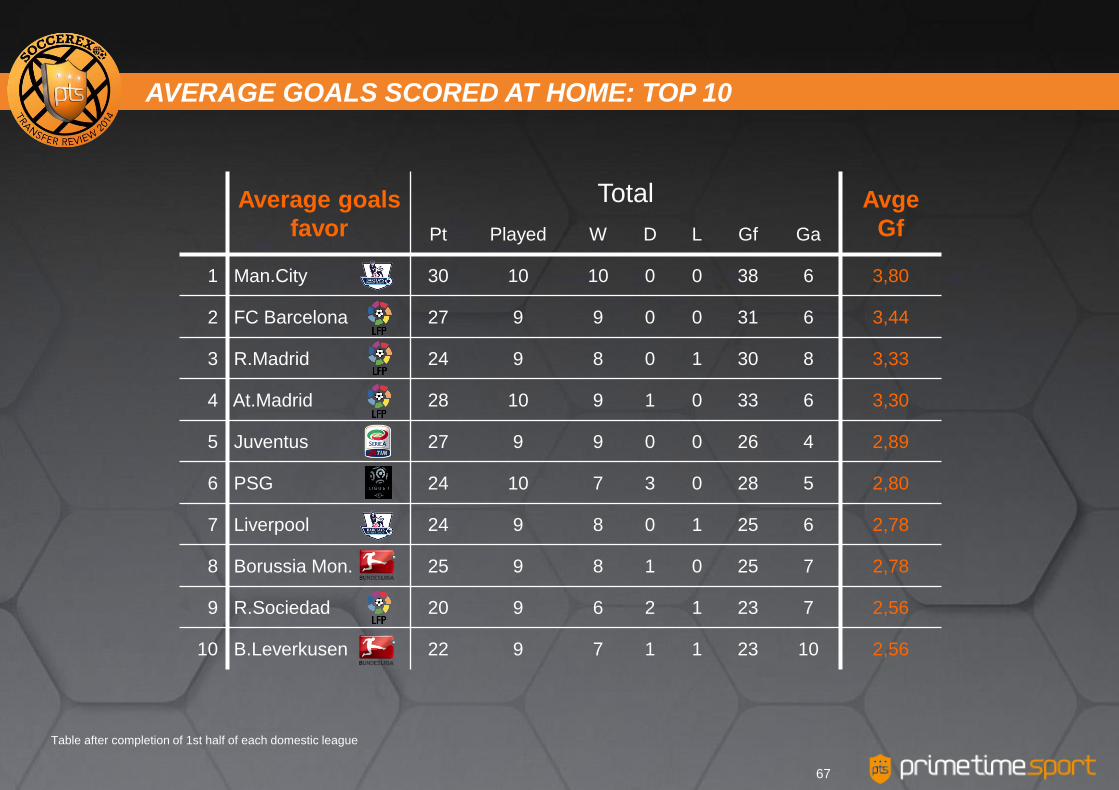
Table after completion of 1st half of each domestic league
Average goals
favor
Total Avge
Gf Pt Played W D L Gf Ga
1 Man.City 30 10 10 0 0 38 6 3,80
2 FC Barcelona 27 9 9 0 0 31 6 3,44
3 R.Madrid 24 9 8 0 1 30 8 3,33
4 At.Madrid 28 10 9 1 0 33 6 3,30
5 Juventus 27 9 9 0 0 26 4 2,89
6 PSG 24 10 7 3 0 28 5 2,80
7 Liverpool 24 9 8 0 1 25 6 2,78
8 Borussia Mon. 25 9 8 1 0 25 7 2,78
9 R.Sociedad 20 9 6 2 1 23 7 2,56
10 B.Leverkusen 22 9 7 1 1 23 10 2,56
AVERAGE GOALS SCORED AT HOME: TOP 10
67
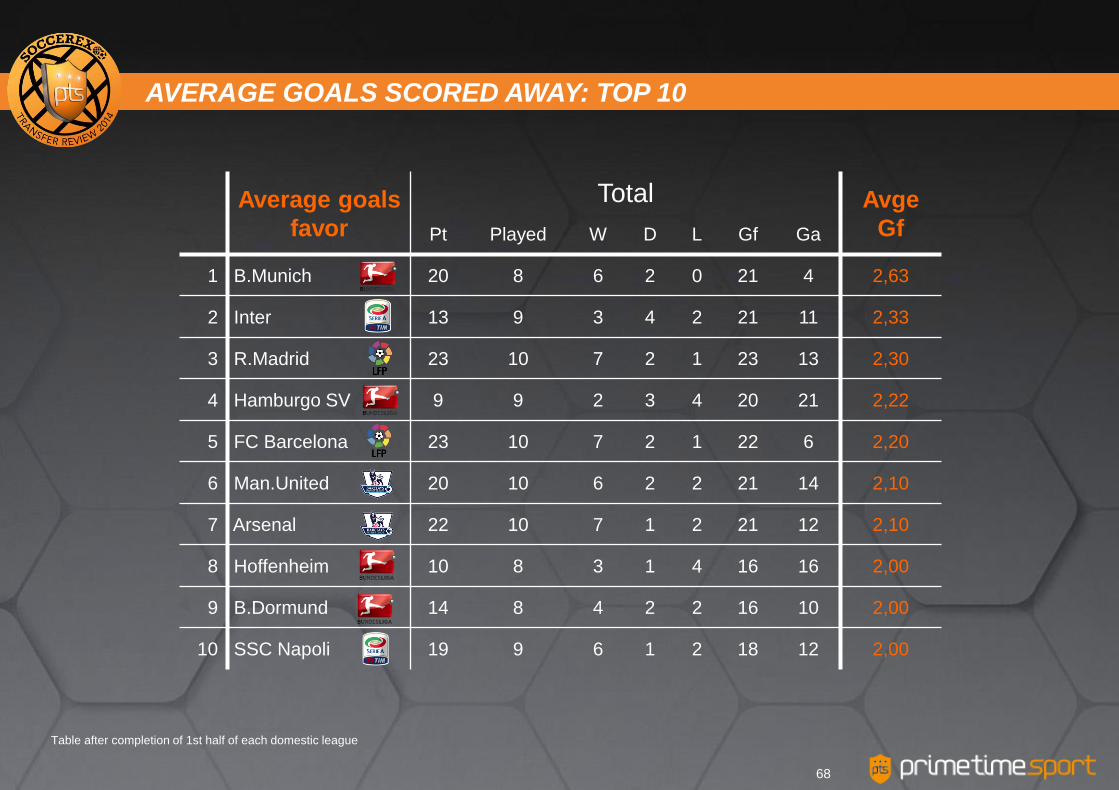
Table after completion of 1st half of each domestic league
Average goals
favor
Total Avge
Gf Pt Played W D L Gf Ga
1 B.Munich 20 8 6 2 0 21 4 2,63
2 Inter 13 9 3 4 2 21 11 2,33
3 R.Madrid 23 10 7 2 1 23 13 2,30
4 Hamburgo SV 9 9 2 3 4 20 21 2,22
5 FC Barcelona 23 10 7 2 1 22 6 2,20
6 Man.United 20 10 6 2 2 21 14 2,10
7 Arsenal 22 10 7 1 2 21 12 2,10
8 Hoffenheim 10 8 3 1 4 16 16 2,00
9 B.Dormund 14 8 4 2 2 16 10 2,00
10 SSC Napoli 19 9 6 1 2 18 12 2,00
AVERAGE GOALS SCORED AWAY: TOP 10
68
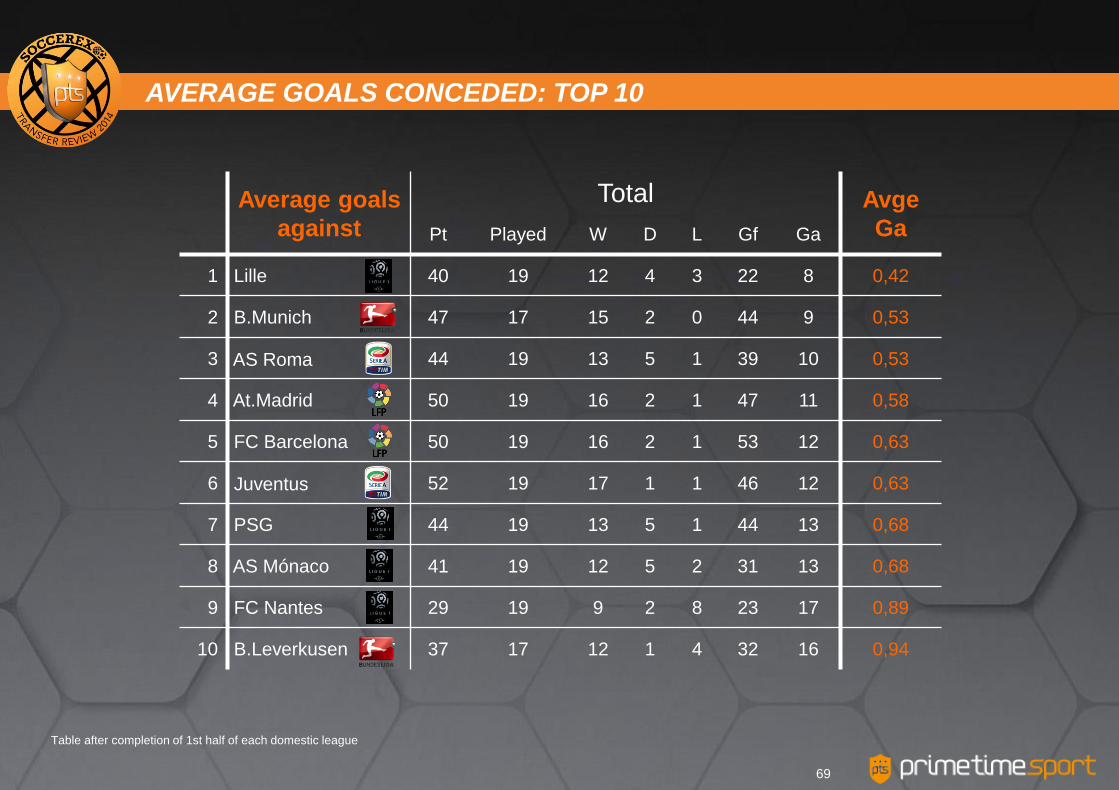
Table after completion of 1st half of each domestic league
Average goals
against
Total Avge
Ga Pt Played W D L Gf Ga
1 Lille 40 19 12 4 3 22 8 0,42
2 B.Munich 47 17 15 2 0 44 9 0,53
3 AS Roma 44 19 13 5 1 39 10 0,53
4 At.Madrid 50 19 16 2 1 47 11 0,58
5 FC Barcelona 50 19 16 2 1 53 12 0,63
6 Juventus 52 19 17 1 1 46 12 0,63
7 PSG 44 19 13 5 1 44 13 0,68
8 AS Mónaco 41 19 12 5 2 31 13 0,68
9 FC Nantes 29 19 9 2 8 23 17 0,89
10 B.Leverkusen 37 17 12 1 4 32 16 0,94
AVERAGE GOALS CONCEDED: TOP 10
69
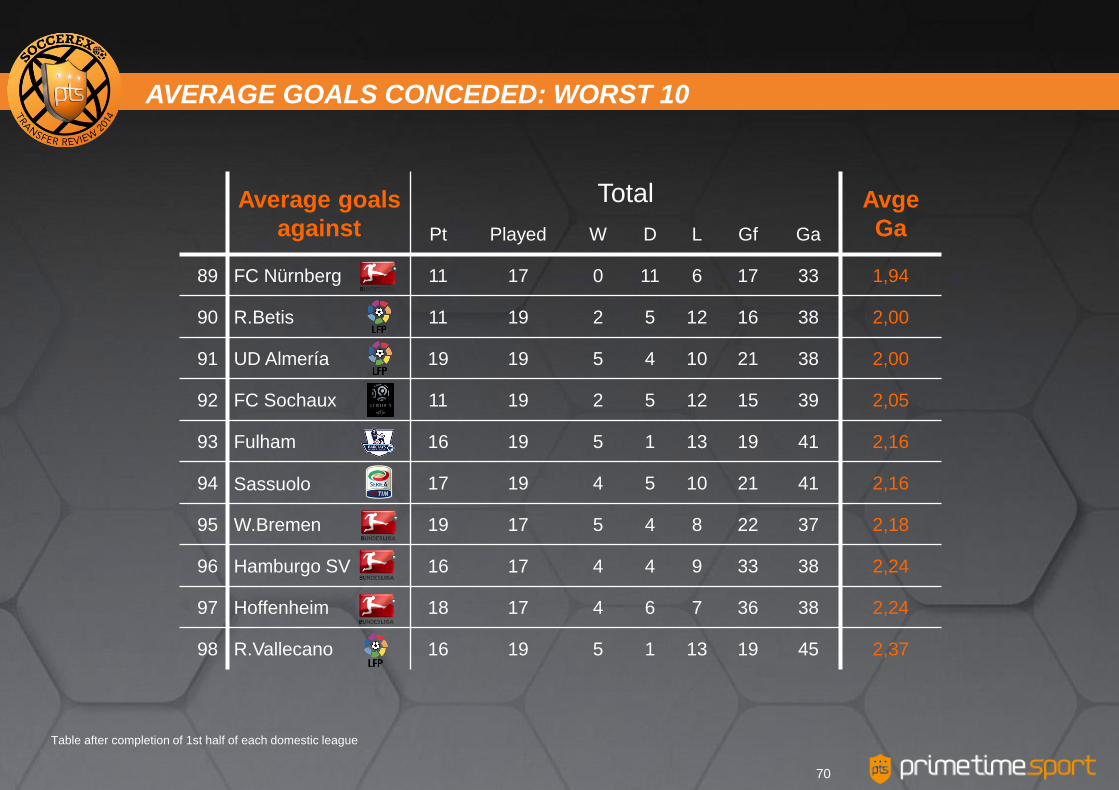
Table after completion of 1st half of each domestic league
Average goals
against
Total Avge
Ga Pt Played W D L Gf Ga
89 FC Nürnberg 11 17 0 11 6 17 33 1,94
90 R.Betis 11 19 2 5 12 16 38 2,00
91 UD Almería 19 19 5 4 10 21 38 2,00
92 FC Sochaux 11 19 2 5 12 15 39 2,05
93 Fulham 16 19 5 1 13 19 41 2,16
94 Sassuolo 17 19 4 5 10 21 41 2,16
95 W.Bremen 19 17 5 4 8 22 37 2,18
96 Hamburgo SV 16 17 4 4 9 33 38 2,24
97 Hoffenheim 18 17 4 6 7 36 38 2,24
98 R.Vallecano 16 19 5 1 13 19 45 2,37
AVERAGE GOALS CONCEDED: WORST 10
70
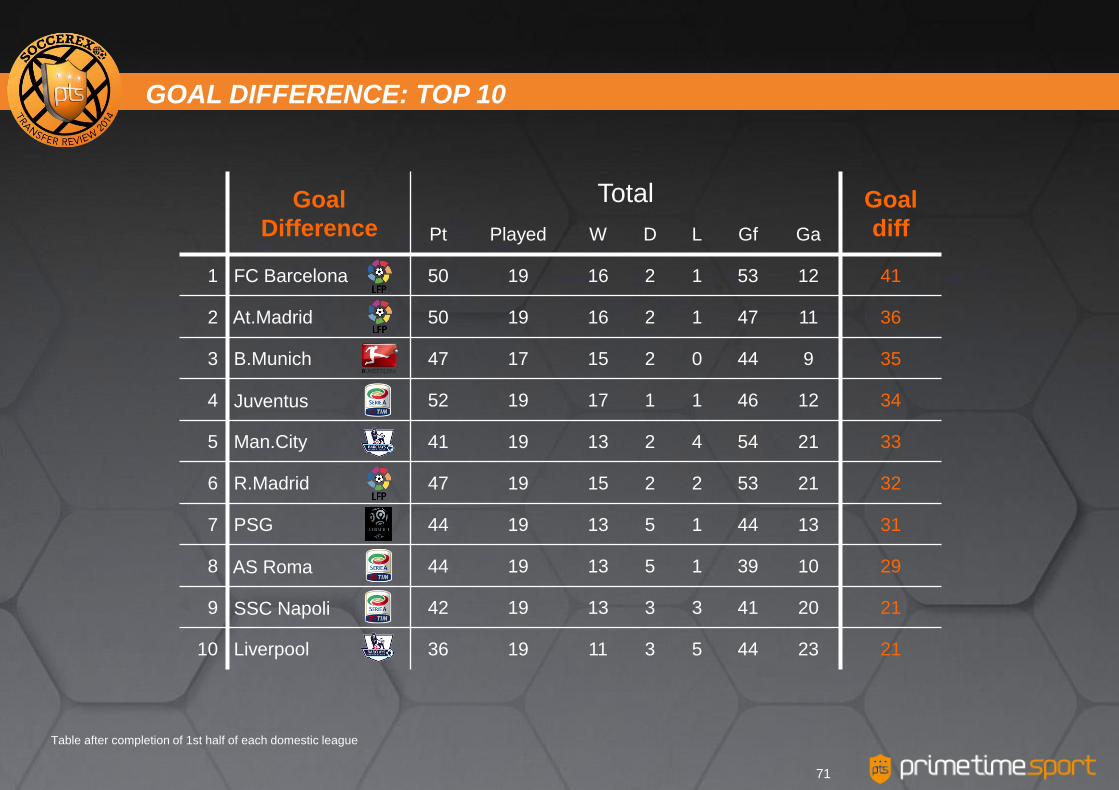
Table after completion of 1st half of each domestic league
Goal
Difference
Total Goal
diff Pt Played W D L Gf Ga
1 FC Barcelona 50 19 16 2 1 53 12 41
2 At.Madrid 50 19 16 2 1 47 11 36
3 B.Munich 47 17 15 2 0 44 9 35
4 Juventus 52 19 17 1 1 46 12 34
5 Man.City 41 19 13 2 4 54 21 33
6 R.Madrid 47 19 15 2 2 53 21 32
7 PSG 44 19 13 5 1 44 13 31
8 AS Roma 44 19 13 5 1 39 10 29
9 SSC Napoli 42 19 13 3 3 41 20 21
10 Liverpool 36 19 11 3 5 44 23 21
GOAL DIFFERENCE: TOP 10
71
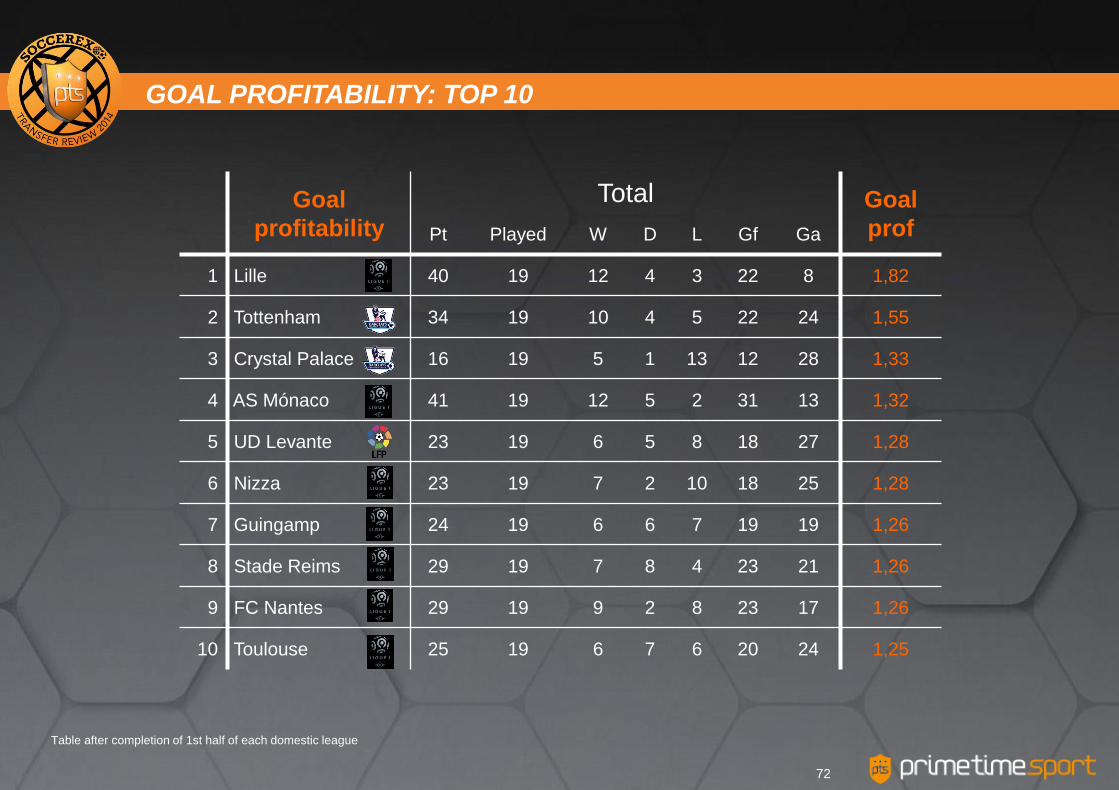
Table after completion of 1st half of each domestic league
Goal
profitability
Total Goal
prof Pt Played W D L Gf Ga
1 Lille 40 19 12 4 3 22 8 1,82
2 Tottenham 34 19 10 4 5 22 24 1,55
3 Crystal Palace 16 19 5 1 13 12 28 1,33
4 AS Mónaco 41 19 12 5 2 31 13 1,32
5 UD Levante 23 19 6 5 8 18 27 1,28
6 Nizza 23 19 7 2 10 18 25 1,28
7 Guingamp 24 19 6 6 7 19 19 1,26
8 Stade Reims 29 19 7 8 4 23 21 1,26
9 FC Nantes 29 19 9 2 8 23 17 1,26
10 Toulouse 25 19 6 7 6 20 24 1,25
GOAL PROFITABILITY: TOP 10
72
Goals / game
2010/11 2011/12 2009/10 2012/13
Average after completion of 1st half of each league
2013/14
2,77 2,64 2,57
2,86
2,43
3,14
2,78
2,35
2,70
2,32
2,86 2,61
2,49
2,83
2,55
2,90 2,85 2,74 2,82
2,58
3,20
2,91 2,76 2,68
2,41
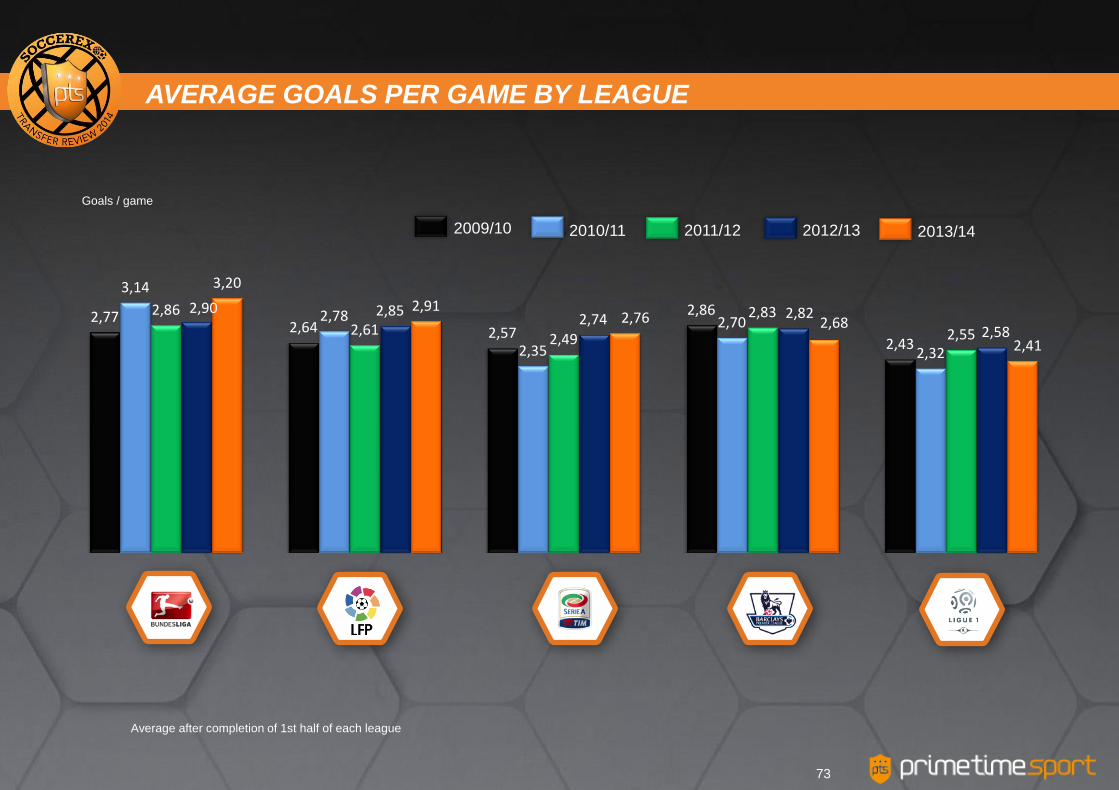
AVERAGE GOALS PER GAME BY LEAGUE
73
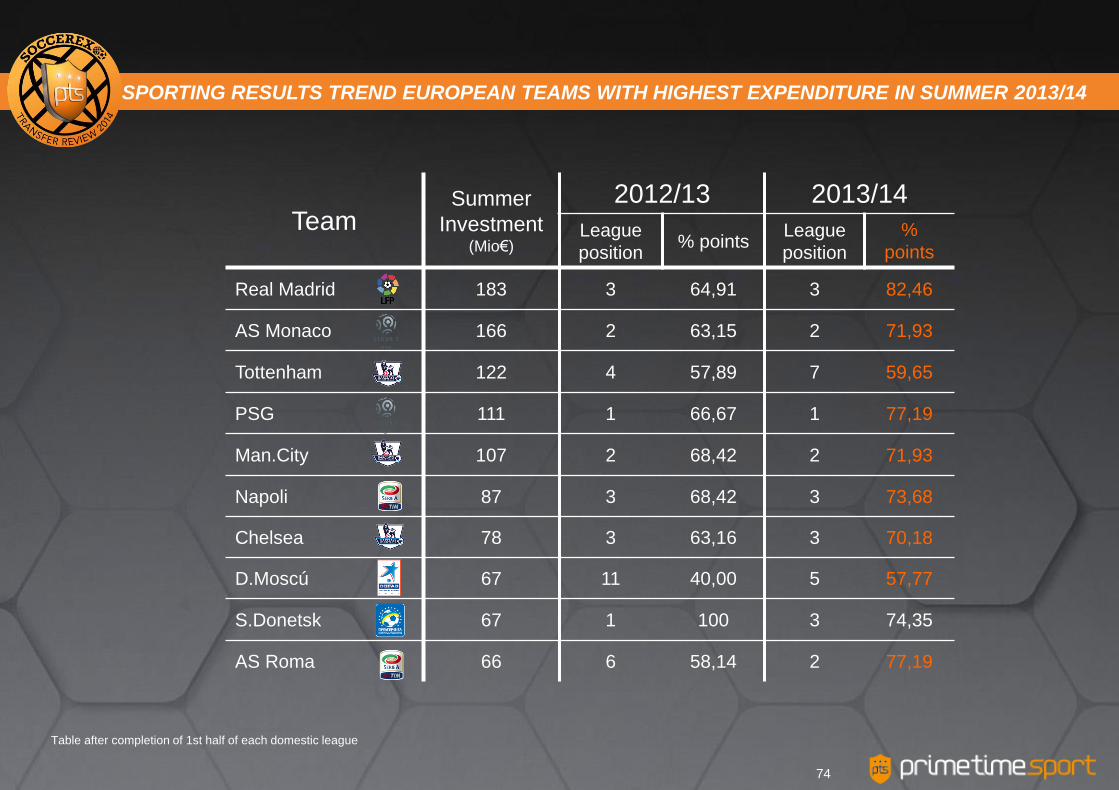
Table after completion of 1st half of each domestic league
Team Summer
Investment (Mio€)
2012/13 2013/14
League
position % points
League
position
%
points
Real Madrid 183 3 64,91 3 82,46
AS Monaco 166 2 63,15 2 71,93
Tottenham 122 4 57,89 7 59,65
PSG 111 1 66,67 1 77,19
Man.City 107 2 68,42 2 71,93
Napoli 87 3 68,42 3 73,68
Chelsea 78 3 63,16 3 70,18
D.Moscú 67 11 40,00 5 57,77
S.Donetsk 67 1 100 3 74,35
AS Roma 66 6 58,14 2 77,19
SPORTING RESULTS TREND EUROPEAN TEAMS WITH HIGHEST EXPENDITURE IN SUMMER 2013/14
74
Team Summer
Investment (Mio€)
2011/12 2012/13
League
position % points
League
position
%
points
Real Madrid 183 3 64,91 3 82,46
FC Barcelona 57 1 96,49 1 87,72
Sevilla FC 34 13 38,60 7 52,63
At.Madrid 33 2 77,19 2 87,72
Villarreal CF 16 7 50,79 5 59,65
At.Bilbao 15 14 36,84 4 63,16
Valencia CF 14 8 52,63 8 40,35
Granada CF 6 17 29,82 10 40,35
Celta Vigo 5 16 31,58 15 33,33
Real Betis 5 4 59,65 20 19,30
Performance during 1st half of La Liga
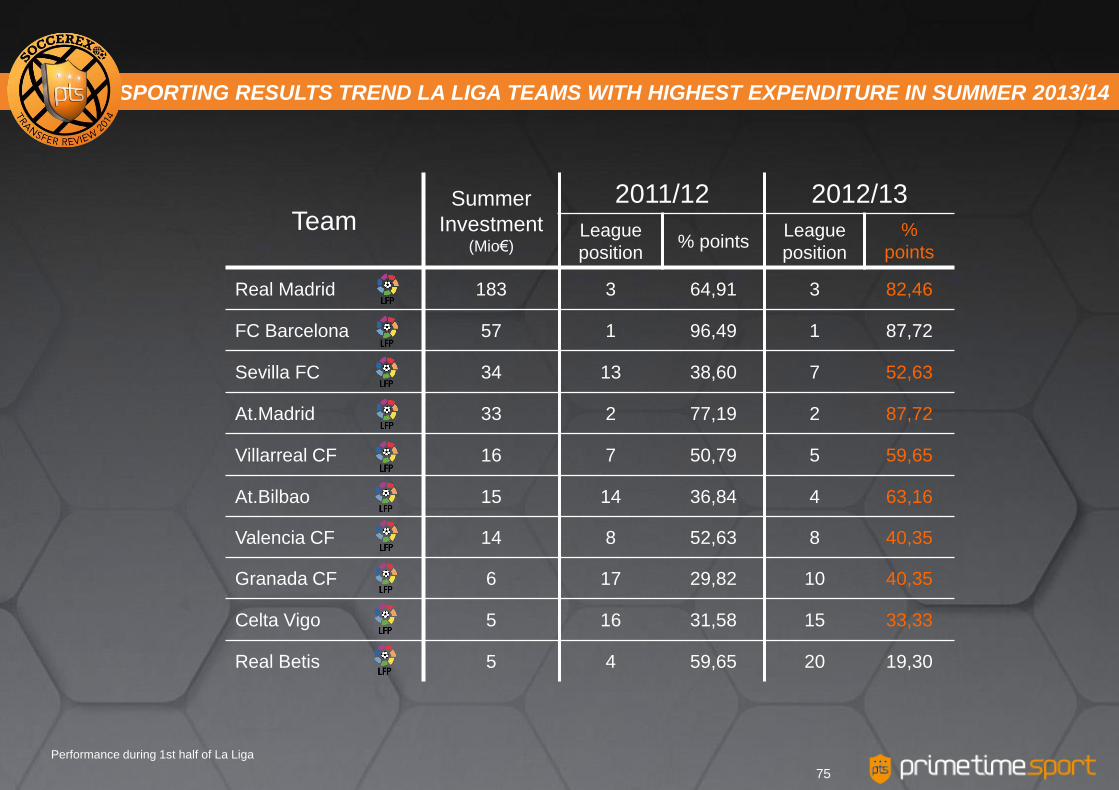
SPORTING RESULTS TREND LA LIGA TEAMS WITH HIGHEST EXPENDITURE IN SUMMER 2013/14
75
1. Top 5 European leagues combined
2. Top scorers and assists
SOCCEREX TRANSFER REVIEW 2014- WINTER WINDOW
76
Luis Suárez 19
Kun Agüero 13
Rémy 10
Sturridge 9
Rooney 9
Lukaku 9
Yaya Touré 9
Negredo 8
Jay Rodríguez 8
Ramsey 8
Giroud 8
Hazard 8
Lewandowski 11
A.Ramos 11
Mandzukic 10
Ibisevic 10
Aubameyang 9
Lasogga 9
Kießling 9
Raffael 9
Reus 8
Okazaki 8
Müller 8
Firmino 8
Kruse 8
Ibrahimovic 15
Cavani 12
Aboubakar 11
Falcao 9
Lacazette 9
Rivière 8
Gignac 8
Djordjevic 8
Gomis 7
Diabaté 7
Oliveira 7
Hamouma 7
Cvitanich 7
C.Ronaldo 20
Diego Costa 19
Griezman 12
Uche 11
Pedro 11
A.Sánchez 11
Javi Guerra 11
Bacca 9
Benzema 9
Messi 8
Gio 8
Jonas 8
Villa 8
Vela 8
Rakitic 8
Rossi 14
Berardi 11
Tévez 11
Palacio 10
Eder 9
Immobile 9
Higuaín 9
Toni 9
Cerci 9
Vidal 8
Callejón 8
Gilardino 8
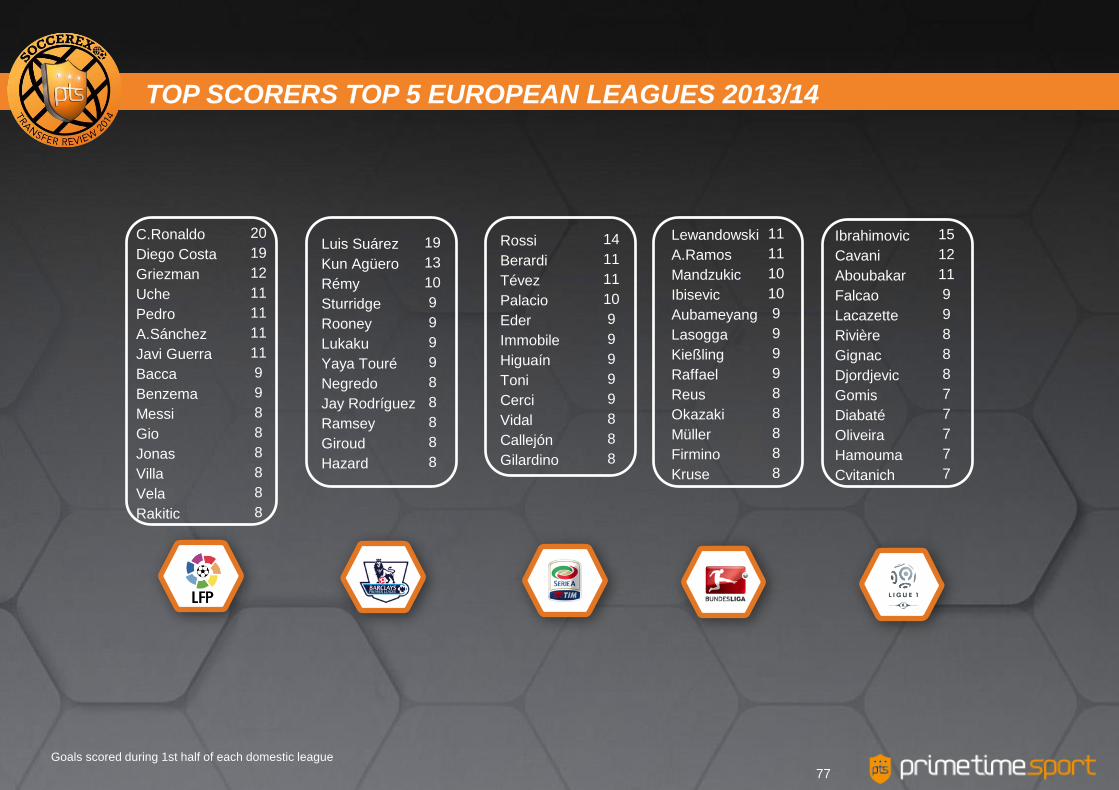
Goals scored during 1st half of each domestic league
TOP SCORERS TOP 5 EUROPEAN LEAGUES 2013/14
77

Goals scored during 1st half of each domestic league
66,2
79,2 83,9 85,8 85,8
92,7 95,5 99,4 99,9 100,6
Luis Suárez C.Ronaldo Diego Costa Uche Kun Agüero Pedro Berardi Rossi A.Sánchez Messi
Minutes x goal
TOP 10 PLAYERS BY GOAL EFFICACY
78
Goals scored during 1st half of each domestic league
Minutes x goal
80,2 88,7
92,5
71,2
81,6 82,5
63,1
72,6 79,1
59,0
78,9 79,7
66,2
79,2 83,9
Higuaín Messi Forlán Messi M.Gómez C.Ronaldo Higuaín C.Ronaldo Messi
2010/11 2011/12 2009/10
Messi
2012/13
Ibrahimovic Falcao
2013/14
C.Ronaldo L.Suárez D.Costa
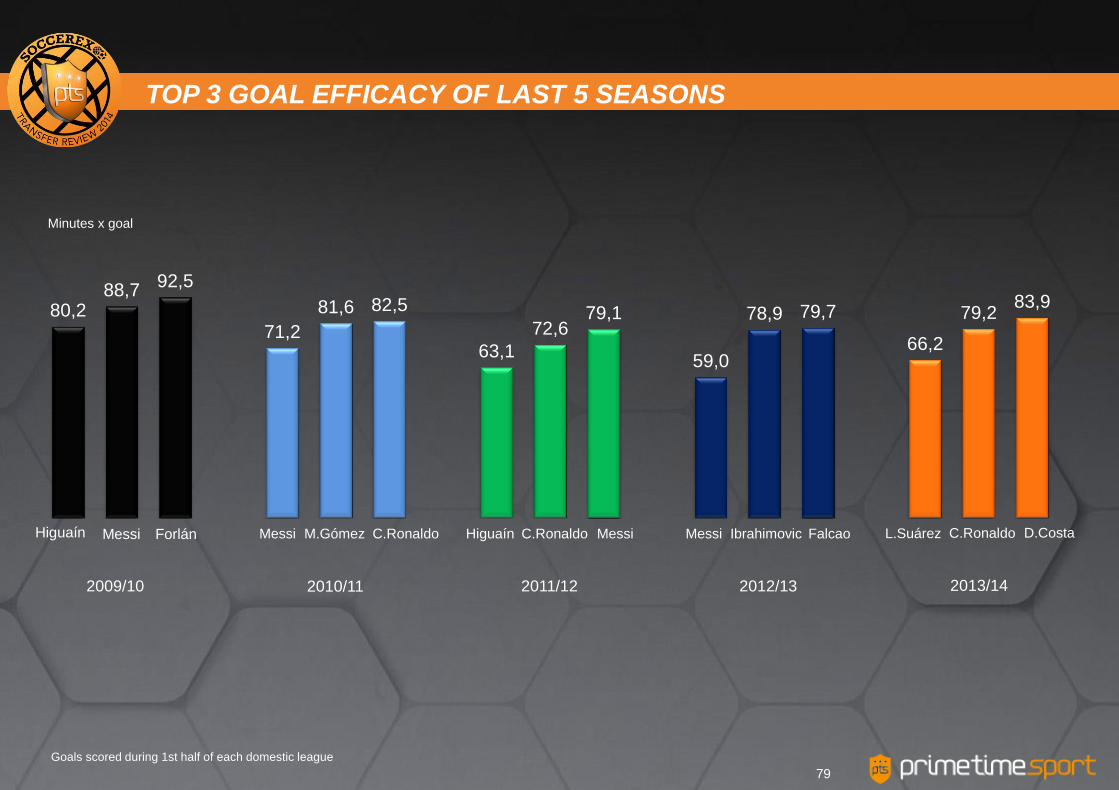
TOP 3 GOAL EFFICACY OF LAST 5 SEASONS
79
Rooney 8
Özil 7
Gerrard 6
Jesús Navas 6
Ramsey 6
Brunt 5
Giroud 5
Silva 5
Lallana 5
Lambert 5
Mirallas 5
Luis Suárez 5
Zabaleta 5
Ribéry 7
G.Castro 7
Firmino 6
Maxim 6
Mülller 6
Beister 5
Hermann 5
Reus 4
Sam 4
Schmid 4
Van der Vaart 4
J.Rodríguez 7
Ibrahimovic 6
Bedimo 5
Gourcuff 4
Lucas 4
Aurier 4
Ayité 4
Balmont 4
Grenier 4
Moutinho 4
Hamouma 4
Cesc 10
Koke 9
Neymar 8
Bale 7
Rakitic 7
Cani 6
Susaeta 6
Vela 6
Gio 6
Benzema 5
Bacca 5
Ebert 5
Gabi 5
R.Álvarez 7
Cerci 7
Totti 7
Borja Valero 7
Cigarini 6
Higuaín 6
Rómulo 6
Strootman 6
Toni 5
Robinho 5
Palacio 5
Tévez 5
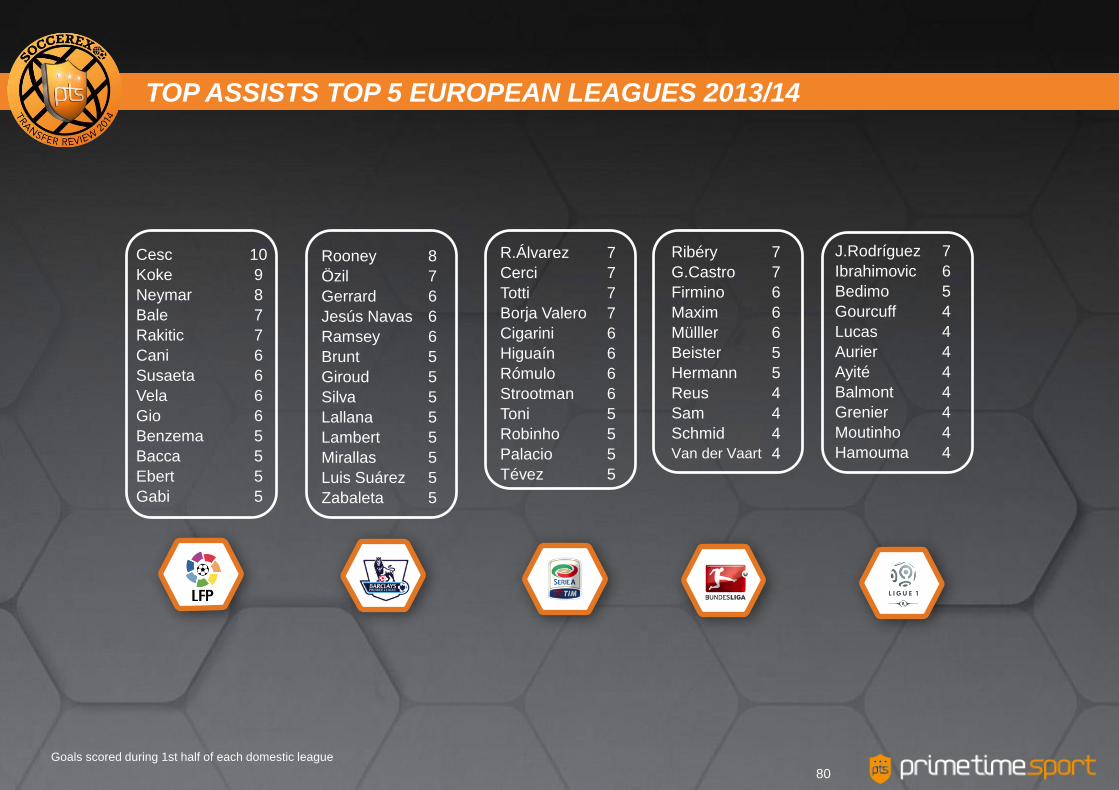
Goals scored during 1st half of each domestic league
TOP ASSISTS TOP 5 EUROPEAN LEAGUES 2013/14
80
SOCCEREX TRANSFER REVIEW 2014- WINTER WINDOW
81
1. Technical sheet
2. Winter 2014 transfer window: Premier League vs
other top European leagues
3. La Liga on going season review
4. European football table 2013/14
5. Case study: Impact of UEFA’s Financial Fair Play
6. Conclusions
7. Annexes
Mio€
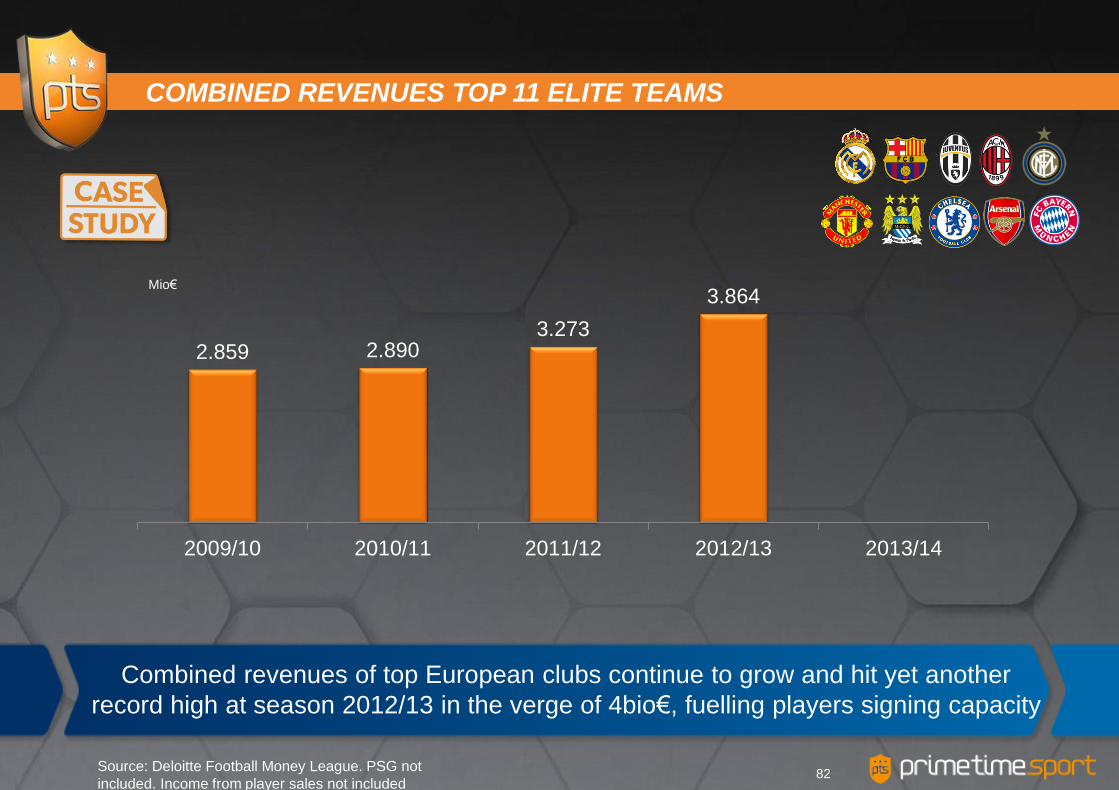
COMBINED REVENUES TOP 11 ELITE TEAMS
82 Source: Deloitte Football Money League. PSG not
included. Income from player sales not included
2.859 2.890 3.273
3.864
2009/10 2010/11 2011/12 2012/13 2013/14
Combined revenues of top European clubs continue to grow and hit yet another
record high at season 2012/13 in the verge of 4bio€, fuelling players signing capacity
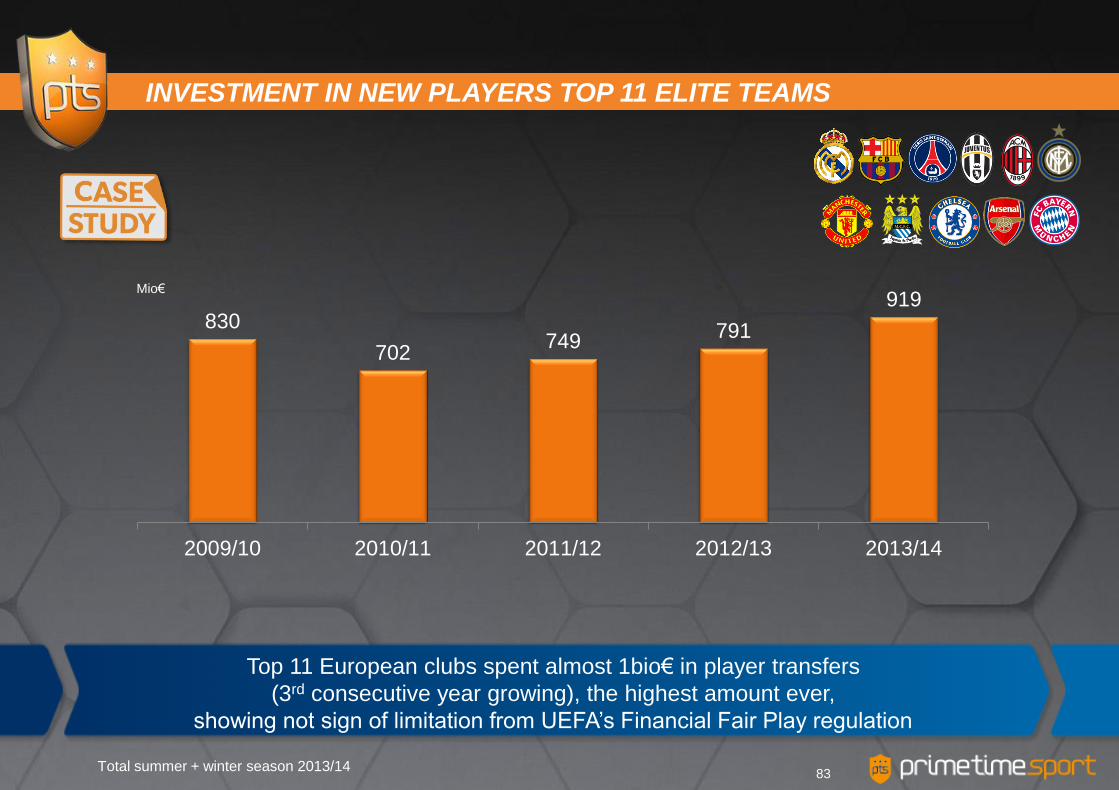
Mio€
INVESTMENT IN NEW PLAYERS TOP 11 ELITE TEAMS
83
830
702 749
791
919
2009/10 2010/11 2011/12 2012/13 2013/14
Top 11 European clubs spent almost 1bio€ in player transfers
(3rd consecutive year growing), the highest amount ever,
showing not sign of limitation from UEFA’s Financial Fair Play regulation
Total summer + winter season 2013/14
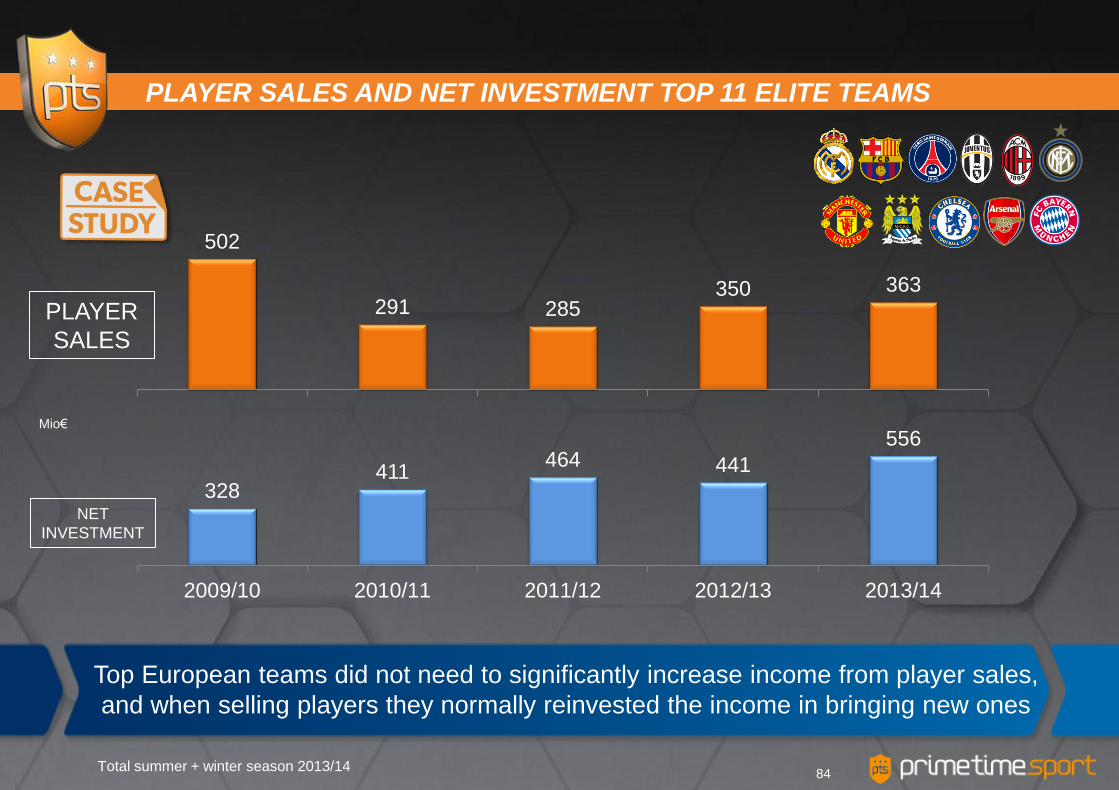
Mio€
84
502
291 285 350 363
328 411
464 441
556
2009/10 2010/11 2011/12 2012/13 2013/14
PLAYER SALES AND NET INVESTMENT TOP 11 ELITE TEAMS
PLAYER
SALES
NET
INVESTMENT
Top European teams did not need to significantly increase income from player sales,
and when selling players they normally reinvested the income in bringing new ones
Total summer + winter season 2013/14
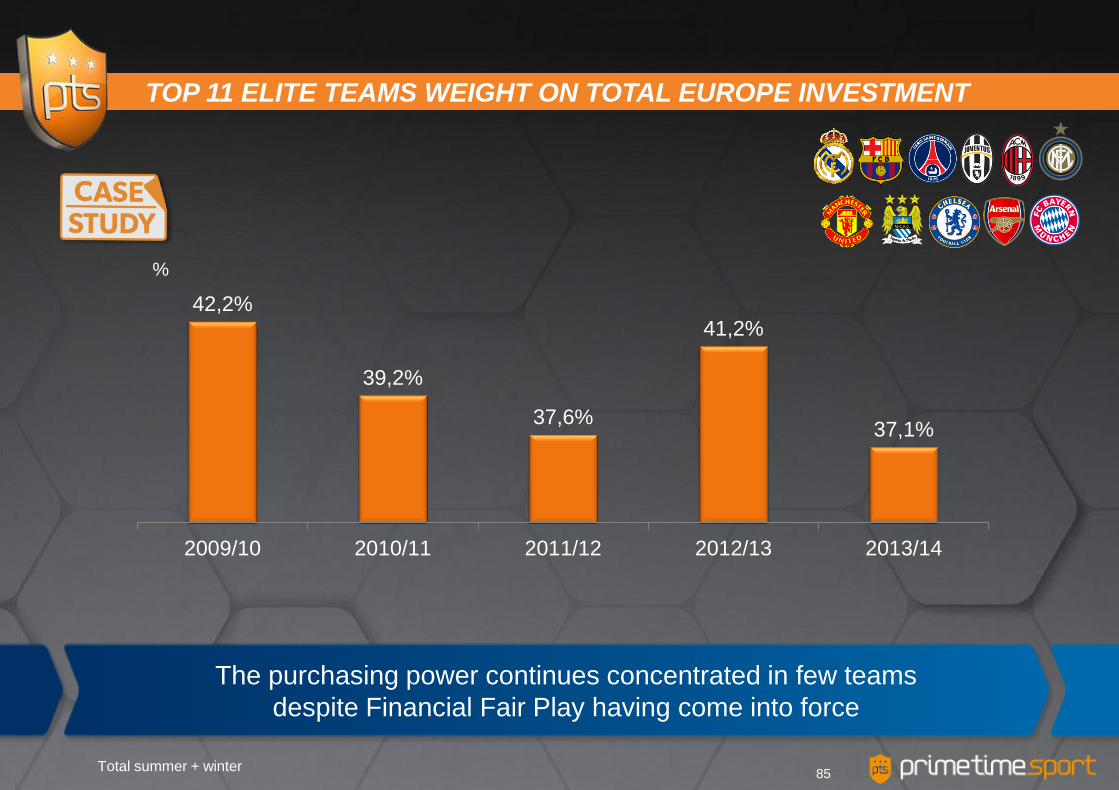
%
TOP 11 ELITE TEAMS WEIGHT ON TOTAL EUROPE INVESTMENT
85
42,2%
39,2%
37,6%
41,2%
37,1%
2009/10 2010/11 2011/12 2012/13 2013/14
The purchasing power continues concentrated in few teams
despite Financial Fair Play having come into force
Total summer + winter
SOCCEREX TRANSFER REVIEW 2014- WINTER WINDOW
86
1. Technical sheet
2. Winter 2014 transfer window: Premier League vs
other top European leagues
3. La Liga on going season review
4. European football table 2013/14
5. Case study: Impact of UEFA’s Financial Fair Play
6. Conclusions
7. Annexes

At the second season of the coming into force of UEFA’s Financial Fair Play we can
not conclude yet it has helped to reduce the gap between richest and poorest clubs
European teams have invested a total of 290mio€ in player transfers at winter
window, down 4,3% vs previous season. Investment has now been stable for 3
consecutive years. Winter transfer window continues to be a complement to
investment taking place in the summer. This January it represented only 13,5% of
amount spent in summer 2012
Combined investment of summer (the main driver) and winter in top 5 European
leagues was in excess of 2,4bio€, up 32% vs last season and record high ever.
English Premier League lead once again investment in Europe -52% of the total,
the highest ever- followed by French League 1. Spending at Italian Serie A dropped
54% while La Liga continues at the bottom for one more year
Investment by Premier League sides was the highest ever and approaches 1bio€,
as a result of yet another increase in TV revenues. For second year in a row,
Spanish La Liga is the fourth European league in terms of total investment
(summer plus winter) in signings
CONCLUSIONS STR 2014- WINTER (1 OF 4)
87
Premier League has the smallest concentration as top 2 teams (Chelsea & Tottenham) account for
28,7% of total and top 4 for 49,8% (+ManCity and ManU). On the opposite side, Ligue 1 (PSG and
Monaco make 73,2%) and La Liga (Real Madrid and FCB 61,2%) are the most polarized
tournaments
Total number of sign-ups in Europe was down 14% to 257. For the 5th season in a row, Italian Serie
A registered the highest number of signings (95). Loans and free transfers continue to represent a
significant portion of the transactions. For the 5th consecutive season, all leagues have
experimented a net decrease in the number of players, as teams are reducing players payroll.
Premier League had the highest net decrease, which has been growing for 4 consecutive years
Sale of Mata to ManU helped Chelsea top again a spending table after signing Matic, Zouma &
Salah, closely followed by ManU. No Spanish nor German teams in the top 10
7 top European teams (AC Milan, Arsenal, Real Madrid, Juventus, ManCity, Bayern and FC
Barcelona) did not spent any cash on transfer fees. For ManCity, Bayern and FC Barcelona it was
for the 3rd consecutive winter transfer window. Chelsea is the main protagonist of winter window,
topping both spending and sales tables. Another Premier League side –Newcastle- and Benfica
follow after selling Cabaye and Matic.
Besides Chelsea, the only top club with sales activity was FC Barcelona (Sanabria to Italian side
Sassuolo).
CONCLUSIONS STR 2014- WINTER (2 OF 4)
88
New signings table was dominated by Serie A sides. Fulham, Cardiff City and Valencia, the
only non Italian sides in the top 10 wit 7, 6 and 5 new players respectively. On top of Italian
sides, Chelsea (13), ManU (12) and Crystal Palace (12) were among the sides releasing
the highest number of players in Europa
Juan Mata signing by ManU for 45mio€ was the most expensive of the winter, followed by
Matic and Cabaye (both 25 mi€). 5 of 10 most expensive moves had Chelsea involved,
either selling or buying . Mata, Matic and Cabaye join historical top 10 of most expensive
transfers in a winter window, which is still topped by Fernando Torres move to Chelsea for
58,5mio€. 8 out of 10 most expensive winter signings ever, conducted by Premier League
sides
Real Madrid was the side with highest combined investment (summer + winter) of season
2013/14 with 182mio€, even if not spending in winter, followed by Monaco (178), PSG
(136), Chelsea (131) and Tottenham (122). ManCity, Napoli, AS Roma, Dinamo Moscow
and Shaktar complete top 10.
CONCLUSIONS STR 2014- WINTER (3 OF 4)
89
La Liga teams invested 12mio€ in new players in January, in line with previous
season. The amount is one of the lowest of last 15 seasons and keeps Spanish
league at the bottom in Europe. The main portion of investment of the season was
conducted in the summer. As a result, investment in January represented only 3%
of the summer expenditure at La Liga
Driven by the signings of Bale (Real Madrid) and Neymar (FC Barcelona),
combined investment (summer+winter) in La Liga grew again and was the second
highest of the last 6 years (400mio€, of which 60% by Real and Barça). Even with
the impact of winter investment growth, season 2012/13 will have seen a 62%
decline (to 140mio€) in La Liga new players total expenditure, the lowest among
top European leagues and of the last 5 years
Only 5 out of 20 La Liga teams signed players this winter paying a transfer fee. The
other 15 teams have not paid any transfer fees for 3 years in a row
Atletico Madrid gets confirmed as the driving force of winter transfer window at La
Liga, with a total investment of 24mio€ in 5 years. Real Madrid and FC Barcelona
rarely make any investments in January
CONCLUSIONS STR 2014- WINTER (3 OF 4)
90
Canales (Real Sociedad; 3,5mio€) and Araujo (Valencia; 3,5mio€) were the most
expensive signings at la Liga transfer window. Top 10 most ranking of most
expensive winter signings ever remains unchanged for second year in a row
La Liga sides collected 10,6mio€ from player sales in January, offsetting most of
the expenditure and resulting in just 1mio€ of net investment. FC Barcelona toped
the list of revenues from players transfers after selling youngster Toni Sanabria to
Sassuolo for 4,5mio€. Valencia (3,5mio€) and Villarreal (2,5) were the only other
sides that collected money from player sales
A total of 38 players were signed by La Liga sides in January, down from 44 last
season. Loans and free transfers are still very popular and represented almost half
of the moves. Just like it happened at the other top European leagues, La Liga
teams took advantage of winter transfer window to reduce the number of players in
their squads
Valencia was the most active La Liga team in January, bringing 5 new players and
releasing 6. Real Madrid, FC Barcelona, Sevilla, Espanyol and Ath Bilbao did not
sign any new players. Sevilla was the team that most reduced players in squad, by
releasing 7 players and not bringing anyone. Neither Real Madrid nor FC
Barcelona released any first squad players
CONCLUSIONS STR 2014- WINTER (4 OF 4)
91
Participation of players signed last summer has grown 3% to 42%. New players
having participated in more than half of total minutes has never reached 50%. FC
Barcelona (Neymar), Celta, Osasuna and Getafe are the teams that have taken
best advantage of summer player signings. On the other extreme, Betis, Espanyol,
Atlético and Real Sociedad
Fernandinho has become the most profitable player from top 10 most expensive of
last summer. Higüain and Özil also among most profitable. On the opposite side,
Willian and Illarramendi. Despite not being yet among undisputable first elven in
their team, Isco and Neymar played 70% and 65% of minutes respectively. Atlético
signings virtually not used
Musacchio, Gaspar and Trujillo (Almería) are the only La Liga players that played
100% of the minutes. Respective injuries provoked that for the first time neither
Cristiano Ronaldo nor Messi are among the most used players of La Liga
Atlético de Madrid is the team with most stable line-up: 9 of its players have
participated in more than 70% of the minutes (on the other side Valencia and Betis
with just 4). Real Madrid and FC Barcelona have 7 and 6 key players respectively
(same as last season)
SUMMARY: ON GOING SEASON REVIEW
92
Betis from Sevilla is for 3rd consecutive year the team that has fielded most
different players so far (27). On the other side, Celta fielded 20 different players
only. Athletic de Bilbao (20) is well ahead in terms of usage of home grown players.
Real Sociedad (16) and FC Barcelona a (15) complete top 3 positions for the third
year in a row. On the other side, Granada did not field any home grown player for
2 consecutive seasons
Betis from Sevilla is for 3rd consecutive year the team that has fielded most
different players so far (27). On the other side, Celta fielded 20 different players
only
Athletic de Bilbao (18) is again ahead in terms of usage of home grown players.
Real Sociedad (17) and FC Barcelona a (16) complete top 3 positions for the third
year in a row. On the other side, Granada and Getafe have only used 2 and 1
respectively
FC Barcelona is again well ahead other European teams in terms of home grown
players utilization (among those in the top 3 positions of their leagues). Real Madrid
reaches top 3 with 8 home grown players used (7 at 12/13 and 4 at 11/12)
SUMMARY: ON GOING SEASON REVIEW
93
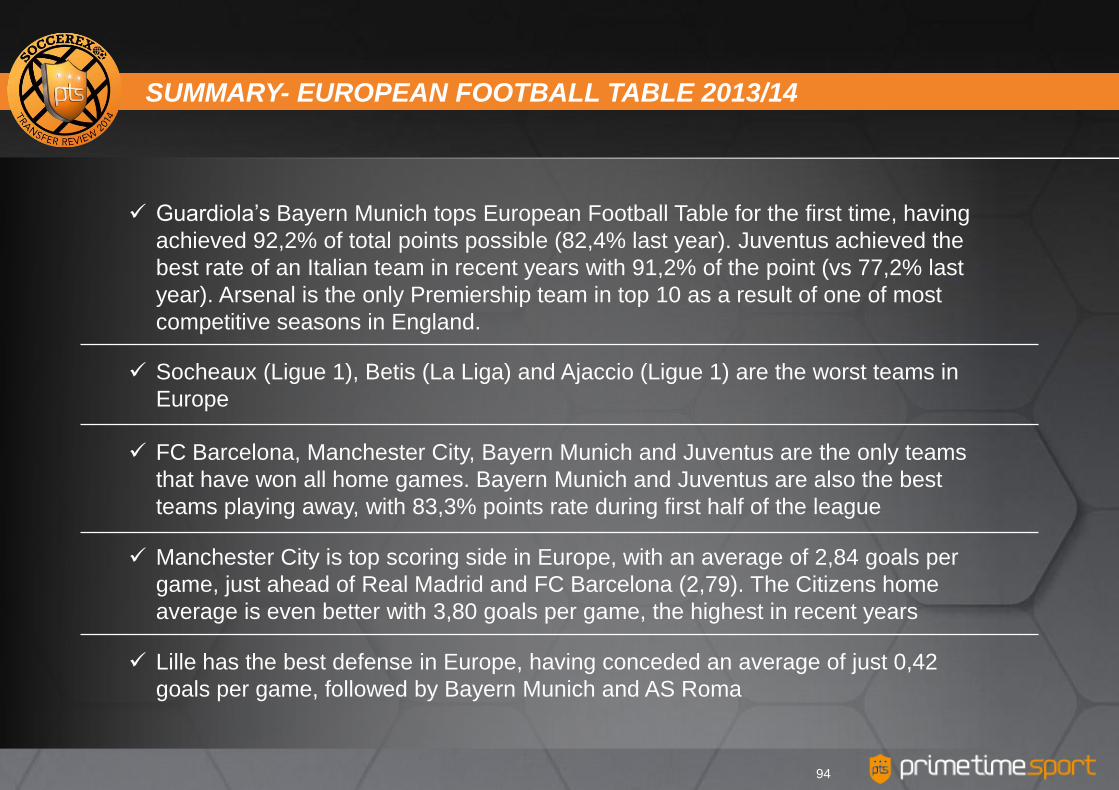
Guardiola’s Bayern Munich tops European Football Table for the first time, having
achieved 92,2% of total points possible (82,4% last year). Juventus achieved the
best rate of an Italian team in recent years with 91,2% of the point (vs 77,2% last
year). Arsenal is the only Premiership team in top 10 as a result of one of most
competitive seasons in England.
Socheaux (Ligue 1), Betis (La Liga) and Ajaccio (Ligue 1) are the worst teams in
Europe
FC Barcelona, Manchester City, Bayern Munich and Juventus are the only teams
that have won all home games. Bayern Munich and Juventus are also the best
teams playing away, with 83,3% points rate during first half of the league
Manchester City is top scoring side in Europe, with an average of 2,84 goals per
game, just ahead of Real Madrid and FC Barcelona (2,79). The Citizens home
average is even better with 3,80 goals per game, the highest in recent years
Lille has the best defense in Europe, having conceded an average of just 0,42
goals per game, followed by Bayern Munich and AS Roma
SUMMARY- EUROPEAN FOOTBALL TABLE 2013/14
94
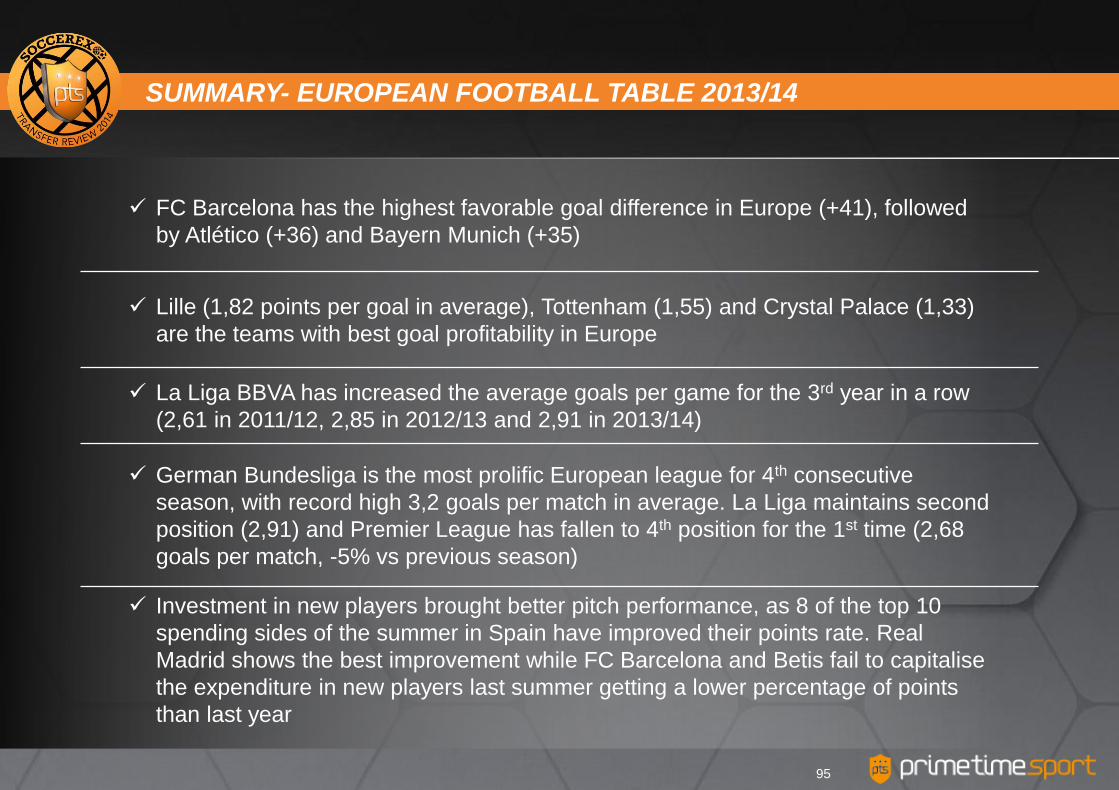
FC Barcelona has the highest favorable goal difference in Europe (+41), followed
by Atlético (+36) and Bayern Munich (+35)
Lille (1,82 points per goal in average), Tottenham (1,55) and Crystal Palace (1,33)
are the teams with best goal profitability in Europe
La Liga BBVA has increased the average goals per game for the 3rd year in a row
(2,61 in 2011/12, 2,85 in 2012/13 and 2,91 in 2013/14)
German Bundesliga is the most prolific European league for 4th consecutive
season, with record high 3,2 goals per match in average. La Liga maintains second
position (2,91) and Premier League has fallen to 4th position for the 1st time (2,68
goals per match, -5% vs previous season)
Investment in new players brought better pitch performance, as 8 of the top 10
spending sides of the summer in Spain have improved their points rate. Real
Madrid shows the best improvement while FC Barcelona and Betis fail to capitalise
the expenditure in new players last summer getting a lower percentage of points
than last year
95
SUMMARY- EUROPEAN FOOTBALL TABLE 2013/14
Cristiano Ronaldo is the best striker in Europe with 20 goals, followed by Diego
Costa and Luis Suárez (19 each). The Uruguayan achieved the best goals efficacy
in Europe by scoring a goal every 66 minutes, close to record rate by Messi at
season 2012/13 (scoring every 59 minutes)
Cesc Fàbregas is the best in Europe in terms of assists, with 10 in total, ahead of
Atlético’s Koke (9), Wayne Rooney (8) and Neymar (8)
96
SUMMARY- EUROPEAN FOOTBALL TABLE 2013/14

SOCCEREX TRANSFER REVIEW 2014- WINTER WINDOW
97
1. Technical sheet
2. Winter 2014 transfer window: Premier League vs
other top European leagues
3. La Liga on going season review
4. European football table 2013/14
5. Case study: Impact of UEFA’s Financial Fair Play
6. Conclusions
7. Annexes

1. Tables
2. About Prime Time Sport
ANNEXES
98
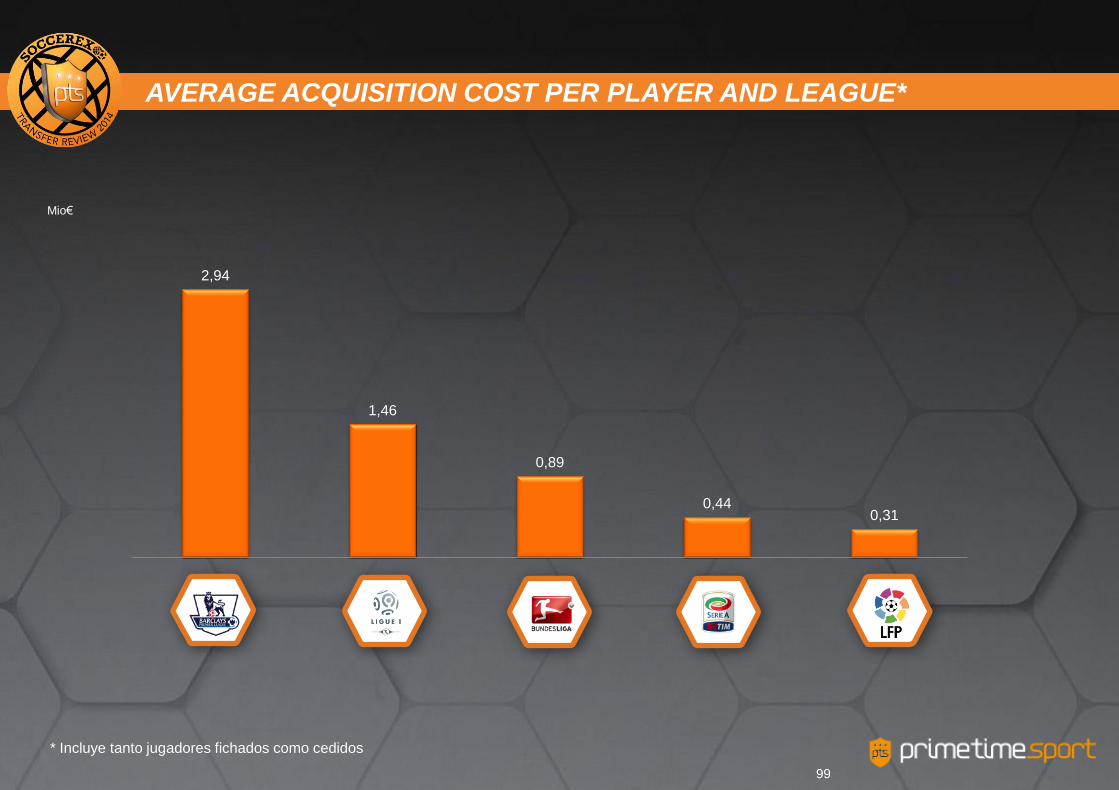
* Incluye tanto jugadores fichados como cedidos
2,94
1,46
0,89
0,44 0,31
Mio€
AVERAGE ACQUISITION COST PER PLAYER AND LEAGUE*
99
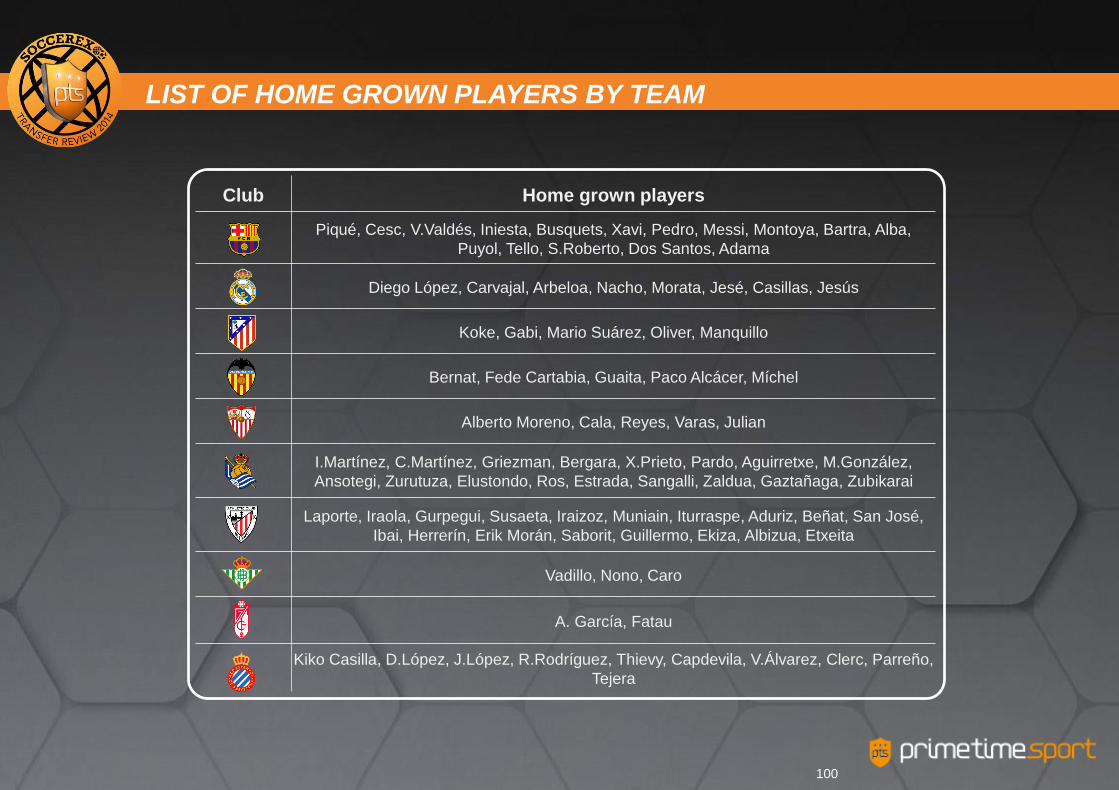
Club Home grown players
Piqué, Cesc, V.Valdés, Iniesta, Busquets, Xavi, Pedro, Messi, Montoya, Bartra, Alba,
Puyol, Tello, S.Roberto, Dos Santos, Adama
Diego López, Carvajal, Arbeloa, Nacho, Morata, Jesé, Casillas, Jesús
Koke, Gabi, Mario Suárez, Oliver, Manquillo
Bernat, Fede Cartabia, Guaita, Paco Alcácer, Míchel
Alberto Moreno, Cala, Reyes, Varas, Julian
I.Martínez, C.Martínez, Griezman, Bergara, X.Prieto, Pardo, Aguirretxe, M.González,
Ansotegi, Zurutuza, Elustondo, Ros, Estrada, Sangalli, Zaldua, Gaztañaga, Zubikarai
Laporte, Iraola, Gurpegui, Susaeta, Iraizoz, Muniain, Iturraspe, Aduriz, Beñat, San José,
Ibai, Herrerín, Erik Morán, Saborit, Guillermo, Ekiza, Albizua, Etxeita
Vadillo, Nono, Caro
A. García, Fatau
Kiko Casilla, D.López, J.López, R.Rodríguez, Thievy, Capdevila, V.Álvarez, Clerc, Parreño,
Tejera
LIST OF HOME GROWN PLAYERS BY TEAM
100

Club Home grown players
Gaspar, Bruno Soriano, Costa, Trigueros, Iñiguez, Moises, Matías, Juan Carlos
Gámez, Portillo, Samuel, Olinga, Juanmi
Arroyo
Yoel, Hugo Mallo, Oubiña, Álex López, David Costas, Mina, Jonny, Madinda, Vila
Torres, Puñal, Oier, Loé, Manuel, Flaño, José Garcia, Echaide, Eneko
Charlie, C.Herrera, Álvaro
Juanfran, Rubén, Rodas, Camarasa, Angel, Jason
Lass, Perea, Embarba, Ramiro
Rueda, Baraja, Zubi
Trujillo, Azeez, Zongo, Kim
LIST OF HOME GROWN PLAYERS BY TEAM
101
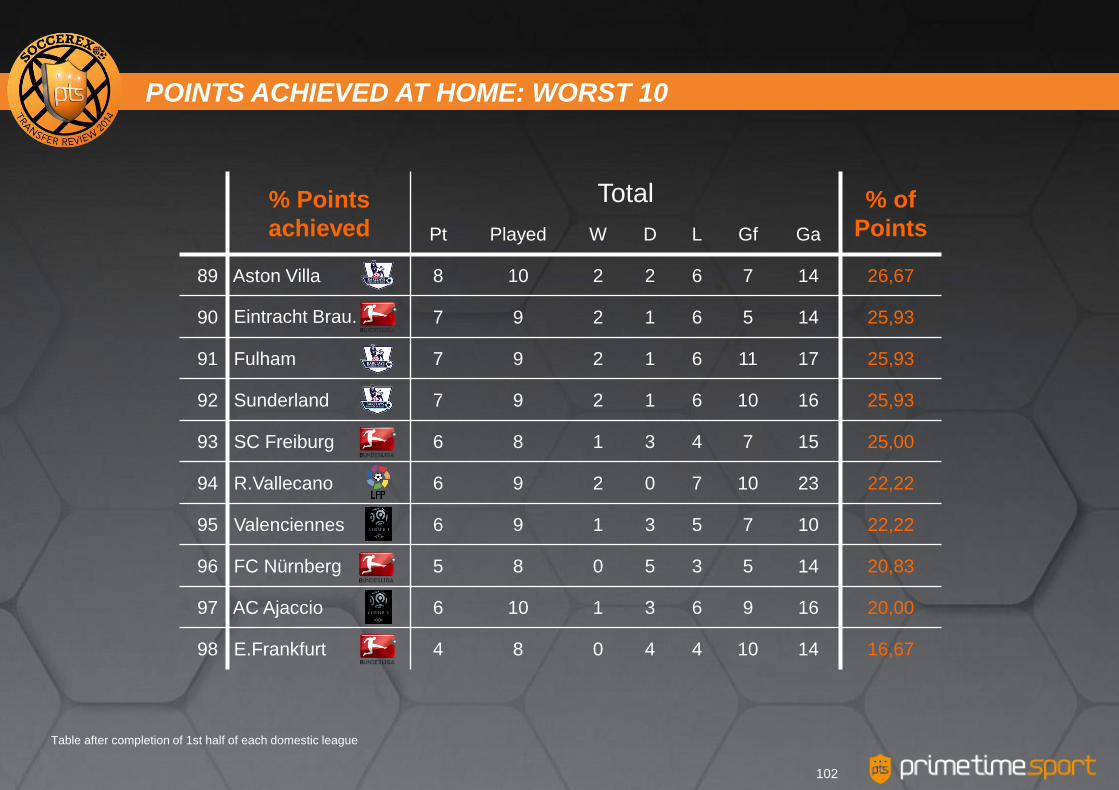
Table after completion of 1st half of each domestic league
% Points
achieved
Total % of
Points Pt Played W D L Gf Ga
89 Aston Villa 8 10 2 2 6 7 14 26,67
90 Eintracht Brau. 7 9 2 1 6 5 14 25,93
91 Fulham 7 9 2 1 6 11 17 25,93
92 Sunderland 7 9 2 1 6 10 16 25,93
93 SC Freiburg 6 8 1 3 4 7 15 25,00
94 R.Vallecano 6 9 2 0 7 10 23 22,22
95 Valenciennes 6 9 1 3 5 7 10 22,22
96 FC Nürnberg 5 8 0 5 3 5 14 20,83
97 AC Ajaccio 6 10 1 3 6 9 16 20,00
98 E.Frankfurt 4 8 0 4 4 10 14 16,67
POINTS ACHIEVED AT HOME: WORST 10
102
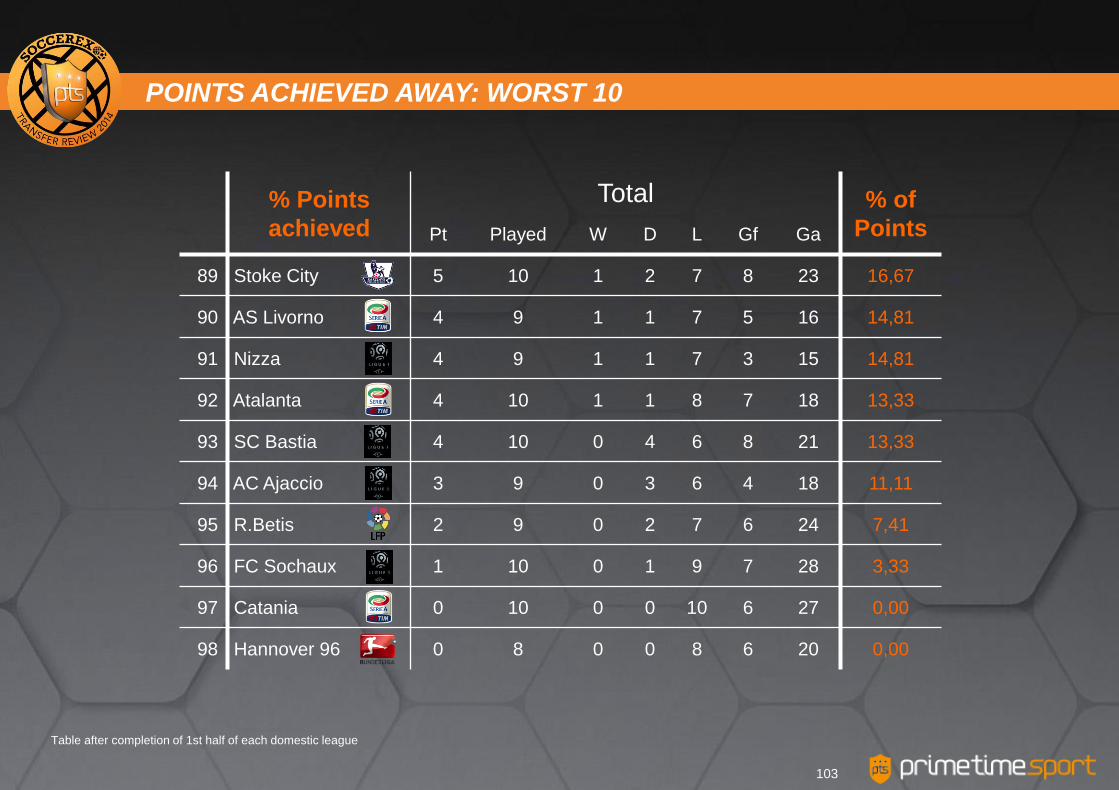
Table after completion of 1st half of each domestic league
% Points
achieved
Total % of
Points Pt Played W D L Gf Ga
89 Stoke City 5 10 1 2 7 8 23 16,67
90 AS Livorno 4 9 1 1 7 5 16 14,81
91 Nizza 4 9 1 1 7 3 15 14,81
92 Atalanta 4 10 1 1 8 7 18 13,33
93 SC Bastia 4 10 0 4 6 8 21 13,33
94 AC Ajaccio 3 9 0 3 6 4 18 11,11
95 R.Betis 2 9 0 2 7 6 24 7,41
96 FC Sochaux 1 10 0 1 9 7 28 3,33
97 Catania 0 10 0 0 10 6 27 0,00
98 Hannover 96 0 8 0 0 8 6 20 0,00
POINTS ACHIEVED AWAY: WORST 10
103
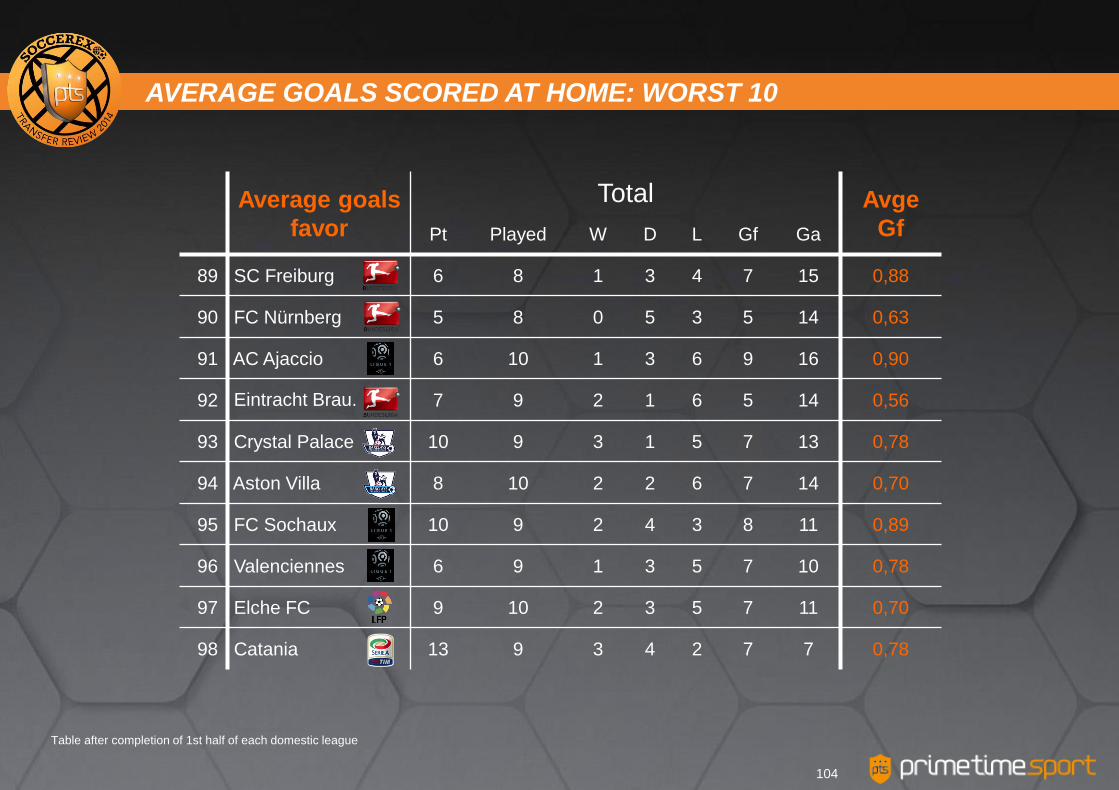
Table after completion of 1st half of each domestic league
Average goals
favor
Total Avge
Gf Pt Played W D L Gf Ga
89 SC Freiburg 6 8 1 3 4 7 15 0,88
90 FC Nürnberg 5 8 0 5 3 5 14 0,63
91 AC Ajaccio 6 10 1 3 6 9 16 0,90
92 Eintracht Brau. 7 9 2 1 6 5 14 0,56
93 Crystal Palace 10 9 3 1 5 7 13 0,78
94 Aston Villa 8 10 2 2 6 7 14 0,70
95 FC Sochaux 10 9 2 4 3 8 11 0,89
96 Valenciennes 6 9 1 3 5 7 10 0,78
97 Elche FC 9 10 2 3 5 7 11 0,70
98 Catania 13 9 3 4 2 7 7 0,78
AVERAGE GOALS SCORED AT HOME: WORST 10
104
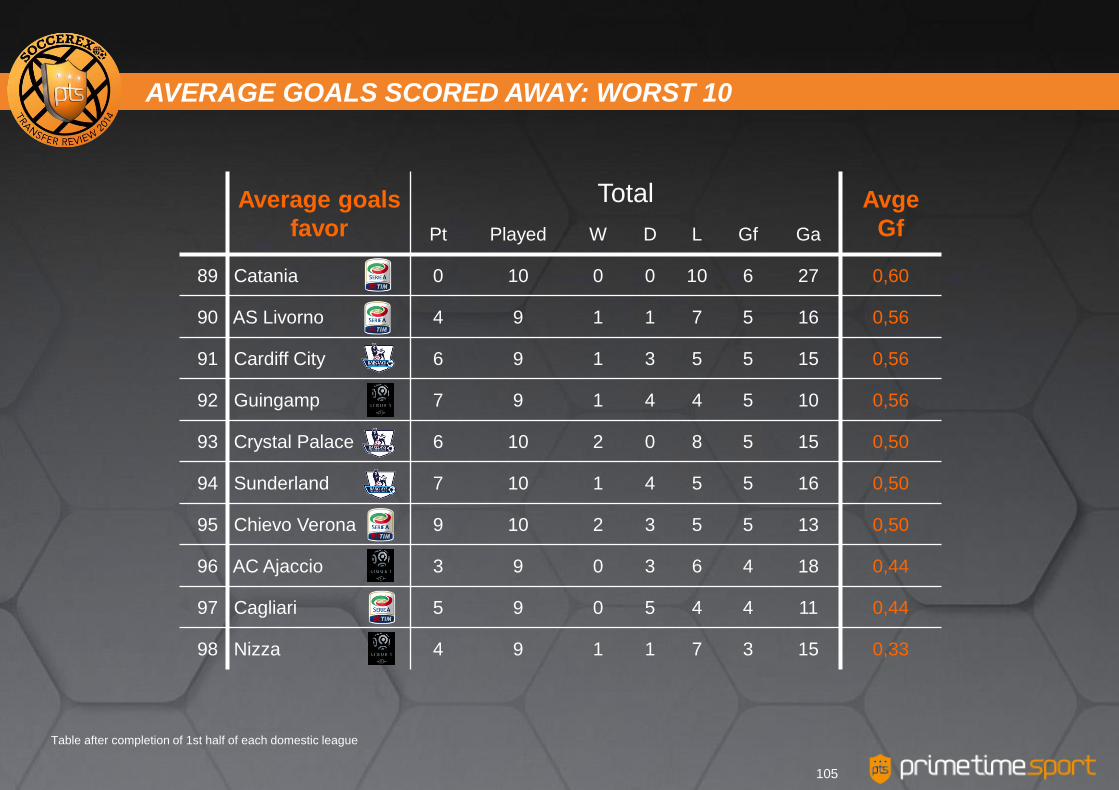
Table after completion of 1st half of each domestic league
Average goals
favor
Total Avge
Gf Pt Played W D L Gf Ga
89 Catania 0 10 0 0 10 6 27 0,60
90 AS Livorno 4 9 1 1 7 5 16 0,56
91 Cardiff City 6 9 1 3 5 5 15 0,56
92 Guingamp 7 9 1 4 4 5 10 0,56
93 Crystal Palace 6 10 2 0 8 5 15 0,50
94 Sunderland 7 10 1 4 5 5 16 0,50
95 Chievo Verona 9 10 2 3 5 5 13 0,50
96 AC Ajaccio 3 9 0 3 6 4 18 0,44
97 Cagliari 5 9 0 5 4 4 11 0,44
98 Nizza 4 9 1 1 7 3 15 0,33
AVERAGE GOALS SCORED AWAY: WORST 10
105
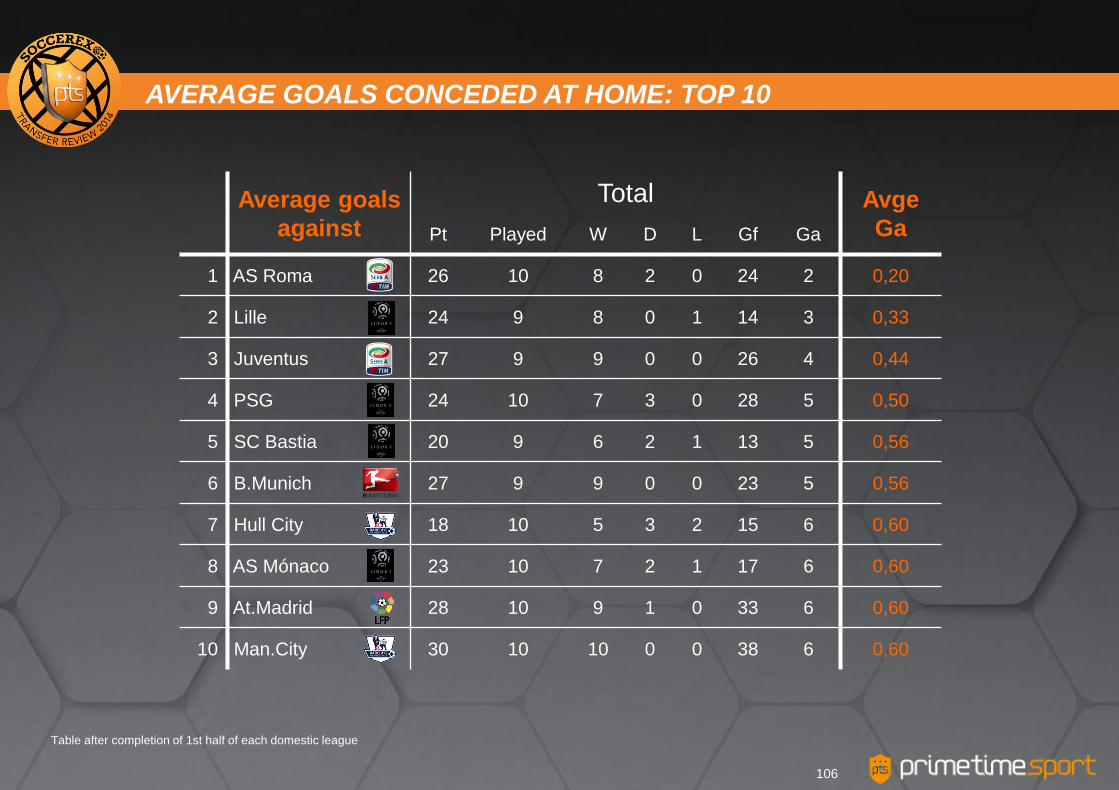
Table after completion of 1st half of each domestic league
Average goals
against
Total Avge
Ga Pt Played W D L Gf Ga
1 AS Roma 26 10 8 2 0 24 2 0,20
2 Lille 24 9 8 0 1 14 3 0,33
3 Juventus 27 9 9 0 0 26 4 0,44
4 PSG 24 10 7 3 0 28 5 0,50
5 SC Bastia 20 9 6 2 1 13 5 0,56
6 B.Munich 27 9 9 0 0 23 5 0,56
7 Hull City 18 10 5 3 2 15 6 0,60
8 AS Mónaco 23 10 7 2 1 17 6 0,60
9 At.Madrid 28 10 9 1 0 33 6 0,60
10 Man.City 30 10 10 0 0 38 6 0,60
AVERAGE GOALS CONCEDED AT HOME: TOP 10
106
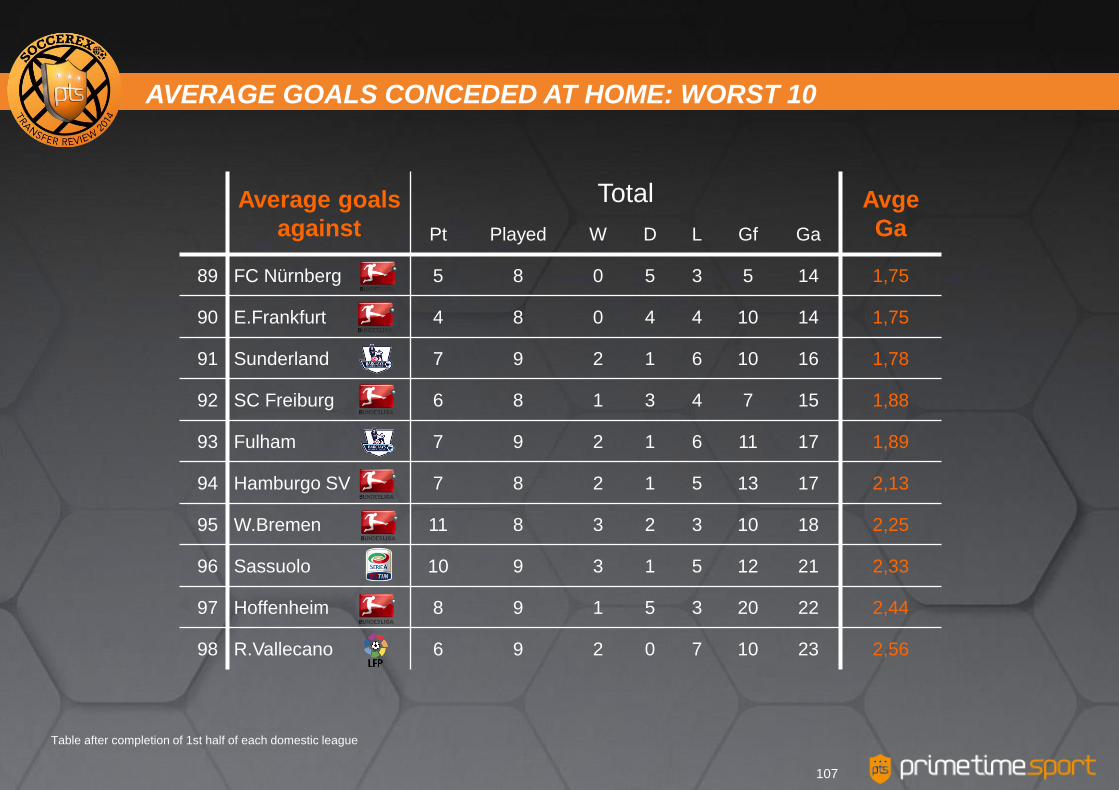
Table after completion of 1st half of each domestic league
Average goals
against
Total Avge
Ga Pt Played W D L Gf Ga
89 FC Nürnberg 5 8 0 5 3 5 14 1,75
90 E.Frankfurt 4 8 0 4 4 10 14 1,75
91 Sunderland 7 9 2 1 6 10 16 1,78
92 SC Freiburg 6 8 1 3 4 7 15 1,88
93 Fulham 7 9 2 1 6 11 17 1,89
94 Hamburgo SV 7 8 2 1 5 13 17 2,13
95 W.Bremen 11 8 3 2 3 10 18 2,25
96 Sassuolo 10 9 3 1 5 12 21 2,33
97 Hoffenheim 8 9 1 5 3 20 22 2,44
98 R.Vallecano 6 9 2 0 7 10 23 2,56
AVERAGE GOALS CONCEDED AT HOME: WORST 10
107
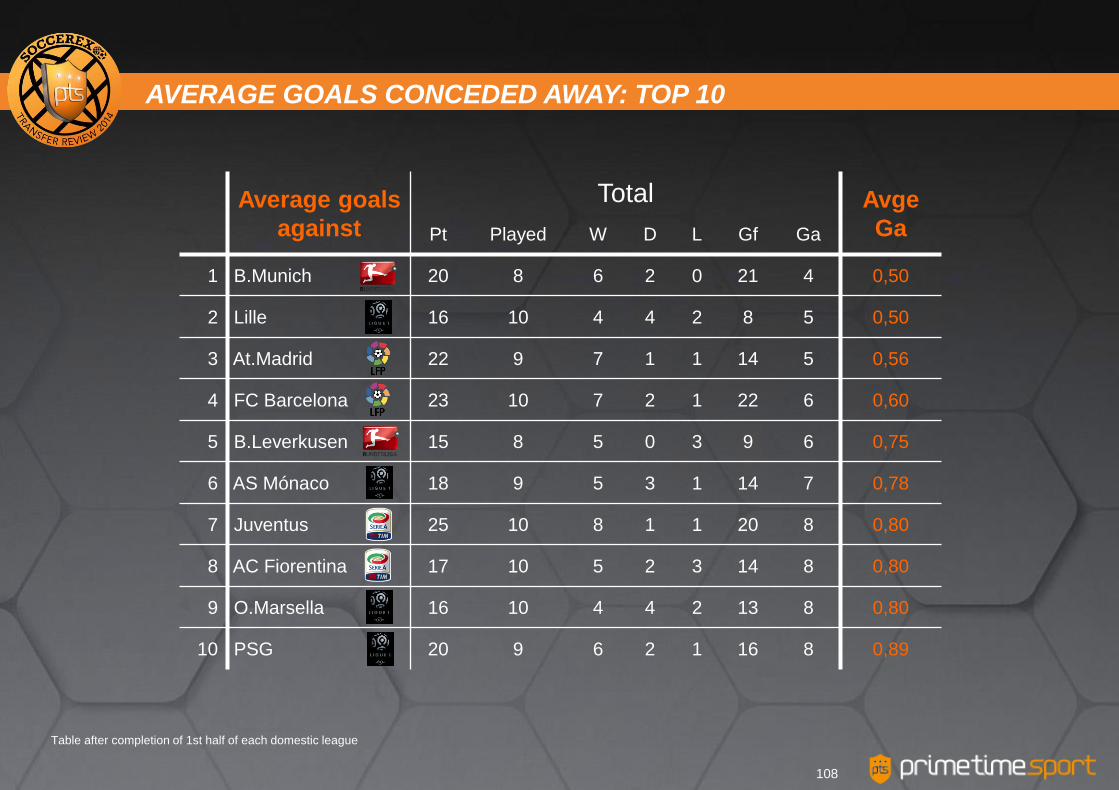
Table after completion of 1st half of each domestic league
Average goals
against
Total Avge
Ga Pt Played W D L Gf Ga
1 B.Munich 20 8 6 2 0 21 4 0,50
2 Lille 16 10 4 4 2 8 5 0,50
3 At.Madrid 22 9 7 1 1 14 5 0,56
4 FC Barcelona 23 10 7 2 1 22 6 0,60
5 B.Leverkusen 15 8 5 0 3 9 6 0,75
6 AS Mónaco 18 9 5 3 1 14 7 0,78
7 Juventus 25 10 8 1 1 20 8 0,80
8 AC Fiorentina 17 10 5 2 3 14 8 0,80
9 O.Marsella 16 10 4 4 2 13 8 0,80
10 PSG 20 9 6 2 1 16 8 0,89
AVERAGE GOALS CONCEDED AWAY: TOP 10
108
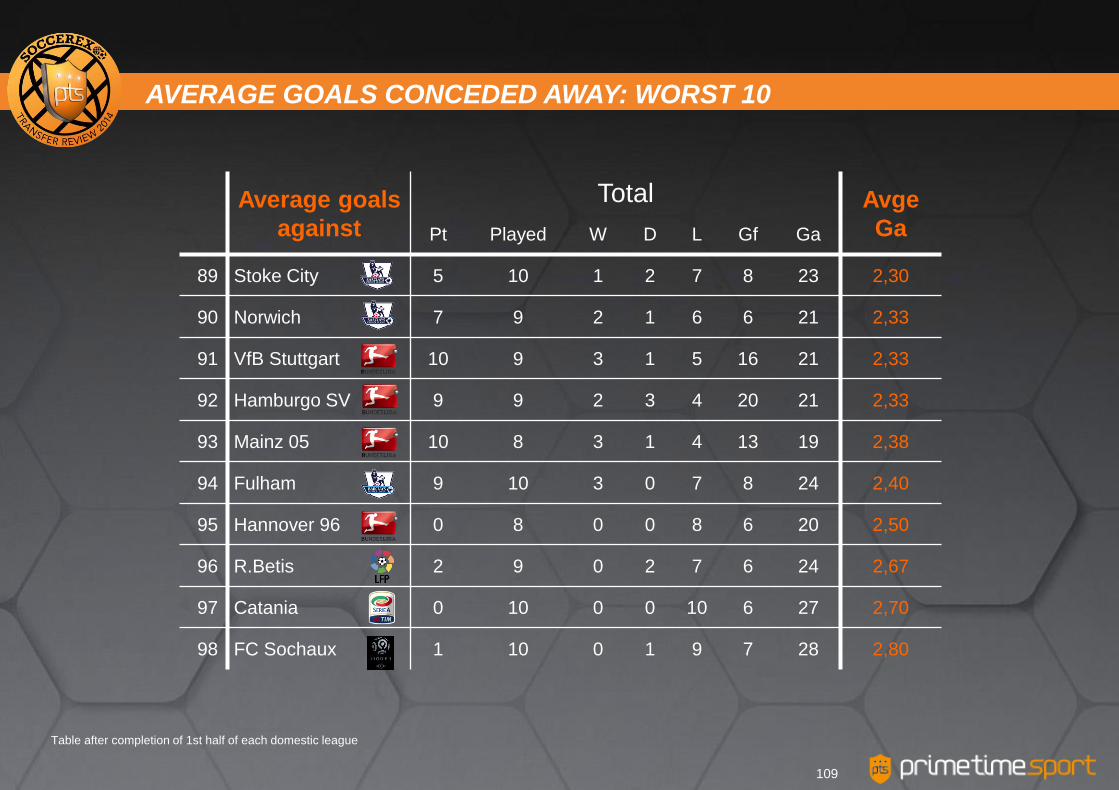
Table after completion of 1st half of each domestic league
Average goals
against
Total Avge
Ga Pt Played W D L Gf Ga
89 Stoke City 5 10 1 2 7 8 23 2,30
90 Norwich 7 9 2 1 6 6 21 2,33
91 VfB Stuttgart 10 9 3 1 5 16 21 2,33
92 Hamburgo SV 9 9 2 3 4 20 21 2,33
93 Mainz 05 10 8 3 1 4 13 19 2,38
94 Fulham 9 10 3 0 7 8 24 2,40
95 Hannover 96 0 8 0 0 8 6 20 2,50
96 R.Betis 2 9 0 2 7 6 24 2,67
97 Catania 0 10 0 0 10 6 27 2,70
98 FC Sochaux 1 10 0 1 9 7 28 2,80
AVERAGE GOALS CONCEDED AWAY: WORST 10
109
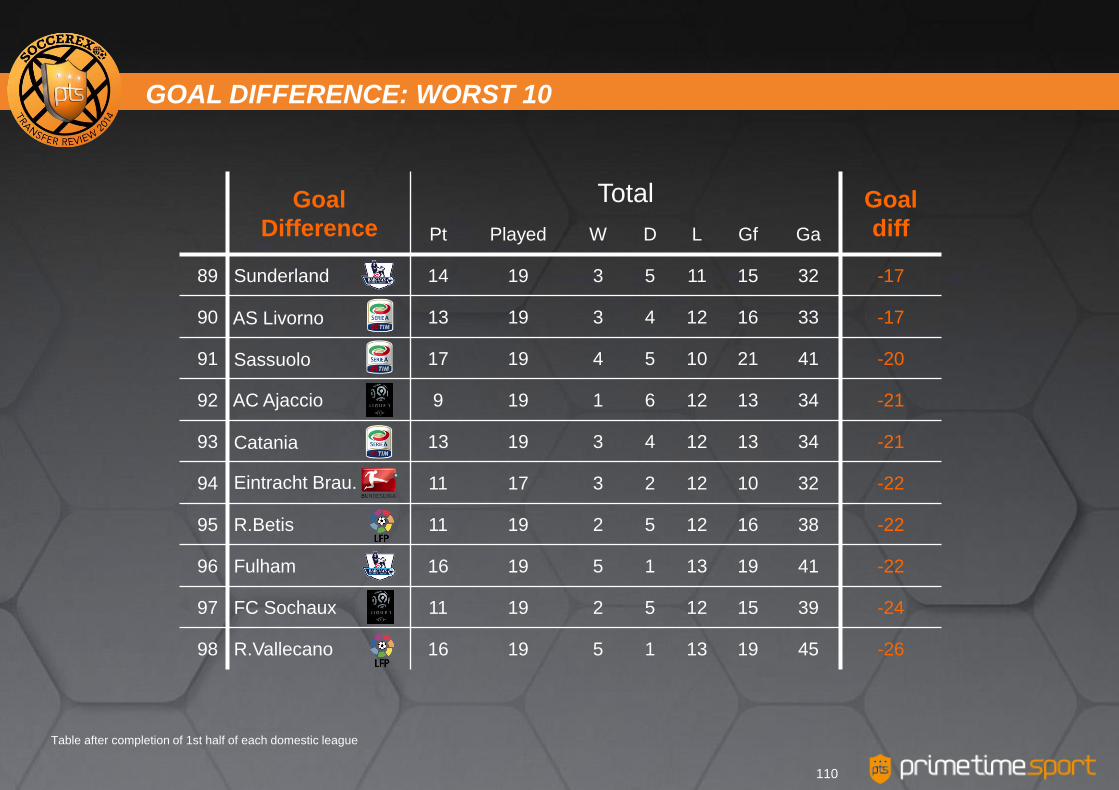
Table after completion of 1st half of each domestic league
Goal
Difference
Total Goal
diff Pt Played W D L Gf Ga
89 Sunderland 14 19 3 5 11 15 32 -17
90 AS Livorno 13 19 3 4 12 16 33 -17
91 Sassuolo 17 19 4 5 10 21 41 -20
92 AC Ajaccio 9 19 1 6 12 13 34 -21
93 Catania 13 19 3 4 12 13 34 -21
94 Eintracht Brau. 11 17 3 2 12 10 32 -22
95 R.Betis 11 19 2 5 12 16 38 -22
96 Fulham 16 19 5 1 13 19 41 -22
97 FC Sochaux 11 19 2 5 12 15 39 -24
98 R.Vallecano 16 19 5 1 13 19 45 -26
GOAL DIFFERENCE: WORST 10
110
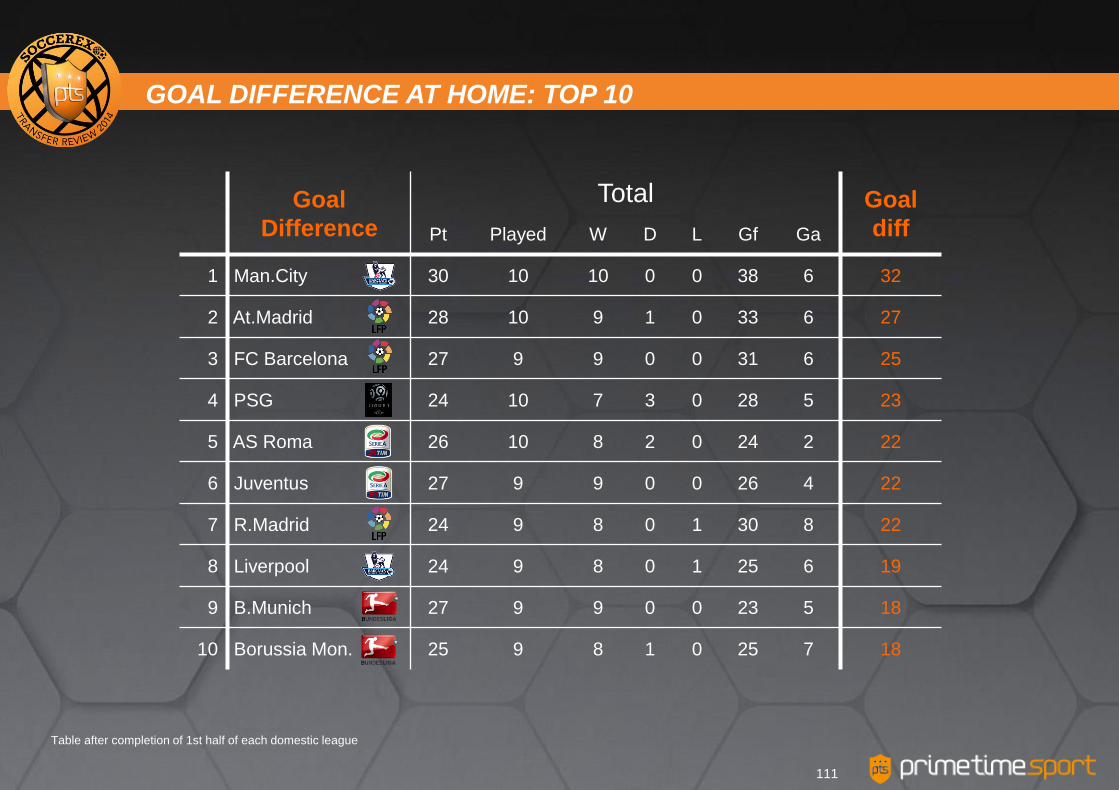
Table after completion of 1st half of each domestic league
Goal
Difference
Total Goal
diff Pt Played W D L Gf Ga
1 Man.City 30 10 10 0 0 38 6 32
2 At.Madrid 28 10 9 1 0 33 6 27
3 FC Barcelona 27 9 9 0 0 31 6 25
4 PSG 24 10 7 3 0 28 5 23
5 AS Roma 26 10 8 2 0 24 2 22
6 Juventus 27 9 9 0 0 26 4 22
7 R.Madrid 24 9 8 0 1 30 8 22
8 Liverpool 24 9 8 0 1 25 6 19
9 B.Munich 27 9 9 0 0 23 5 18
10 Borussia Mon. 25 9 8 1 0 25 7 18
GOAL DIFFERENCE AT HOME: TOP 10
111
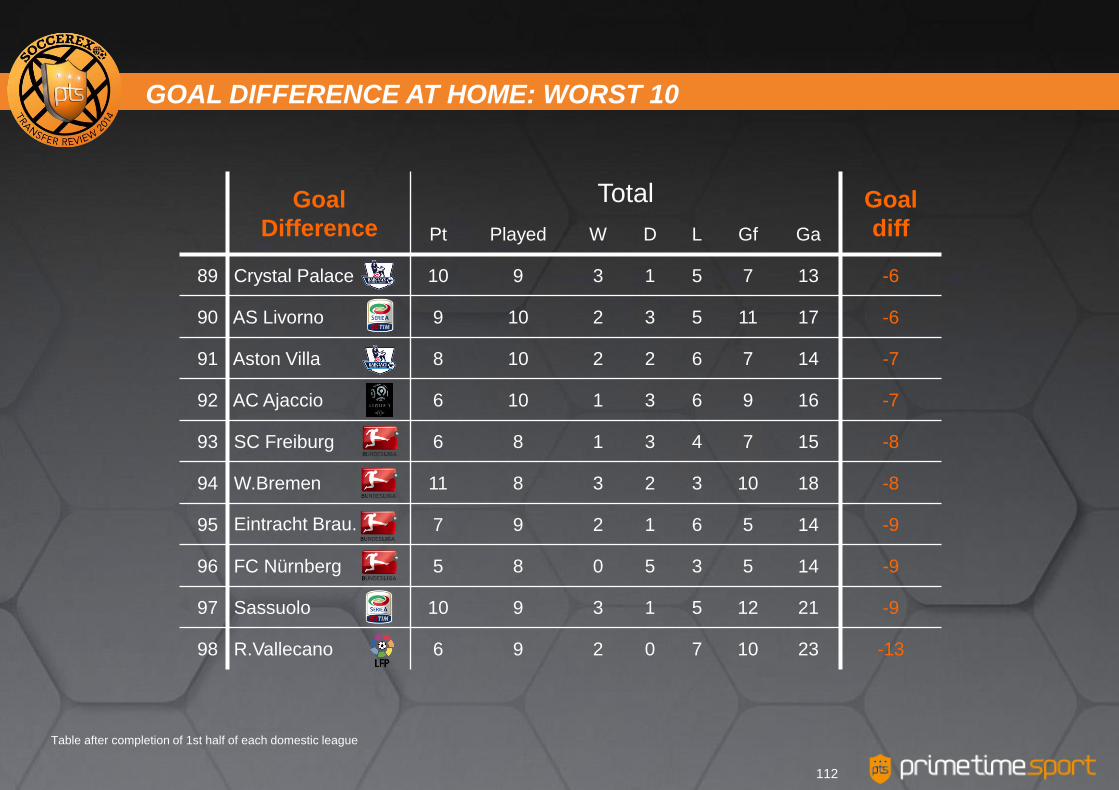
Table after completion of 1st half of each domestic league
Goal
Difference
Total Goal
diff Pt Played W D L Gf Ga
89 Crystal Palace 10 9 3 1 5 7 13 -6
90 AS Livorno 9 10 2 3 5 11 17 -6
91 Aston Villa 8 10 2 2 6 7 14 -7
92 AC Ajaccio 6 10 1 3 6 9 16 -7
93 SC Freiburg 6 8 1 3 4 7 15 -8
94 W.Bremen 11 8 3 2 3 10 18 -8
95 Eintracht Brau. 7 9 2 1 6 5 14 -9
96 FC Nürnberg 5 8 0 5 3 5 14 -9
97 Sassuolo 10 9 3 1 5 12 21 -9
98 R.Vallecano 6 9 2 0 7 10 23 -13
GOAL DIFFERENCE AT HOME: WORST 10
112
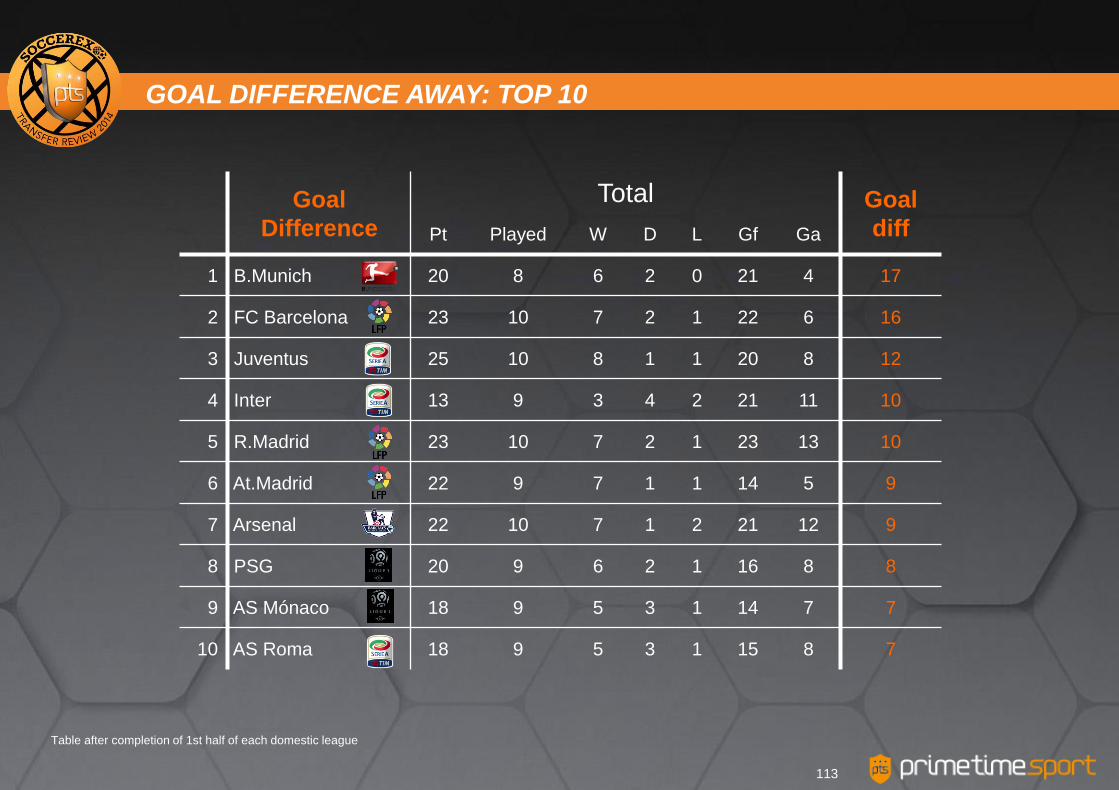
Table after completion of 1st half of each domestic league
Goal
Difference
Total Goal
diff Pt Played W D L Gf Ga
1 B.Munich 20 8 6 2 0 21 4 17
2 FC Barcelona 23 10 7 2 1 22 6 16
3 Juventus 25 10 8 1 1 20 8 12
4 Inter 13 9 3 4 2 21 11 10
5 R.Madrid 23 10 7 2 1 23 13 10
6 At.Madrid 22 9 7 1 1 14 5 9
7 Arsenal 22 10 7 1 2 21 12 9
8 PSG 20 9 6 2 1 16 8 8
9 AS Mónaco 18 9 5 3 1 14 7 7
10 AS Roma 18 9 5 3 1 15 8 7
GOAL DIFFERENCE AWAY: TOP 10
113
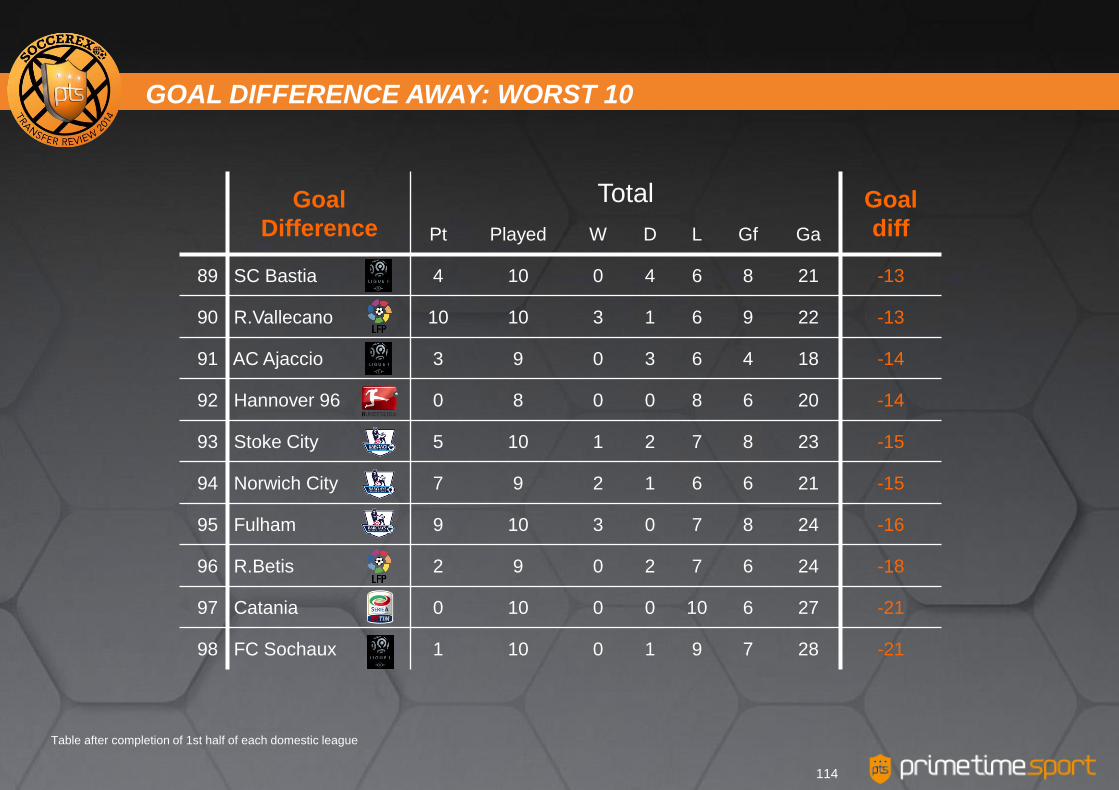
Table after completion of 1st half of each domestic league
Goal
Difference
Total Goal
diff Pt Played W D L Gf Ga
89 SC Bastia 4 10 0 4 6 8 21 -13
90 R.Vallecano 10 10 3 1 6 9 22 -13
91 AC Ajaccio 3 9 0 3 6 4 18 -14
92 Hannover 96 0 8 0 0 8 6 20 -14
93 Stoke City 5 10 1 2 7 8 23 -15
94 Norwich City 7 9 2 1 6 6 21 -15
95 Fulham 9 10 3 0 7 8 24 -16
96 R.Betis 2 9 0 2 7 6 24 -18
97 Catania 0 10 0 0 10 6 27 -21
98 FC Sochaux 1 10 0 1 9 7 28 -21
GOAL DIFFERENCE AWAY: WORST 10
114
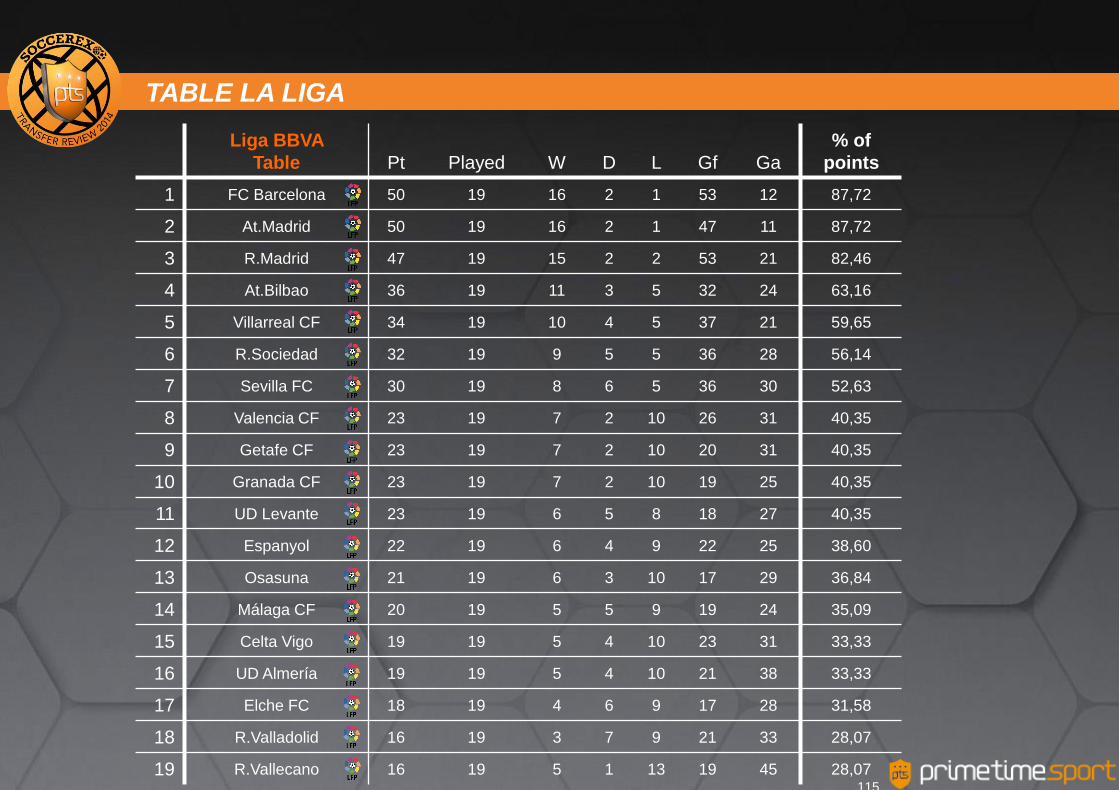
Liga BBVA
Table Pt Played W D L Gf Ga
% of
points
1 FC Barcelona 50 19 16 2 1 53 12 87,72
2 At.Madrid 50 19 16 2 1 47 11 87,72
3 R.Madrid 47 19 15 2 2 53 21 82,46
4 At.Bilbao 36 19 11 3 5 32 24 63,16
5 Villarreal CF 34 19 10 4 5 37 21 59,65
6 R.Sociedad 32 19 9 5 5 36 28 56,14
7 Sevilla FC 30 19 8 6 5 36 30 52,63
8 Valencia CF 23 19 7 2 10 26 31 40,35
9 Getafe CF 23 19 7 2 10 20 31 40,35
10 Granada CF 23 19 7 2 10 19 25 40,35
11 UD Levante 23 19 6 5 8 18 27 40,35
12 Espanyol 22 19 6 4 9 22 25 38,60
13 Osasuna 21 19 6 3 10 17 29 36,84
14 Málaga CF 20 19 5 5 9 19 24 35,09
15 Celta Vigo 19 19 5 4 10 23 31 33,33
16 UD Almería 19 19 5 4 10 21 38 33,33
17 Elche FC 18 19 4 6 9 17 28 31,58
18 R.Valladolid 16 19 3 7 9 21 33 28,07
19 R.Vallecano 16 19 5 1 13 19 45 28,07
TABLE LA LIGA
115
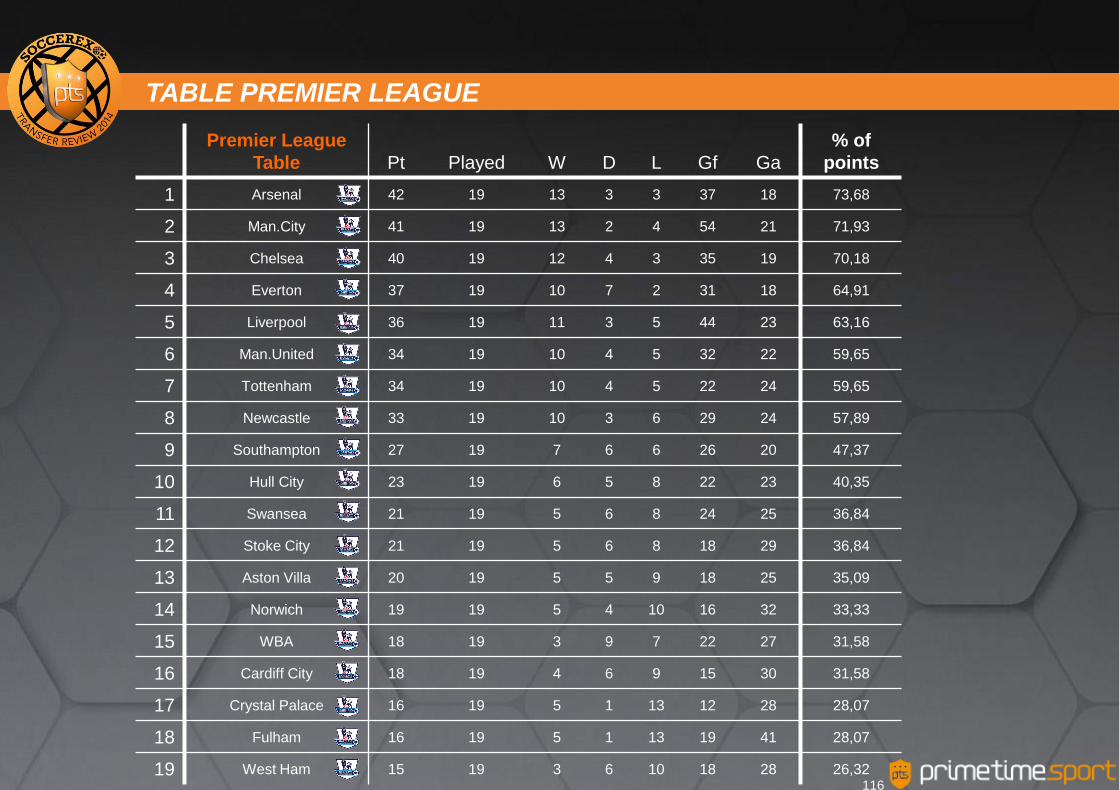
Premier League
Table Pt Played W D L Gf Ga
% of
points
1 Arsenal 42 19 13 3 3 37 18 73,68
2 Man.City 41 19 13 2 4 54 21 71,93
3 Chelsea 40 19 12 4 3 35 19 70,18
4 Everton 37 19 10 7 2 31 18 64,91
5 Liverpool 36 19 11 3 5 44 23 63,16
6 Man.United 34 19 10 4 5 32 22 59,65
7 Tottenham 34 19 10 4 5 22 24 59,65
8 Newcastle 33 19 10 3 6 29 24 57,89
9 Southampton 27 19 7 6 6 26 20 47,37
10 Hull City 23 19 6 5 8 22 23 40,35
11 Swansea 21 19 5 6 8 24 25 36,84
12 Stoke City 21 19 5 6 8 18 29 36,84
13 Aston Villa 20 19 5 5 9 18 25 35,09
14 Norwich 19 19 5 4 10 16 32 33,33
15 WBA 18 19 3 9 7 22 27 31,58
16 Cardiff City 18 19 4 6 9 15 30 31,58
17 Crystal Palace 16 19 5 1 13 12 28 28,07
18 Fulham 16 19 5 1 13 19 41 28,07
19 West Ham 15 19 3 6 10 18 28 26,32
TABLE PREMIER LEAGUE
116
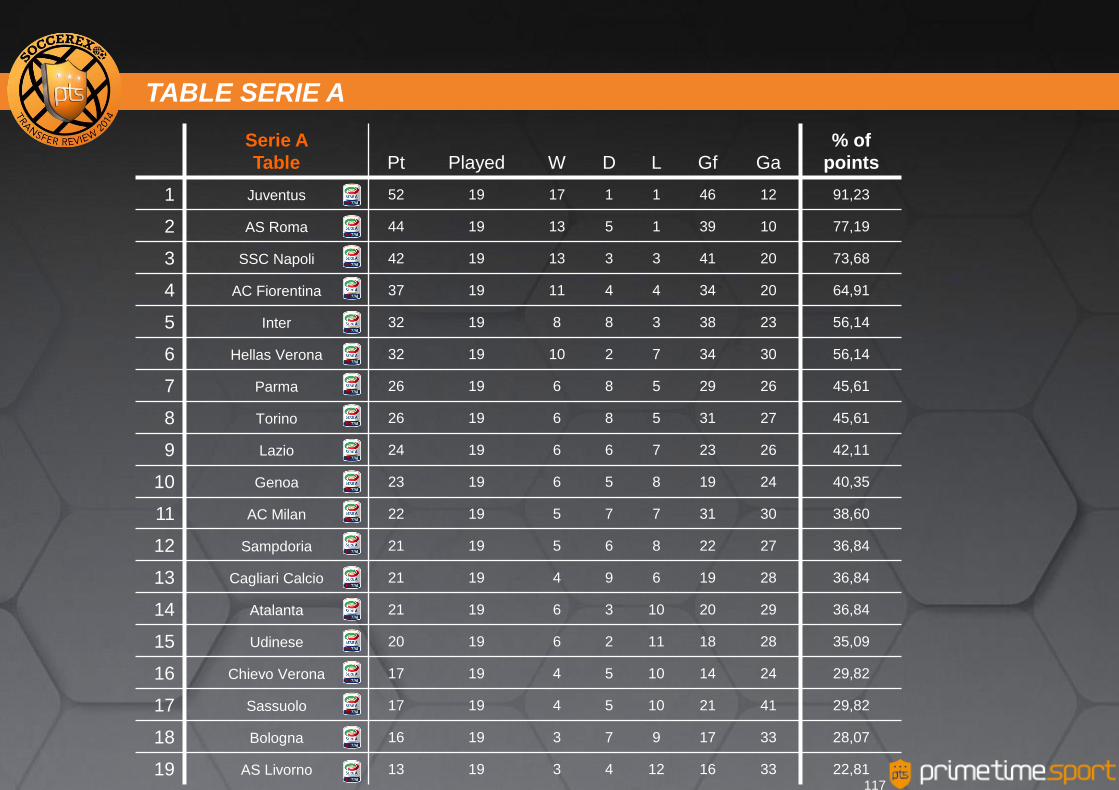
Serie A
Table Pt Played W D L Gf Ga
% of
points
1 Juventus 52 19 17 1 1 46 12 91,23
2 AS Roma 44 19 13 5 1 39 10 77,19
3 SSC Napoli 42 19 13 3 3 41 20 73,68
4 AC Fiorentina 37 19 11 4 4 34 20 64,91
5 Inter 32 19 8 8 3 38 23 56,14
6 Hellas Verona 32 19 10 2 7 34 30 56,14
7 Parma 26 19 6 8 5 29 26 45,61
8 Torino 26 19 6 8 5 31 27 45,61
9 Lazio 24 19 6 6 7 23 26 42,11
10 Genoa 23 19 6 5 8 19 24 40,35
11 AC Milan 22 19 5 7 7 31 30 38,60
12 Sampdoria 21 19 5 6 8 22 27 36,84
13 Cagliari Calcio 21 19 4 9 6 19 28 36,84
14 Atalanta 21 19 6 3 10 20 29 36,84
15 Udinese 20 19 6 2 11 18 28 35,09
16 Chievo Verona 17 19 4 5 10 14 24 29,82
17 Sassuolo 17 19 4 5 10 21 41 29,82
18 Bologna 16 19 3 7 9 17 33 28,07
19 AS Livorno 13 19 3 4 12 16 33 22,81
TABLE SERIE A
117
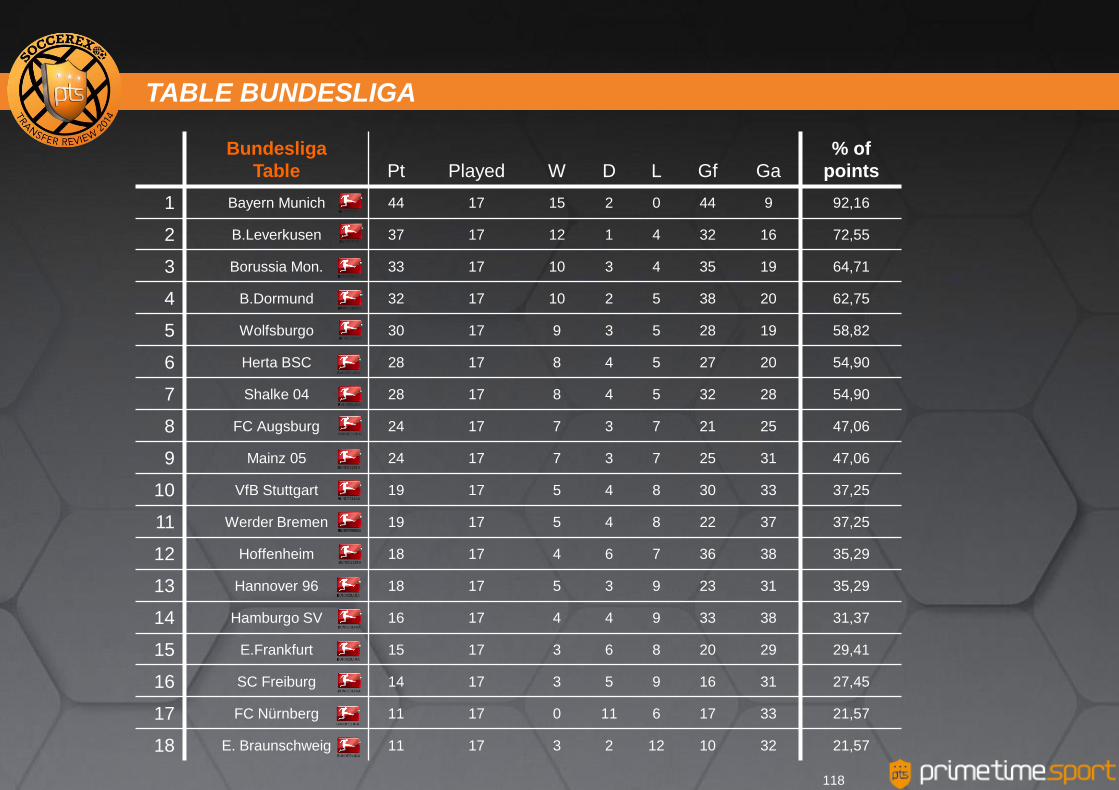
Bundesliga
Table Pt Played W D L Gf Ga
% of
points
1 Bayern Munich 44 17 15 2 0 44 9 92,16
2 B.Leverkusen 37 17 12 1 4 32 16 72,55
3 Borussia Mon. 33 17 10 3 4 35 19 64,71
4 B.Dormund 32 17 10 2 5 38 20 62,75
5 Wolfsburgo 30 17 9 3 5 28 19 58,82
6 Herta BSC 28 17 8 4 5 27 20 54,90
7 Shalke 04 28 17 8 4 5 32 28 54,90
8 FC Augsburg 24 17 7 3 7 21 25 47,06
9 Mainz 05 24 17 7 3 7 25 31 47,06
10 VfB Stuttgart 19 17 5 4 8 30 33 37,25
11 Werder Bremen 19 17 5 4 8 22 37 37,25
12 Hoffenheim 18 17 4 6 7 36 38 35,29
13 Hannover 96 18 17 5 3 9 23 31 35,29
14 Hamburgo SV 16 17 4 4 9 33 38 31,37
15 E.Frankfurt 15 17 3 6 8 20 29 29,41
16 SC Freiburg 14 17 3 5 9 16 31 27,45
17 FC Nürnberg 11 17 0 11 6 17 33 21,57
18 E. Braunschweig 11 17 3 2 12 10 32 21,57
TABLE BUNDESLIGA
118

Ligue 1
Table Pt Played W D L Gf Ga
% of
points
1 PSG 44 19 13 5 1 44 13 77,19
2 AS Mónaco 41 19 12 5 2 31 13 71,93
3 Lille 40 19 12 4 3 22 8 70,18
4 Saint-Étienne 33 19 10 3 6 28 20 57,89
5 G.Bordeus 31 19 8 7 4 27 21 54,39
6 O.Marsella 29 19 8 5 6 27 20 50,88
7 FC Nantes 29 19 9 2 8 23 17 50,88
8 Stade Reims 29 19 7 8 4 23 21 50,88
9 FC Lorient 27 19 8 3 8 26 26 47,37
10 O.Lyon 25 19 6 7 6 28 27 43,86
11 Toulouse 25 19 6 7 6 20 24 43,86
12 Guingamp 24 19 6 6 7 19 19 42,11
13 SC Bastia 24 19 6 6 7 21 26 42,11
14 Nizza 23 19 7 2 10 18 25 40,35
15 Stade Rennes 21 19 5 6 8 19 31 36,84
16 Évian 20 19 5 5 9 19 32 35,09
17 Montpellier 17 19 2 11 6 18 24 29,82
18 Valenciennes 14 19 3 5 11 17 28 24,56
19 FC Sochaux 11 19 2 5 12 15 39 19,30
TABLE LIGUE 1
119
1. Tables
2. About Prime Time Sport
SOCCEREX TRANSFER REVIEW 2014- WINTER WINDOW
120

> Sponsors recruiting
> Media relationships
> Social networks
> Brand & positioning
development
> Player representation
> International player transfers
> Academies development
> Friendly games
PLAYER IMAGE RIGHTS
FOOTBALL
CONTENT & CONFERENCES
STRATEGIC CONSULTANCY
> Club revenue development
> Sponsorship activation for brands
> PR & Communications
> Sponsor recruitment for brands
> Sports business newspaper
reports and articles
> Book Show Me the Money!
> Football Transfer Review report
> Conferences Esteve Calzada
PRIME TIME SPORT BUSINESS AREAS
121
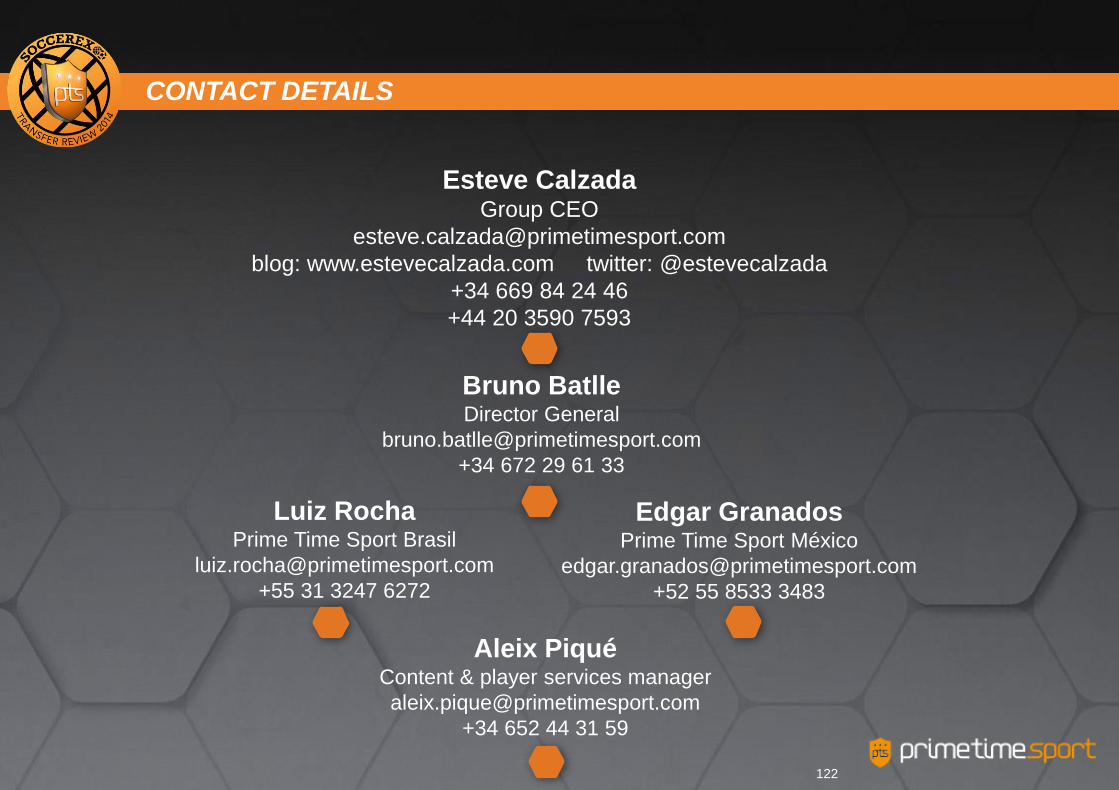
CONTACT DETAILS
Esteve Calzada Group CEO
blog: www.estevecalzada.com twitter: @estevecalzada
+34 669 84 24 46
+44 20 3590 7593
Bruno Batlle Director General
+34 672 29 61 33
Aleix Piqué Content & player services manager
+34 652 44 31 59
Luiz Rocha Prime Time Sport Brasil
+55 31 3247 6272
Edgar Granados Prime Time Sport México
+52 55 8533 3483
122


