50
1 Massachusetts Institute of Technology - Prof. de Weck and Prof. Willcox Prof. Olivier de Weck Multidisciplinary System Design Optimization (MSDO) Lecture 3: Modeling and Simulation

1Massachusetts Institute of Technology - Prof. de Weck and Prof. Willcox
Prof. Olivier de Weck
Multidisciplinary System
Design Optimization (MSDO)
Lecture 3:
Modeling and Simulation

2Massachusetts Institute of Technology - Prof. de Weck and Prof. Willcox
MSDO Framework
Discipline A Discipline B
Discipline C
Simulation Model
TradespaceExploration(DOE)
Optimization Algorithms
MultiobjectiveOptimization
Numerical Techniques(direct and penalty methods)
Heuristic Techniques(SA,GA)
1
2
n
x
x
x
Design Vector
Coupling
1
2
z
J
J
J
ApproximationMethods
Coupling
Sensitivity Analysis
Isoperformance
Objective Vector
Special Techniques
today

3Massachusetts Institute of Technology - Prof. de Weck and Prof. Willcox
Today’s Topics
Computational Issues
- coupling disparate CAE/CAD tools
Definitions of Modeling and Simulation
- physics-based modeling- empirical modeling
Model/Simulation Development Process
- module identification- module ordering: DSM’s and N2 diagrams- module coding: fidelity and benchmarking- model execution = simulation

4Massachusetts Institute of Technology - Prof. de Weck and Prof. Willcox
Definitions

5Massachusetts Institute of Technology - Prof. de Weck and Prof. Willcox
Definitions
Definition: Model (as used in this class)
A model is a mathematical object that has the abilityto predict the behavior of a real system under a set ofdefined operating conditions and simplifying assumptions.
Definition: Simulation (as used in this class)
Simulation is the process of exercising a model for aparticular instantiation of the system and specific set of inputs in order to predict the system response.

6Massachusetts Institute of Technology - Prof. de Weck and Prof. Willcox
From the Reference
System
Experiment with
Actual System
Physical
Model
Mathematical
Model
Analytical
Solution
Experiment with
Model of System
Simulation
Law & Kelton (2000), Simulation Modeling and Analysis 3rd ed., McGraw-Hill, Inc.
7Massachusetts Institute of Technology - Prof. de Weck and Prof. Willcox
Additional Detail – Next Chart
The following chart includes additional detail to emphasize the factors that differentiate a model and a simulation
Simulation/Model Factors:• Real World Variability• Reaction to Events
These relate back to the purpose of the sim/model
Models should not include all the details for all purposes
• They quickly become unwieldy & expensive

8Massachusetts Institute of Technology - Prof. de Weck and Prof. Willcox
Analysis Methods
System
Experiment with
Actual System
Physical
Model
Mathematical
Model
Analytical
Solution
Numerical (Simulation)
Experiment with
Model of System
Static
vs
Dynamic
Deterministic
vs
Stochastic
Continuous
vs
DiscreteLaw & Kelton (2000), Simulation Modeling and
Analysis 3rd ed., McGraw-Hill, Inc.
Modified by M.J. Steele with added detail
Visualization
Purpose:
Analysis/Design
Prediction
Training
Testing
Entertainment
Sensory Immersion
Experiencing
Visualizing
Analyzing

9Massachusetts Institute of Technology - Prof. de Weck and Prof. Willcox
Model and Simulation
Development Process

10Massachusetts Institute of Technology - Prof. de Weck and Prof. Willcox
Model Development Process
Objectives Constraints
Design Variables
GoverningEquations
IntegrateModules
Define Master Table
Code Modules
DefineModules
Test Code
BenchmarkSanity Check
Iterate to Improve Fidelity
DSMN2 Diagram
Start Process
Ready For Use

11Massachusetts Institute of Technology - Prof. de Weck and Prof. Willcox
Objectives, Constraints, Design
Variables
• Define Objectives J• Define Design Variables x• Define Constraints and Bounds g, h
• Determine important fixed parameters p
Influence Matrixx1 … xn
Ji + + o
gj + o +
+ influence
o noinfluence
model relationships
This is how we want system to behave
Things about system we can change
Must satisfy this
Fixed, outside ourcontrol yet important
12Massachusetts Institute of Technology - Prof. de Weck and Prof. Willcox
Physics Based Modeling
• Start with governing equations• Continuum Mechanics for physical systems• Introduce Boundary Conditions• Introduce Initial Conditions• External forcing functions• Discretize system

13Massachusetts Institute of Technology - Prof. de Weck and Prof. Willcox
Governing Equations
Continuum (Structural) Mechanics
x xy xz
yx y yz
zx zy y
S
stresstensor
-Equilibrium Equations-Constitutive equations-Compatibility equations
x
u
xstrain
1F
2F
3F
0iF
x xE'
x
dx dx
dx

14Massachusetts Institute of Technology - Prof. de Weck and Prof. Willcox
Example: Finite Element Model
Geometry
MaterialPropertiesBoundaryConditions
AssumptionsDiscretization
Loads
Mass andInertia Matrix
Deflections,Stress, Strain
Natural FrequenciesMode Shapes
x x x FM C K
XY
Z
Connectivity
Time as Variable:
Static Steady State Transient
15Massachusetts Institute of Technology - Prof. de Weck and Prof. Willcox
Empirical Modeling
• Derive a model, not from physics and first principles, but from observation, i.e. data
• Usually leads to low order models• Only valid under similar operating conditions• Many cost models are of this nature

16Massachusetts Institute of Technology - Prof. de Weck and Prof. Willcox
Example: Empirical Modeling
Engi ne Si ze vs . HP
0
50
100
150
200
250
300
350
400
0. 0 2. 0 4. 0 6. 0
Engi ne Si ze ( Li t er s )
Ho
rs
ep
ow
er
HP ED
Linear Regression
HP = 51.48*ED + 23.12
… could do physics-Based modeling ofthis in-line 4 engine,but instead do …
In-line engine image removed due to copyrightrestrictions. Animation can be found at HowStuffWorks.com.

17Massachusetts Institute of Technology - Prof. de Weck and Prof. Willcox
How to decompose a system
• What to do when system is new - no experience ?
• First define “black boxes” or modules based on:
disciplinary tradition, degree of coupling of governing equations or availability of analysis software
• Crisply define inputs and outputs of each module
Ref: Rogers, J.L.: “A Knowledge-Based Tool for Multilevel Decomposition of
a Complex Design Problem”, NASA TP2903, 1989

18Massachusetts Institute of Technology - Prof. de Weck and Prof. Willcox
Partitioning of Equations
1 2 3
2 5
1 4 5 3
5 2
2 5 2 4 2
2 2 0
3 9 0
10 0
9 3 7 0
9 0
x x x
x x
x x x x
x x
x x x x x
E1
E2
E3
E4
E5
-5 variables-5 independent equations-no degrees of freedom
1. Solve x2,x5 from E2 and E4
2. Solve x4 from E5
3. Solve x1 and x3 from E3 and E1
X1
E1
E2
E3
E4
E5
X2 X3 X4 X5
1 11 1
1
1
11
111
1
1
1
X2
E2
E4
E5
E3
E1
X5 X4 X1 X3
11
11
1
1111
11
1 11
Module 1
Module 2
Module 3
Occurrence matrix for system of equations Occurrence matrix showing the system of equations partitioned into three subsets
Image by MIT OpenCourseWare.

19Massachusetts Institute of Technology - Prof. de Weck and Prof. Willcox
Module Definition
What is a module in MSDO ?
A module in multidisciplinary system design optimization is a finite group of tightly coupled mathematical relation-
ships who are under the responsibility of a particular individual or organization, and where some variables
represent independent inputs while others are dependent outputs. The module frequently appears as a
“black box” to other individuals or organizations .
Module “A”
x1
xn
...y1
ym
...

20Massachusetts Institute of Technology - Prof. de Weck and Prof. Willcox
Modules for Simulation
• A module within a simulation architecture may be definedas a piece of computer code which:– Performs a compact set of calculations.– Contains a single entry point and exit point.– May be tested in isolation.
• Attributes of a good modular unit within a simulation architecture include:– High internal coupling within the module
• All sub-functions within the module contribute to form a single primary function.
– Low coupling between modules
• Minimize the number of variables that flow between modules.– Minimization of feedback loops
• Data flow is processed sequentially from input to output.

21Massachusetts Institute of Technology - Prof. de Weck and Prof. Willcox
Module Inputs and Outputs
Module i
Info coming from upstream(feed-forward)
Info fed to downstream
(feed-forward)
OutputOutput
Input
Input
Info fed from downstream(feedback)
Info fed to upstream
(feedback)

22Massachusetts Institute of Technology - Prof. de Weck and Prof. Willcox
Module Example
pointing requirementvehicle inertia matrixdisturbance torques
power requiredpropellant amount
OutputOutput
Input
sensorsactuators (e.g. CMGs)
Attitude
Control
Example: Spacecraft Design
Id

23Massachusetts Institute of Technology - Prof. de Weck and Prof. Willcox
• An NxN matrix used to develop and organize interface information.• Similar to a Design Structure Matrix (DSM)• Each module within the simulation architecture is placed along the
diagonal.• Provides a visual representation of the flow of information through the
simulation architecture.• Helps to identify critical modules that have many inputs and outputs. The
fidelity of critical modules should be thoroughly tested and verified.• Explicitly defines all inputs and outputs for macro-modules and modules.• Allows for “plug and play”
– Independent testing– Alternative modules easily analyzed– Can increase overall model fidelity incrementally
The N2 Diagram
24Massachusetts Institute of Technology - Prof. de Weck and Prof. Willcox
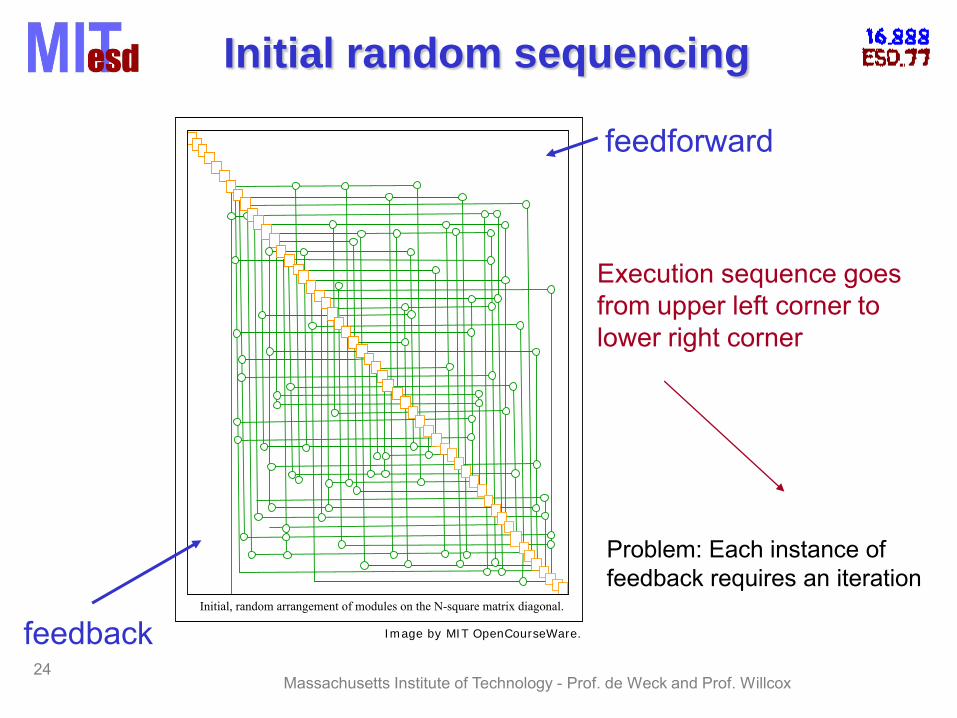
Initial random sequencing
Execution sequence goesfrom upper left corner tolower right corner
feedforward
feedback
Problem: Each instance offeedback requires an iteration
Image by MIT OpenCourseWare.
Initial, random arrangement of modules on the N-square matrix diagonal.
25
Massachusetts Institute of Technology - Prof. de Weck and Prof. Willcox
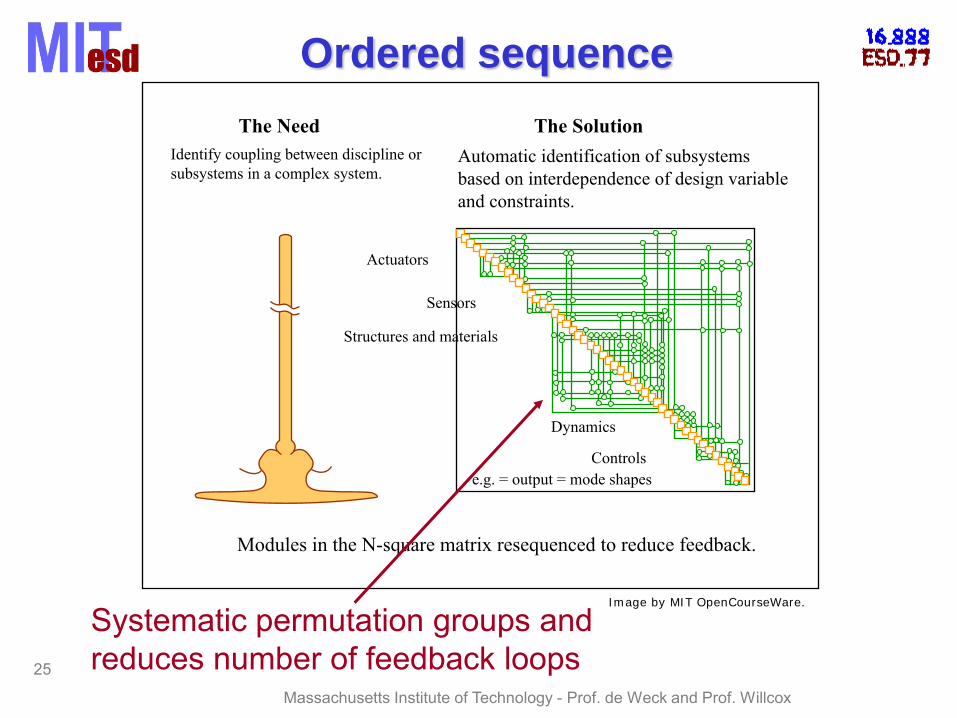
Ordered sequence
Systematic permutation groups and reduces number of feedback loops
The Need The SolutionIdentify coupling between discipline or subsystems in a complex system.
Automatic identification of subsystems based on interdependence of design variable and constraints.
Modules in the N-square matrix resequenced to reduce feedback.
Actuators
Sensors
Structures and materials
Dynamics
Controlse.g. = output = mode shapes
Image by MIT OpenCourseWare.

26Massachusetts Institute of Technology - Prof. de Weck and Prof. Willcox
TPF Example : Overview N2 Diagram
TMAS N-Squared Diagram
Design Const. Env. Apert. Spacecraft Payload and Bus Dynamics, Control, & Stability Deployment & GINA Systems Analysis Module
Vector Vector Module Conf. Module Module Operations
Module Module
Design Vector 1 2,3,4 2,4 1,2,3 2,3,4 2,3 1 2,3,4 2,3,4 1,2,3,4 3 1 1,2,3 1,2 2 2,3,4 1,2,3,4
Architecture Constants Vector 11 2 2,3 3 1,2 4 13,14 14,31 15,16 11,32-40 3 5 to 11 2,12 all
Environment 1 1,2,3
Aperture Configuration 1 1 1 1
Payload 3,4 1,2 1,2
Power 1,6 6,7 6,7 2,3
2,3,5,6 Thermal 1,4
4 Propulsion 3
6 Communications1 to 5
8,10 6 Structure 6,10 3,4,5 6,9 6
Sub-Modules Truss Design 1,2 1
Design Vector State-Space Plant Model1 1,2
Architecture Constants Vector Attitude Determination and Control
Environment Model Integration3
Aperture Configuration Performance Assesment 1
Payload Orbit Transit1,2,3 4
Power Launch 2
Thermal Operations 2 1
Propulsion Capability 7,8,9
Communications Performance 4
Structure Cost 6
Truss Design Cost Per Function1
State-Space Plant Model Adaptability
Attitude Determination and Control
Model Integration
Performance Assesment
Orbit Transit
Launch
Operations
Capability
Performance
Cost
Cost Per Function
Adaptability
m-file
Inputs
Inputs
OutputsOutputs

27Massachusetts Institute of Technology - Prof. de Weck and Prof. Willcox
Coding - Benchmarking
• Coding of modules can be done in parallel, once the I/O structure has been decided
• Use “dummy” input data to exercise modules
in isolation• Integrate modules step-by-step starting from
upper left corner in N2-Diagram• Do end-to-end simulation test before release• Benchmark (“validate”) simulation against
known cases (experimental data)

28Massachusetts Institute of Technology - Prof. de Weck and Prof. Willcox
Recap
Objectives Constraints
Design Variables
GoverningEquations
IntegrateModules
Define Master Table
Code Modules
DefineModules
Test Code
BenchmarkSanity Check
Iterate to Improve Fidelity
DSMN2 Diagram
Start Process
Ready For Use

29Massachusetts Institute of Technology - Prof. de Weck and Prof. Willcox
Example
de Weck, O. L. and Chang D., ”Architecture Trade Methodology for LEO
Personal Communication Systems “, 20th International Communications Satellite
Systems Conference, Paper No. AIAA-2002-1866, Montréal, Québec, Canada, May 12-15, 2002

30Massachusetts Institute of Technology - Prof. de Weck and Prof. Willcox
Example: Communications Satellites
Can we quantify the conceptual system design
problem using modeling and simulation?
Simulator
Design(Input) Vector
Performance CapacityCost
31Massachusetts Institute of Technology - Prof. de Weck and Prof. Willcox
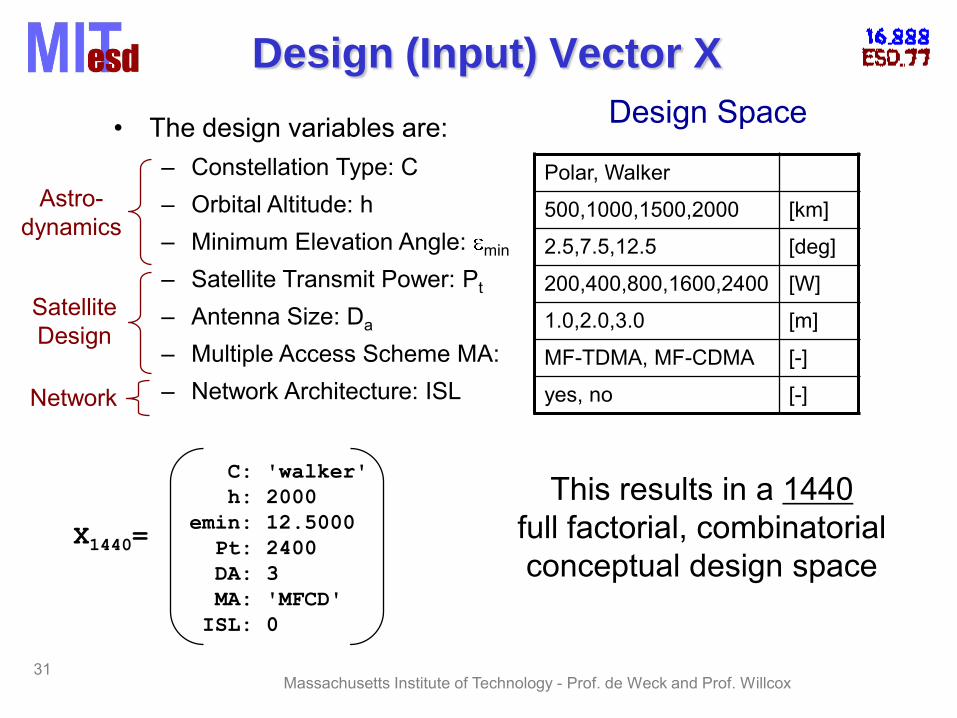
Design (Input) Vector X
• The design variables are:– Constellation Type: C– Orbital Altitude: h– Minimum Elevation Angle: min
– Satellite Transmit Power: Pt
– Antenna Size: Da
– Multiple Access Scheme MA:– Network Architecture: ISL
Design Space
Polar, Walker
500,1000,1500,2000 [km]
2.5,7.5,12.5 [deg]
200,400,800,1600,2400 [W]
1.0,2.0,3.0 [m]
MF-TDMA, MF-CDMA [-]
yes, no [-]
This results in a 1440full factorial, combinatorialconceptual design space
Astro-dynamics
SatelliteDesign
C: 'walker'
h: 2000
emin: 12.5000
Pt: 2400
DA: 3
MA: 'MFCD'
ISL: 0
X1440=
Network

32Massachusetts Institute of Technology - Prof. de Weck and Prof. Willcox
Objective Vector (Output) J
• Performance (fixed)– Data Rate per Channel: R=4.8 [kbps]– Bit-Error Rate: pb=10-3
– Link Fading Margin: 16 [dB]
• Capacity– Cs: Number of simultaneous duplex channels– Clife: Total throughput over life time [min]
• Cost– Lifecycle cost of the system (LCC [$]), includes:
• Research, Development, Test and Evaluation (RDT&E)• Satellite Construction and Test• Launch and Orbital Insertion• Operations and Replenishment
– Cost per Function, CPF [$/min]
Consider
Cs: 1.4885e+005
Clife: 1.0170e+011
LCC: 6.7548e+009
CPF: 6.6416e-002
J1440=

33Massachusetts Institute of Technology - Prof. de Weck and Prof. Willcox
Multidisciplinary Simulator Structure
Constellation
SatelliteNetwork
LinkBudget
Spacecraft CostLaunchModule
Capacity
InputVector
ConstantsVector
OutputVector
x p
J
satm
Note: Only partial input-output relationships shown
min,h
,T p nGWspotn
sRsC
LCC
, ,t aP D MA
ISL
satm
LV
satm Satellite MassT Number of Satellitesp Number of orbital planes
spotn Number of spot beamsnGW Number of gatewaysLV Launch vehicle selection

34Massachusetts Institute of Technology - Prof. de Weck and Prof. Willcox
Governing Equations
a) Physics-Based Models RTLkL
GPG
N
E
sys.add.space
tr
0
bEnergy per bit over noise ratio:
(Link Budget)
b) Empirical Models
(Spacecraft)
0.51
38 0.14sat t propm P m
Scaling modelsderived from
FCC database

35Massachusetts Institute of Technology - Prof. de Weck and Prof. Willcox
Benchmarking
Benchmarking is the process of validating a model or simulationby comparing the predicted response against reality.
Benchmarking Result 1: Simultaneous channels of the
constellation
020,00040,00060,00080,000
100,000120,000140,000
1 2
Iridium and Globalstar
Nu
mb
er
of
sim
ult
an
eo
us c
han
nels
of
the c
on
ste
llati
on
actual or planned
simulated
Iridium Globalstar
Benchmarking Result 3: Satellite mass
0.0200.0400.0600.0800.0
1,000.01,200.01,400.0
1 2 3 4
Iridium, Globalstar, Orbcomm, and
SkyBridge
Sate
llit
e m
ass (
kg
)
actual or planned
simulated
Iridium Globalstar Orbcomm SkyBridge
Benchmarking Result 2: Lifecycle cost
0.00
1.00
2.00
3.00
4.00
5.00
6.00
1 2
Iridium and Globalstar
Lif
ecycle
co
st
(billio
n $
)
actual or planned
simulated
Iridium Globalstar
Benchmarking Result 4: Number of satellites in the constellation
010203040506070
1 2 3 4
Iridium, Globalstars, Orbcomm, and SkyBridge
Nu
mb
er
of
sate
llit
es in
th
e
co
nste
llati
on
actual or planned
simulated
Iridium Globalstar Orbcomm SkyBridge

36Massachusetts Institute of Technology - Prof. de Weck and Prof. Willcox
Simulation Results
Global Capacity Cs [# of duplex channels]
103
104
105
106
107
100
101
Life
cycl
e C
ost [
B$]
Iridium simulated
Iridium actual
Globalstar simulated
Globalstar actual
Pareto Front

37Massachusetts Institute of Technology - Prof. de Weck and Prof. Willcox
Simple Example
(Prep for Homework A1)

38Massachusetts Institute of Technology - Prof. de Weck and Prof. Willcox
Example: Communications Satellite
Design of a geosynchronous communications satellite
Design problem (Define D.V., objectives, constraints): How should antenna (D) and solar array (A) be sized for a given orbital period (p) such that a data rate requirement (R=Rreq) is met, while minimizing cost (C) ?
EarthSatellite
Ground Station
Main LobeAntenna Bus Solar
Panelr = 6378 [km]
S
D A
ηt
ηAPbus
θ
Image by MIT OpenCourseWare.

39Massachusetts Institute of Technology - Prof. de Weck and Prof. Willcox
Comsat: Governing Equations
Communications:
Power:
Cost:
Orbits:
cos [W]t A o avg busP A W P
2
2 [bps]
16
tt
DR P
S
Objective: min C , Constraint: R>=Rreq
(link budget)
3/ 241.66 10 [min]Ep S r
22500 12000 1 +100 [$]busC D A P
(orbital period)
(power budget)
(cost budget)Bus Engineering: 10 [W]bus tP P

40Massachusetts Institute of Technology - Prof. de Weck and Prof. Willcox
Comsat: Master Table
D Antenna Diameter [m] design var.A Solar Panel Area [m2] design var.p Orbital Period [min] design var.R Data Rate [bps] constraintC Cost [$] objectivePt Transmitter Power [W] dependent
Pbus Bus Power [W] dependent
a Sun incidence angle [deg] parameter
a,t, array/xmit efficiencies [%] parameterS Orbital altitude [km] dependent
constant [-] parameterWo Solar constant [W/m2] parameter

41Massachusetts Institute of Technology - Prof. de Weck and Prof. Willcox
ComSat Block Diagram
CostD
A
p
C
InputVector
Orbits Comm R
C
R
OutputVector
Power
Bus
p S
busP
tP
A
D
D
BLOCK DIAGRAM
x
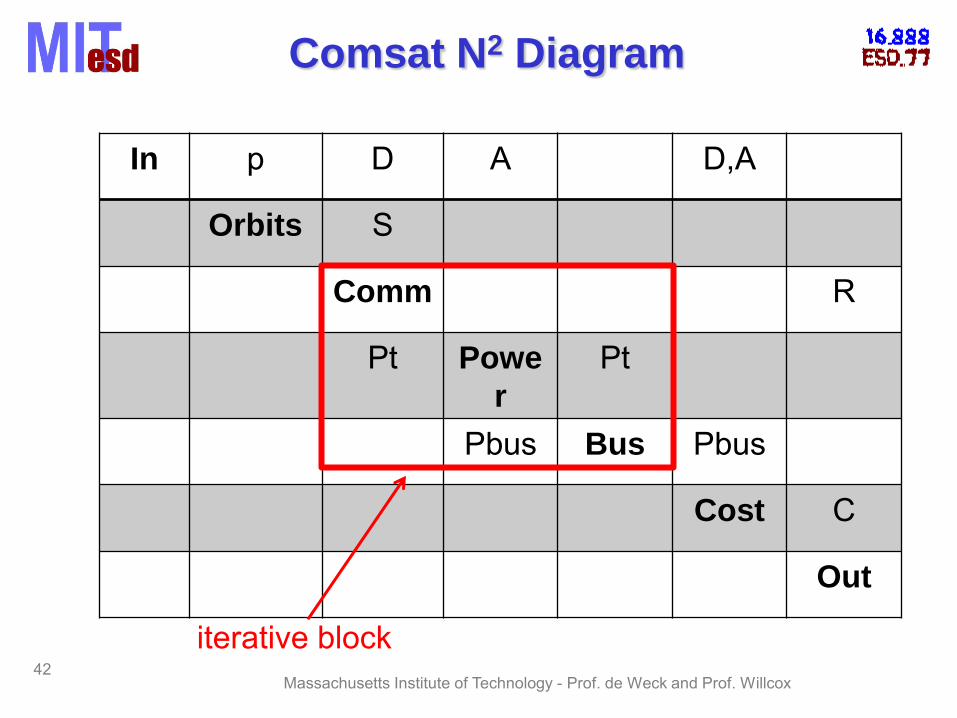
Comsat N2 Diagram
42Massachusetts Institute of Technology - Prof. de Weck and Prof. Willcox
In p D A D,A
Orbits S
Comm R
Pt Powe
r
Pt
Pbus Bus Pbus
Cost C
Out
iterative block

43Massachusetts Institute of Technology - Prof. de Weck and Prof. Willcox
Computational
Implementation
44Massachusetts Institute of Technology - Prof. de Weck and Prof. Willcox
Computational Issues
• Computer technologies have been changing the environment of engineering design - enabling MDO
• Hardware: Advances in processor speed, memory and storage
• Software: Powerful disciplinary analysis and simulation programs (e.g. Nastran, Fluent …)
• This also creates new difficulties: Most activities involve stand-alone programs and many engineers spend 50-80% of their time organizing data and moving it back-and-forth between applications
Data must be shared between disciplines more easily
45Massachusetts Institute of Technology - Prof. de Weck and Prof. Willcox
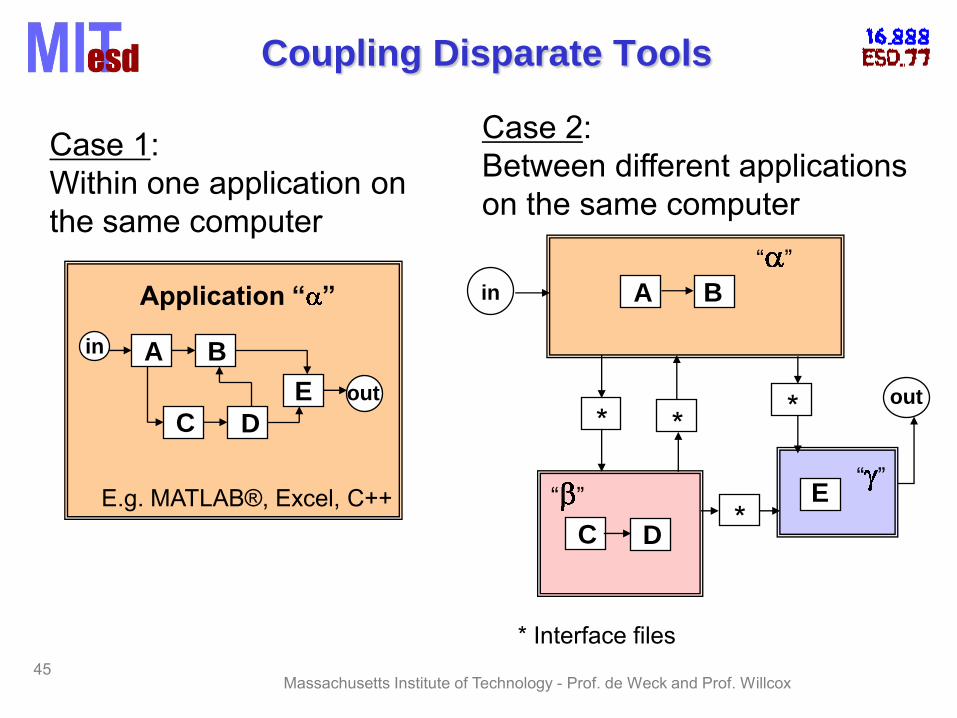
Coupling Disparate Tools
Application “ ”
E.g. MATLAB®, Excel, C++
Case 1: Within one application onthe same computer
Case 2: Between different applications on the same computer
BA
C D
E
in
out
BA
C
out
D
Bin
E
* Interface files
“ ”
“ ”“ ”
* **
*

46Massachusetts Institute of Technology - Prof. de Weck and Prof. Willcox
Case 3: In a LAN or WAN environment
Implementation and Ownership (II)
Owner A
Owner B
Owner CBA
C
out
D
Bin
E
“ ”
“ ”“ ”
Owner G
#
Design Team Site
#
#
Map
# Server

47Massachusetts Institute of Technology - Prof. de Weck and Prof. Willcox
Modeling-Simulation Environments• Integrated Modeling & Simulation
– Write functions and integrate via Master script– MATLAB, Mathematica® are popular environments
• ICEMaker– Developed at Caltech/JPL– linked spreadsheets (client server)
• DOME (MIT) - CO (Oculus)– DOME based peer-peer system– API’s into numerous Engineering applications
• FIPER (Simulia – Dassault Systems)– Client-server enterprise system– Targeted at the corporate environment
• PHX Model Center– Phoenix Integration – Flagship Product– Desktop Integration Environment

48Massachusetts Institute of Technology - Prof. de Weck and Prof. Willcox
Lecture Summary
• Follow a logical model & simulation development process, don’t forget
benchmarking• Decomposition is crucial in order to facilitate
code integration and coupling• N2/DSM Matrix is useful tool to organize data• Minimize the number of feedback loops

49Massachusetts Institute of Technology - Prof. de Weck and Prof. Willcox
N2 and DSM References
• Rogers, James L.: DeMAID/GA User's Guide - Design Manager's Aid for Intelligent Decomposition with a Genetic Algorithm, April 1996, NASA TM – 110241.
• Steward, D.V., 1981, Systems Analysis and Management: Structure, Strategy, and Design, New York: Petrocelli.
• D.V. Steward. “Partitioning and Tearing Systems of Equations”, SIAM Journal of Numerical Analysis. Ser.B, vol.2, no.2, 1965, pp.345-365
• de Weck, O. L. and Chang D., ”Architecture Trade Methodology for LEO Personal Communication Systems “, 20th International Communications Satellite Systems Conference, Paper No. AIAA-2002-1866, Montréal, Québec, Canada, May 12-15, 2002
• Ulrich, K.T., and S.D. Eppinger, 1995, Product Design and Development , McGraw-Hill.
• The Design Structure Matrix Website, http://www.dsmweb.org/

MIT OpenCourseWarehttp://ocw.mit.edu
ESD.77 / 16.888 Multidisciplinary System Design OptimizationSpring 2010
For information about citing these materials or our Terms of Use, visit: http://ocw.mit.edu/terms.


![Untitled-1 [] · 2018. 3. 27. · Hatve Yüksekligi 1,4/ / l, 4/ / l, 4/ 1,6/ / l, 4/ / 1,4/ / l, 4/ 1,611 / 1,4/ 1,4/ / Kod 55300500 55300600 55300700 55300800 55300900 55301000](https://static.documents.pub/doc/80x56/60c24b180629fe1226743c36/untitled-1-2018-3-27-hatve-yksekligi-14-l-4-l-4-16-l-4.jpg)


![Stereoconvergent [1,2]- and [1,4]-Wittig Rearrangements of ...[1,4]-Wittig rearrangements to the corresponding α-silylcyclo-pentenols or (α-cyclopropyl)acylsilanes favor the [1,4]-path-way](https://static.documents.pub/doc/80x56/60e13dec732285091278ceb6/stereoconvergent-12-and-14-wittig-rearrangements-of-14-wittig-rearrangements.jpg)


