Page 1
7/27/2019 ese32.pdf
http://slidepdf.com/reader/full/ese32pdf 1/15
PERSPECTIVES
Next generation biorefineries will solve the food, biofuels,and environmental trilemma in the energy – food – waternexus
Y.-H Percival Zhang1,2,3,4
1Biological Systems Engineering Department, Virginia Tech, 304 Seitz Hall, Blacksburg, Virginia, 240612Institute for Critical Technology and Applied Science (ICTAS), Virginia Tech, Blacksburg, Virginia, 240613Gate Fuels Inc., 2200 Kraft Drive, Suites 1200B, Blacksburg, Virginia, 240604Cell-Free Bioinnovations Inc., Blacksburg, Virginia, 24060
Keywords
Artificial photosynthesis, biofuels, biomass
role, biorefineries, energy – food – water nexus,
food – biofuels – environmental trilemma, food
security.
Correspondence
Yi-Heng Percival Zhang, Biological Systems
Engineering Department, Virginia Tech,
304 Seitz Hall, Blacksburg, VA 24061.
Tel: 001-540-231-7414;
Fax: 001-540-231-3199;
E-mail: [email protected]
Funding Information
This study was supported by the Biological
Systems Engineering Department of Virginia
Tech, the CALS Biodesign and Bioprocessing
Research Center, and Shell GameChangerProgram.
Received: 16 November 2012; Revised: 25
February 2013; Accepted: 26 February 2013
Energy Science and Engineering 2013; 1(1): 27–41
doi: 10.1002/ese3.2
Abstract
The future roles of biomass and carbohydrate for meeting needs of food/feed,
renewable materials, and transportation fuels (biofuels) remain controversial
due to numerous issues, such as increasing food and feed needs, constraints of natural resources (land, water, phosphate, biomass, etc.), and limitations of nat-
ural photosynthesis, as well as competing energy conversion pathways and tech-
nologies. The goal of this opinion article is to clarify the future roles of
biomass and biorefineries using quantitative data other than adjective words. In
most scenarios, human beings could have enough biomass resource from plant
photosynthesis for meeting the three goals at the same time: feeding 9 billion
people, providing renewable materials, and producing transportation biofuels
that could replace nearly all fossil fuel-based liquid fuels used in the land trans-
portation in 2050. Land transport means will pass through transitions from
internal combustion engines plus liquid fuels, to hybrid systems, to hydrogen
fuel cell vehicles (FCVs), while battery electric vehicles (BEVs) could play a
minor role. Next generation biorefineries based on artificial photosynthesis fea-turing ultra-high energy efficiency and low-water consumption could produce a
large amount of carbohydrate and/or other biocommodities from hydrogen/
electricity and CO2. In conclusion, it is time to develop next generation biore-
fineries, which will efficiently utilize nonfood biomass for the coproduction of
multiple products from biofuels, biochemicals, to food/feed, and even store
electricity/hydrogen by fixing CO2 to carbon-containing chemicals and biofuels.
Next generation biorefineries will address the food, biofuels, and environment
trilemma at the same time.
Introduction
Modern civilization is the product of incessant utilization
of natural resources on large scales: fossil fuels (e.g., oil,
gas, and coal), renewable energy (e.g., biomass, wind, and
solar), water, and land [1 – 4]. Among finite fossil fuels,
cheap crude oil will run out first within next several dec-
ades [5, 6]. Therefore, it is a great scientific and engineer-
ing challenge to replace cheap oil with something that can
be produced from renewable resources [7]. Feeding the
world population from 7 billion now to 9 billion in 2050
[8] poses another challenge by considering constraints of
natural resources – limited farming land supplies and
emerging water crisis [9 – 11]. In addition, food security is
closely related to issues of food distribution, geopolitical
stability, cost volatility, and functional nutrition [12],
which are not discussed here. Although water is renewable,
the collective fresh water demand of human beings could
exceed foreseen supply by ca. 40% in 2030 [13]. This
water shortage could escalate food prices, disrupt energy
production, constrict trade, create refugees, and under-
mine authority [13].
Biomass is defined as biological materials. Nearly, all
biomass (i.e., plant, animal, and microbial) originates
ª 2013 The Author. Energy Science & Engineering published by the Society of Chemical Industry and John Wiley & Sons Ltd.
This is an open access article under the terms of the Creative Commons Attribution License, which permits use,
distribution and reproduction in any medium, provided the original work is properly cited.
27
Page 2
7/27/2019 ese32.pdf
http://slidepdf.com/reader/full/ese32pdf 2/15
from CO2 fixation by natural photosynthesis. It has
played important roles in human societies: (i) cereals
from cultivated grains and grass from managed pastures
are food and feed sources, respectively, accounting for
approximately 2.0% of terrestrial net primary production
(NPP); (ii) approximately, 2.3% of terrestrial biomass is
directly burned for cooking and heating, especially indeveloping countries, or eventually converted to biogas as
a secondary energy carrier; (iii) wood and other cellulosic
materials accounting for approximately 1% of terrestrial
NPP is used as construction materials and to make paper
and renewable polymers (e.g., cellophane, rayon); and
(iv) approximately, 0.2% of terrestrial NPP (e.g., corn
kernels, sugarcane, and vegetable oil) is converted to
liquid transportation biofuels in first generation biorefin-
eries. It is important to retain biomass’ irreplaceable roles
as food/feed, construction materials, papers, and renew-
able polymers and then investigate whether there will be
enough extra biomass resource to meet other needs.
Biofuels are defined as a secondary energy used in the
transport sector, which is derived mainly from biomass
[14 – 16]. First-generation biofuels include ethanol pro-
duced from sugarcane and starch-rich biomass (e.g., corn
kernels, wheat, and aged cereals) and biodiesel produced
from vegetable oils and animal fats. First-generation bio-
fuels produced from food source receive severe criticisms
because their impacts on the transportation fuels are
minimal mainly due to limited feedstock supplies and
their production has a minimum effect on a reduction of
net greenhouse gas emissions [17, 18]. For example, it is
estimated that replacing 5% of energy consumption
through first generation biofuels could double waterwithdrawals for agriculture [13]. Clearly, the global pro-
duction of first generation biofuels is not sustainable and
is endangering current agricultural systems. Second-gen-
eration biofuels are produced mainly from nonfood bio-
mass, such as cellulosic ethanol, butanol, fatty acid ethyl
esters, methane, hydrogen, methanol, dimethylether,
Fischer-Tropsch diesel, and bioelectricity [4, 19]. Because
there are so many different energy conversion pathways
(i.e., biological, thermochemical, and their hybrids) to
converting nonfood biomass to a large variety of poten-
tial biofuels, which biofuels will become short-, middle-
and long-term transportation fuels is a matter of
vigorous debate [4, 19, 20]. Additionally, the future role
of biomass in the nexus of energy, water, and food is not
clear.
This article provides much-needed clarity on the desir-
ability and feasibility of next generation biorefineries that
will utilize nonfood biomass resource and/or even fix
CO2 through artificial photosynthesis. Such biorefineries
will meet needs of food/feed and biofuels while not
endangering water security and maintaining biodiversity.
Appraisal facts
It is necessary to provide some quantitative data pertain-
ing to energy production and consumption, resource
availability, and constraints of natural resources and bio-
systems before the potential impacts of next generation
biorefineries are predicted.
Energy status quo
Generally speaking, energy demands determine energy
production and conversion [4]. Typical energy systems
are comprised of three basic components: primary (natu-
ral) energy sources, their conversion to secondary energies
(i.e., #1 and #2 intermediates), and end applications from
food/feed to energy to materials. In the past human socie-
ties, the simplest systems utilized one or two of energy
sources (e.g., biomass) through few kinds of inefficient
energy conversion for meeting basic needs – food/feed
and cooking/heating. In contrast, modern societies can
utilize numerous primary sources (e.g., fossil fuels, insola-
tion, nuclear, and wind energy), convert them to a few
energy carriers (e.g., electricity, hydrogen, and liquid
fuels) with enhanced energy conversion efficiencies, and
apply them in a myriad of ways to power complex high-
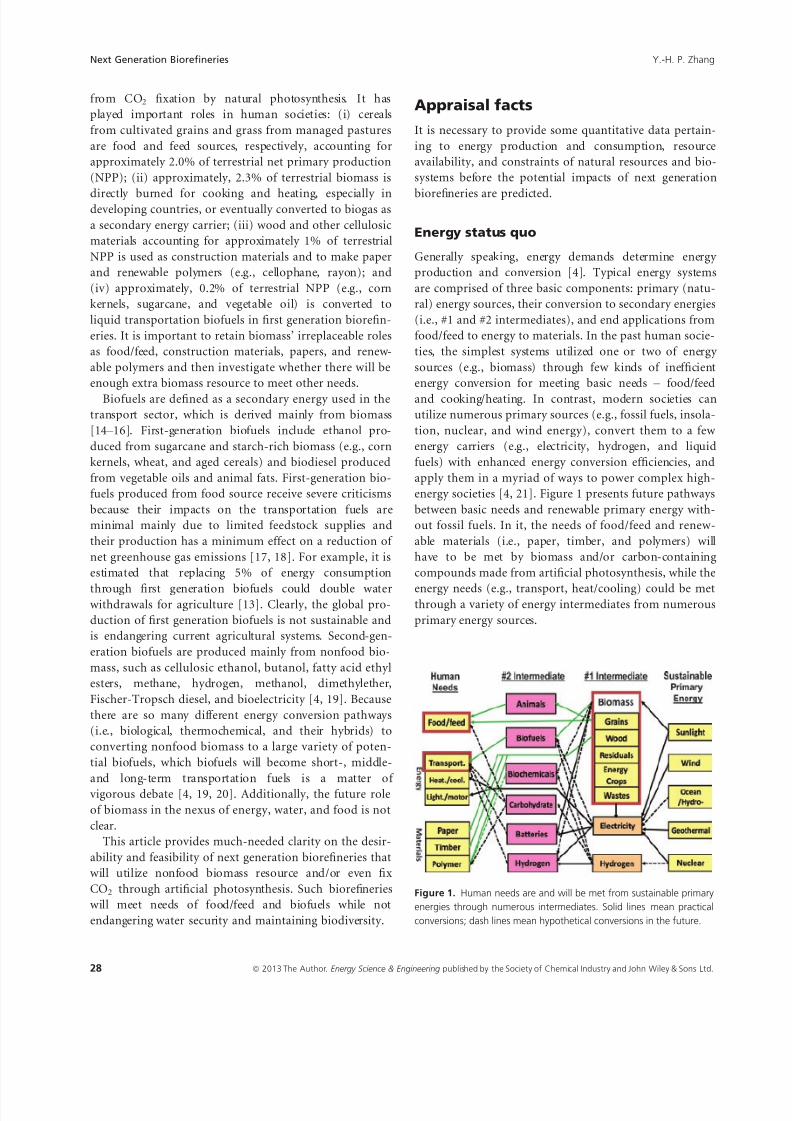
energy societies [4, 21]. Figure 1 presents future pathways
between basic needs and renewable primary energy with-
out fossil fuels. In it, the needs of food/feed and renew-
able materials (i.e., paper, timber, and polymers) will
have to be met by biomass and/or carbon-containing
compounds made from artificial photosynthesis, while the
energy needs (e.g., transport, heat/cooling) could be metthrough a variety of energy intermediates from numerous
primary energy sources.
Figure 1. Human needs are and will be met from sustainable primary
energies through numerous intermediates. Solid lines mean practical
conversions; dash lines mean hypothetical conversions in the future.
28 ª 2013 The Author. Energy Science & Engineering published by the Society of Chemical Industry and John Wiley & Sons Ltd.
Next Generation Biorefineries Y.-H. P. Zhang
Page 3
7/27/2019 ese32.pdf
http://slidepdf.com/reader/full/ese32pdf 3/15
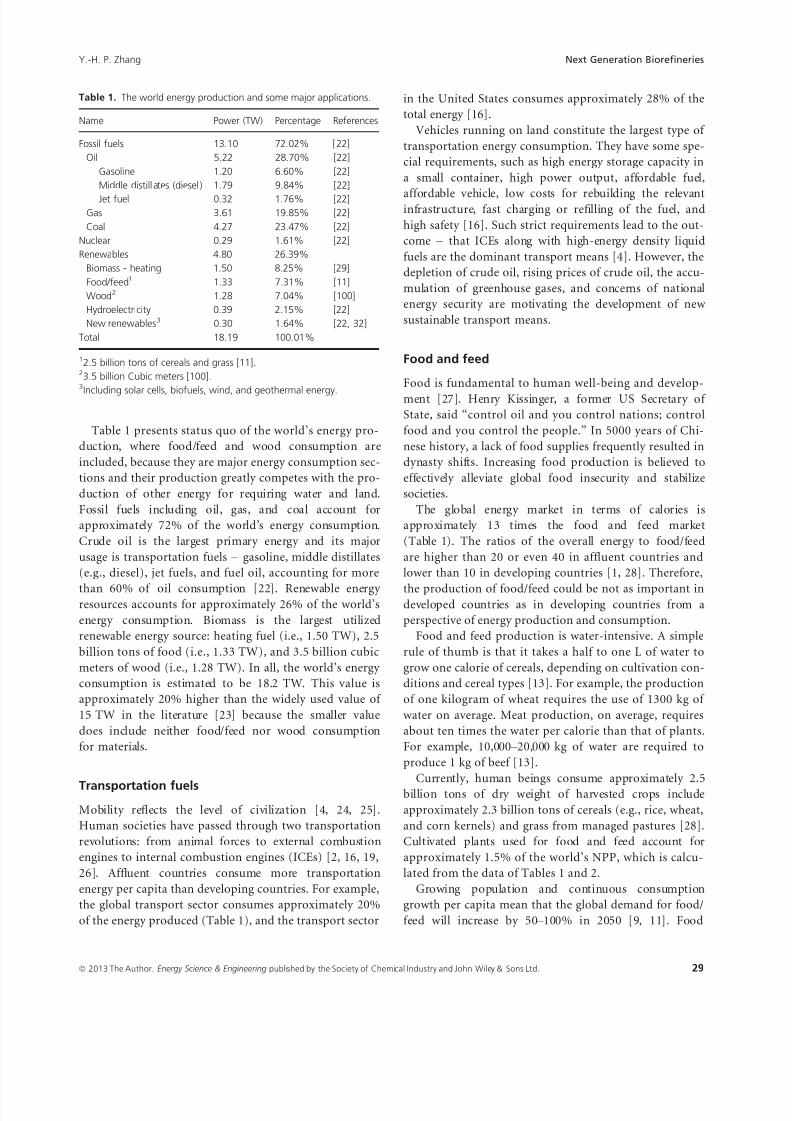
Table 1 presents status quo of the world’s energy pro-
duction, where food/feed and wood consumption are
included, because they are major energy consumption sec-
tions and their production greatly competes with the pro-
duction of other energy for requiring water and land.
Fossil fuels including oil, gas, and coal account for
approximately 72% of the world’s energy consumption.
Crude oil is the largest primary energy and its major
usage is transportation fuels – gasoline, middle distillates
(e.g., diesel), jet fuels, and fuel oil, accounting for more
than 60% of oil consumption [22]. Renewable energy resources accounts for approximately 26% of the world’s
energy consumption. Biomass is the largest utilized
renewable energy source: heating fuel (i.e., 1.50 TW), 2.5
billion tons of food (i.e., 1.33 TW), and 3.5 billion cubic
meters of wood (i.e., 1.28 TW). In all, the world’s energy
consumption is estimated to be 18.2 TW. This value is
approximately 20% higher than the widely used value of
15 TW in the literature [23] because the smaller value
does include neither food/feed nor wood consumption
for materials.
Transportation fuels
Mobility reflects the level of civilization [4, 24, 25].
Human societies have passed through two transportation
revolutions: from animal forces to external combustion
engines to internal combustion engines (ICEs) [2, 16, 19,
26]. Affluent countries consume more transportation
energy per capita than developing countries. For example,
the global transport sector consumes approximately 20%
of the energy produced (Table 1), and the transport sector
in the United States consumes approximately 28% of the
total energy [16].
Vehicles running on land constitute the largest type of
transportation energy consumption. They have some spe-
cial requirements, such as high energy storage capacity in
a small container, high power output, affordable fuel,
affordable vehicle, low costs for rebuilding the relevantinfrastructure, fast charging or refilling of the fuel, and
high safety [16]. Such strict requirements lead to the out-
come – that ICEs along with high-energy density liquid
fuels are the dominant transport means [4]. However, the
depletion of crude oil, rising prices of crude oil, the accu-
mulation of greenhouse gases, and concerns of national
energy security are motivating the development of new
sustainable transport means.
Food and feed
Food is fundamental to human well-being and develop-
ment [27]. Henry Kissinger, a former US Secretary of
State, said “control oil and you control nations; control
food and you control the people.” In 5000 years of Chi-
nese history, a lack of food supplies frequently resulted in
dynasty shifts. Increasing food production is believed to
effectively alleviate global food insecurity and stabilize
societies.
The global energy market in terms of calories is
approximately 13 times the food and feed market
(Table 1). The ratios of the overall energy to food/feed
are higher than 20 or even 40 in affluent countries and
lower than 10 in developing countries [1, 28]. Therefore,
the production of food/feed could be not as important indeveloped countries as in developing countries from a
perspective of energy production and consumption.
Food and feed production is water-intensive. A simple
rule of thumb is that it takes a half to one L of water to
grow one calorie of cereals, depending on cultivation con-
ditions and cereal types [13]. For example, the production
of one kilogram of wheat requires the use of 1300 kg of
water on average. Meat production, on average, requires
about ten times the water per calorie than that of plants.
For example, 10,000 – 20,000 kg of water are required to
produce 1 kg of beef [13].
Currently, human beings consume approximately 2.5
billion tons of dry weight of harvested crops include
approximately 2.3 billion tons of cereals (e.g., rice, wheat,
and corn kernels) and grass from managed pastures [28].
Cultivated plants used for food and feed account for
approximately 1.5% of the world’s NPP, which is calcu-
lated from the data of Tables 1 and 2.
Growing population and continuous consumption
growth per capita mean that the global demand for food/
feed will increase by 50 – 100% in 2050 [9, 11]. Food
Table 1. The world energy production and some major applications.
Name Power (TW) Percentage References
Fossil fuels 13.10 72.02% [22]
Oil 5.22 28.70% [22]
Gasoline 1.20 6.60% [22]
Middle distillates (diesel ) 1.79 9.84% [22]
Jet fuel 0.32 1.76% [22]
Gas 3.61 19.85% [22]
Coal 4.27 23.47% [22]
Nuclear 0.29 1.61% [22]
Renewables 4.80 26.39%
Biomass - heating 1.50 8.25% [29]
Food/feed1 1.33 7.31% [11]
Wood2 1.28 7.04% [100]
Hydroelectricity 0.39 2.15% [22]
New renewables3 0.30 1.64% [22, 32]
Total 18.19 100.01%
12.5 billion tons of cereals and grass [11].23.5 billion Cubic meters [100].3
Including solar cells, biofuels, wind, and geothermal energy.
ª 2013 The Author. Energy Science & Engineering published by the Society of Chemical Industry and John Wiley & Sons Ltd. 29
Y.-H. P. Zhang Next Generation Biorefineries
Page 4
7/27/2019 ese32.pdf
http://slidepdf.com/reader/full/ese32pdf 4/15
security is inextricably linked to growing pressure on
land, water, and energy resources [10]. Recent events of
drought, large-scale land investments, and high energy
prices underscore the world’s food security. In addition,
issues of food distribution, geopolitical stability, cost vol-atility, and functional nutrition could lead to hunger in
some areas [12].
Natural resources
Renewable energy
Three major types of renewable energies are solar radia-
tion, geothermal energy, and tidal energy. The six trans-
formations of solar radiation are wind, wind-generated
ocean waves, ocean currents, hydro energy, thermal differ-
ence between the ocean’s surface and deep water, and
biomass [29, 30]. Not all renewable energy sources can beutilized. For example, very low energy concentration
(nonpoint) energies in terms of W/m2, such as ocean
thermal differences, currents, and biomass in ocean, are
difficult to collect and utilize economically [4]. Addition-
ally, some fraction of energy resources cannot be utilized
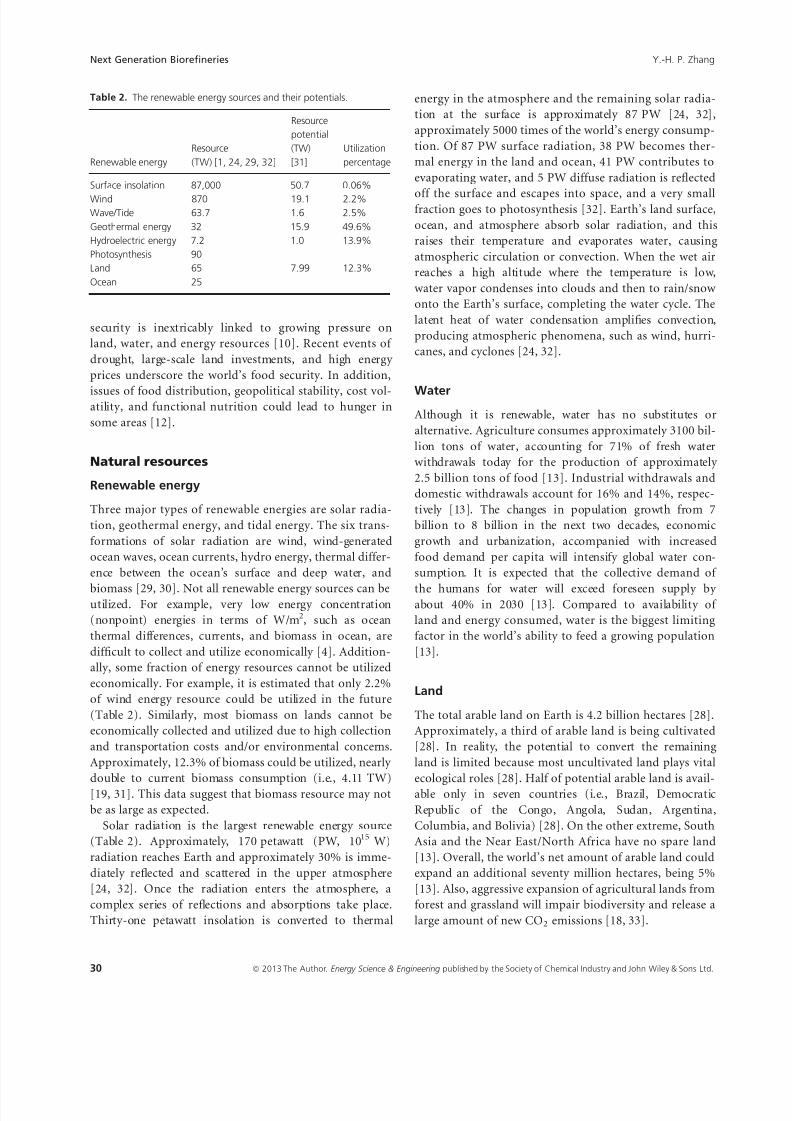
economically. For example, it is estimated that only 2.2%
of wind energy resource could be utilized in the future
(Table 2). Similarly, most biomass on lands cannot be
economically collected and utilized due to high collection
and transportation costs and/or environmental concerns.
Approximately, 12.3% of biomass could be utilized, nearly
double to current biomass consumption (i.e., 4.11 TW)
[19, 31]. This data suggest that biomass resource may not
be as large as expected.
Solar radiation is the largest renewable energy source
(Table 2). Approximately, 170 petawatt (PW, 1015 W)
radiation reaches Earth and approximately 30% is imme-
diately reflected and scattered in the upper atmosphere
[24, 32]. Once the radiation enters the atmosphere, a
complex series of reflections and absorptions take place.
Thirty-one petawatt insolation is converted to thermal
energy in the atmosphere and the remaining solar radia-
tion at the surface is approximately 87 PW [24, 32],
approximately 5000 times of the world’s energy consump-
tion. Of 87 PW surface radiation, 38 PW becomes ther-
mal energy in the land and ocean, 41 PW contributes to
evaporating water, and 5 PW diffuse radiation is reflected
off the surface and escapes into space, and a very smallfraction goes to photosynthesis [32]. Earth’s land surface,
ocean, and atmosphere absorb solar radiation, and this
raises their temperature and evaporates water, causing
atmospheric circulation or convection. When the wet air
reaches a high altitude where the temperature is low,
water vapor condenses into clouds and then to rain/snow
onto the Earth’s surface, completing the water cycle. The
latent heat of water condensation amplifies convection,
producing atmospheric phenomena, such as wind, hurri-
canes, and cyclones [24, 32].
Water
Although it is renewable, water has no substitutes or
alternative. Agriculture consumes approximately 3100 bil-
lion tons of water, accounting for 71% of fresh water
withdrawals today for the production of approximately
2.5 billion tons of food [13]. Industrial withdrawals and
domestic withdrawals account for 16% and 14%, respec-
tively [13]. The changes in population growth from 7
billion to 8 billion in the next two decades, economic
growth and urbanization, accompanied with increased
food demand per capita will intensify global water con-
sumption. It is expected that the collective demand of
the humans for water will exceed foreseen supply by about 40% in 2030 [13]. Compared to availability of
land and energy consumed, water is the biggest limiting
factor in the world’s ability to feed a growing population
[13].
Land
The total arable land on Earth is 4.2 billion hectares [28].
Approximately, a third of arable land is being cultivated
[28]. In reality, the potential to convert the remaining
land is limited because most uncultivated land plays vital
ecological roles [28]. Half of potential arable land is avail-
able only in seven countries (i.e., Brazil, Democratic
Republic of the Congo, Angola, Sudan, Argentina,
Columbia, and Bolivia) [28]. On the other extreme, South
Asia and the Near East/North Africa have no spare land
[13]. Overall, the world’s net amount of arable land could
expand an additional seventy million hectares, being 5%
[13]. Also, aggressive expansion of agricultural lands from
forest and grassland will impair biodiversity and release a
large amount of new CO2 emissions [18, 33].
Table 2. The renewable energy sources and their potentials.
Renewable energy
Resource
(TW) [1, 24, 29, 32]
Resource
potential
(TW)
[31]
Utilization
percentage
Surface insolation 87,000 50.7 0.06%
Wind 870 19.1 2.2%
Wave/Tide 63.7 1.6 2.5%
Geothermal energy 32 15.9 49.6%
Hydroelectric energy 7.2 1.0 13.9%
Photosynthesis 90
Land 65 7.99 12.3%
Ocean 25
30 ª 2013 The Author. Energy Science & Engineering published by the Society of Chemical Industry and John Wiley & Sons Ltd.
Next Generation Biorefineries Y.-H. P. Zhang
Page 5
7/27/2019 ese32.pdf
http://slidepdf.com/reader/full/ese32pdf 5/15
The issues of energy, water, and land used for the food
production have been interwoven ranging from ensuring
access to services, to environmental impacts, to price vol-
atility [34]. Systematic analysis and paradigm-shifting
solutions are highly required to address challenges of the
energy – food – water nexus.
Natural photosynthesis
Natural photosynthesis comprises a set of photochemical
and redox reactions, called the “light reactions” and a
sequence of enzymatic synthesis reactions, called “light-
independent reactions” [17, 35 – 37]. In the light reactions,
photosynthetic pigments (e.g., chlorophyll molecules)
absorb approximately 47% of the light of the sun called
“photosynthetic active radiation,” but do not include
green light, UV, and IR irradiation [37, 38]. The adsorbed
energy is transferred to the reaction centers where the pri-
mary charge separation and transmembrane transport of
electrons occurs. Subsequent electron- and proton-trans-
fer reactions lead to the synthesis of ATP from ADP and
inorganic phosphate and NADPH synthesis from NADP+.
In theory, eight photons are required to reduce two mole-
cules of NADP+ to NADPH. In reality, approximately 9.4
photons are consumed, that is, 11.8% of the energy of
sunlight can be converted to the form of NADPH, which
is close to the efficiency limit of the photosynthetic pro-
duction of biohydrogen under optimal insolation [17,
39]. Light reactions have the highest photosynthesis effi-
ciency at relatively low light intensities. The efficiency is
saturated at 20% of full sunlight and decreases greatly at
high light intensities. In addition, high light intensitieslead to photo damage of a central protein subunit of the
photosynthetic apparatus. The energy efficiency of light-
independent reactions are limited by (i) low chemical
synthesis efficiency of the enzyme RuBisCO for taking up
low-concentration CO2 from air and removing 2-phos-
phoglycolate; (ii) availability of sufficient amounts of
water that is not met during much of the day and of fer-
tilizers, and (iii) respiration of living organisms [17, 38,
40]. Light reactions operate on very short time scales
from femtoseconds to milliseconds, while light-indepen-
dent reactions operate over a timespan of seconds to
hours [35, 36]. As a result, natural plant photosynthesis
has low theoretical energy efficiencies from solar energy
to chemical energy of 4.6 and 6.0% for C3 and C4 plants,
respectively [38]. Although global efficiency of plant pho-
tosynthesis is 0.2%, the global primary biomass produc-
tion is approximately five times the world’s energy
consumption (Tables 1 and 2).
Best energy efficiencies for well-fertilized and well-
watered crops are between 2% and 3% [28]. In the past
decades mainly due to the green revolution, yields of
crops have increased by approximately three times [11].
Now global means of corn, wheat, and rice are 3.5, 2.0,
and 2.5 ton/ha, respectively [28]. The highest corn, wheat,
and rice harvest records are 22, 15.2, and 15.2 ton/ha, but
such high crop productivities are achieved at the costs of
high energy inputs, such as fertilizers, insecticides, and
water [28]. As crop yields increases, the ratio of photo-synthetic energy captured to energy spent on crop cultiva-
tion has decreased [41]. For example, ca. 50% fertilizers
or even 70% used for cultivating high-yield crops in the
United States and China cannot be utilized, resulting in
serious nonpoint water pollution from farmland [42].
Therefore, it raises a challenge: how to increase crop
yields while simultaneously decreasing energy consump-
tion and utilizing natural resources, such as water and
phosphate, more efficiently.
Key questions to clarify
The following addresses four key questions pertaining to
the energy – food – water nexus and clarifies the roles of
next generation biorefineries in the sustainability revolu-
tion.
Could we have enough biomass to feed theworld?
There is no doubt that the production of food is more
important than the production of energy and materials.
Prior to the green revolution, the production of food was
the first priority for human beings for several thousand
years. For example, the former Soviet Union and UnitedStates investigated the production of single-cell proteins
from crude oil. When the food supplies are abundant, the
prices of food decrease greatly and the prices of crude oil
soars, the production of liquid transportation fuels (i.e.,
ethanol and biodiesel) from food sources is in practice,
especially the United States and Brazil. However, it is dis-
couraged or even prohibited to expand the production
capacity of first generation biofuels in most countries,
such as China and the European Union, mainly due to
the concern of food security.
How to meet increasing food needs is becoming a glo-
bal challenge [10, 11, 43, 44]. Because the production of
2.5 billion tons of food has utilized ~ 30% arable lands
and ~ 70% freshwater withdrawals, it is difficult to greatly
increase agricultural lands and increase water withdrawals.
Therefore, a group of scientists [9] suggests a variety of
solutions to address food security: (i) closing yield gaps
on underperforming lands, (ii) increasing agricultural
resource efficiency, and (iii) increasing food delivery by
shifting diets and reducing food waste, while halting agri-
cultural land expansion. For example, several studies find
ª 2013 The Author. Energy Science & Engineering published by the Society of Chemical Industry and John Wiley & Sons Ltd. 31
Y.-H. P. Zhang Next Generation Biorefineries
Page 6
7/27/2019 ese32.pdf
http://slidepdf.com/reader/full/ese32pdf 6/15
that about one-third to one half of food is never con-
sumed [45, 46]. For example, developing countries usually
lose more than 40% of food postharvest or during pro-
cessing, while industrialized countries often lose more
than 40% of food at the retail or consumer levels [45].
On the other hand, some plant biologists, big plant com-
panies, and policy makers promoted the genetically modi-fied (GM) crops as a future solution [47]. However, long-
term impacts of GM cereals on human health are not
clear and their wide application is in heated debates [47 –
51].
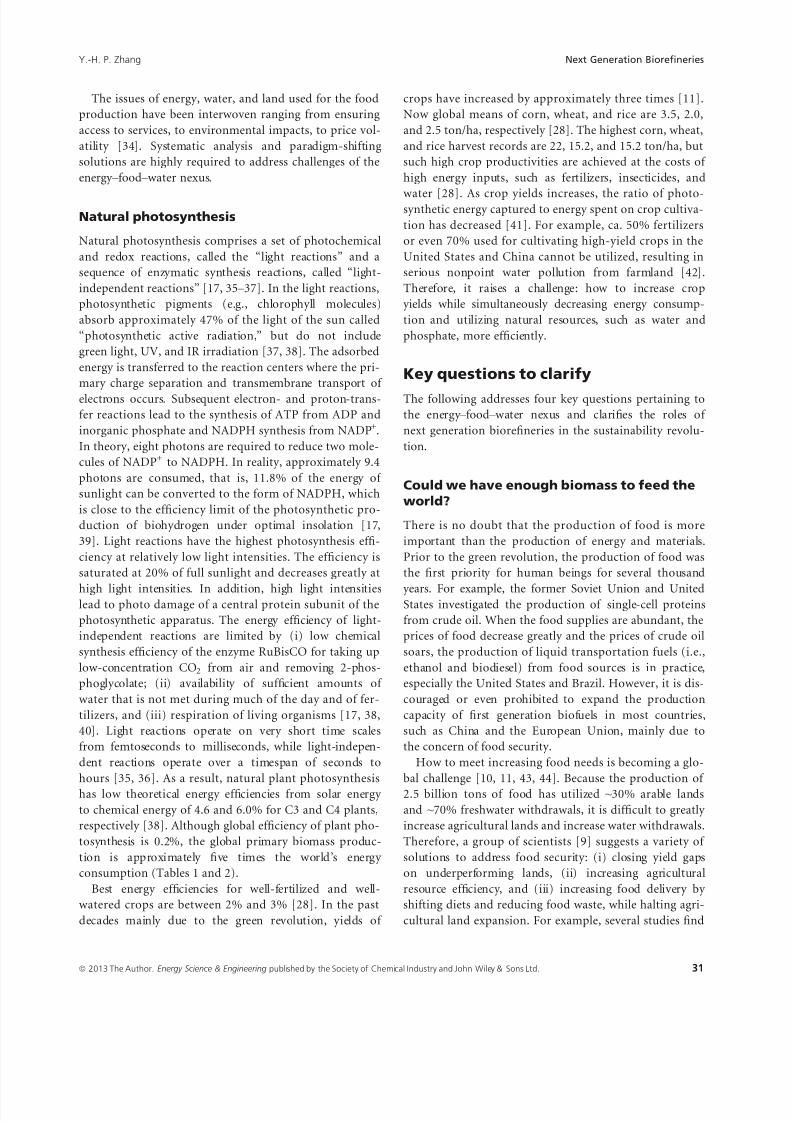
Here, a paradigm-shifting solution is proposed – enzy-
matic biotransformation of cellulose to synthetic starch in
next generation cellulosic biorefineries [52]. Via biomass
fractionating [53], a variety of multiple products could be
produced from major lignocellulosic components: cellu-
lose, hemicellulose, and lignin (Fig. 2). I demonstrate
simultaneous enzymatic biotransformation and fermenta-
tion (SEBF) that can transform cellulosic materials to
starch, ethanol, and single-cell protein in one vessel in the
presence of cascade enzymes isolated from bacterium,
fungus, and plant sources, and a typical ethanol-produc-
ing yeast. Our data showed that up to 30% of the anhy-
droglucose units in cellulose were converted to synthetic
starch; the remaining units were hydrolyzed to glucose
suitable for yeast fermentation that can produce ethanol.
This cellulose to starch biotransformation could be scaled
up by increasing the stability of two key enzymes – cello-
biose phosphorylase and starch phosphorylase because
this process does not involve any labile coenzymes (e.g.,
CoA and NAD[P]); no glucose is wasted; neither energy
nor costly reagents is added. The stability of both cellobi-ose phosphorylase [54] and starch phosphorylase [55] can
be enhanced greatly by protein engineering. Also, starch
production from cellulose mediated by enzymes rather
than GM organisms may avoid potential negative impacts
of GM cereals and prevent bioethics debate.
Cellulose resource is approximately 40 times the starch
produced by cultivated crops. Every ton of cereals har-
vested is usually accompanied by the production of at
least two tons of cellulose-rich crop residues, most of which are not utilized [56]. In addition to the use of agri-
cultural and forest residues (e.g., straws, corn stover, and
wood dust), growing dedicated bioenergy crops could
greatly increase biomass availability. Dedicated bioenergy
crops usually have much higher productivities (e.g.,
approximately 40 – 80 ton/ha/y [57 – 59]), have much
higher water utilization efficiency, require less energy-
related inputs, such as fertilizers, insecticides, and herbi-
cides, tolerate harsher environments, and could not
require annual seedling, compared to cultivated starch-
rich crops. Dedicated bioenergy crops can grow on
low-quality arable land.
The Department of Energy (DOE) of the United States
has summarized three distinct goals associated with
potential bioenergy crops: (i) maximizing the total
amount of biomass produced per hectare per year, (ii)
producing sustainable biomass with minimal inputs (e.g.,
pesticides, fertilizers, seeds, and harvesting), and (iii)
maximizing the amount of biofuels that can be produced
per unit of biomass [60]. A yield of ca. 50 dry tons per
hectare per year may be considered as a reasonable target
in an area with adequate rainfall and good soil [60],
which is about 15 – 25 times average yields of cultivated
cereals. In addition to well-studies bioenergy crops, such
as switchgrass, poplar, and Miscathanus [59, 61, 62], thisstudy recommends two new promising bioenergy plants –
bamboo and common reed. Although both of them have
been cultivated and harvested in some areas, they are
often ignored by most. Bamboos are giant woody, tree-
like, perennial evergreen grasses [58]. They have been
cultivated in East Asia and South East Asia [63]. Phyllo-
stachys pubescens (Moso bamboo) grows in a subtropical
monsoon climate but it can withstand as low as À20°C
in winter. It can be cultivated in marginal lands, such as
mountain valley, foot of mountain, and gentle slope. The
bamboo productivity is highly dependent on soil, water,
and climate conditions. The highest average yearly bio-
mass productivity during 10-year plantation is approxi-
mately 76 tons of dry culms/ha/y, which can be easily
collected [64]. Phragmites australis (common reed) is a
widespread perennial grass that grows in wetlands or near
inland water ways [57]. Although it is harvested for
thatched roofs, ropes, baskets, and pulping feedstock, the
common reed is more typically considered an invasive
weed due to its vigorous growth and difficulty of eradica-
tion. Common reed could be used as a bioenergy crept
Figure 2. Next generation biorefineries based on fractionated
lignocellulosic components for the production of multiple products for
meeting different needs from biofuels to biochemicals to food/feed.
32 ª 2013 The Author. Energy Science & Engineering published by the Society of Chemical Industry and John Wiley & Sons Ltd.
Next Generation Biorefineries Y.-H. P. Zhang
Page 7
7/27/2019 ese32.pdf
http://slidepdf.com/reader/full/ese32pdf 7/15
due to three unique features: (i) high biomass productiv-
ity (e.g., ca. 45 – 71 tons/ha/y), (ii) low inputs needed for
planting, such as water, fertilizers, and pesticides, and (iii)
removal of phosphorus- and nitrogen-containing pollu-
tants in water ways [57].
Intensive irrigation for cultivating dedicated bioenergy
crops could not be recommended. Since it consumesapproximately three and one orders of magnitude water
based on energy content more than the production of oil
from traditional oil drilling and advanced oil recovery,
respectively [13], the production of biomass is believed to
increase usage of freshwater [65, 66]. This issue has raised
concerns about the increase in water stress, particularly in
countries that are already facing water shortage [67].
Therefore, cultivating future dedicated bioenergy crops
must take in account water consumption.
In a word, the cost-effective transformation of nonfood
cellulose to starch could not only revolutionize agriculture
by promoting the cultivation of plants chosen for rapid
growth rather than those optimized for starch production
[68 – 70] but also could maintain biodiversity and mini-
mize agriculture’s environmental footprint [71]. Also,
wide implementation of cellulosic biorefineries would
decrease postharvest food loss, especially for developing
countries, so to increase overall food/feed availability
[72].
What powertrain and fuel will become thedominant transport means in the future?
A number of scenarios (Fig. 1) can and could bridge
between renewable primary energy and transportationenergy demand through four powertrain systems: (i) ICEs
and/or hybrid electric vehicles (HEVs) that burn liquid
biofuels and compressed methane [19, 73], (ii) BEVs that
run on electricity stored in rechargeable batteries, where
electricity can be generated from sun radiation, tide, geo-
thermal, wind, and nuclear energy [74], (iii) hydrogen
FCVs that run on stored hydrogen through proton
exchange membrane (PEM) fuel cells and electric motor
[73], and (iv) sugar fuel cell vehicles (SFCVs) that run on
stored sugar as a high-density hydrogen carrier based on
FCVs [25]. Powertrain systems for vehicles must meet all
of the following criteria: high energy storage capacity in a
small container, high power output, economically com-
petitive fuel, affordable vehicle, fast charging or refilling
of the fuel, and high safety [16].
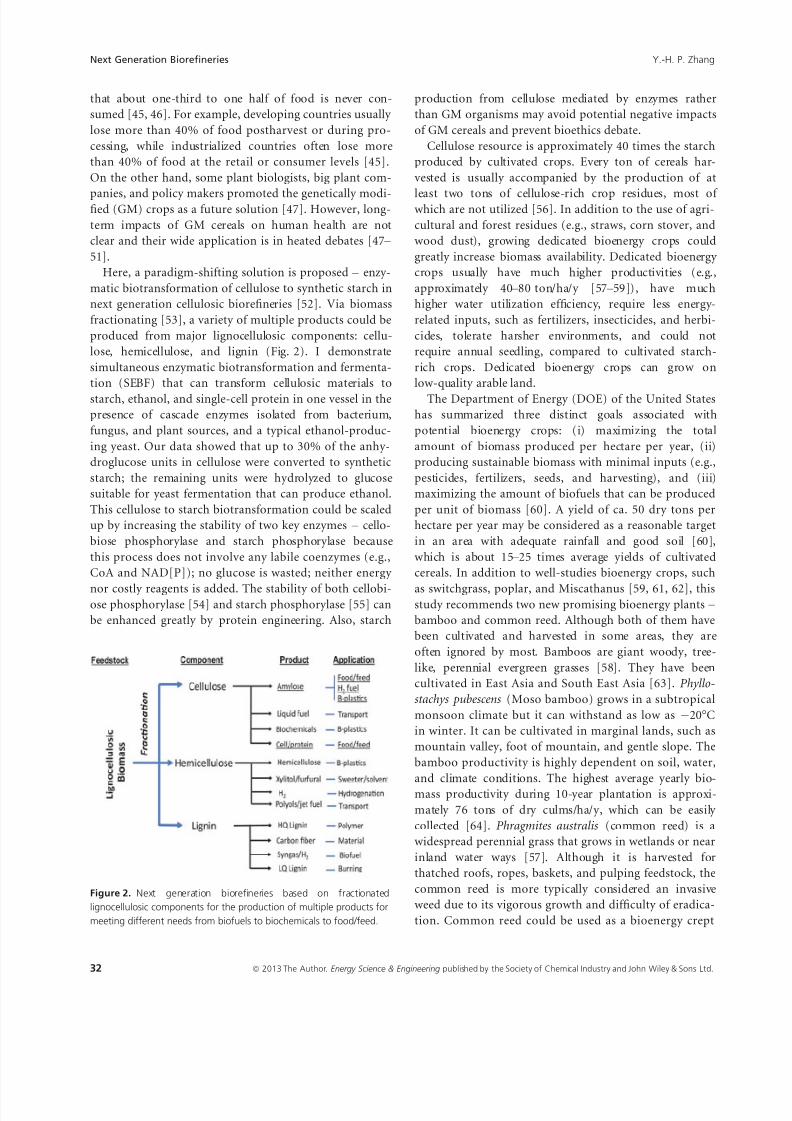
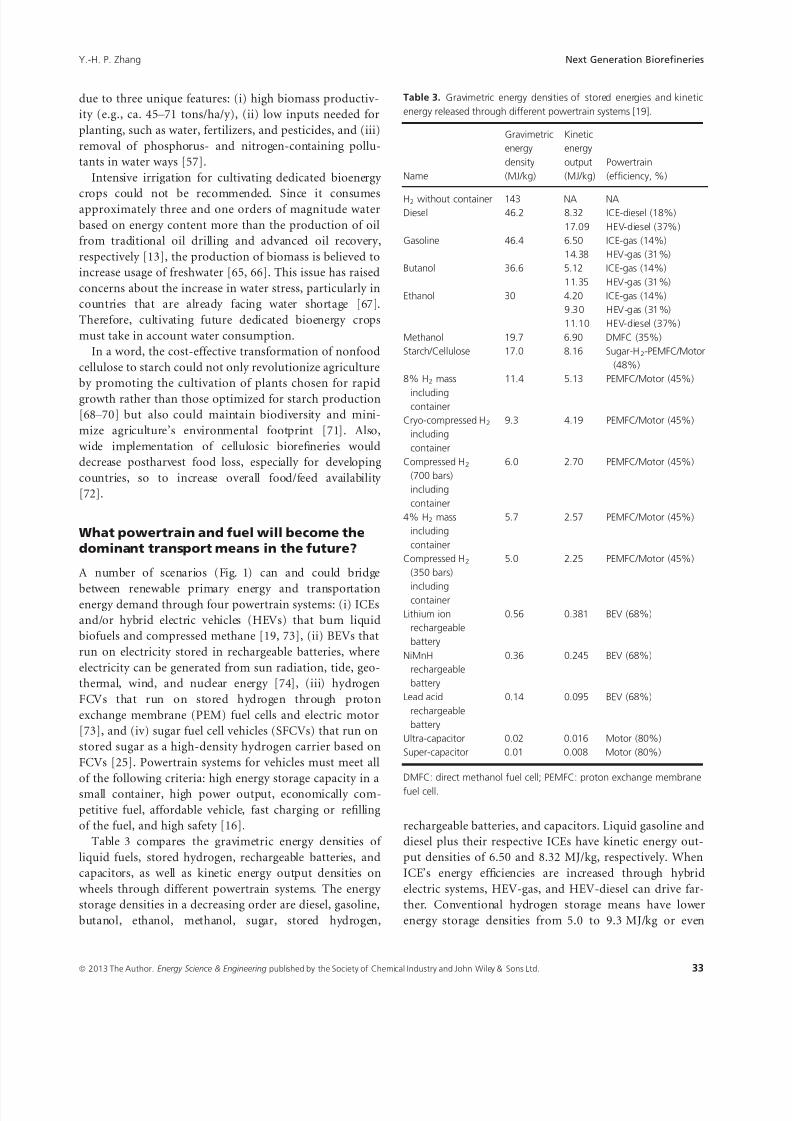
Table 3 compares the gravimetric energy densities of
liquid fuels, stored hydrogen, rechargeable batteries, and
capacitors, as well as kinetic energy output densities on
wheels through different powertrain systems. The energy
storage densities in a decreasing order are diesel, gasoline,
butanol, ethanol, methanol, sugar, stored hydrogen,
rechargeable batteries, and capacitors. Liquid gasoline and
diesel plus their respective ICEs have kinetic energy out-
put densities of 6.50 and 8.32 MJ/kg, respectively. When
ICE’s energy efficiencies are increased through hybrid
electric systems, HEV-gas, and HEV-diesel can drive far-
ther. Conventional hydrogen storage means have lower
energy storage densities from 5.0 to 9.3 MJ/kg or even
Table 3. Gravimetric energy densities of stored energies and kinetic
energy released through different powertrain systems [19].
Name
Gravimetric
energy
density
(MJ/kg)
Kinetic
energy
output
(MJ/kg)
Powertrain
(efficiency, %)
H2 without container 143 NA NA
Diesel 46.2 8.32 ICE-diesel (18%)
17.09 HEV-diesel (37%)
Gasoline 46.4 6.50 ICE-gas (14%)
14.38 HEV-gas (31%)
Butanol 36.6 5.12 ICE-gas (14%)
11.35 HEV-gas (31%)
Ethanol 30 4.20 ICE-gas (14%)
9.30 HEV-gas (31%)
11.10 HEV-diesel (37%)
Methanol 19.7 6.90 DMFC (35%)
Starch/Cellulose 17.0 8.16 Sugar-H2-PEMFC/Motor
(48%)
8% H2 mass
includingcontainer
11.4 5.13 PEMFC/Motor (45%)
Cryo-compressed H2
including
container
9.3 4.19 PEMFC/Motor (45%)
Compressed H2
(700 bars)
including
container
6.0 2.70 PEMFC/Motor (45%)
4% H2 mass
including
container
5.7 2.57 PEMFC/Motor (45%)
Compressed H2
(350 bars)
includingcontainer
5.0 2.25 PEMFC/Motor (45%)
Lithium ion
rechargeable
battery
0.56 0.381 BEV (68%)
NiMnH
rechargeable
battery
0.36 0.245 BEV (68%)
Lead acid
rechargeable
battery
0.14 0.095 BEV (68%)
Ultra-capacitor 0.02 0.016 Motor (80%)
Super-capacitor 0.01 0.008 Motor (80%)
DMFC: direct methanol fuel cell; PEMFC: proton exchange membrane
fuel cell.
ª 2013 The Author. Energy Science & Engineering published by the Society of Chemical Industry and John Wiley & Sons Ltd. 33
Y.-H. P. Zhang Next Generation Biorefineries
Page 8
7/27/2019 ese32.pdf
http://slidepdf.com/reader/full/ese32pdf 8/15
lower, resulting in shorter driving distance of FCVs com-
pared to vehicles based on ICEs if the same weight fuel
tank is used. Therefore, the DOE strongly encourages to
develop novel high-density hydrogen storage means and
provides the H-prize cash award [16]. Rechargeable bat-
teries have at least one order magnitude lower energy
storage densities than liquid fuels and stored hydrogen(Table 3). As a result, BEVs have very short driving dis-
tances. The energy densities of capacitors are very low,
limiting its application in the transport sector.
Battery electric vehicles will not be a dominant future
transport means. For example, the International Energy
Agency and several studies predict that BEVs will play a
minor role in the future [74, 75]. Rechargeable lithium
(Li) batteries have energy densities of approximately
150 Wh/kg (i.e., 0.56 MJ/kg), resulting in very short driv-
ing distances for BEVs [76, 77]. If the energy densities of
lithium batteries were increased by 5 – 10-fold [78, 79],
other issues, such as safety, recharging time, and lifetime,
could still prohibit their wide use in personal vehicles. In
reality, future energy densities of rechargeable lithium
batteries are expected to increase by twofold in next dec-
ades [76, 77] rather than 5 – 10 times by considering the
configuration of Li batteries and its combustion energy
(i.e., 43.1 MJ/kg lithium) [4]. Although developing lith-
ium-air batteries are expected to have very high energy
densities but the regeneration of lithium oxidize to lith-
ium by electricity is energy intensive. Therefore, metal-air
batteries are not suitable in the transport sector.
In addition to low energy densities of Li batteries, BEVs
have other weaknesses. First, the recharging cycles and
lifetime of high-density lithium batteries is approximately 1000 time and 2 – 3 years, respectively. Both are much
shorter than requirement of the major car components
lasting at least 10 years. (Think of lithium ion batteries in
cellphones and laptops.) Second, lithium ion batteries are
still costly for vehicles although its production costs could
be decreased by several-fold. It is not realistic to believe
that battery costs would be drastically decreased following
Moore’s Law because it is impossible to exponentially
both decrease material consumption in batteries and
increase battery performance according to the basic physi-
cal limits of materials. Third, Li batteries require a long
recharging time. Although ultra-fast charging batteries
have been developed [80], these capacitor-like batteries
are made at the cost of decreasing energy storage densities
[81]. Fourth, a huge infrastructure investment could be
needed to upgrade the electrical grid, install sockets for
fast recharge, and build power stations [21]. Fifth, dispos-
ing and recycling a large number of used rechargeable
batteries could be another environmental challenge [21].
Sixth, the energy density loss rates of rechargeable batter-
ies depend on temperature; for example, standard loss
rates per year are 6% at 0°C, 20% at 25°C, and 35% at
40°C [21]. Seventh, whether there is enough low-cost lith-
ium for BEVs is not a certain thing. Goodenough, a pio-
neer of lithium batteries, pointed out that the principal
challenges facing the development of rechargeable batter-
ies for BEVs are cost, safety, energy density (volt-
age 9 capacity), rate of charge/discharge, and service life[82]. Due to BEVs’ unique features such as cleanness and
quietness, BEVs will still be popular in some special mar-
kets, for example, in golf courts. In a word, a complete
switch to all battery electric cars is utterly unrealistic [21]
by considering the above problems and the likelihood
that better competing technologies will appear and
mature.
This study suggests another paradigm-shifting solution
for the future vehicles – SFCVs. Based on FCVs, carbohy-
drate (shorthand, CH2O) is suggested to be a high-density
hydrogen carrier so that its use could address hydrogen
storage, distribution, and safety issues [40, 83 – 85]. In the
hypothetical SFCV, an on-board biotransformer contain-
ing numerous thermoenzymes and (biomimetic) co-
enzymes that can achieve the reaction of CH2O + H2O
? 2H2 + CO2 [86, 87]. Because enzymes are 100% selec-
tive, work under moderate reaction conditions, and gen-
erate highly pure hydrogen, carbohydrates have a
gravimetric density of 8.33 H2 mass% for the carbohy-
drate/water slurry [16, 25]. During the past several years,
we have increased enzymatic hydrogen generation rates to
approximately 160 mmole H2/L/h by nearly 800-fold (in
preparation for publication). We anticipate to increase
reaction rates by another 30-fold within next several years
so that the on-board biotransformer will be small enoughto store in a SFCV [16, 40].
In a word, HEVs based on ICEs are believed to be a
short- and middle-term solution before FCVs [73]. SFCVs
could be a good solution to address the problems of
FCVs from hydrogen production, storage, distribution,
infrastructure, and safety. SFCVs could have several
advantages over BEVs: much higher energy storage densi-
ties, faster refilling rates, better safety, and less environ-
mental burdens [19, 40].
Could we have enough extra biomass
source to drive vehicles and feed the world?
As shown in Table 1, two irreplaceable applications of bio-
mass resource are food/feed (1.33 TW) and wood for
materials (1.28 TW). Compared to all terrestrial biomass
resource (65 TW), the current biomass utilization effi-
ciency is 6.32% and it is expected that biomass utilization
efficiency will be increased to up to 12.3% [31]. This value
is also partially supported by the DOE and USUA’s a
billion ton report [88].Two liquid fuels used for land
34 ª 2013 The Author. Energy Science & Engineering published by the Society of Chemical Industry and John Wiley & Sons Ltd.
Next Generation Biorefineries Y.-H. P. Zhang
Page 9
7/27/2019 ese32.pdf
http://slidepdf.com/reader/full/ese32pdf 9/15
transportation are gasoline (1.2 TW) and middle distillates
(1.79 TW). Since the global average ICE-gas and ICE-die-
sel have fuel-to-wheel efficiencies of approximately 14%
and 23%, respectively [19], the global kinetic energy out-
put on wheels is 0.58 TW.
When we increase biomass utilization efficiency from
6.32% now to 12.3% in 2050, this study provides quanti-tative predictions for the worst, best, and most likely sce-
narios for the year 2050 based on different assumptions.
In the worst scenarios, food/feed needs, wood consump-
tion, and biomass for burning could increase by 100%,
50%, and 50%, respectively. At the same time, total bio-
mass resource could be constant. Therefore, the remain-
ing biomass source that could be collected and utilized
will be 1.17 TW. The land transportation energy in terms
of kinetic energy could increase to 0.85 TW from
0.58 TW based on an annual growth rate of 1%.
In the best scenarios, food/feed needs and wood con-
sumption could increase by 50% and 20%, respectively.
Slow growth in wood consumption could be attributed to
less use of papers in affluent countries and better recycling.
Biomass for burning could be decreased to half due to an
increase in burning efficiency in developing countries [24].
At the same time, total biomass resource could increase to
94.9 TW at an annual growth rate of 1% due to (i) rising
CO2 levels in the atmosphere that fertilizes plant produc-
tivity [19, 38] and (ii) dedicated high-yield bioenergy crops
[88]. Therefore, the biomass resource will be 7.52 TW. The
land transportation energy in terms of kinetic energy could
increase to 0.70 TW based on an annual growth rate of
0.5%.
In the most likely scenarios, food/feed needs, wood
consumption, and biomass for burning could increase by
70%, 35%, and 0%, respectively. Food/feed production
from cultivated cereals could increase to 1.66 TW; the
remaining food/feed need (0.60 TW) could be supple-mented with synthetic starch made from biorefineries. At
the same time, total biomass resource could increase to
78.6 TW at an annual growth rate of 0.5%. Therefore, the
remaining biomass resource will be 4.84 TW. The land
transportation energy in terms of kinetic energy could
increase to 0.76 TW based on an annual growth rate of
0.7%.
The last uncertainty is the biomass-to-wheel (BTW)
efficiency of future land transport means. The worst sce-
nario is based on current ICE-gas (ethanol) system
(BTW = 7%), while the best could be SFCVs
(BTW = 27%). Several transitional powertrains could be
HEV-gas (BTW = 20.7%), HEV-diesel (BTW = 24.8%),
and FCV (BTW = 22%). In the 2050 market, it is likely
that the transport sector could constitute different trans-
portation means so that an average BTW efficiencies
could range from 11% to 20%.
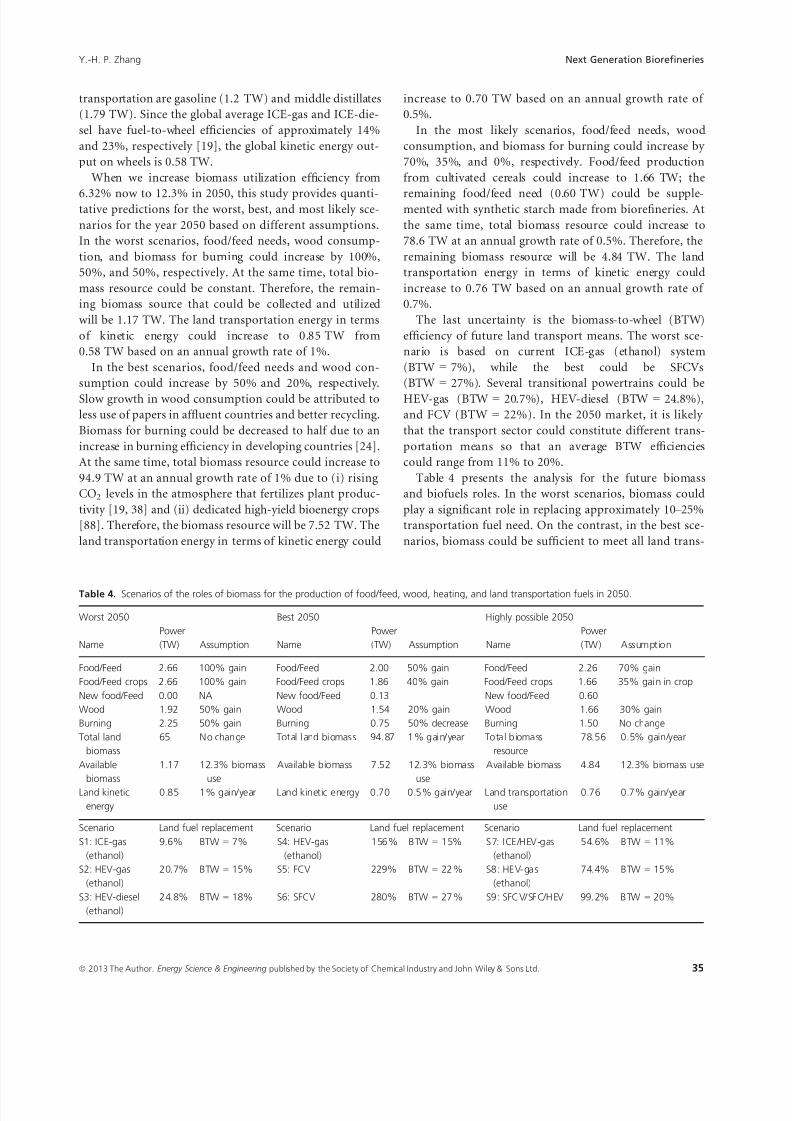
Table 4 presents the analysis for the future biomass
and biofuels roles. In the worst scenarios, biomass could
play a significant role in replacing approximately 10 – 25%
transportation fuel need. On the contrast, in the best sce-
narios, biomass could be sufficient to meet all land trans-
Table 4. Scenarios of the roles of biomass for the production of food/feed, wood, heating, and land transportation fuels in 2050.
Worst 2050 Best 2050 Highly possible 2050
Name
Power
(TW) Assumption Name
Power
(TW) Assumption Name
Power
(TW) Assumption
Food/Feed 2.66 100% gain Food/Feed 2.00 50% gain Food/Feed 2.26 70% gain
Food/Feed crops 2.66 100% gain Food/Feed crops 1.86 40% gain Food/Feed crops 1.66 35% gain in crop
New food/Feed 0.00 NA New food/Feed 0.13 New food/Feed 0.60
Wood 1.92 50% gain Wood 1.54 20% gain Wood 1.66 30% gain
Burning 2.25 50% gain Burning 0.75 50% decrease Burning 1.50 No change
Total land
biomass
65 No change Total land biomass 94.87 1% gain/year Total b iomass
resource
78.56 0.5% gain/year
Available
biomass
1.17 12.3% biomass
use
Available biomass 7.52 12.3% biomass
use
Available biomass 4.84 12.3% biomass use
Land kinetic
energy
0.85 1% gain/year Land kinetic energy 0.70 0.5% gain/year Land transportation
use
0.76 0.7% gain/year
Scenario Land fuel replacement Scenario Land fuel replacement Scenario Land fuel replacement
S1: ICE-gas
(ethanol)
9.6% BTW = 7% S4: HEV-gas
(ethanol)
156% BTW = 15% S7: ICE/HEV-gas
(ethanol)
54.6% BTW = 11%
S2: HEV-gas
(ethanol)
20.7% BTW = 15% S5: FCV 229% BTW = 22% S8: HEV-gas
(ethanol)
74.4% BTW = 15%
S3: HEV-diesel
(ethanol)
24.8% BTW = 18% S6: SFCV 280% BTW = 27% S9: SFCV/SFC/HEV 99.2% BTW = 20%
ª 2013 The Author. Energy Science & Engineering published by the Society of Chemical Industry and John Wiley & Sons Ltd. 35
Y.-H. P. Zhang Next Generation Biorefineries
Page 10
7/27/2019 ese32.pdf
http://slidepdf.com/reader/full/ese32pdf 10/15
portation energy need plus a large surplus. In the most
likely scenarios, biofuels made from biomass could
replace at least 50% to nearly 100% land transportation
fuel need. The above analysis suggests that (i) we must
increase powertrain system efficiency so to decrease bio-
mass consumption, (ii) we must develop next generation
biorefineries because it not only produce biofuels but alsocould produce food/feed and biochemicals, and (iii) we
must utilize agricultural and forest residuals and then
grow dedicated water-saving bioenergy crops by spatial
segregation of food/feed and energy-producing areas by
continuing producing food on established and productive
agricultural land while growing dedicated energy crops on
marginal land [89].
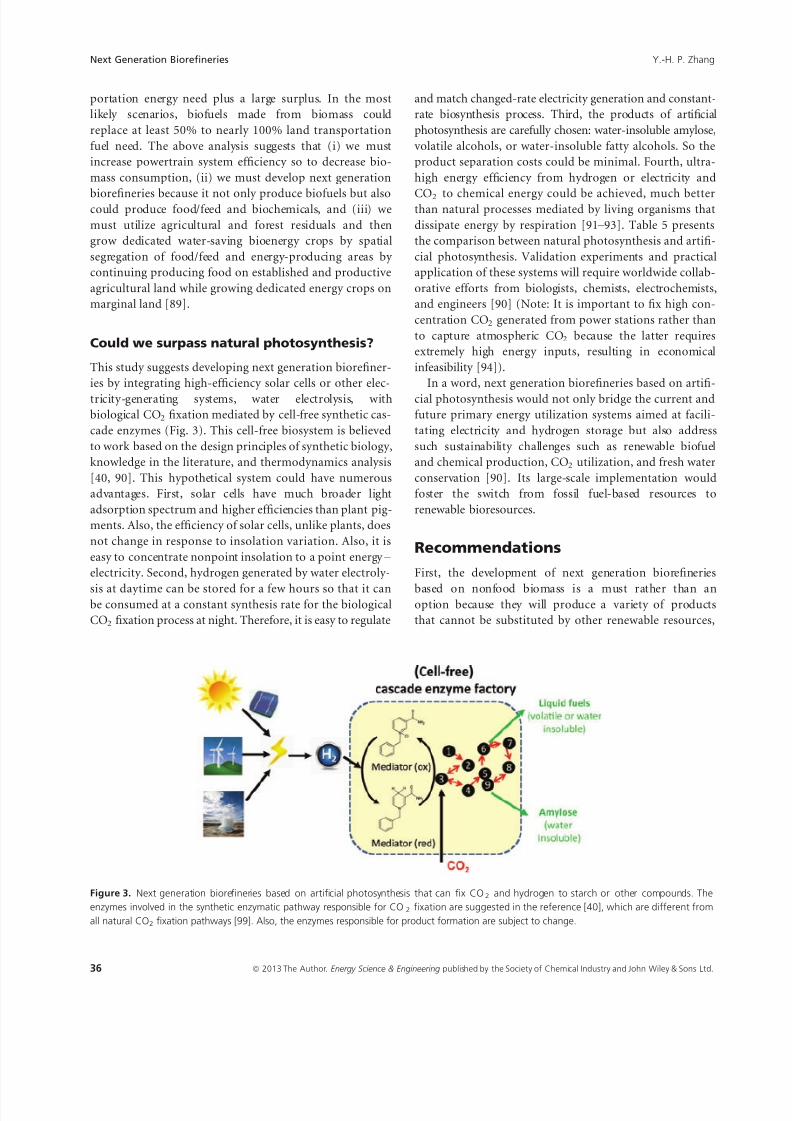
Could we surpass natural photosynthesis?
This study suggests developing next generation biorefiner-
ies by integrating high-efficiency solar cells or other elec-
tricity-generating systems, water electrolysis, with
biological CO2 fixation mediated by cell-free synthetic cas-
cade enzymes (Fig. 3). This cell-free biosystem is believed
to work based on the design principles of synthetic biology,
knowledge in the literature, and thermodynamics analysis
[40, 90]. This hypothetical system could have numerous
advantages. First, solar cells have much broader light
adsorption spectrum and higher efficiencies than plant pig-
ments. Also, the efficiency of solar cells, unlike plants, does
not change in response to insolation variation. Also, it is
easy to concentrate nonpoint insolation to a point energy –
electricity. Second, hydrogen generated by water electroly-
sis at daytime can be stored for a few hours so that it canbe consumed at a constant synthesis rate for the biological
CO2 fixation process at night. Therefore, it is easy to regulate
and match changed-rate electricity generation and constant-
rate biosynthesis process. Third, the products of artificial
photosynthesis are carefully chosen: water-insoluble amylose,
volatile alcohols, or water-insoluble fatty alcohols. So the
product separation costs could be minimal. Fourth, ultra-
high energy efficiency from hydrogen or electricity and
CO2 to chemical energy could be achieved, much betterthan natural processes mediated by living organisms that
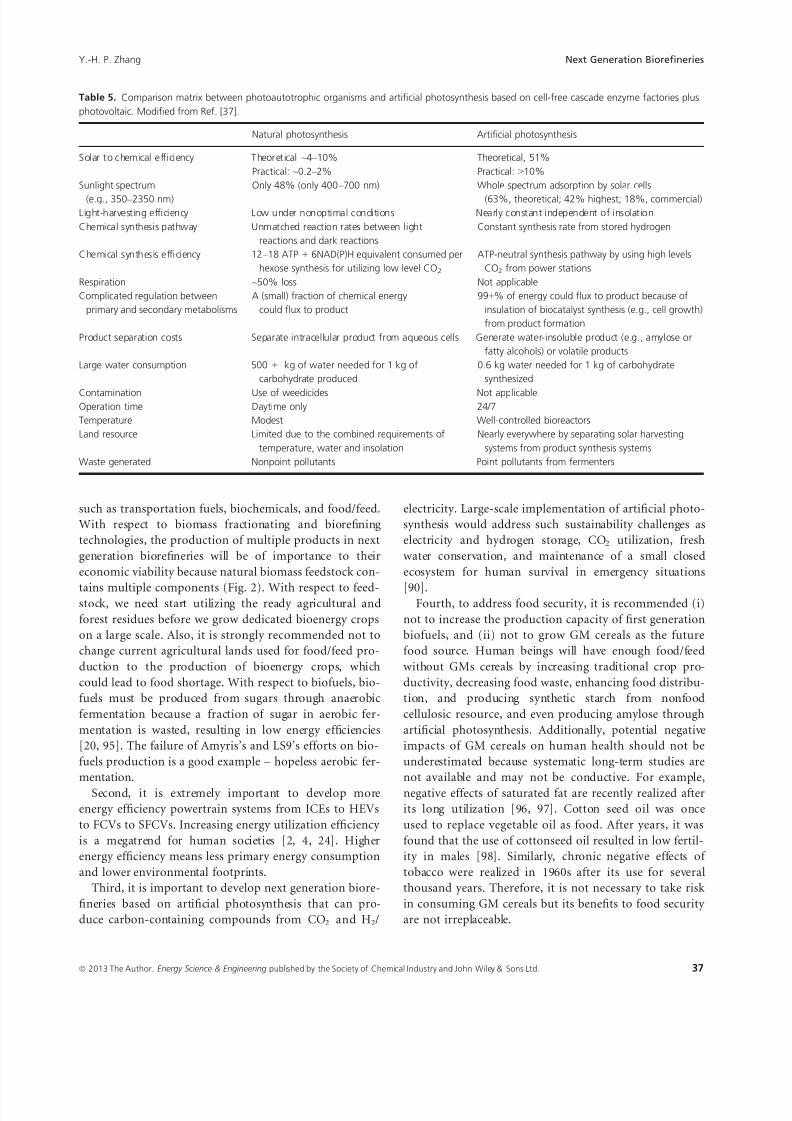
dissipate energy by respiration [91 – 93]. Table 5 presents
the comparison between natural photosynthesis and artifi-
cial photosynthesis. Validation experiments and practical
application of these systems will require worldwide collab-
orative efforts from biologists, chemists, electrochemists,
and engineers [90] (Note: It is important to fix high con-
centration CO2 generated from power stations rather than
to capture atmospheric CO2 because the latter requires
extremely high energy inputs, resulting in economical
infeasibility [94]).
In a word, next generation biorefineries based on artifi-
cial photosynthesis would not only bridge the current and
future primary energy utilization systems aimed at facili-
tating electricity and hydrogen storage but also address
such sustainability challenges such as renewable biofuel
and chemical production, CO2 utilization, and fresh water
conservation [90]. Its large-scale implementation would
foster the switch from fossil fuel-based resources to
renewable bioresources.
Recommendations
First, the development of next generation biorefineries
based on nonfood biomass is a must rather than anoption because they will produce a variety of products
that cannot be substituted by other renewable resources,
Figure 3. Next generation biorefineries based on artificial photosynthesis that can fix CO2 and hydrogen to starch or other compounds. The
enzymes involved in the synthetic enzymatic pathway responsible for CO2 fixation are suggested in the reference [40], which are different from
all natural CO2 fixation pathways [99]. Also, the enzymes responsible for product formation are subject to change.
36 ª 2013 The Author. Energy Science & Engineering published by the Society of Chemical Industry and John Wiley & Sons Ltd.
Next Generation Biorefineries Y.-H. P. Zhang
Page 11
7/27/2019 ese32.pdf
http://slidepdf.com/reader/full/ese32pdf 11/15
such as transportation fuels, biochemicals, and food/feed.
With respect to biomass fractionating and biorefining
technologies, the production of multiple products in next
generation biorefineries will be of importance to their
economic viability because natural biomass feedstock con-
tains multiple components (Fig. 2). With respect to feed-stock, we need start utilizing the ready agricultural and
forest residues before we grow dedicated bioenergy crops
on a large scale. Also, it is strongly recommended not to
change current agricultural lands used for food/feed pro-
duction to the production of bioenergy crops, which
could lead to food shortage. With respect to biofuels, bio-
fuels must be produced from sugars through anaerobic
fermentation because a fraction of sugar in aerobic fer-
mentation is wasted, resulting in low energy efficiencies
[20, 95]. The failure of Amyris’s and LS9’s efforts on bio-
fuels production is a good example – hopeless aerobic fer-
mentation.
Second, it is extremely important to develop more
energy efficiency powertrain systems from ICEs to HEVs
to FCVs to SFCVs. Increasing energy utilization efficiency
is a megatrend for human societies [2, 4, 24]. Higher
energy efficiency means less primary energy consumption
and lower environmental footprints.
Third, it is important to develop next generation biore-
fineries based on artificial photosynthesis that can pro-
duce carbon-containing compounds from CO2 and H2/
electricity. Large-scale implementation of artificial photo-
synthesis would address such sustainability challenges as
electricity and hydrogen storage, CO2 utilization, fresh
water conservation, and maintenance of a small closed
ecosystem for human survival in emergency situations
[90].Fourth, to address food security, it is recommended (i)
not to increase the production capacity of first generation
biofuels, and (ii) not to grow GM cereals as the future
food source. Human beings will have enough food/feed
without GMs cereals by increasing traditional crop pro-
ductivity, decreasing food waste, enhancing food distribu-
tion, and producing synthetic starch from nonfood
cellulosic resource, and even producing amylose through
artificial photosynthesis. Additionally, potential negative
impacts of GM cereals on human health should not be
underestimated because systematic long-term studies are
not available and may not be conductive. For example,
negative effects of saturated fat are recently realized after
its long utilization [96, 97]. Cotton seed oil was once
used to replace vegetable oil as food. After years, it was
found that the use of cottonseed oil resulted in low fertil-
ity in males [98]. Similarly, chronic negative effects of
tobacco were realized in 1960s after its use for several
thousand years. Therefore, it is not necessary to take risk
in consuming GM cereals but its benefits to food security
are not irreplaceable.
Table 5. Comparison matrix between photoautotrophic organisms and artificial photosynthesis based on cell-free cascade enzyme factories plus
photovoltaic. Modified from Ref. [37].
Natural photosynthesis Artificial photosynthesis
Solar to chemical efficiency Theoretical ~ 4 – 10% Theoretical, 51%
Practical: ~ 0.2 – 2% Practical: >10%
Sunlight spectrum
(e.g., 350 –
2350 nm)
Only 48% (only 400 – 700 nm) Whole spectrum adsorption by solar cells
(63%, theoretical; 42% highest; 18%, commercial)
Light-harvesting efficiency Low under nonoptimal conditions Nearly constant independent of insolation
Chemical synthesis pathway Unmatched reaction rates between light
reactions and dark reactions
Constant synthesis rate from stored hydrogen
Chemical synthesis efficiency 12 – 18 ATP + 6NAD(P)H equivalent consumed per
hexose synthesis for utilizing low level CO2
ATP-neutral synthesis pathway by using high levels
CO2 from power stations
Respiration ~ 50% loss Not applicable
Complicated regulation between
primary and secondary metabolisms
A (small) fraction of chemical energy
could flux to product
99+% of energy could flux to product because of
insulation of biocatalyst synthesis (e.g., cell growth)
from product formation
Product separation costs Separate intracellular product from aqueous cells Generate water-insoluble product (e.g., amylose or
fatty alcohols) or volatile products
Large water consumption 500 + kg of water needed for 1 kg of
carbohydrate produced
0.6 kg water needed for 1 kg of carbohydrate
synthesized
Contamination Use of weedicides Not applicableOperation time Daytime only 24/7
Temperature Modest Well-controlled bioreactors
Land resource Limited due to the combined requirements of
temperature, water and insolation
Nearly everywhere by separating solar harvesting
systems from product synthesis systems
Waste generated Nonpoint pollutants Point pollutants from fermenters
ª 2013 The Author. Energy Science & Engineering published by the Society of Chemical Industry and John Wiley & Sons Ltd. 37
Y.-H. P. Zhang Next Generation Biorefineries
Page 12
7/27/2019 ese32.pdf
http://slidepdf.com/reader/full/ese32pdf 12/15
In a word, biomass sugar isolated from nonfood bio-
mass and/or produced from artificial photosynthesis
could play an irreplaceable role in the sustainability revo-
lution by providing food/feed, renewable materials, and
transportation biofuels in the future.
Acknowledgments
This study was supported by the Biological Systems Engi-
neering Department of Virginia Tech, the CALS Biodesign
and Bioprocessing Research Center, and Shell Game-
Changer Program.
Conflict of Interest
The authors declare competing financial interests. The
enzymatic sugar-to-hydrogen technology is protected by
the US patent 8211681. The enzymatic transformation of
non-food biomass to edible starch is under protection of
provisional patent disclosure filed by Virginia Tech. PZ
has a financial interest in CFB9 and Gate Fuels.
References
1. MacKay, D. J. C. 2009. Sustainable energy – without the
hot air. UIT Cambridge Ltd., Cambridge, U.K.
2. Smil, V. 2008. Energy in nature and society. MIT Press,
Cambridge, MA.
3. Wei, J. 2012. Great inventions that changed the world.
John Wiley & Sons, Inc., Hoboken, NJ.
4. Zhang, Y.-H. P. 2011. What is vital (and not vital) to
advance economically-competitive biofuels production.
Process Biochem. 46:2091 –
2110.
5. Smil, V. 2008. Oil: a beginner’s guide. Oneworld
Publications, Oxford, U.K.
6. Sorrell, S., J. Speirs, R. Bentley, A. Brandt, and R. Miller.
2010. Global oil depletion: a review of the evidence.
Energy Policy 38:5290 – 5295.
7. Kerr, R. A., and R. F. Service. 2005. What can replace
cheap oil – and when. Science 309:101.
8. Sibly, R. M., and J. Hone. 2002. Population growth rate
and its determinants: an overview. Phil. Trans. R. Soc.
Lond. B Biol. Sci. 357:1153 – 1170.
9. Foley, J. A., N. Ramankutty, K. A. Brauman, E. S.
Cassidy, J. S. Gerber, M. Johnston, et al. 2011. Solutionsfor a cultivated planet. Nature 478:337 – 342.
10. Godfray, H. C. J. 2011. Food and biodiversity. Science
333:1231 – 1232.
11. Godfray, H. C. J., J. R. Beddington, I. R. Crute, L.
Haddad, D. Lawrence, J. F. Muir, et al. 2010. Food
security: the challenge of feeding 9 billion people. Science
327:812 – 818.
12. Lapp e, F. M., J. Collins, P. Rosset, and L. Esparza. 1998.
World hunger: twelve myths. Grove Press, New York, NY.
13. The World Economic Forum Water Initiative. 2011.
Water security: the water-food-energy-climate nexus.
Island Press, Washington, DC.
14. Lynd, L. R. 2010. Bioenergy: in search of clarity. Energy
Environ. Sci. 3:1150 – 1152.
15. Vertes, A. A., M. Inui, and H. Yukawa. 2006.
Implementing biofuels on a global scale. Nat. Biotechnol.24:761 – 764.
16. Zhang, Y.-H. P. 2010. Renewable carbohydrates are a
potential high density hydrogen carrier. Int. J. Hydrogen
Energy 35:10334 – 10342.
17. Michel, H. 2012. Editorial: The Nonsense of Biofuels.
Angew. Chem. Int. Ed. 51:2516 – 2518.
18. Searchinger, T., R. Heimlich, R. A. Houghton, F. Dong,
A. Elobeid, J. Fabiosa, et al. 2008. Use of U.S. croplands
for biofuels increases greenhouse gases through emissions
from land-use change. Science 319:1238 – 1240.
19. Huang, W. D., and Y.-H. P. Zhang. 2011. Energy
efficiency analysis: biomass-to-wheel efficiency related
with biofuels production, fuel distribution, andpowertrain systems. PLoS ONE 6:e22113.
20. Huang, W. D., and Y.-H. P. Zhang. 2011. Analysis of
biofuels production from sugar based on three criteria:
thermodynamics, bioenergetics, and product separation.
Energy Environ. Sci. 4:784 – 792.
21. Smil, V. 2010. Energy myths and realities: bringing
science to the energy policy debate. The AEI Press,
Washington, DC.
22. International Energy Agency (IEA). 2012. Key World
Energy Statistics 2012. Available at http://www.iea.org/
publications/freepublications/publication/kwes.pdf
(accessed 2012).
23. Lewis, N. S., and D. G. Nocera. 2006. Powering the
planet: chemical challenges in solar energy utilization.
Proc. Natl Acad. Sci. USA 103:15729 – 15735.
24. Smil, V. 1999. Energies: an illustrated guide to the
biosphere and civilization. The MIT Press, Cambridge,
MA.
25. Zhang, Y.-H. P. 2009. A sweet out-of-the-box solution to
the hydrogen economy: is the sugar-powered car science
fiction? Energy Environ. Sci. 2:272 – 282.
26. Zhang, Y.-H. P. 2008. Reviving the carbohydrate
economy via multi-product biorefineries. J. Ind.
Microbiol. Biotechnol. 35:367 – 375.
27. Misselhorn, A., P. Aggarwal, P. Ericksen, P. Gregory, L.
Horn-Phathanothai, J. Ingram, et al. 2012. A vision for
attaining food security. Curr. Opin. Environ.
Sustainability 4:7 – 17.
28. Smil, V. 2000. Feeding the world: a challenge for the
twenty-first century. MIT Press, Cambridge, MA.
29. Hoffert, M. I., K. Caldeira, G. Benford, D. R. Criswell, C.
Green, H. Herzog, et al. 2002. Advanced technology paths
to global climate stability: energy for a greenhouse planet.
Science 298:981 – 987.
38 ª 2013 The Author. Energy Science & Engineering published by the Society of Chemical Industry and John Wiley & Sons Ltd.
Next Generation Biorefineries Y.-H. P. Zhang
Page 13
7/27/2019 ese32.pdf
http://slidepdf.com/reader/full/ese32pdf 13/15
30. Smil, V. 2010. Energy Transitions: History, Requirements.
Prospects, ABC-CLIO, LLC, Santa Barbara, CA.
31. Worldwatch Institute. 2009. State of the world 2009: into
a warming world. Available at http://www.worldwatch.
org/node/5984 (accessed 2009).
32. Hermann, W. A. 2006. Quantifying global exergy
resources. Energy 31:1685 –
1702.33. Fargione, J., J. Hill, D. Tilman, S. Polasky, and P.
Hawthorne. 2008. Land clearing and the biofuel carbon
debt. Science 319:1235 – 1238.
34. Bazilian, M., H. Rogner, M. Howells, S. Hermann, D.
Arent, D. Gielen, et al. 2011. Considering the energy,
water and food nexus: Towards an integrated modelling
approach. Energy Policy 39:7896 – 7906.
35. Blankenship, R. E., D. M. Tiede, J. Barber, G. W.
Brudvig, G. Fleming, M. Ghirardi, et al. 2011. Comparing
photosynthetic and photovoltaic efficiencies and
recognizing the potential for improvement. Science
332:805 – 809.
36. Williams, P. J. L., and L. M. L. Laurens. 2010. Microalgaeas biodiesel & biomass feedstocks: Review & analysis of
the biochemistry, energetics & economics. Energy
Environ. Sci. 3:554 – 590.
37. Zhang, Y.-H. P., C. You, H. Chen, and R. Feng. 2012.
Surpassing Photosynthesis: High-Efficiency and Scalable
CO2 Utilization through Artificial Photosynthesis. ACS
Sym. Ser. Recent Advances in Post-Combustion CO 2
Capture chemistry. 1097:275 – 292.
38. Zhu, X.-G., S. P. Long, and D. R. Ort. 2008. What is the
maximum efficiency with which photosynthesis can
convert solar energy into biomass? Curr. Opin.
Biotechnol. 19:153 – 159.
39. Weyer, K., D. Bush, A. Darzins, and B. Willson. 2009.
Theoretical maximum algal oil production. Bioenergy
Res. 3:204 – 213.
40. Zhang, Y.-H. P. 2011. Simpler is better: high-yield and
potential low-cost biofuels production through cell-free
synthetic pathway biotransformation (SyPaB). ACS Catal.
1:998 – 1009.
41. Gregory, P. J., and T. S. George. 2011. Feeding nine
billion: the challenge to sustainable crop production. J.
Exp. Bot. 62:5233 – 5239.
42. Braskerud, B. C. 2002. Factors affecting phosphorus retention
in small constructed wetlands treating agricultural non-point
source pollution. Ecol. Eng. 19:41 – 61.
43. Godfray, H. C. J. 2011. Food for thought. Proc. Natl
Acad. Sci. USA 108:19845 – 19846.
44. Tilman, D., C. Balzer, J. Hill, and B. L. Befort. 2011.
Global food demand and the sustainable intensification of
agriculture. Proc. Natl Acad. Sci. USA 108:20260 – 20264.
45. Gustavsson, J., C. Cederberg, U. Sonesson, R. van
Otterdijk, and A. Meybeck. 2011. Global food losses and
food waste in Section 3.2 of international congress “Save
Food” (FAO, rural infrastructure and agro-industries
division). Available at: http://www.fao.org/fileadmin/
user_upload/suistainability/pdf/Global_Food_Losses_
and_Food_Waste.pdf (accessed May 2011).
46. Parfitt, J., M. Barthel, and S. Macnaughton. 2010. Food
waste within food supply chains: quantification and
potential for change to 2050. Philos. Trans. R. Soc. Lond.
B Biol. Sci. 365:3065 –
3081.47. Bruce, T. J. A. 2012. GM as a route for delivery of
sustainable crop protection. J. Exp. Bot. 63:537 – 541.
48. Bagla, P. 2012. Negative Report on GM Crops Shakes
Government’s Food Agenda. Science 337:789.
49. Balmford, A., R. Green, and B. Phalan. 2012. What
conservationists need to know about farming. Proc. R.
Soc. B: Biological Sciences 279:2714 – 2724.
50. Beatty, P. H., and A. G. Good. 2011. Future Prospects for
Cereals That Fix Nitrogen. Science 333:416 – 417.
51. Fedoroff, N. V. 2013. Will common sense prevail? Trends
Genet. doi: 10.1016/j.tig.2012.09.002
52. Zhang, Y.-H. P., H. G. Chen, C. You, and R. L. Feng.
2012. Feeding the world: two out-of-the-box solutions. inThe 243rd ACS national meeting, division of AGFD 258,
Available at: http://abstracts.acs.org/chem/243nm/
program/view.php. (accessed March 29, 2012).
53. Sathitsuksanoh, N., A. George, and Y.-H. P. Zhang. 2013.
New lignocellulose pretreatments by using cellulose solvents:
a review. J. Chem. Technol. Biotechnol. 88:169 – 180.
54. Ye, X., C. Zhang, and Y.-H. P. Zhang. 2012. Engineering
a large protein by combined rational and random
approaches: stabilizing the Clostridium thermocellum
cellobiose phosphorylase. Mol. BioSyst. 8:1815 – 1823.
55. Yanase, M., H. Takata, K. Fujii, T. Takaha, and T. Kuriki.
2005. Cumulative Effect of Amino Acid Replacements
Results in Enhanced Thermostability of Potato Type L a-
Glucan Phosphorylase. Appl. Environ. Microbiol.
71:5433 – 5439.
56. Tuck, C. O., E. P erez, I. T. Horv ath, R. A. Sheldon, and
M. Poliakoff. 2012. Valorization of Biomass: Deriving
More Value from Waste. Science 337:695 – 699.
57. Sathitsuksanoh, N., Z. Zhu, N. Templeton, J. Rollin, S.
Harvey, and Y.-H. P. Zhang. 2009. Saccharification of a
potential bioenergy crop, Phragmites australis (common
reed), by lignocellulose fractionation followed by
enzymatic hydrolysis at decreased cellulase loadings. Ind.
Eng. Chem. Res. 48:6441 – 6447.
58. Sathitsuksanoh, N., Z. Zhu, T.-J. Ho, M.-D. Bai, and
Y.-H. P. Zhang. 2010. Bamboo saccharification through
cellulose solvent-based biomass pretreatment followed by
enzymatic hydrolysis at ultra-low cellulase loadings.
Bioresour. Technol. 101:4926 – 4929.
59. Sathitsuksanoh, N., Z. Zhu, and Y.-H. P. Zhang. 2012.
Cellulose solvent- and organic solvent-based lignocellulose
fractionation enabled efficient sugar release from a variety
of lignocellulosic feedstocks. Bioresour. Technol. 117:228 –
233.
ª 2013 The Author. Energy Science & Engineering published by the Society of Chemical Industry and John Wiley & Sons Ltd. 39
Y.-H. P. Zhang Next Generation Biorefineries
Page 14
7/27/2019 ese32.pdf
http://slidepdf.com/reader/full/ese32pdf 14/15
60. DOE. 2006. Office of energy efficiency and renewable
energy, office of science: breaking the biological barriers
to cellulosic ethanol: a joint research agenda. a research
roadmap resulting from the biomass to biofuels
workshop. Available at http://www.doegenomestolife.org/
biofuels/ (accessed June, 2006).
61. Clifton-Brown, J. C., B. Neilson, I. Lewandowski, and M.B. Jones. 2000. The modelled productivity of
Miscanthus9 giganteus (GREEF et DEU) in Ireland. Ind.
Crops Prod. 12:97 – 109.
62. Murnen, H. K., V. Balan, S. P. S. Chundawat, and B.
Bals. 2007. daCostaSousa L, Dale BE: Optimization of
ammonia fiber expansion (AFEX) pretreatment and
enzymatic hydrolysis of Miscanthus x giganteus to
fermentable sugars. Biotechnol. Prog. 23:846 – 850.
63. Gratani, L., M. F. Crescente, L. Varone, G. Fabrini, and
E. Digiulio. 2008. Growth pattern and photosynthetic
activity of different bamboo species growing in the
Botanical Garden of Rome. Flora 203:77 – 84.
64. Shanmughavel, P., and K. Francis. 2001. Physiology of bamboo. Scientific Publishers, India.
65. Batidzirai, B., E. M. W. Smeets, and A. P. C. Faaij. 2012.
Harmonising bioenergy resource potentials —
Methodological lessons from review of state of the art
bioenergy potential assessments. Renew. Sustain. Energy
Rev. 16:6598 – 6630.
66. Bernardi, A., S. Giarola, and F. Bezzo. 2012. Optimizing
the economics and the carbon and water footprints of
bioethanol supply chains. Biofuels, Bioprod. Biorefin.
6:656 – 672.
67. Gheewala, S. H., G. Berndes, and G. Jewitt. 2011. The
bioenergy and water nexus. Biofuels, Bioprod. Biorefin.
5:353 –
360.
68. Casillas, C. E., and D. M. Kammen. 2010. The Energy-
Poverty-Climate Nexus. Science 330:1181 – 1182.
69. French, C. E. 2009. Synthetic biology and biomass
conversion: a match made in heaven? J. Roy. Soc.
Interface 6:S547 – S558.
70. Sheppard, A. W., I. Gillespie, M. Hirsch, and C. Begley. 2011.
Biosecurity and sustainability within the growing global
bioeconomy. Curr. Opin. Environ. Sustainability 3:4 – 10.
71. Somerville, C., H. Youngs, C. Taylor, S. C. Davis, and S.
P. Long. 2010. Feedstocks for Lignocellulosic Biofuels.
Science 329:790 – 792.
72. Lynd, L. R., and J. Woods. 2011. Perspective: A new hope
for Africa. Nature 474:S20 – S21.
73. Demirdoven, N., and J. Deutch. 2004. Hybrid cars now,
fuel cell cars later. Science 305:974 – 976.
74. Thomas, C. E. 2009. Fuel cell and battery electric vehicles
compared. Int. J. Hydrogen Energy 34:6005 – 6020.
75. Melamu, R., and H. von Blottnitz. 2009. A comparison of
environmental benefits of transport and electricity
applications of carbohydrate derived ethanol and
hydrogen. Int. J. Hydrogen Energy 34:1126 – 1134.
76. Armand, M., and J. M. Tarascon. 2008. Building better
batteries. Nature 451:652 – 657.
77. Tarascon, J. M., and M. Armand. 2001. Issues and
challenges facing rechargeable lithium batteries. Nature
414:359 – 367.
78. Chan, C. K., H. Peng, G. Liu, K. McIlwrath, X. F. Zhang,
R. A. Huggins, et al. 2008. High-performance lithiumbattery anodes using silicon nanowires. Nat. Nanotechnol.
3:31 – 35.
79. Hassoun, J., and B. Scrosati. 2010. A High-Performance
Polymer Tin Sulfur Lithium Ion Battery. Angew. Chem.
Int. Ed. 49:2371 – 2374.
80. Kang, K., Y. S. Meng, J. Breger, C. P. Grey, and G. Ceder.
2006. Electrodes with high power and high capacity for
rechargeable lithium batteries. Science 311:977 – 980.
81. Zaghib, K., J. B. Goodenough, A. Mauger, and C. Julien.
2009. Unsupported claims of ultrafast charging of LiFePO4
Li-ion batteries. J. Power Sources 194:1021 – 1023.
82. Goodenough, J. B., and Y. Kim. 2010. Challenges for
Rechargeable Li Batteries. Chem. Mater. 22:587 –
603.83. Zhang, Y.-H. P. 2010. Production of biocommodities and
bioelectricity by cell-free synthetic enzymatic pathway
biotransformations: Challenges and opportunities.
Biotechnol. Bioeng. 105:663 – 677.
84. Zhang, Y.-H. P., J.-B. Sun, and J.-J. Zhong. 2010. Biofuel
production by in vitro synthetic pathway transformation.
Curr. Opin. Biotechnol. 21:663 – 669.
85. Zhang, Y.-H. P., S. Myung, C. You, Z. G. Zhu, and J.
Rollin. 2011. Toward low-cost biomanufacturing through
cell-free synthetic biology: bottom-up design. J. Mater.
Chem. 21:18877 – 18886.
86. Ye, X., Y. Wang, R. C. Hopkins, M. W. W. Adams, B. R.
Evans, J. R. Mielenz, et al. 2009. Spontaneous high-yield
production of hydrogen from cellulosic materials and
water catalyzed by enzyme cocktails. ChemSusChem
2:149 – 152.
87. Zhang, Y.-H. P., B. R. Evans, J. R. Mielenz, R. C.
Hopkins, and M. W. W. Adams. 2007. High-yield
hydrogen production from starch and water by a
synthetic enzymatic pathway. PLoS ONE 2:e456.
88. Perlack, R. D., L. L. Wright, R. L. Graham, B. J. Stokes,
and D. C. Erbach. 2005. Biomass as feedstock for a
bioenergy and bioproducts industries: The technical
feasibility of a billion-ton annual supply. Oak Ridge
National Laboratory, Oak Ridge, TN.
89. Dauber, J., C. Brown, A. L. Fernando, J. Finnan, E.
Krasuska, J. Ponitka, et al. 2012. Bioenergy from
“surplus” land: environmental and socio-economic
implications. BioRisk 7:5 – 50.
90. Zhang, Y.-H. P., and W.-D. Huang. 2012. Constructing
the electricity-carbohydrate-hydrogen cycle for a
sustainability revolution. Trends Biotechnol. 30:301 – 306.
91. Li, H., P. H. Opgenorth, D. G. Wernick, S. Rogers, T.-Y.
Wu, W. Higashide, et al. 2012. Integrated
40 ª 2013 The Author. Energy Science & Engineering published by the Society of Chemical Industry and John Wiley & Sons Ltd.
Next Generation Biorefineries Y.-H. P. Zhang
Page 15
7/27/2019 ese32.pdf
http://slidepdf.com/reader/full/ese32pdf 15/15
Electromicrobial Conversion of CO2 to Higher Alcohols.
Science 335:1596.
92. Magnuson, A., M. Anderlund, O. Johansson, P. Lindblad,
R. Lomoth, T. Polivka, et al. 2009. Biomimetic and
Microbial Approaches to Solar Fuel Generation. Acc.
Chem. Res. 42:1899 – 1909.
93. Nevin, K. P., T. L. Woodard, A. E. Franks, Z. M.Summers, and D. R. Lovley. 2010. Microbial
electrosynthesis: feeding microbes electricity to convert
carbon dioxide and water to multicarbon extracellular
organic compounds. mBio 1:e00103 – 00110.
94. House, K. Z., A. C. Baclig, M. Ranjan, E. A. van Nierop,
J. Wilcox, and H. J. Herzog. 2011. Economic and
energetic analysis of capturing CO2 from ambient air.
Proc. Natl Acad. Sci. USA 51:20428 – 20433.
95. Bastian, S., X. Liu, J. T. Meyerowitz, C. D. Snow, M. M.
Y. Chen, and F. H. Arnold. 2011. Engineered ketol-acid
reductoisomerase and alcohol dehydrogenase enable
anaerobic 2-methylpropan-1-ol production at theoretical
yield in Escherichia coli. Metab. Eng. 13:345 –
352.
96. Mozaffarian, D., R. Micha, and S. Wallace. 2010. Effects
on Coronary Heart Disease of Increasing Polyunsaturated
Fat in Place of Saturated Fat: A Systematic Review and
Meta-Analysis of Randomized Controlled Trials. PLoS
Med. 7:e1000252.
97. Siri-Tarino, P. W., Q. Sun, F. B. Hu, and R. M. Krauss.
2010. Meta-analysis of prospective cohort studiesevaluating the association of saturated fat with
cardiovascular disease. Am. J. Clin. Nutr. 91:535 – 546.
98. Randel, R. D., C. C. Chase, and S. J. Wyse. 1992. Effects
of gossypol and cottonseed products on reproduction of
mammals. J. Anim. Sci. 70:1628 – 1638.
99. Berg, I. A., D. Kockelkorn, W. H. Ramos-Vera, R. F. Say,
J. Zarzycki, M. H€ugler, et al. 2010. Autotrophic
carbon fixation in archaea. Nat. Rev. Microbiol. 8:
447 – 460.
100. The Global Institute of Sustainable Forestry at Yale
University. 2009. Available at http://environment.yale.
edu/gisf/programs/landscape-management/global-and-
regional-forest-conditions/ (accessed 2009).
ª 2013 The Author. Energy Science & Engineering published by the Society of Chemical Industry and John Wiley & Sons Ltd. 41
Y.-H. P. Zhang Next Generation Biorefineries