ESG Industry Report Card: Power Generation May 13, 2019 (Editor's Note: Our ESG Industry Report Cards include an analysis of ESG factors for a selection of companies. We intend to expand our ESG Industry Report cards to include more companies throughout the year.) Key Takeaways - The transition away from coal generation--a leader of carbon dioxide (CO2) emissions--is ongoing. But despite being a global focus, the pace of carbon reduction is not uniform throughout the sector and we expect that, by the next decade, coal generation will still represent over 25% of total generation. - Nuclear generation, while a zero-carbon emitter, still has significant environmental risks because of its higher-risk operations and nuclear waste. - Although natural gas generation emits about half the CO2 as coal, we view gas-fired generation as a bridge to a carbon-neutral environment and as an effective interim means to handle the intermittency of renewable generation. - The sector has a considerable influence on local communities, including on customers' electric bills, as a local employer, as a significant contributor to local taxes, and by ensuring safe operations at generating facilities. The ESG Risk Atlas To calibrate the relative ranking of sectors, we use our environmental, social, and governance (ESG) Risk Atlas (see "The ESG Risk Atlas: Sector And Regional Rationales And Scores," published May 13, 2019). The Risk Atlas provides a relative ranking of industries in terms of exposure to environmental and social risks (and opportunities). The sector risk atlas charts (shown below) combine each sector's exposure to environmental and social risks, scoring it on a scale of 1 to 6. A score closer to 1 represents a relatively low exposure, while 6 indicates a high sectorwide exposure to environmental and social risk factors (for details see the Appendix). This report card expands further on the Risk Atlas sector analysis by focusing on the credit-specific impacts, which in turn forms the basis for analyzing the exposures and opportunities of individual companies in the sector. ESG Industry Report Card: Power Generation May 13, 2019 PRIMARY CREDIT ANALYSTS Pierre Georges Paris (33) 1-4420-6735 pierre.georges @spglobal.com Claire Mauduit-Le Clercq Paris + 33 14 420 7201 claire.mauduit @spglobal.com Karl Nietvelt Paris (33) 1-4420-6751 karl.nietvelt @spglobal.com Gabe Grosberg New York (1) 212-438-6043 gabe.grosberg @spglobal.com Aneesh Prabhu, CFA, FRM New York (1) 212-438-1285 aneesh.prabhu @spglobal.com Julyana Yokota Sao Paulo + 55 11 3039 9731 julyana.yokota @spglobal.com See complete contact list at end of article. www.spglobal.com/ratingsdirect May 13, 2019 1
Transcript
ESG Industry Report Card: Power GenerationMay 13, 2019
(Editor's Note: Our ESG Industry Report Cards include an analysis of ESG factors for a selection of companies. We intend toexpand our ESG Industry Report cards to include more companies throughout the year.)
Key Takeaways
- The transition away from coal generation--a leader of carbon dioxide (CO2)emissions--is ongoing. But despite being a global focus, the pace of carbon reduction isnot uniform throughout the sector and we expect that, by the next decade, coalgeneration will still represent over 25% of total generation.
- Nuclear generation, while a zero-carbon emitter, still has significant environmental risksbecause of its higher-risk operations and nuclear waste.
- Although natural gas generation emits about half the CO2 as coal, we view gas-firedgeneration as a bridge to a carbon-neutral environment and as an effective interimmeans to handle the intermittency of renewable generation.
- The sector has a considerable influence on local communities, including on customers'electric bills, as a local employer, as a significant contributor to local taxes, and byensuring safe operations at generating facilities.
The ESG Risk Atlas
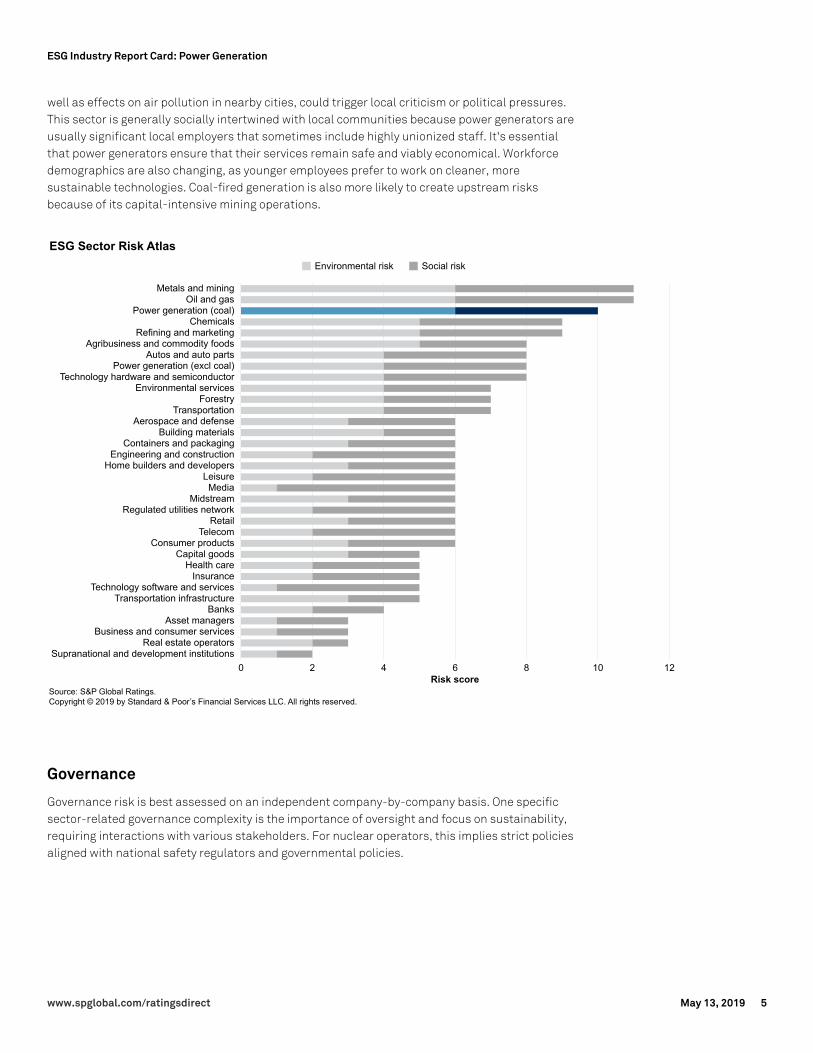
To calibrate the relative ranking of sectors, we use our environmental, social, and governance(ESG) Risk Atlas (see "The ESG Risk Atlas: Sector And Regional Rationales And Scores," publishedMay 13, 2019). The Risk Atlas provides a relative ranking of industries in terms of exposure toenvironmental and social risks (and opportunities). The sector risk atlas charts (shown below)combine each sector's exposure to environmental and social risks, scoring it on a scale of 1 to 6. Ascore closer to 1 represents a relatively low exposure, while 6 indicates a high sectorwideexposure to environmental and social risk factors (for details see the Appendix). This report cardexpands further on the Risk Atlas sector analysis by focusing on the credit-specific impacts, whichin turn forms the basis for analyzing the exposures and opportunities of individual companies inthe sector.
ESG Industry Report Card: Power GenerationMay 13, 2019
The environmental risks from power generation (excluding coal-fired generation) have a materialimpact on the sector's credit quality, primarily due to emissions (in the case of gas-fired power)and waste from nuclear power. Social factors are important too, as power generators create localjobs, affect local property taxes, and provide of an essential service that must remain competitiveand reliable. We assess the non-coal power sector as being significantly exposed to environmentalfactors, even though the industry already has taken substantial transformative steps over thepast decade to deal with the rising share of renewable generation, which will likely continue. Wemake the following distinctions across asset classes:
Gas: We see gas-fired power's environmental exposure stemming mainly from the fact that itcreates CO2 emissions. That said, we differentiate gas from coal because gas emits half of theemissions and we believe gas-fired generation is a vital bridge to a carbon-neutral environment,notably to handle the intermittency of renewable generation. This is especially the case in NorthAmerica given its plentiful shale gas reserves. Depending on the region, gas-fired powergeneration (like coal) may face headwinds from the rapid rise of renewable capacity and fromhigher carbon pricing/taxes. Longer-term risks could stem from potential targets for CO2emissions, as well as battery storage that supports further growth in renewables.
Nuclear: Major environmental risks for nuclear generation center on the long-term storage ofnuclear waste and high water usage. The limited visibility on the technical (and financial) impact ofnuclear storage remains an important credit risk, in our view, with high amounts of assetretirement provisions on company balance sheets (unless transferred to the state, in somecountries). Finally, given nuclear plants' extreme safety requirements, risks stemming fromphysical climate change (including rising sea levels) may be low probability, longer-term riskfactors. At the same time, we recognize the low-carbon impact of nuclear power. For example,nuclear plants generated nearly 20% of the U.S.'s overall electricity and 63% of its carbon#freeelectricity. It thus remains the largest producer of zero-carbon electricity in the U.S., avoiding over545 million metrics tons (mt) of GHG emissions in 2017, which would have been emitted if allnuclear generation been produced at the national average emissions rate. This compared tohydroelectricity, which avoided 200 million mt, wind (175 million mt), and solar (about 40 millionmt).
Renewables/hydro: Renewable power generation has a stronger environmental assessment thanthe power industry in general. Key factors we focus on are methane emissions for large hydro (intropical areas), while land use and its effect on biodiversity also is a growing focus. Generally,hydro, wind, and solar use exponentially more land mass to produce the same amount ofelectricity as electricity from fossil fuels or nuclear. Such large land use, in certain circumstances,can significantly alter the ecosystem and hurt the environment. This risk has been reduced by theincreasing use of land in non-greenfield areas.
Social exposure (Risk Atlas: 4)
We assess social exposure as meaningful. This incorporates the important role that this sector
www.spglobal.com/ratingsdirect May 13, 2019 2
ESG Industry Report Card: Power Generation
plays within communities as a provider of an essential service that must remain affordable andreliable. Any disruption of these services, as well as any negative impact they may have on nearbycommunities, could trigger local criticism or political pressures. These sectors are generallyinvested in having significant community engagement because the company may be a large localemployer (that sometimes has unionized staff) and significant contributor to the local property taxbase. Renewables/hydro may have somewhat better social acceptance given its environmentalbenefits. Still, the planning of wind farms is sensitive to local community acceptance while largehydro can face severe opposition if it disrupts the peoples' lifestyles or the landscape.
On the other hand we believe nuclear plants have higher social exposure given the sensitivityaround safety. A less likely but high-impact severe nuclear incident could jeopardize a company'slicense to operate. Although we believe the nuclear industry has made positive strides to improveoperations and security, the 2011 Fukushima nuclear incident underscores the severity offinancial impacts and abrupt changes to national social and energy policies.
Coal-Fired Generation
We view environmental risk to the power generation sector, which has material exposure tocoal-fired generation, as an important ratings driver. We believe that the environmental risks fromadvancing regulations will significantly raise costs and create regulatory constraints for
www.spglobal.com/ratingsdirect May 13, 2019 3
ESG Industry Report Card: Power Generation
generators with coal-fired exposure. Social exposure to this sector is significant too, underscoringthe importance of utilities as large recruiters in their local communities and as providers of anessential service that must remain competitive and reliable.
Environmental exposure (Risk Atlas: 6)
In terms of ESG factors, environmental risks are main issue for power generators because of theirexposure to fossil fuels. Coal-based power generation causes significant environmental damageas one of the leading CO2 emitters. Even with materially higher electricity generated throughrenewables and better energy storage, we continue to expect that coal-fired fossil fuel powergeneration will continue to represent more than 25% of all electricity generated over the nextdecade. This also takes into account the need for consistent, non-intermittent base loadgeneration and the security of supply issues, as several countries (notably China) have abundantdomestic coal supplies.
The industry has taken many steps over the past decade to reduce many non-CO2 pollutants(albeit the pace of carbon reduction is not uniform). We nevertheless view the coal power sector asvulnerable to cost escalations (e.g. a higher carbon tax) or increasing regulatory constraintscombined with direct governmental policies (requiring the phase-out or shuttering of themost-polluting coal plants while increasing the share of renewables). However, we expect theexposure will vary greatly based on regional emissions standards. For example:
- We estimate that high emissions costs in the form of a carbon or environmental tax couldultimately reduce EBITDA by as much as 10% for U.S. coal generators. A major step has beenthe industry's effort to retrofit several of its coal-fired conventional generation units to acceptnatural gas (coal-to-gas conversion).
- The U.K. instituted a specific carbon tax of £16 per tonne for 2019, hitting coal-fired plantshardest since their carbon intensity is over twice as much as gas-fired plants. Germany justannounced its strategy to phase out lignite power plants by 2036. Even if there remains politicalsupport for coal-plants in several Eastern European countries (supported by the importance oftheir domestic coal mining industries), it's very likely there could be shift in sentiment or directconstraints coming from Europe-wide objectives over the next decade.
- In China, coal-generation still accounts near 70% of power generation, but it's already beendecided that the most-polluting assets will be taken offline because renewable and nuclearnew builds have become the national priority. China's national emissions trading scheme,launched in December 2017, aims to cover emitters across the coal power sector at the outset;until the ramifications are finalized and trading kicks start, the impact on generators remainsto be seen.
- Chile, where the installed capacity is 21% coal-based and 12% diesel, started to apply a greentax of US$5.00 for every tonne of CO2 pollutants emitted (under Law 20.780/2014) as a way toreduce its greenhouse gas (GHG) emissions by at least 30% by 2030 compared to 2007. Itparticularly affects generators operating thermal plants with installed capacities equal orlarger than 50 megawatts (MW).
Social exposure (Risk Atlas: 4)
Ineffective management of the sector's social risk could also represent a significant credit risk, inour view. The sector plays an important role within communities because it provides an essentialservice that must remain competitive and reliable. Any significant disruption of these services, as
www.spglobal.com/ratingsdirect May 13, 2019 4
ESG Industry Report Card: Power Generation
well as effects on air pollution in nearby cities, could trigger local criticism or political pressures.This sector is generally socially intertwined with local communities because power generators areusually significant local employers that sometimes include highly unionized staff. It's essentialthat power generators ensure that their services remain safe and viably economical. Workforcedemographics are also changing, as younger employees prefer to work on cleaner, moresustainable technologies. Coal-fired generation is also more likely to create upstream risksbecause of its capital-intensive mining operations.
Governance
Governance risk is best assessed on an independent company-by-company basis. One specificsector-related governance complexity is the importance of oversight and focus on sustainability,requiring interactions with various stakeholders. For nuclear operators, this implies strict policiesaligned with national safety regulators and governmental policies.
www.spglobal.com/ratingsdirect May 13, 2019 5
ESG Industry Report Card: Power Generation
North America
Company/Rating/Comments Country Analyst
Non-coal
Atlantic Power Corp. (B+/Positive/--) Canada Tony Mok
Natural gas-fired assets contribute to a large portion of APC's generation capacity. While these assets are more environmentally friendly thancoal, they still rely on fossil fuels and contribute to GHG emissions. Legislative or regulatory changes in the U.S. and Canada may require lowerGHG emissions in the natural gas sector, possibly affecting APC's natural gas businesses. We believe APC's exposure to conventionalgeneration is partially offset by the portfolio's diversity in fuel type, with hydro and biomass in the mix.
Brookfield Infrastructure Partners L.P. (BBB+/Stable/--) U.S. MichaelFerguson
BIP has subsidiaries that operate ports and terminals, toll roads, telecommunication and broadcasting towers, utilities, midstream andpipelines, and district heating and cooling, to mention a few. These subsidiaries are involved in using, handling, or transporting substances thatare toxic, combustible, or otherwise hazardous to the environment, and therefore we believe environmental factors are key drivers of itsoperational and financial performance. Any leaks, spillage, or emissions may result in regulatory infractions, damage to the environment,injury, or loss of life. That said, BIP along with its parent Brookfield Asset Management, has various policies and steps that minimize itsoperations' environmental impact and utilize resources more efficiently. BIP has also been taking steps to better the environment, includinginstalling a closed-loop chilled water system for heating or cooling in over 150 buildings in Toronto, reducing energy use by approximately 90%compared to conventional in-house fuel-based or electrical cooling systems. It also began constructing a green highway overpass in Brazil tohelp wildlife in the surrounding areas safely pass across the highway, which had seen more than 3,000 wildlife fatally injured over the previous10 years. BIP has demonstrated its satisfactory governance assessment by executing its strategy and achieving results consistent with itspublic guidance.
Brookfield Renewable Partners L.P. (BBB+/Negative/A-2) U.S. MichaelFerguson
Most of BEP's generation assets are renewable, with about 75% hydro, 20% wind, and the rest solar power. With GHG emissions of about 0.3million metric tonnes of CO2-equivalent in 2018, BEP is one of the lowest GHG emitters among global power generation companies. BEP'sportfolio depends on the availability of natural resources like wind and hydrology levels and it is exposed to the physical impacts of climatechange, like droughts. BEP has to manage its underlying water resources efficiently to minimize biodiversity changes and maintain the naturalecology to minimize its environmental impact. Temporary water stresses could be alleviated by efficient water management practices. About55 of its hydro facilities (out of approximately 218) have received the Low Impact Hydropower Institute Certification. BEP has a relatively strongmanagement and governance, reflecting its clear strategy for developing renewable assets and its execution process.
Calpine Corp. (B+/Stable/--) U.S. AneeshPrabhu
Calpine is one of the larger U.S. independent power producers at 26 GW of generation capacity, which is highly efficient relative to assets inpeer portfolios. While this lack of diversity is a risk since it relies on a single fuel, from an environmental perspective, we see the reliance onnatural gas generation assets--and some geothermal generation--as a significant advantage. Transparency and governance issues arose whenthe company was taken private by Energy Capital Partners. Although the company has remained consistent on its deleveraging targets and isgenerating cash flow (and deleveraging), transparency of disclosures has declined. In response to lender concerns, Calpine has committed todebtholders that it will schedule quarterly earnings releases and will attend industry conferences to provide greater transparency to itsfinancials. We expect that, going forward, the company will provide greater transparency on its consolidated cash flow build-up.
Clearway Energy Holding (BB/Stable/--) U.S. AneeshPrabhu
CWEN has a relatively low carbon footprint relative to other power industry peers, as about 3.3 GW of its overall 5.4-GW fleet is engaged in solaror wind generation. The company's growth plans--currently slowed by its exposure to PG&E--also focus more on renewable energy, althoughlong-term contracted gas-fired generation is also a preferred investment. We consider CWEN's governance as favorable from a bondholder'sperspective. Despite focusing on maximizing current yield, CWEN's board acted quickly to revise its dividend payments--which are nowequivalent to an 80% pay-out of the company's cash flow available for debt service (excluding PG&E)--following PG&E's bankruptcy filing. Wesee this as credit protective because it provides the company with a capital cushion for balance sheet management if its projected cash flowsare compromised or restricted for a prolonged timeframe. We believe it's important for companies like CWEN with diverse portfolios (includingrenewable and conventional generation) to provide enhanced disclosures. This is because many investors have advised us that they areunwilling to invest in green offerings from a YieldCo because they also have conventional businesses, and that funds raised through greenofferings get comingled in the company's general revenues.
Covanta (BB-/Stable/--) U.S. KimberlyYarborough
www.spglobal.com/ratingsdirect May 13, 2019 6
ESG Industry Report Card: Power Generation
Covanta uses exclusively energy-from-waste (EfW) and renewable assets (concentrated in the Northeast U.S.), which not only reduce GHGemissions, but EfW is a technologically advanced method for waste disposal (by avoiding methane from landfills). Since 2007 Covanta hasreduced emissions by more than 50%, which we believe is a competitive advantage. Additionally, we view governance as a relative strengthgiven modest growth targets, prudent risk management, and a strong development pipeline that provides visibility into future growthprospects. As an EfW company, we view Covanta's current safety management system to be in line with industry standards. Communitypartnership and outreach programs have helped Covanta operate seamlessly where its facilities are located. In the near term, we don't believesocial risks from communities or the workforce will hamper its credit quality.
Edison International (BBB/Watch Neg/A-2) U.S. GabeGrosberg
Because climate change has intensified the severity and frequency of wildfires in California, environmental factors have become an integralpart of our credit analysis on the state's electric utilities. Inverse condemnation exacerbates the operational and financial risks that climatechange introduces for the company. Furthermore, the company’s service territory has already faced catastrophic wildfires in both 2017 and2018, demonstrating its susceptibility and exposure to wildfires and climate change. As such, we believe the company is more exposed toenvironmental risk compared to the vast majority of peers. In our view, the company's social risks are also high reflecting its communities'susceptibility to wildfires and the potential for higher customer bills in the near-term due to the need to invest in wildfire mitigation hardening,technology, and the uncertainty of how costs will be socialized.
EGR IV LLC (B/Watch Neg/--) U.S. Safina Ali
renewable assets--of which about 45% are solar, 45% are wind, and 10% are biomass--over the debt term. With a portfolio of all renewables,EGR IV is relatively better positioned in terms of carbon emissions than peer companies that primarily hold coal and natural gas assets. In ourbase-case forecast, we consider the variability in EGR IV's cash flows due to the intermittent nature of renewable assets. We also consider theoperating cost structure to be less complex and more predictable than coal/gas generators because it's simpler to operate solar and windassets. From a governance standpoint, we believe EGR IV's sponsor, Exelon Corp.'s, governance practices are consistent with other publiclytraded utilities.
Exelon Corp. (BBB+/Stable/A-2) U.S. GabeGrosberg
Exelon's large nuclear generation portfolio (over 80% of its generation output) exposes the company to significant environmental riskscompared to peers because nuclear operations present significantly higher operating risks and unique risks related to nuclear wastemanagement. However, the company has significantly lower emissions than peers with a material generation portfolio since it depends onzero-emissions nuclear generation, as well as a portfolio of wind, solar, and hydro assets. Exelon is the largest generator of zero-emissionelectricity in the U.S., producing almost two times more zero-carbon megawatt hours (MWh) than the second-largest producer. Furthermore,about 65% of the company comprises transmission and distribution operations with minimal exposure to environmental risk. From a socialperspective, the company is investing over $5 billion annually to modernize its utility electric and natural gas transmission and distributioninfrastructure, which has contributed to increased reliability and customer satisfaction across its utility service territory. At the same time, thecompany's ability to continue to invest in infrastructure improvements while managing sustainable increases in customer bills is key tomaintaining credit quality. We believe governance factors support Exelon's investment-grade credit quality and are in line with peers.
Innergex Renewable Energy (BBB-/Negative/--) Canada Luqman Ali
Innergex's power generation assets are mostly renewable, with net installed capacity of approximately 2.1 GW as of December 2018. About38% is hydro, 55% wind, 2% solar, and 5% geothermal. With the focus on renewable energy, governments have introduced various measureslike portfolio standards and other incentives to increase renewable capacity in the electricity generation supply mix. Innergex is committed toproducing energy exclusively from renewable sources in all countries where it operates and has only added renewable capacity since 2014.From a governance standpoint, we believe Innergex's management has a good operating history, with policies to oversee management andbusiness affairs. The company has not been subject to any material investigations on bribery or corruption in the past. In addition, we do notsee any social factors having a material impact on credit.
NextEra Energy Inc. (A-/Stable/--) U.S. GabeGrosberg
NextEra's owns over 45 GW of generation capacity through its regulated utility operations and competitive businesses. While the vast majorityof the company's generation is from natural gas (about 45%) and renewables (about 40%), about 15% of the company's generation mix is fromnuclear, which although carbon-free, exposes the company to potentially higher operating risks and longer-term nuclear waste storage risks.The company also operates its utilities in a region of the U.S. prone to frequent hurricanes, which could increase the company's risk exposurebecause climate change is intensifying the severity and frequency of these natural disasters globally. However, the company minimizes theserisks through storm hardening and effectively managing regulatory risk by allowing for the timely recovery of storm costs. NextEra's ability todeliver safe and reliable services to customers while maintaining customer bills at 30% less than the national average is a positive socialfactor. Furthermore, the company's recent acquisition of Gulf Power and its intent to proactively lower customer bills while reducing its carbonfootprint further demonstrates its commitment to local communities. Overall, we believe that NextEra's management of social risks isconsistently better than peers. We view governance factors as supporting NextEra's investment-grade credit quality and in line with peers.
NextEra Energy Partners (BB/Stable/--) U.S. AneeshPrabhu
www.spglobal.com/ratingsdirect May 13, 2019 7
ESG Industry Report Card: Power Generation
We see NEP's blend of wind (59%), solar (22%), and gas pipelines (19%) by aggregate distribution as a healthy mix from an environmentalperspective, offering the company diversity across fuel type, geography, and scale. The geographical diversity across 16 states is also betterthan peers. NEP's wind and solar power plants give it a competitive edge environmentally since it means reduced emissions; however, its gaspipelines could experience spills or leaks that affect biodiversity. Significant ownership by parent NextEra Energy Inc. (NEI) raises governanceissues and NEP has taken elaborate steps to distance itself from NEI. Management believes that because NEP's size and scale have grownsignificantly, it's now independent of NEI. NEP GP ceded control of NEP through certain governance changes in 2017, which including a cutbackto 5% of NEP GP's voting power. The board can oversee and direct NEP's operations, policies, strategies, and management without oversightfrom NEP GP. Moreover, the board comprises seven directors: three NEP GP-appointed directors and four independently elected directors.While we see the distancing of NEP from NEI as favorable from a governance perspective, there are still many business interrelationshipsbetween them, including a management services agreement, an operations and maintenance agreement, and an administrative servicesagreement. There are also no NEP employees, for instance, unlike peers like Atlantica Yield, which have clearly delineated the operations of theYieldCo from Abengoa. While such services can be provided by third parties, we still see believe NEP depends on NextEra Energy Resources andNEI.
Pattern Energy Group (BB-/Stable/--) U.S. KimberlyYarborough
Given that PEGI is a power generator, environmental and governance factors dominate our ESG assessment of the company, with social havinga secondary credit impact. While carbon is currently not priced throughout the U.S. at this point and despite the unwinding of the Clean PowerPlan, long-term environmental risks for generating assets remain significant longer term. PEGI invests in exclusively renewable assets (withmuch of the portfolio in the U.S.), which is a competitive advantage. Current power purchase agreements (PPAs) largely support state-levelrenewable mandates, which will likely heighten over time. While not likely during the next few years, a longer- term price on carbon benefits aportfolio like this one at the expense of fossil-fuel fired generation. Additionally, PEGI's governance is a relative strength given modest growthtargets, prudent risk management, and a strong development pipeline that provides visibility into future growth prospects. As a (renewable)generator and not a load-serving entity, we do not see social risks from communities or workforce as material for PEGI. In our view, PEGIbenefits from a lower cost structure than fossil fuel-tilted peers given its leaner workforce for renewable assets relative to conventional powerplants.
Sempra Energy (BBB+/Negative/A-2) U.S. GabeGrosberg
Because climate change has intensified the severity and frequency of wildfires in California, environmental factors have become an integralpart of our credit analysis on Sempra. Sempra's largest subsidiary, San Diego Gas & Electric Co. (SDG&E), reduced this risk by developing andimplementing sophisticated analytics and an advanced wildfire warning system that includes weather stations and fire cameras. Thetechnology can identify the wildfire's GPS coordinates, which can then be communicated to the appropriate state agencies to extinguish thefire at its earliest stage. In our view, wildfire mitigation and prevention investments over the past decade have reduced the risk of catastrophicwildfires in the communities it serves, thereby reducing social risks compared to peers. Governance issues are neutral in our ESG analysis.
TerraForm Power (BB-/Stable/--) U.S. Luqman Ali
While carbon is not priced throughout the U.S. at this point, despite the unwinding of the Clean Power Plan, long-term environmental risks forgenerating assets remain significant longer term. TERP's investment in exclusively renewable assets (with much of the portfolio in the U.S.) is acompetitive advantage. Current PPAs largely support state level renewable mandates, which will likely heighten over time. While not likelyduring the next few years, a longer-term price on carbon benefits a portfolio like this one at the expense of fossil fuel-fired generation.Additionally, TERP's governance is now a relative strength. Under previous ownership, the issuer created targets for growth that led todebt-fueled acquisitions, weakening credit quality and limiting the financial flexibility this business model requires. The issuer was also, for atime, unable to file financial statements on time; governance, thus, became a very material credit risk. However, growth targets are much moremodest now under Brookfield's ownership, and TERP has provided greater transparency to the market, such that unexpected negative financialperformance for reasons other than resource adequacy is less likely. Because TERP is a generator and not a load- serving entity, its social risksare somewhat more remote.
Coal
AES Corp. (BB+/Stable) U.S. AneeshPrabhu
Environmental risks are most relevant to our assessment of AES' credit quality. With 29% of its capacity generated via renewables, we viewAES' carbon footprint as a relative disadvantage compared to the industry, which is increasingly moving toward carbon-free generation.However, AES has specifically directed capital to reducing its carbon intensity, exiting via sale or shutdown 4.6 GW of coal generation andcommitting to build no new coal projects. AES has been mitigating its coal exposure, which is down to 32% for 2018 from 41% in 2015. Thecompany aims to reduce its carbon intensity by 50% by 2022 and 70% by 2030. While we see a significant shift in AES' ESG strategy, includingits focus on growing renewables and the acquisition of sPower, a renewables platform, the company continues to have a significant portion ofcoal generation in its portfolio. The company has commissioned over 5.5 gigawatts of coal-fired generation globally (e.g. India, Philippines,Vietnam, Chile, and Bulgaria) over the past 15 years, the last of which was commissioned as recently as 2018. While social factors do not play amajor role in our rating on AES, we monitor its employment conditions since it operates in many developing countries. The company'sdisclosures, which we view as below average because of a complicated organizational structure, have steadily improved as it exits manyregions of operations but also because the company is making significant efforts to reduce its carbon intensity, consistent with customer andinvestor demand.
www.spglobal.com/ratingsdirect May 13, 2019 8
ESG Industry Report Card: Power Generation
American Electric Power Co. (A-/Stable/ A-2) U.S. GerritJepsen
With a total generation fleet capacity of over 32,000 MW, of which 75% is based on fossil fuels (about 47% coal; 28% natural gas), AEP'senvironmental footprint is a material risk factor and significantly less than peers. The company's reliance on coal-fired generation exposes it tothe ongoing cost of operating older units in the face of disruptive technological advances and the potential for more environmental regulationsrequiring significant capital investments. In addition, AEP also has exposure to nuclear generation (7% of the generation fleet), whichintroduces higher operational risks and plant retirement responsibilities. From a social perspective, AEP's internal safety and healthmanagement systems enable it to effectively serve customers in 11 states--one of the largest service territory footprints in North America.Cost-reduction efforts helped stabilize operations and maintenance costs in an inflationary economic environment, facilitating competitiverates. This is important because all transmission and distribution companies are spending on upgrading, modernizing, and hardening assetsfor weather and technological reasons. Its governance practices are consistent with other publicly traded utilities.
ATCO (A-/Stable) Canada Andrew Ng
ATCO' has approximately 2,290 MW of generation capacity, of which about half is coal-fired. ATCO's management is trying to reduce itsenvironmental footprint, including transitioning its coal-fired power plants to natural gas by 2020 to implement the Alberta provincial policygoals, which phase out coal-fired generation by 2030. It also announced in September 2018 that it's exploring strategic alternatives for itsCanadian electricity generation operations. From a social perspective, the company's long track record of providing safe and reliable gas andelectric utility services should help maintain social cohesion. Governance factors are neutral to our ESG assessment. ATCO has an independentboard of directors that we believe is capably engaged in risk oversight on stakeholders' behalves.
Berkshire Hathaway Energy (A/Stable/A-1) U.S. GerritJepsen
Of Berkshire Hathaway Energy's roughly 32,000 MW of generation capacity, about 35% is from renewables, about 30% is from natural gas,about 30% is from coal, and about 5% is from nuclear. Over the past decade, the company has also aggressively expanded its wind generationassets, reducing its carbon footprint. We expect the company will continue its strategy of increasing generation from renewables and reducingcarbon emissions. While nuclear energy is a small portion of the generation mix and emits no CO2, it exposes the company to higher operationalrisks, nuclear waste risks, and plant retirement responsibilities. Social factors are neutral to our ESG assessment and are consistent with otherpeers. By pursuing greater renewable generation, the company is meeting customer demand for greener energy. Moreover, through some of itssubsidiaries, the company offers residential energy efficiency programs to reduce everyday use and help ratepayers save on energy costs.Governance factors are also neutral to our ESG assessment and its and Berkshire Hathaway Energy's governance practices are consistent withother utilities.
Dominion Energy (BBB+/Stable/ A-2) U.S. Matt O’Neill
Although Dominion Energy has been gradually reducing its exposure to coal generation, just under 20% of its net generation capacity is sourcedfrom coal, exposing it to higher emissions and risks related to coal ash remediation. Furthermore, the company's nuclear generation (just above20% net generation capacity) exposes it to higher operating and nuclear waste management risks. But the company has been trying to reduceits environmental footprint--it has reduced its emissions rate by more than 50% from 2000 levels and has committed to installing 3,000 MW ofsolar and wind generation by 2022. The company recently announced its updated emissions targets of 55% carbon emissions levels versus2005 levels by 2030. The company has already begun closing coal plants to meet these targets. From a social perspective, the company facesrisks like gas leaks that could cause significant financial liabilities and disrupt the communities it serves, given that about 30% of itsoperations consist of natural gas transmission and distribution. However, this risk is partially mitigated by the company's ongoing investmentsto enhance the safety and reliability of its natural gas infrastructure by fully replacing or upgrading it over the next 15 years, which is soonerthan many peers. Dominion is one of only three utility companies with an environmental justice policy, which ensures that all stakeholders,including local communities, have a voice in decisions on infrastructure investments. We view governance factors as supporting the company'sinvestment-grade credit quality and in line with peers. The board also recently created a Sustainability and Corporate Responsibility committeeto oversee the environmental justice policy.
DTE Energy (BBB+ /Stable/A-2) U.S. Matt O’Neill
DTE has substantial exposure to environmental risks compared to peers given its heavy dependence on coal-fired generation and exposure tonuclear generation. Coal-fired generation contributes about 60% of DTE's net generation portfolio, significantly increasing its carbon footprintcompared to peers. However, the company is trying to reduce its carbon footprint by retiring 11 of its 17 coal-fired units by 2023 and replacingthat capacity with clean energy sources. Only about 10% of the company's current generation mix is sourced from hydro, wind, and solar.Furthermore, the company's nuclear generation (about 10% of net generation capacity) comes with higher operating and nuclear waste risks.From a social perspective, the company's ability to transition its coal-based generation to clean energy sources while maintaining sustainablerate increases to customers is key to maintaining credit quality. We view governance factors as in line with peers.
Duke Energy (BBB+/Stable/A-2) U.S. ObiomaUgboaja
Approximately 75% of Duke's total electric generation fleet capacity of almost 51 gigawatts (GW) are fossil fuel-based (30% coal; 45% naturalgas), which exposes it to the ongoing cost of operating older units in the face of disruptive technological advances and the potential forchanging environmental regulations that may require significant capital investments. Furthermore, the company has faced significantenvironmental, social, and financial repercussions from closing its coal ash ponds in North Carolina, but is mitigating this risk though thestate's regulatory framework, which allows coal ash remediation costs to be recovered. However, any more future regulatory disallowances
www.spglobal.com/ratingsdirect May 13, 2019 9
ESG Industry Report Card: Power Generation
related to the company's environmental remediation still poses some risk. In addition, the company's carbon-free nuclear generation portfolioincreases its operating risk and exposes it to longer-term nuclear waste storage risks. On the gas side, older assets are susceptible to naturalgas leakages, emitting methane. Overall, we assess Duke's environmental risk as higher than most peers given its multifaceted environmentalexposure, but its social and governance risk factors are in line with peers.
Emera (BBB+/Negative) Canada Mayur Deval
With about 8,300 MW of generation capacity, of which 33% is coal-based and 53% is sourced from natural gas, Emera's environmental risksare relevant and higher than peers. The company's reliance on coal-fired generation exposes it to the ongoing cost of operating older units inthe face of disruptive technological advances and the potential for more environmental regulations requiring significant capital investments.However, the company is heavily investing in solar generation in Florida and has added 600 MW of wind capacity in Nova Scotia, and has plansto further reduce its coal-based generation, shifting to cleaner, natural gas. We assess Emera's social risks as somewhat above peers,incorporating its history of safety-related incidents in Florida. Emera's governance practices are consistent with other publicly traded utilities.
NiSource Inc. (BBB+/Negative/A-2) U.S. Matt O’Neill
NiSource has faced environmental and social impacts following the recent gas explosions in Northern Massachusetts. There was one fatalityand multiple injuries, as well as damage to dozens of structures. Thousands of customers were evacuated. The cause was over-pressurized gasmains, which raises questions about the company's safety and the reliability of its distribution network. Since this incident the company hasmodernized its aging pipeline infrastructure in Northern Massachusetts and has been improving its safety and relationships with thecommunity. Given the event's magnitude, timely recovery of costs remains uncertain. Apart from these explosions, natural gas pipelines areexposed to other environmental risks like methane leakages and contaminated drinking water supplies due to spills. The company's generationis also mostly coal-fired, exposing it to various environmental regulations and emissions standards; however, NiSource plans to replace mostof its coal generation fleet by 2023 with renewables. We view the company governance practices as consistent with peers.
NRG Energy (BB/Stable) U.S. AneeshPrabhu
NRG is among the larger power generators in the U.S., with less than 25% of revenues derived from coal-fired assets. The company's pastacquisitions did not preclude ownership in coal-fired generation (GenOn and Edison Mission) but it subsequently took steps to mitigate itscoal-fired exposure, including converting many of its units from coal to gas. The company also piloted the world's largest carbon sequestrationfacility (Petra Nova) at its Parish facility. Still, despite the power industry's shift toward renewables, NRG has largely exited this space, initiallyin residential solar (where it was arguably struggling), but also by selling the former NRG Yield Inc. We considered the sale of NRG Yield as astrategic shift because NRG started the YieldCo wave. We think there can be agency issues if activist shareholders, who may have ashorter-term investment horizon, exert influence on the company's longer-term strategy. We viewed the active role played by Elliot andBluescape---which have since exited their investment in NRG--as negative for long-term strategy, as well as social factors, even as theybrought activist scrutiny to governance. We saw elevated social risks while these investors were active because of their focus on cost cuttingeven though NRG's cost structure appeared higher than industry peers.
Public Service Enterprise Group (BBB+/Stable/A-2) U.S. MatthewO'Neill
PSEG Power has a low intensity rate since more than half of its power comes from nuclear generation. In 2017, PSEG retired its New Jerseycoal-fired units, and it expects to retire its Connecticut coal assets in 2021. PSEG recently constructed two new natural gas-firedcombined-cycle power plants and is expecting to complete a third unit in 2019. The combination of coal plant retirements, newly constructedefficient gas plants, and a continued expansion into renewable energy will help the company make progress toward its recently updated goal ofeliminating 13 million metric tons of CO2-equivalent by 2030 from 2005 levels. However, PSEG doesn't have a renewable portfolio like some ofits peers and relies on nuclear power for about 45% of its 53 terawatt hours (TWh)-56 TWh of generation. PSEG Power's nuclear assets in NewJersey are large, carbon-free energy sources and important contributors to its low carbon intensity rate. However, the company has publiclystated that these units would be decommissioned if state legislators and regulators don't provide financial support for them soon. PSEG Poweris not a load-serving entity, therefore we see limited social risks from local communities or its workforce. However, closing the nuclear unitswould affect local communities significantly. Governance factors are consistent with what we see across the industry.
Southern Co. (A-/Negative/A-2) U.S. ObiomaUgboaja
Approximately 75% of Southern's total electric generation fleet capacity of almost 45 GW is fossil fuel-based (35% coal; 40% natural gas),which exposes it to the ongoing cost of operating older units in the face of disruptive technological advances and the potential for changingenvironmental regulations requiring significant capital investments. In addition, the company's carbon-free nuclear generation portfolio (about5%) and its Vogtle nuclear plant increases its operating risk and exposes it to longer-term nuclear waste storage risks. While the company hasa long-term stated goal to significantly reduce its carbon emissions, the 2050 timeframe is beyond our base-case assessment.
Talen Energy (B+/Negative) U.S. KimberlyYarborough
Talen's relatively lower carbon-free capacity (15% of a 15-GW fleet that also exposes Talen to asset concentration risk in one nuclear unit) is arelative disadvantage to peers. Talen has limited defenses against disruption because it has limited retail power and renewable businesses.Portfolio concentration in the PJM region makes it vulnerable to regulatory uncertainty in PJM's capacity and energy markets (even asdevelopments in the regional transmission organization look encouraging). As a result, Talen has focused on lowering its cost structure. While
www.spglobal.com/ratingsdirect May 13, 2019 10
ESG Industry Report Card: Power Generation
the company has achieved greater success controlling and reducing costs than we expected, some of this has been from a reduction in labor,which could elevate social risks from the impact retrenchment causes in local communities. Disclosures have been average compared topublically rated peers since the company was taken private.
Vistra Energy (BB/Stable) U.S. AneeshPrabhu
With one of the larger coal-fired fleets in the Electric Reliability Council of Texas, Vistra's carbon footprint was significant, especially becausethe Sandow unit was supported by Vistra's Three Oaks coal mine. In late 2017, Vistra announced the closure of nearly 4.2 GW of its coal-firedcapacity as well as the mine, which we view favorably. This is somewhat offset by the social and cost effects of future asset retirementobligations (AROs), reflected in the debt adjustment in our financial analysis. We still see some of Vistra's coal-fired units as at risk. Theirpotential shuttering would improve environmental factors but could somewhat elevate social risks.
Xcel Energy (A-/Stable-A-2) U.S. GerritJepsen
Xcel's fuel mix consists of approximately 23% renewables, 13% nuclear, 23% natural gas, and 37% coal. The company's reliance on coal-firedgeneration exposes it to the ongoing cost of operating older units in the face of disruptive technological advances and the potential for moreenvironmental regulations requiring significant capital investments. However, the company is trying to reduce its carbon footprint; itsnear-term plans are to retire 1,400 MW of coal-fueled generation in the upper Midwest that will subsequently be replaced with a $3 billioninvestment in a combined cycle natural gas plant and 1,850 MW of wind generation. Also in Colorado, the company plans to retire additionalcoal-based generation and invest in wind, solar, and existing natural gas resources, as well as add 275 MW of large-scale battery storage. Bypursuing greater renewable generation, the company is meeting customer demand for greener energy. Additionally, Xcel operates two nuclearplants, expected to remain open through 2034, that generate around 1,700 MW of power. Although carbon-free, the company's nucleargeneration portfolio increases operating risk and exposes it to longer-term nuclear waste storage risks.
Europe, Middle East, And Africa
Company/Rating/Comments Country Analyst
Atomic Energy Power Corp. (BBB-/Stable/A-3) Russia Sergei Gorin
As a global nuclear player with about 36% global market share in uranium enrichment and about 17% in nuclear fuel fabrication,AEPC is exposed to nuclear power's environmental challenges, which constrains our assessment of the business. We also believeWestern Europe's gradual phase-out of nuclear energy could hurt long-term demand for AEPC's nuclear fuel exports. From asocial standpoint, Russia is generally supportive of nuclear energy, as illustrated by favorable capacity market arrangements andpriority market access, which strengthens AEPC's profitability and competitive position. Under Russian law, AEPC is onlyresponsible for nuclear liabilities incurred after 2012, leading to relatively fewer liabilities than peers (RUB145.3 billion, or US$2.1billion at year-end 2018). Positively, most of AEPC's international projects are in nuclear-supportive countries like Turkey, India,and China, and AEPC is a big global player in the potentially expanding nuclear waste storage and decommissioning business.Governance-wise, our expectation of extraordinary state support partly stems from AEPC's strategic and social importance toRussia. Although the Russian government controls AEPC via 100% state holding Rosatom, our rating on AEPC factors in potentialextraordinary state support but not group influence because we believe the government is the ultimate decision-maker and wouldmitigate any potential extraordinary negative interference from the group.
CEZ a.s. (A-/Stable/--) CzechRepublic
Pierre Georges
Over the past decade CEZ has committed to generate carbon-neutral electricity before 2050 and has implemented severalmeasures to reduce its CO2 emissions intensity (0.39 tons of CO2/MWh in 2018 compared to 0.57 tons of CO2/MWh in 2010) byupgrading its lignite fleet and planning to close some of its least efficient lignite and hard coal plants. We believe CEZ remainssignificantly exposed to challenges from carbon price developments and EU decarbonization objectives in light of itscarbon-intensive fleet (electricity generation from coal was approximately 43% of total output, or 27.0 TWh, in 2018). Additionalrisks lie in its sizeable nuclear fleet (47% of output in 2018). The group recently mismanaged the surveillance of its reactors,causing significant outages and additional costs. Its end-of-cycle liabilities (of both decommissioning and nuclear waste storage)are also significant and captured in our ARO debt adjustment (approximately CZK64 billion in 2018). From a social perspective, theCzech Republic's main political parties support both nuclear and coal, acknowledging nuclear generation's central role inpreserving national energy independence. There's limited renewable ambitions, stemming from the country's limited natural andweather potential for wind and solar generation. CEZ's nuclear activities also pose several governance risks, as we believeuncertainty surrounding the government's decision on future nuclear reactor construction will continue to limit the long-termvisibility of the group's overall structure and strategic directions.
EDF (A-/Stable/A-2) France Claire Mauduit-leClercq
www.spglobal.com/ratingsdirect May 13, 2019 11
ESG Industry Report Card: Power Generation
Having one of the largest nuclear generation fleets (60 GW capacity and 80% of output), EDF's carbon footprint is markedlyadvantageous. The ambitious strategic goals of renewables capacity embedded in the Cap 2030 and Solar Plan (30 GW capacity by2035) support EDF's focus on diversifying its energy mix and concentrating on low-carbon sources. This is offset, however, byconcerns about environmental and social risks relating to the future long-term storage of nuclear waste. We capture EDF's largeend-of cycle liabilities (€40 billion), of both decommissioning and nuclear waste storage, in our ARO debt adjustment, but theamount continues to be subject to a degree of uncertainty. Social factors are important to our assessment of EDF's standingvis-à-vis the French state. We believe there remains support for the nuclear industry in France, given its economic and socialstakes. The French updated energy policy, defined by the PPE proposals over 2019-2028, sets a key objective to reduce the shareof nuclear in the power mix to 50% by 2035 (from 75% today). This would require EDF to start decommissioning its plants per thecurrently approved 50-year life, partly from 2027, progressively until 2035. At the same time, it could require sizeable investmentsin renewables. This strategy will not alleviate pressure on the group's free cash flow from sizable investments plan over anextended period. The major area of governance risks relates to EDF's board oversight and ability to manage risks and avoid costoverruns at multibillion EPR new-built nuclear projects. Its first-in-kind EPR project in France (Flamanville) suffered an €8 billioncost overrun, while the company embarked on two new EPR projects at a cost of about €20 billion in the U.K. (Hinkley Point C), forwhich cost revisions of about £1.6 billion have been announced. Positively, we would highlight the supportive financial stance ofthe French government, as demonstrated in the past years through the form of capital increases or the election of scrip dividends.
EDP – Energias de Portugal, S.A. (BBB-/Stable/A-3) Portugal Massimo Schiavo
From an environmental standpoint, EDP is a pioneer and a leading player in renewable energy generation (65% of its 2018 EBITDA,mostly hydro, onshore wind, and solar). It also has an ambitious investment pipeline to further expand in the coming years throughits subsidiary EDPR. Only about 10% of its installed capacity is coal, which we expect to be gradually phased out in Iberia in thenext 20 years. Although EDP is the incumbent energy player in Portugal, the company has faced many adverse political actionsthat hamper visibility into the company's cash flow profile, as was the case in 2018. These include redefining contractualequilibrium maintenance costs; namely, the Portuguese government recently requested EDP pay back alleged overcompensationfor the contractual equilibrium maintenance cost mechanism, to the detriment of consumers. In the context of CTG's pendingtakeover offer, uncertainty around the group's governance has increased. At this stage we believe it's unlikely the deal will becompleted.
Enel (BBB+/Stable/A-2) Italy Pierre Georges
From an environmental standpoint, Enel is transforming its current business mix to become greener, with currently 54% ofinstalled power generation capacity coming from thermal plants. Enel's renewables portfolio remains significant, accounting forabout 43.4 GW (mostly hydro) of capacity. Enel is also one of the largest investors in renewables among European utilitycompanies, with plans to spend an estimated €3.9 billion annually over the coming three years. The company also aims to reduceits thermal fleet over the same period. We view this transition as a positive step, since it will reduce the group's exposure tovolatile merchant power activities (renewable energy operations are either subsidized or long-term contracted) and to the risk ofrising carbon prices, notably in Europe. The group also has large power retail activities, notably in Italy and Spain, whereaffordability remains a major concern. We recognize that Enel has a low cost to serve, which mitigates pressure on margins. Wenote Enel's larger exposure to high country risks than European peers, including domestic Italian operations (44% of 2018 EBITDA)and in Brazil (8%), which we believe entails potentially more volatile macroeconomic, regulatory, and political risks. Mitigatingfactors include the group's good expertise in Latin American countries, with a robust track record, and the regulatory frameworkfor each country's network activities, which we view as supportive. Additionally, compared with peers, Enel has a significant levelof minority shareholders throughout the group, despite its strategic focus and ongoing efforts to reduce these minority interests.Less control over cash flow and potential conflicts with these shareholders could eventually limit the group's ability to effectivelyroll out its strategy. We estimate that minorities still represented €16.132 billion of as of year-end 2018.
Engie S.A. (A-/Stable/A-1) France Claire Mauduit-LleClercq
In our view, ENGIE is now in a better position from an environmental perspective, with a relatively low carbon footprint, followingits successful transformation. This included the disposals of its oil and gas E&P and LNG businesses, stronger focus onrenewables generation, and sale of part of its European and international thermal generation assets--notably coal-fired plants.The group has sold and/or closed nearly 60% of its coal-installed capacity since 2015. We believe the resulting shift towardregulated activities for more than 40% of its operations will provide more visible and resilient cash flows, underpinning the astrong business risk profile. We note ENGIE has a strong track record of managing regulatory risks and providing a high level ofservices for its network operations. However, the company's nuclear operations in Belgium pose several threats (including social)related to the future of long-term nuclear waste storage, the government's willingness to phase out nuclear power, and severeoperational issues. Since 2015, the latter have resulted in unplanned nuclear outages, limiting the overall load factor to just over50% for 2018. We include ENGIE's massive €9.8 billion of end-of-cycle liabilities (for decommissioning and nuclear waste storage)in our adjustment to debt for AROs, most of which relate to the Belgian operations, but remain subject to some uncertainty. Webelieve the lack of visibility on the Belgian government's future energy policy will further complicate the group's overall strategicdirection.
FORTUM (BBB/Negative/A-2) Finland Massimo Schiavo
Fortum is the second-lowest emitting generator in Europe (after Statkraft) thanks to its zero to low-CO2 emission fleet (mostlyhydro and nuclear sources). However, due to the Uniper acquisition we revised our view of the group's governance to fair because
www.spglobal.com/ratingsdirect May 13, 2019 12
ESG Industry Report Card: Power Generation
Uniper uses fossil fuels, which doesn't seem in line with Fortum's plan to be a leading green generator. Nuclear risks and wastemanagement represent additional environmental and financial concerns. This includes large end-cycle-related provisions (€899million as of year-end 2018) and construction delays on OL3 through its 25% shareholding of Teollisuuden Voima Oyj (TVO). TheOL3 plant, representing some 1.6 GW in capacity, was originally due to come on line in 2009, but has had several delays that havecontributed to raising TVO's net debt to €4 billion.
We view the company as one of the first European utilities to move toward energy transitioning, with a strong focus onrepositioning its generation mix portfolio towards renewables (60% of its 2018 installed capacity), particularly in wind, for which ithas become one of the European leaders (16 GW wind capacity). Its strategy is to further increase renewables capacity to 38.4 GWby 2022 from a total of 29.1 GW in 2018, consistent with its commitment of carbon neutrality by 2050. The rest of the fleetcomprises modern CCGT plants (14 GW, mostly long-term PPAs in Mexico and an underutilized fleet in Iberia) and its Spanishnuclear power plants (3 GW), for which a life extension to 2035 has recently been permitted. Iberdrola is not ultimately liable fordecommissioning of its nuclear plants, nor waste management and storage. From a social standpoint, Iberdrola has a long trackrecord of adequately managing its power grids, be it in the U.K., the U.S., Spain, and Latin America, where we assess the regulatoryadvantage as adequate or higher and therefore offering a high degree of cash predictability. Iberdrola has high expertise inensuring high quality standards in its overall network footprint, maintaining a record-low level of interruptions in Spain. Iberdrolahas a larger exposure than European peers to high country risks, including in Latin America (through its 52% stake in Neoenergia),which we believe entails potentially more volatile macroeconomic, regulatory, and political risks. The group also has large powerretail activities, notably in Spain and the U.K., where affordability remains a major concern. Iberdrola has a low cost to serve,which mitigates pressure on margins.
Naturgy (BBB/Stable/A-2) Spain Massimo Schiavo
From an environmental standpoint, Naturgy's generation portfolio compares unfavorably to other European integrated utilitiesbecause of its relatively lower contribution from renewable assets and its relatively high CO2 intensity (more than 80% generatedfrom CCGT plants and coal). Even though the company was awarded 926 MW of renewable capacity to be built before January2020 in Spain's 2016-2017 renewables auctions, it still lags behind its European peers. However, we believe its long-term positionis linked to the future relevance of gas. Naturgy's ownership structure and governance have radically changed over the past twoyears, with investment funds (GS, CVC) now being majority shareholders. We believe this has materially changed the company'soperating model and financial policy to be increasingly skewed towards shareholders. We believe this could translate into moresocial risks over time. Lower capital expenditures (capex) in the new 2018-2022 strategic plan and cost-cutting could compromisethe quality of network services and overall longer-term cash flow generation. Further, we see increasing scrutiny from networkregulators over the balance of interests between stakeholders, for which Naturgy could be penalized over time. In Spain, theregulator is proposing to introduce leverage limitations, while in Colombia, Naturgy is currently in a legal dispute with thegovernment, which decided to take over managing the power distribution company Electricaribe at the end of 2017. In the summerof 2018, Naturgy notified Colombian authorities of the beginning of a controversy in light of the international agreement of mutualinvestments between Spain and Colombia due to the debt accumulated with subsidiary Electricaribe, of which Naturgy owned an85% share.
Orsted (BBB+/Stable/A-2) Denmark Massimo Schiavo
From an environmental standpoint, Orsted stands out among European utilities, given the overwhelming contribution ofrenewables assets to its generation portfolio. Orsted is by far the global leader in producing offshore wind energy, with a marketshare of about 30%. The share of renewable in its energy mix increased to 75% in 2018 from 64% in 2017, and the companytargets 99% in 2025. Over the past two years, Orsted has also completed the disposal of its oil and gas upstream operations andhas turned the page on its thermal portfolio to focus only on carbon-free power generation, supported by a stable remunerationframework. Regarding governance, Orsted has advanced the development of the offshore wind industry globally. In particular, ithas quickly integrated the latest technologies without cost overruns or delays in the projects' delivery. We also regard as positivethe Danish government's long-standing support, which has helped Orsted implement its energy transition strategy over the pastdecade. That said, there have recently been some misalignments between the company and the state. In 2018, Orsted announcedthe disposal of its power distribution B2C and City Lights businesses. However, in January 2019, the Danish ministry of financeinformed Orsted that there was no longer political support for the ongoing divestments in the current form. The group has publiclystated its intention to continue to seek an exit from the assets and has classified them as available for sale in its 2018 accounts.
Rushydro (BBB-/Stable/A-3) Russia Elena Anankina
Rushydro has a social mandate to maintain a secure electricity supply in Russia's remote Far East district. The cost of thismandate weighs on the group's profitability and creates significant investment needs to improve the efficiency and environmentalcharacteristics of its main thermal plants there (about 23% of RusHydro's 2019 capex program). The Russian government has notyet implemented strong environmental constraints, but hydro generators have priority access to the market. Rushydro'sproduction could be sensitive to water levels on the back of global climate change or to natural catastrophes, such as the Bureyariver landslide in late 2018. In 2009, RusHydro's largest Sayano-Shushenskaya hydropower station experienced a major accident,which killed 75, affected the environment, and resulted in severe equipment damage and loss of production. Since then, RusHydrohas restored operations, significantly changed its management team, and materially improved its system of it manages operating
www.spglobal.com/ratingsdirect May 13, 2019 13
ESG Industry Report Card: Power Generation
risks. The financial impact was largely mitigated by insurance and government funding. From a governance standpoint, our ratingon RusHydro factors in potential exposure to both politicized decision-making and favorable government support. Overall, webelieve that the group's key role in the Far East creates additional incentives for the government to support it, e.g. via equityinjections or subsidies.
SSE (BBB+/Stable/A-2) U.K. Matan Benjamin
SSE, one of the largest electricity and gas suppliers in the U.K., has a portfolio of renewable assets (mainly wind and hydro) in theU.K. and it benefits from a favorable subsidy regime over the long term. We expect EBITDA to grow over the next few years as newgeneration capacity comes on line. Although overall generation capacity is expected to decline from 11.1 GW in March 2018 toabout 10.22 GW in March 2022, we expect profitability to improve as SSE shifts the its energy generation mix towards renewablesand away from fossil fuels such as like coal, which has a very low contribution to EBITDA. SSE is one of the largest electricity andgas suppliers in the U.K. The energy supply sector is seeing experiencing the consequences of a political mandate for socialequality. Following a governmental pledge to keep energy bills down via the Domestic Gas and Electricity (Tariff Cap) Act, last yearthe regulator Ofgem published its final decision on the official price cap for its first dual fuel cap level effective for standardvariable tariffs customers starting January 2019. The introduction of the tariff cap has undermined U.K. power suppliers', such asSSE's, business prospects. We eventually lowered the rating on SSE at the end of 2018.
Teollisuuden Voima Oyj (BB+/Stable/B) Finland Daniel Annas
TVO's nuclear fleet bears inherent operating risks, and long-term waste management represents a key environmental concern.The company has a legal obligation to fully fund the liabilities for decommissioning its nuclear power plants and the disposal ofspent fuel. They amount to €1.5 billion as of Dec. 31, 2018, according to the Nuclear Energy Act in Finland, and they are covered byTVO's share into the Finnish State Nuclear Waste Management Fund. Compared to other nuclear operators, we believe TVO hasalso a stronger competitive advantage in terms of future waste management as it owns a 60% stake into Posiva Oy, which ispreparing a final disposal facility for spent nuclear fuel in Olkiluoto. The remaining stake (40%) is owned by Fortum and we believethat, once completed, this will reduce uncertainty around future waste management costs for both companies, making cash flowsmore predictable. Regarding TVO's governance, its "Mankala" model is a key element in our rating as it largely insulates thecompany from competition and market risk. This stems from TVO's articles of association, which state it will deliver electricity toits shareholders, as well as pass down its annual costs to them, in proportion to their shares. Despite none of TVO'sowners--comprising major Finnish industries, utilities, and municipalities--exercising control over the company, their ability andwillingness to provide support the company is high. Public acceptance of nuclear power remains positive in Finland and nuclearenergy remains important to the government's agenda to act on climate change and to rely less on imports.
Uniper (BBB/Stable/--) Germany Pierre Georges
Environmental factors are material to our credit analysis of Uniper. Uniper is heavily exposed to power generation and is thus morevulnerable to political, regulatory, and reputational risks due to its substantial carbon emissions and the increasingly stringentGerman and European environmental rules. Uniper's installed capacity split by fuel type consists of 52% gas, 28% coal, 10%hydro, 4% nuclear, and 6% other generation. In Germany, the main market for Uniper, the so-called coal commission haspresented a report proposing an outline of a coal exit no later than 2038 as part of the country's efforts to curb climate change.However, there will be compensation to coal plant operators. We also believe the group's governance is a key rating driver for thecompany given its recent change in ownership following the group's spin-off from E.ON in 2017 and the acquisition of a 49.9%stake by Fortum in 2018. Fortum's investment strategy remains unclear, notably when it comes to environmental targets. Therelationship between the majority owner and Uniper has been difficult, leading to both Uniper's CEO and CFO departing. That said,we understand both companies have now started to work on exploring operational partnerships and synergies. Also, activistinvestors took a major share of Uniper's shareholding (about 25%) and we believe they may influence its strategy going forward.While we currently rate Uniper as an independent company, a change of control would likely incorporate more influence fromFortum into our ratings.
Vattenfall (BBB+/Stable/A-2) Sweden Pierre Georges
In line with its strategy of becoming climate neutral (i.e. zero net GHG emissions) in the Nordic area by 2030, Vattenfall ismassively investing in renewables, with the bulk of it benefiting from a long-term remuneration framework. Being a 100%government-owned company, Vattenfall aligns with the Swedish government's environmental and climate goals. However,merchant and fossil-fuel generation still accounts for a significant share of its production (31.6 TWh, or 24% of production in2018) and its carbon footprint is thus substantial (about 22 million tonnes). In addition, the company operates four nuclear powerplants in Sweden (7.2 GW) and Germany. While German reactors will close in the next five years, Sweden has been more supportiveof nuclear and has recently revised its remuneration framework to allow sufficient returns on investment for the life extension ofthe reactors. The operator is responsible in Sweden for having reliable solutions to manage dismantling and nuclear waste, whilein Germany, the responsibility for intermediate and long-term storage has been transferred from nuclear operators to thegovernment. We believe the company is also exposed to extreme weather conditions, which could affect its operations, of both itsgeneration assets and network operations. In late 2018, a severe snow storm affected its network north of Stockholm, which led tosignificant outages and as a result exposed the company to penalties and extra costs. Yet the company has a good track record ofmeeting the regulator's targets on network service quality, and we believe it manages its regulatory environment well.
www.spglobal.com/ratingsdirect May 13, 2019 14
ESG Industry Report Card: Power Generation
Latin America
Company/Rating/Comments Country Analyst
Colbun (BBB/Stable/--) Chile Melisa Casim
Environmental factors are positive relative to peers, reflecting the company's high percentage--around 56%--of hydroelectric electricity. Mostof the company's hydroelectric generation uses hydraulic series to reuse water and maximize power generation, allowing 33% of its waterflows to be used by more than one plant. In addition, the company maintains its CO2 emissions, solid waste, and water footprint below thenational system's average, representing a tangible contribution to its business sustainability and achieving operational efficiencies that lowercosts. Looking forward, we expect Colbun to increase its renewable capacity consistent with the Chilean government's goal of 20% wind andsolar renewable energy by 2025.
Comision Federal de Electricidad (BBB+/Negative/--) Mexico DanielCastineyra
CFE is a state-owned company, so we believe the political agenda to some extent influences the company's strategy. The companyexperienced importantturnover and a change in rhetoric as a direct consequence of the change in the government. Under Andrés ManuelLópez Obrador's administration, political influence increased further and the company's governance structure is less effective at prioritizingeconomic decisions. For example, the new administration plans to increase CFE's relevance in the generation segment and is committed toincreasing the percentage of generation from renewables. However, by doing so, and especially if the government plans to diminish theparticipation of the private sector, leverage metrics could potentially increase beyond our expectations and affect the company's credit profile.CFE has committed to reach 35% of installed capacity from renewable energy. Currently around 70% of CFE's installed capacity runs on fossilfuels and around 28% is from renewable energy. The company aims to decommission several of its fossil fuel plants to natural gas given thatseveral pipeline projects will begin operating within the next six to 12 months. The main social factor for the company's rating is laborrelations, especially because CFE's union is one of the biggest in the country. The company has a good track record with the union; forexample, in 2016, it was able to reduce its pension liabilities after it revised its collective labor contract with the union, which significantlyreduced its unfunded labor obligations.
Companhia Energetica de Minas Gerais (B/Stable/--) Brazil ViniciusFerreira
Environmental and Governance factors are central to our credit analysis on CEMIG. Environmental factors for CEMIG relate to the recent damfailure in Brumadinho, which resulted in several deaths and devastated territories in the region, including the Paraopeba river, which servicesthe company's hydro plant operations. Although the consequences of the tragic Brumadinho accident were relatively marginal for CEMIG'soperations and financial performance, future incidents may have more relevant consequences. The relevance of governance factors comesfrom the company's ownership structure, which is ultimately controlled by the state of Minas Gerais. There's often management turnoverwhenever a new administration takes office, and changes to management can in turn result in a revised strategic direction. In addition, webelieve there is risk that government-related companies tend to promote the government's interests and priorities above those of otherstakeholders. However, we believe these risks are mitigated because debt covenants limit the state's ability to access the company's cashflows.
Eletrobras-Centrais Electrias Brasileiras (BB-/Stable/--) Brazil MarceloSchwarz
Eletrobras' carbon footprint is very low, as about 90% of its total generation capacity stems from renewable sources, mostly hydro generation(88% of total capacity). Yet hydro generators are sensitive to climate change events, which can affect water levels and ultimately production,as was seen during the drought that affected Brazil from 2013-2015 and hurt the company's financial metrics. In terms of governance, in ourview the fact that Eletrobras is controlled by the Federative Republic of Brazil could undermine the effectiveness of the company's governancestructure, as it could potentially promote the government's interests and priorities above those of other stakeholders. The government hasinterfered in the sector in the past and affected the company's credit metrics, but we don't expect this level of interference to occur again. Thecompany was also subject to investigations of bribery and corruption, but in our view it took steps to improve its governance, which should helpit identify and effectively control critical risks.
Asia Pacific
Company/Rating/Comments Country Analyst
China Huadian Corp. (A-/Stable/--) China Yuehao Wu
Huadian is one of the largest state-owned power generation groups in China, with a generation portfolio consisting of 60% coal power and 40%clean-power (11% gas power, 18% hydro, 9% wind power, 2% solar power). High exposure to coal power subjects the company to regulatory
www.spglobal.com/ratingsdirect May 13, 2019 15
ESG Industry Report Card: Power Generation
risks as China tries to decarbonize its economy. Upgrading facilities to meet emissions standards requires additional spending, and closingsmall and inefficient plants results in asset impairment. Relatively low dispatch priority and the ineffective pass through of coal costs alsocause cash flow volatility. In response to this, Huadian's strategic goals for 2020 involve quantitative targets of reducing emissions and fossilfuel consumption. Accordingly, the company's new capacities are all clean energy, including large-scale gas power. More than 85% of its coalpower fleet has completed ultra-low emissions upgrades, and unit coal consumption has kept reducing. For social factors, the group hasincurred some isolated safety incidents. While this doesn't disrupt its cash flows materially, it could compromise its operational track recordand management efficacy of its significant assets and subsidiaries.
China Resources Power Holdings Co. Ltd. (BBB/Stable/--) China Yuehao Wu
China Resources Power (CRP)'s installed capacity consisted of coal power (80%), wind power (18%), and some solar and gas-based power in2018. High exposure to coal power subjects the company to regulatory risks as China tries to decarbonize its economy. However, coal powerexposure has been declining in recent years (in 2015, 86% of capacity was coal) due to its increasing wind power capacity. The company aims toadd wind capacity of about 4.0 GW in total during 2019-2020. CRP tries to ensure its coal power business follows regulations. The coal fleet'semissions and efficiency standards have kept improving and some units have been upgraded to cogeneration to maximize energy efficiency. In2018, the company made a significant move in reducing its carbon footprint by divesting almost all of its coal mining operations--a totalproduction capacity of 15 million tonnes per year. Social and governance factors are neutral to CR Power's rating. The company maintainssatisfactory safety record and engages itself actively with the local community. As a listed company in Hong Kong, the company has goodgovernance practices and disclosures.
CLP Holdings Ltd. (A/Stable/A-1) HongKong
Apple Li
As a vertically integrated electric utility, CLP generates, transmits, and distributes electricity to over 80% of Hong Kong's population. Itsgeneration comprises 38% coal power, 26% gas power, and 35% nuclear power, which is imported from China. It's critical for CLP to maintain asafe and reliable power supply in its service area, which is key to managing regulatory risks and public opinion. To support Hong Kong'sinitiative of having 75% of power sourced from clean energy by 2030, CLP will gradually retire its coal-fired units with gas-fired power plantsand will promote the usage of renewable energy such as landfill gas power generation, distributed solar PV, and green certificates. Thegovernment approved capital expenditures for new gas-fired generation units and landfill gas power generation project in the five-yeardevelopment plan, which earn 8.0% permitted returns. In addition, costs of purchasing renewables with higher feed-in tariffs can be passedthrough. Outside Hong Kong, CLP also invests in power generation assets primarily in Australia, India, and mainland China. Traditional power iscurrently the dominant fuel type in its asset portfolio, but CLP is trying to add more renewable energy according to its Climate Vision 2050, andcomply with each market's local environmental and carbon emissions policy. The company generally maintains a satisfactory operational trackrecord and keeps improving its service quality. We assess CLP's management and governance as strong, reflecting management's strongstrategic planning, risk management, and expertise, experience, and operational effectiveness. In addition, as a listed company in Hong Kong,the company maintains sound corporate governance practices and disclosures.
China General Nuclear Power Corp. (A-/Stable/--) China Yuehao Wu
Environmental factors and safety are highly relevant to China General Nuclear Power (CGNPC's) credit risk. As CGNPC is a leading nuclearpower developer, with 24 GW nuclear power in operation and 7.4 GW under construction, significantly contributing to China's goal of loweringits carbon footprint and reducing pollution. It also owns more than 27 GW non-nuclear capacities including gas, wind, and solar power acrossdifferent markets. CGNPC has ongoing exposure to radioactive waste management. Under China's policy, the company must contribute to afuel treatment and disposal fund starting from the sixth year of the nuclear power plant's operation. It also manages low and medium-levelradioactive waste including emissions or the release of gas, liquid, and solid radioactive waste arising from nuclear power generation.Decommissioning is less of an issue to CGNPC because the fleet is quite young (eight years on average), and is expected to commence from2034-2057 based on the plants' expected useful lives. AROs, while still small, are included in our debt analysis. The company accounts for 10%of the total investment as decommissioning costs. Safety is key to maintaining the nuclear power business franchise. CGNPC upkeeps theplant well, and its safety record is satisfactory and generally above industry. Third-generation nuclear technology with higher safety standardsis applied to all its new builds.
China Jinjiang Environment Holding Co. Ltd. (BB-/Negative/--) China RockyHuang
As a waste-to-energy (WTE) operator, the technology in most of China Jinjiang Environment (CJE)'s WTE plants are circulated-fluidized-bedsthat require feed-stock (coal) for incinerating solid waste. While the incineration process could help reduce the volume of waste intake, itproduces emissions in both solid and gas form. The company is under the pressure of China's increasing environmental and emissionsstandards. CJE has applied various measures, including undergoing capacity and technological upgrades at its eight WTE facilities. This willhelp improve operating efficiency and reduce feedstock demands. CJE's coal blending ratio has gradually lowered to around 1.5% at the end of2018. Social factors, namely the "not-in-my-backyard" conflict, are important for CJE's operations. Planning new incineration plants issensitive to local community acceptance because large waste treatment plants can face severe opposition due to the concern of perceivedhealth or environmental problems caused by the facility. Governance is fair given the company is a listed entity on Singapore Stock Exchange. Ithas reasonable public disclosure and its governance practices are largely in line with peers.
China Longyuan Power Group Corp. Ltd. (A-/Watch Dev/--) China Yuehao Wu
Environmental factors are highly relevant for renewables developers and operators like Longyuan, which is the world's largest wind poweroperator with a total capacity of 21 GW by year-end 2018, the company has a low carbon footprint and continues to develop wind capacitiesmainly in China. However, Longyuan has two coal power plants with a combined capacity of 1.875 GW, though they meet local environmental
www.spglobal.com/ratingsdirect May 13, 2019 16
ESG Industry Report Card: Power Generation
and emission standards. In developing its wind power, the company tries to preserve biodiversity and minimize the impact on local residentsand bird habitats. In our view, Longyuan's large renewable portfolio gives the company a stronger competitive position than its coal powerpeers. Moreover, China's ongoing efforts to improve renewables consumption, such as the rollout of renewable portfolio systems, will benefitLongyuan by providing resilient demand even when the economy is slowing. Both social factors and governance are neutral to our rating onLongyuan. The company maintains adequate corporate governance practices as a Hong Kong-listed bluechip name.
China Three Gorges Corp. (A/Stable/--) China Apple Li
As the world's largest hydropower operator, CTG contributes enormously to China's energy transformation and flood control of the nation'smost important river. This also drives our assessment of an extremely high likelihood of government support to CTG if needed. In addition tohydropower, CTG is also committed to developing other renewable energy such as wind and solar power. CTG was running 50.6 GW ofhydropower plants domestically, supplying 19% of the nation's hydro power in the first half of 2018. Another 26.2 GW of two mega-hydropowerprojects are under construction. CTG monitors and discloses environmental risk factors throughout the project life and the whole waterwaystretch. To mitigate its environmental and social exposure, CTG takes various measures such as flood control, biodiversity conservation, andprevention and controlling dam-led climate change and pollution, etc. In the mega-hydropower project development, resettling migrantsdisplaced by the reservoir is always a key social challenge. CTG managed this risk with the assistance of local governments. However,resettlement costs are a major part of its development expenditures and have been on the rise over the years.
GCL New Energy Holdings Ltd. (B+/Negative/--) China RockyHuang
GCL New Energy (GNE) is one of the largest solar power developers in China, with about 7.0 GW of installed capacities at the end of 2018. Whilesolar power has a zero to low-carbon footprint, it also uses exponentially higher land mass to produce electricity than conventional energy. Tosave land and support local economies, the company has "solar plus agriculture" projects that aim to complement solar power production withfarming, fishing, poultry and animal husbandry, and forestry. It has over 70 solar agricultural complemented solar power plants with a capacityof approximately 2.1 GW, including 850 MW of solar poverty alleviation projects. GNE aims to dispose a portion of its solar farms to deleverageand ease liquidity stress due to sizable tariff subsidy receivables from the government. GNE's governance is fair, reflecting its reasonablegovernance practices and disclosure given it is a listed company on the Hong Kong Stock Exchange.
Genesis Energy Ltd. (BBB+/Stable) NewZealand
ParvathyIyer
Genesis Energy is an integrated generator/retailer with 10% of its generation from coal and 40% from gas, exposes it to carbon liabilities. Thebalance of Genesis' generation comes from hydro sources. However, Genesis' thermal units became quite valuable under dry hydrologicalconditions because New Zealand derives 60% of its generation from hydro, which can result in spikes in wholesale power prices under weakhydrological conditions. So, we believe the thermal fleet will remain important for the nation. The company manages its exposure to emissionsthrough several long-term agreements to purchase carbon credits through third-party forestry investments. Genesis has hedged 100% of itspotential exposure to carbon credits until 2022 and about 75% for 2023 and 2024. Genesis' currently hedged prices are somewhat lower thancurrent carbon prices. The prices of carbon units have increased steadily over the past several years and we expect them to remain elevated forthe next few years. Genesis' exposure to carbon prices could thus affect its operating leverage, which rated peers in New Zealand do notnecessarily face. From a social perspective, electricity affordability remains a key focus for the government and industry. An ongoing electricityprice review is not expected to result in any significant changes to Genesis or other large generator/retailers.
Mercury NZ Ltd. (BBB+/Stable/A-2) NewZealand
AlexanderDunn
Mercury operates in an industry that is generally very exposed to environmental risk, whereby variable weather patterns and hydrologicalconditions influence electricity demand/supply, as well as wholesale prices in New Zealand. Mercury's 100% renewable capacity (hydro andgeothermal) strongly reduces environmental exposures. Although the company's geothermal generation and gas retailing have a carbonfootprint, the company remains carbon positive overall (carbon offsets exceed carbon creation). The company carefully manages its emissionsand has several long-term agreements to purchase carbon credits through third-party forestry investments. In addition, the company useselectric vehicles to help reduce emissions. In a market with 85% of electricity sourced from renewable generation, we see a competitiveadvantage based solely on environmental factors as marginal. From a social perspective, end-consumer electricity costs remain a key focusarea for the government and industry. A material outcome from the ongoing electricity price review may affect Mercury and other largegenerator/retailers, but we do not expect any significant changes.
Origin Energy Ltd. (BBB/Stable/A-2) Australia Meet Vora
Origin Energy relies significantly on thermal generation (coal and gas). In fiscal year 2018, around 62% of Origin's generation output came fromcoal, 28% from gas, and 10% from renewables and pumped hydro. This is reflected in a carbon intensity of 0.75 ton/MWh compared to themarket intensity of 0.82 ton CO2/MWh. That said, the carbon intensity will be a potential long-term lability for Origin if and when any emissionscheme is implemented in Australia and it has to close (ARO) its only coal fired power station (2,880 MW) by 2032. At this stage, policy vacuumand lack of clarity on forward emissions trading means risks are more likely medium to longer term. Origin is also proactively responding tovarious state-based renewable targets by contracting with wind/solar projects (about 1300 MW) and managing the slow but expectedtransition away from coal-fired plants. Origin must also deliver 20% of its load from renewable energy sources, and the contracted wind/solarprojects together with the existing inventory of green certificates should enable Origin meet its green obligation. The government's focus onaffordable energy prices over the past two years represents some headwinds for Origin and other large integrated market players. We believeOrigin is better placed to withstand this risk than its peers due to its market size, its presence in both electricity and gas retailing, and astrategy to increase its renewable footprint either through own build or entering into power purchase agreements. Governance practices are
www.spglobal.com/ratingsdirect May 13, 2019 17
ESG Industry Report Card: Power Generation
consistent with industry peers and are considered neutral.
Appendix: Components In The Sector ES Risk Atlas
Here is a list of examples of factors we consider in evaluating sector-specific environmentalexposure. For example, we examine to what extent each sector is relatively exposed to:
Greenhouse gas emissions (GHG): actual or potential regulations such as carbon taxes,emissions trading schemes, and other direct or indirect costs. The GHG emissions under the Kyotoclimate change agreement are carbon dioxide (CO2), methane (CH4), nitrous oxide (N2O),hydrofluorocarbons (HFCs), perfluorocarbons (PFCs), and sulfur hexafluoride (SF6).
Sensitivity to extreme weather events: incremental costs or the potential physical impact onassets associated with recurring (for example, hurricanes) or infrequent (droughts) severe weatherevents.
Sensitivity to water scarcity: potential costs related to the need for extracting or sourcing largequantities of water, or requiring on-site water treatment, in comparison to other water users ofthe same water basins or utilities.
Waste, pollution, and toxicity: potential fines or rising costs associated with prevention andtreatment of waste and pollution, including hazardous waste and air pollution.
Land use and biodiversity: asset retirement obligations, developing natural land or potentialoperating constraints, or increased costs associated with protecting plant and animal life.
The following is a list of examples of factors we consider in evaluating sector-specific socialexposure. For example, we analyze to what extent each sector is relatively exposed to:
Human capital management: a sector's capacity to develop a long-lasting productive workforcewhile reducing potential operational disruptions from workforce mismanagement; diversity andinclusion attributes; exposure to strikes and the sector's general exposure to dealing withemerging skills scarcity or surplus labor.
Changing consumer or user preferences: We recognize that changes in consumer behavior areoften the result of complex dynamics, such as changes in technology or fashion or other disruptivebusiness trends. Therefore, we treat a change in consumer preferences as a social factor relatedto sustainability, health, safety, the environment, privacy, financial mis-selling, or community andhuman rights, particularly when an entity has triggered the change.
Demographic changes: potential costs or opportunities related to population growth andcomposition, such as an aging population, urbanization, changing living standards, or a growingmiddle class
Safety management: potential direct or indirect costs resulting from problems related to thesafety of a sector's production processes and final customer products.
Social cohesion: potential or actual costs in direct operations or in the supply chain resulting fromgeopolitical or community-related events such as conflicts, community unrest, and terror attacks.
STANDARD & POOR’S, S&P and RATINGSDIRECT are registered trademarks of Standard & Poor’s Financial Services LLC.
S&P may receive compensation for its ratings and certain analyses, normally from issuers or underwriters of securities or from obligors.S&P reserves the right to disseminate its opinions and analyses. S&P's public ratings and analyses are made available on its Web sites,www.standardandpoors.com (free of charge), and www.ratingsdirect.com (subscription), and may be distributed through other means,including via S&P publications and third-party redistributors. Additional information about our ratings fees is available atwww.standardandpoors.com/usratingsfees.
S&P keeps certain activities of its business units separate from each other in order to preserve the independence and objectivity of theirrespective activities. As a result, certain business units of S&P may have information that is not available to other S&P business units. S&Phas established policies and procedures to maintain the confidentiality of certain non-public information received in connection with eachanalytical process.
To the extent that regulatory authorities allow a rating agency to acknowledge in one jurisdiction a rating issued in another jurisdiction forcertain regulatory purposes, S&P reserves the right to assign, withdraw or suspend such acknowledgment at any time and in its solediscretion. S&P Parties disclaim any duty whatsoever arising out of the assignment, withdrawal or suspension of an acknowledgment aswell as any liability for any damage alleged to have been suffered on account thereof.
Credit-related and other analyses, including ratings, and statements in the Content are statements of opinion as of the date they areexpressed and not statements of fact. S&P’s opinions, analyses and rating acknowledgment decisions (described below) are notrecommendations to purchase, hold, or sell any securities or to make any investment decisions, and do not address the suitability of anysecurity. S&P assumes no obligation to update the Content following publication in any form or format. The Content should not be relied onand is not a substitute for the skill, judgment and experience of the user, its management, employees, advisors and/or clients when makinginvestment and other business decisions. S&P does not act as a fiduciary or an investment advisor except where registered as such. WhileS&P has obtained information from sources it believes to be reliable, S&P does not perform an audit and undertakes no duty of duediligence or independent verification of any information it receives. Rating-related publications may be published for a variety of reasonsthat are not necessarily dependent on action by rating committees, including, but not limited to, the publication of a periodic update on acredit rating and related analyses.
No content (including ratings, credit-related analyses and data, valuations, model, software or other application or output therefrom) or anypart thereof (Content) may be modified, reverse engineered, reproduced or distributed in any form by any means, or stored in a database orretrieval system, without the prior written permission of Standard & Poor’s Financial Services LLC or its affiliates (collectively, S&P). TheContent shall not be used for any unlawful or unauthorized purposes. S&P and any third-party providers, as well as their directors, officers,shareholders, employees or agents (collectively S&P Parties) do not guarantee the accuracy, completeness, timeliness or availability of theContent. S&P Parties are not responsible for any errors or omissions (negligent or otherwise), regardless of the cause, for the resultsobtained from the use of the Content, or for the security or maintenance of any data input by the user. The Content is provided on an “as is”basis. S&P PARTIES DISCLAIM ANY AND ALL EXPRESS OR IMPLIED WARRANTIES, INCLUDING, BUT NOT LIMITED TO, ANY WARRANTIES OFMERCHANTABILITY OR FITNESS FOR A PARTICULAR PURPOSE OR USE, FREEDOM FROM BUGS, SOFTWARE ERRORS OR DEFECTS, THATTHE CONTENT’S FUNCTIONING WILL BE UNINTERRUPTED OR THAT THE CONTENT WILL OPERATE WITH ANY SOFTWARE OR HARDWARECONFIGURATION. In no event shall S&P Parties be liable to any party for any direct, indirect, incidental, exemplary, compensatory, punitive,special or consequential damages, costs, expenses, legal fees, or losses (including, without limitation, lost income or lost profits andopportunity costs or losses caused by negligence) in connection with any use of the Content even if advised of the possibility of suchdamages.