12
ESMA Risk Dashboard No. 3, 2016

ESMA Risk Dashboard No. 3, 2016

ESMA Risk Dashboard No. 3, 2016 2
ESMA Risk Dashboard No. 3, 2016
© European Securities and Markets Authority, Paris, 2016. All rights reserved. Brief excerpts may be reproduced or translated provided the source is cited adequately. The reporting period of this document is 1 April 2016 to 30 June 2016, unless indicated otherwise. Legal reference of this Report: Regulation (EU) No 1095/2010 of the European Parliament and of the Council of 24 November 2010 establishing a European Supervisory Authority (European Securities and Markets Authority), amending Decision No 716/2009/EC and repealing Commission Decision 2009/77/EC, Article 32 “Assessment of market developments”, 1. “The Authority shall monitor and assess market developments in the area of its competence and, where necessary, inform the European Supervisory Authority (European Banking Authority), and the European Supervisory Authority (European Insurance and Occupational Pensions Authority), the ESRB and the European Parliament, the Council and the Commission about the relevant micro-prudential trends, potential risks and vulnerabilities. The Authority shall include in its assessments an economic analysis of the markets in which financial market participants operate, and an assessment of the impact of potential market developments on such financial market participants.” The charts and analyses in this report are, fully or in parts, based on data not proprietary to ESMA, including from commercial data providers and public authorities. ESMA uses these data in good faith and does not take responsibility for their accuracy or completeness. ESMA is committed to constantly improving its data sources and reserves the right to alter data sources at any time. The third-party data used in this publication may be subject to provider-specific disclaimers, especially regarding its ownership, its reuse by non-customers and, in particular, the accuracy, completeness or timeliness of the data provided and the provider’s liability related to those. Please consult the websites of the individual data providers, whose names are detailed throughout this report, for more details on these disclaimers.
European Securities and Markets Authority (ESMA) Risk Analysis and Economics Department 103, Rue de Grenelle FR–75007 Paris [email protected]
3 August 2016|ESMA/2016/1236
ESMA Risk Dashboard No. 3, 2016 3
ESMA Risk Dashboard
R.1
Main risks
Risk segments Risk categories Risk sources Risk Risk Change Outlook
Change
Overall ESMA remit
Liquidity
Macroeconomic environment
Systemic stress
Market
Low interest rate environment
Securities markets
Contagion
EU sovereign debt markets
Investors
Credit
Market functioning
Infrastructures and services
Operational
Political and event risks Note: Assessment of main risks by risk segments for markets under ESMA remit since last assessment, and outlook for forthcoming quarter. Assessment of main risks by risk categories and sources for markets under ESMA remit since last assessment, and outlook for forthcoming quarter. Risk assessment based on categorisation of the ESA Joint Committee. Colours indicate current risk intensity. Coding: green=potential risk, yellow=elevated risk, orange=high risk, red=very high risk. Upward arrows indicate an increase in risk intensities, downward arrows a decrease, horizontal arrows no change. Change is measured with respect to the previous quarter; the outlook refers to the forthcoming quarter. ESMA risk assessment based on quantitative indicators and analyst judgement.
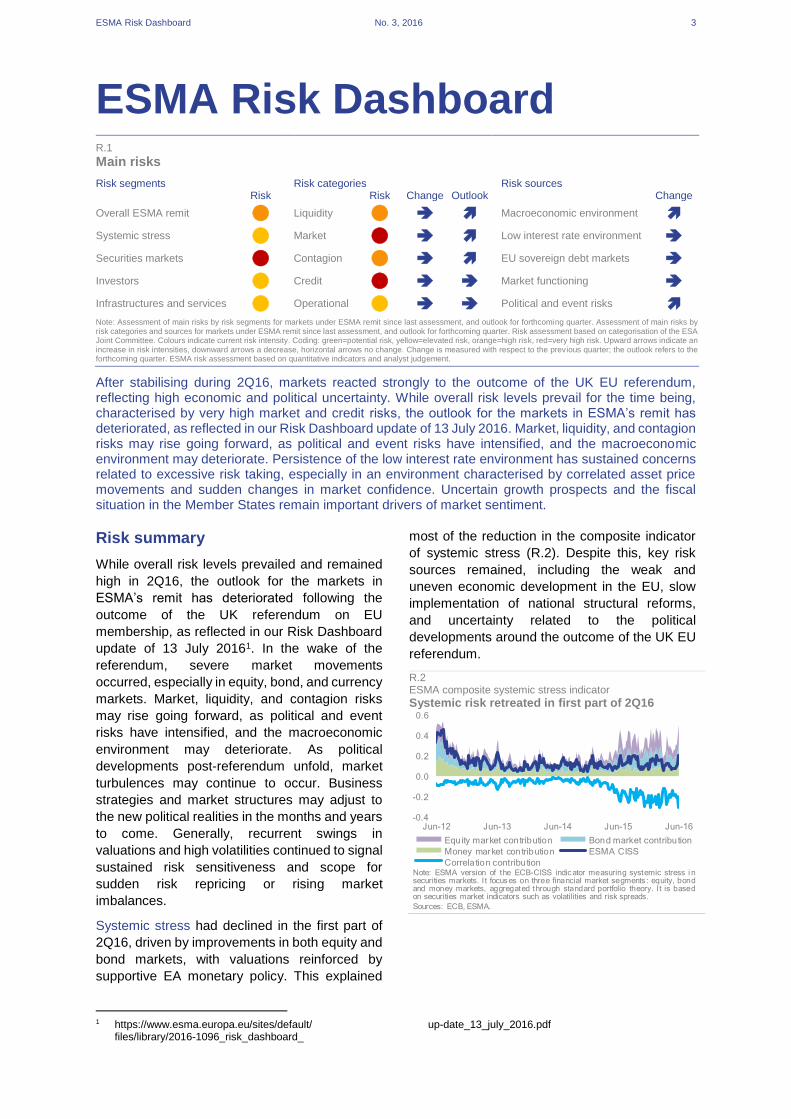
After stabilising during 2Q16, markets reacted strongly to the outcome of the UK EU referendum, reflecting high economic and political uncertainty. While overall risk levels prevail for the time being, characterised by very high market and credit risks, the outlook for the markets in ESMA’s remit has deteriorated, as reflected in our Risk Dashboard update of 13 July 2016. Market, liquidity, and contagion risks may rise going forward, as political and event risks have intensified, and the macroeconomic environment may deteriorate. Persistence of the low interest rate environment has sustained concerns related to excessive risk taking, especially in an environment characterised by correlated asset price movements and sudden changes in market confidence. Uncertain growth prospects and the fiscal situation in the Member States remain important drivers of market sentiment.
Risk summary
While overall risk levels prevailed and remained
high in 2Q16, the outlook for the markets in
ESMA’s remit has deteriorated following the
outcome of the UK referendum on EU
membership, as reflected in our Risk Dashboard
update of 13 July 20161. In the wake of the
referendum, severe market movements
occurred, especially in equity, bond, and currency
markets. Market, liquidity, and contagion risks
may rise going forward, as political and event
risks have intensified, and the macroeconomic
environment may deteriorate. As political
developments post-referendum unfold, market
turbulences may continue to occur. Business
strategies and market structures may adjust to
the new political realities in the months and years
to come. Generally, recurrent swings in
valuations and high volatilities continued to signal
sustained risk sensitiveness and scope for
sudden risk repricing or rising market
imbalances.
Systemic stress had declined in the first part of
2Q16, driven by improvements in both equity and
bond markets, with valuations reinforced by
supportive EA monetary policy. This explained
1 https://www.esma.europa.eu/sites/default/ files/library/2016-1096_risk_dashboard_
most of the reduction in the composite indicator
of systemic stress (R.2). Despite this, key risk
sources remained, including the weak and
uneven economic development in the EU, slow
implementation of national structural reforms,
and uncertainty related to the political
developments around the outcome of the UK EU
referendum.
R.2 ESMA composite systemic stress indicator
Systemic risk retreated in first part of 2Q16
up-date_13_july_2016.pdf
-0.4
-0.2
0.0
0.2
0.4
0.6
Jun-12 Jun-13 Jun-14 Jun-15 Jun-16
Equity market contribution Bond market contribution
Money market contribution ESMA CISS
Correlation contributionNote: ESMA version of the ECB-CISS indicator measuring systemic stress i nsecurities markets. I t focuses on three financial market segments : equity, bondand money markets, aggregated through standard portfolio theory. I t is basedon securities market indicators such as volatilities and risk spreads.
Sources: ECB, ESMA.

ESMA Risk Dashboard No. 3, 2016 4
Risk sources
Macroeconomic environment: Even though signs
of improved economic growth, fuelled by
consumption and a pick-up in investments, were
observed for the EU in 2Q16, economic activity
overall remained weak and the outlook uncertain.
This was related to both EU-internal and external
financial and economic developments.2 Still-
uneven growth and structural reform
implementation across EU countries, low
inflation, and internal EU developments were the
major source of concern. Following the UK EU
referendum, lower asset prices, high volatility and
delayed issuance deals will likely weigh on the
medium-term economic outlook, while the long-
term outlook will depend on political
developments and the outcome of the
negotiations with the UK.
Low-interest rate environment: Risks stemming
from the low-interest rate environment persisted
as monetary policy in the Euro Area remained
accommodative. The ECB in April provided
details on the outright purchases of investment-
grade EUR-denominated bonds issued by non-
bank corporations established in the Euro Area,
starting in June 2016. Both sovereign and
corporate bond spreads decreased in 2Q16
(R.12), while HY issuance picked up
considerably. Sustained search-for-yield
strategies thus remained a source of concern, as
in an environment of high risk sensitiveness and
rapid changes in market confidence
vulnerabilities related to risk re-assessment and
repricing can be substantial and can materialise
even in the absence of a rise in interest rates.
This was mirrored in the sudden decline in
investor appetite for riskier assets observed
following the UK referendum, with outflows from
funds focused on riskier assets and increased
demand for sovereign bonds. Moreover,
additional strains may follow in the medium term
with potential increases in risk premia and
substantial reversals in capital flows across EU
markets.
EU sovereign debt markets: Overall, the demand
for EU sovereign bonds remained high and risk
premia subdued amid low interest rates and
supportive monetary policy. This was reinforced
by the tendency of a flight to safety, especially
after the UK EU referendum.
Market functioning: No significant disruptions in
EU market functioning were observed in 2Q16.
2 European Commission (2016), “European Economic
Forecasts, Spring 2016”, Institutional Paper 025.
3 ESMA (2016), “EU-wide CCP Stress Test Report 2015”.
Results for the ESMA EU-wide CCP stress tests
were published. The system of EU CCPs proved
resilient to counterparty risk under the scenarios
used to model extreme and plausible market
developments.3 No relevant events affecting the
operations of EU trading venues were observed,
even after the UK referendum when large trading
volumes were recorded. Noteworthy in terms of
the importance of exercising effective
surveillance is the successful conclusion of a
high-profile insider dealing case in the UK.
Regarding market efficiency, it is worth
mentioning plans within the bank payment
systems network to increase information sharing
in order to more effectively act against cyber-
attacks.
Political and event risk: The UK EU referendum
vote created substantial uncertainty regarding the
future economic outlook and EU institutional
arrangements, with key aspects to be negotiated
over the coming months, and possibly years.
Focus on the news flow and announcements may
result in intensified political and event risk,
contributing to uncertainty and greater asset price
volatility in EU markets. Further risks in this group
include political and geo-strategic challenges at
the EU perimeter and at international level.
Risk categories
Market risk – very high: Market risk remained very
high. Indeed, the risk outlook increased as a
consequence of the UK referendum outcome.
Valuations improved at the beginning of 2Q16,
and implied volatilities receded, with 1M VSTOXX
averaging around 25% in 2Q16, 5 percentage
points lower than 1Q16 (R.7). Improving market
conditions were also observed for other asset
classes. On average, spreads for BBB and AAA-
rated corporate bonds in 2Q16 declined by 26%
and more than 45% respectively compared to
1Q16 (R.12). Most of the improvements reversed
following the UK EU referendum vote. Equity
price volatility increased up to 35% on 24 June,
while market turnover multiplied. The 1M
VSTOXX hit a 40% peak, above February 2016
(R.7). The GBP lost 10% to the EUR, 13% to the
USD, and 17% to the JPY, reflecting an increase
in short-term implied volatility contracts in foreign
exchange markets ahead of the referendum
(R.6). The EUR has also been impacted, losing
3% to the USD, and 8% to the JPY.
https://www.esma.europa.eu/press-news/esma-news/esma-publishes-results-eu-central-counterparties-stress-test

ESMA Risk Dashboard No. 3, 2016 5
Liquidity risk – high: Liquidity risk maintained a
high level, yet with an increased outlook. Liquidity
pressures eased in 2Q16, but increased again in
June in relation to higher stock market volatility
triggered by the UK referendum results (R.4). In
fixed income markets liquidity conditions
ameliorated (R.9, R.13), with reduced volatilities
and improved market confidence linked to
continued monetary policy support and better
economic conditions in the EU. However,
uncertainty surrounding market liquidity and the
potential for sudden liquidity evaporation
remained. Even if market conditions were
relatively calmer in 2Q16, risks of a sudden
change in market confidence and liquidity
deterioration lingered. The UK’s decision to leave
the EU heightened financial stability risks,
especially in an environment of high
interconnectedness across financial market
sectors leading to the simultaneous unwinding of
positions and exacerbating market stress.
Following the UK vote, increased outflows have
precipitated the suspension of redemptions in a
number of open-ended funds holding UK
commercial property. This has highlighted the
potential vulnerability of funds that offer daily
redemptions while investing in illiquid assets.
Signs of increased stress were also observed in
the sovereign debt market with an increase in the
dispersion of repo specialness (R.11) at the end
of 2Q16.
Contagion risk – high: Contagion risk remained
high, but with an increased outlook as a result of
the potential implications and perceived impact of
the UK referendum on other EU countries.
Sovereign bond correlations decreased in 2Q16
and dispersion increased (R.16). These
developments were probably due to more
prudent valuations for peripheral countries amid
growing uncertainty over structural developments
and debt sustainability. Concerns remained
regarding the increasing interconnectedness of
the asset management sector with the banking
and insurance sectors and the potential for
spillovers into different financial market
segments. In fact, increased correlation in market
valuations across different market segments has
been observed: periods of stress seemed to
affect different asset classes simultaneously
(R.27). Against this background, increased
uncertainty may intensify market stress and
endanger financial stability.
Credit risk – very high: Credit risk remained at a
very high level, with a stable outlook. 2Q16 saw
a rise in corporate bond issuance for both IG and
HY segments. The growth in HY issuance was
around 150% in 2Q16 compared to 1Q16 (R.20).
This was also mirrored in fund flow movements:
Inflows for bond funds, especially those focused
on the EU and the US, increased significantly in
2Q16 (R.25). The above developments probably
reflected a combination of the new ECB monetary
policy measures, including the outright purchases
of investment-grade, euro-denominated bonds
issued by non-bank corporations, and sustained
search-for-yield strategies. Underlying risks
remained, with further deterioration in credit
quality (R.14) and corporate bond spreads higher
than a year ago, albeit decreasing (R.12). In the
UK, this was also reflected in its sovereign credit
rating downgrade after the referendum. In the
second half of the quarter, outflows from EU
funds invested in equities were observed.
Uncertainty about economic growth and the
consequences stemming from the UK decision
likely contributed to this development.
Operational risk – elevated: Results from the
ESMA EU-wide CCP stress test, published on 29
April 2016, showed that:
─ prefunded CCPs’ resources were sufficient for
CCPs to withstand default by the top two EU-
wide clearing member groups under historical
and hypothetical market stress shocks;
─ under more severe scenarios, CCPs faced
small amounts of total (i.e. across all CCPs)
residual uncovered losses varying from EUR
0.1bn up to EUR 4bn.4
On the day after the UK referendum EU trading
venues and other market infrastructures were
resilient, despite multiplied trading volumes and
high volatility. A substantial number of circuit
breakers were triggered on EU trading venues
under these market conditions. However, no
trading disruptions were observed, nor any
operational issues on EU trading venues and
other market infrastructures.
4 That is the case in particular for scenarios assuming
default of the top two CMs per CCP where a CM defaulting in one CCP would also be considered to be in
default in all CCPs, leading to more than 25 CM defaulting EU-wide.

ESMA Report on Trends, Risks and Vulnerabilities No. 3, 2016 6
Securities markets R.3
Risk summary Risk drivers
Risk level – Asset revaluation and risk reassessment.
– Low-interest-rate environment and excessive risk taking.
– Low inflation and uneven EU growth.
– Political and event risks.
Risk change from 1Q16
Outlook for 3Q16
Note: Assessment of main risk categories for markets under ESMA remit since past quarter, and outlook for current quarter. Systemic risk assessment based on categorisation of the ESA Joint Committee. Colours indicate current risk intensity. Coding: green=potential risk, yellow=elevated risk, orange=high risk, red=very high risk. Upward arrows indicate a risk increase, downward arrows a risk decrease. ESMA risk assessment based on quantitative indicators and analyst judgement.
R.4 R.5 Equity illiquidity Equity valuation
Liquidity oscillating, declining end-2Q16 Below long-term average in EU but increasing
R.6 R.7 Exchange rate volatilities Financial instruments volatilities
Sharp increase in GBP implied volatilities Short-term volatility increases for equities
R.8 R.9 Sovereign risk premia Sovereign liquidity
At low levels, yet increasing for some countries Slight improvement in 2Q16
0.56
0.57
0.58
0.59
Jun-14 Oct-14 Feb-15 Jun-15 Oct-15 Feb-16 Jun-16
Illiquid ity index 2Y-MA
Note: Composite indicator of liqui dity i n the equity market for the currentEurostoxx 200 constituents, computed by applying the princi pal componentmethodology to six i nput liquidi ty measures (Amihud illiquidity coefficient, bid-
ask spread, Hui-Heubel ratio, turnover value, inverse turnover ratio, MEC). Theindicator range is between 0 (higher liquidity) and 1 (lower liquidity).Sources: Thomson Reuters Datastream, ESMA.
0.00
1.00
2.00
3.00
4.00
Apr-12 Oct-12 Apr-13 Oct-13 Apr-14 Oct-14 Apr-15 Oct-15 Apr-16Adjusted P/E EA Average EA
Adjusted P/E US Average US
Sources: Thomson Reuters Datastream, ESMA
R
Note: Monthly earnings adjusted for trends and cyclical factors via Kalman filtermethodology based on OECD leading indicators; units of standard deviation;averages computed from 8Y. Data available until the end of April 2016.Sources: Thomson Reuters Datastream, ESMA.
0
5
10
15
20
Jun-14 Oct-14 Feb-15 Jun-15 Oct-15 Feb-16 Jun-16
EUR-GBP EUR-USD
GBP-USD 5Y-MA EURNote: Implied volatilities for 3M options on exchange rates . 5Y-MA EUR is thefive-year movi ng average of the implied volatility for 3M options on EUR-USDexchange rate.
Sources: Bloomberg, ESMA.
0
60
120
Jun-14 Oct-14 Feb-15 Jun-15 Oct-15 Feb-16 Jun-16
2Y 5Y 10Y
0
25
50
Jun-14 Oct-14 Feb-15 Jun-15 Oct-15 Feb-16 Jun-16VSTOXX 1M VSTOXX 3M
VSTOXX 12M VSTOXX 24MNote: Top panel: implied volatilities on 1M forward ICAP Euro vs. 6M Euroiborswaptions based on the Normal volatility model, in bp; low panel: Eurostoxx50implied volatilities, measured as price indices, in %.
Sources: Thomson Reuters Datastream, ESMA.
0
4
8
12
16
20
0
1
2
3
4
Jun-14 Oct-14 Feb-15 Jun-15 Oct-15 Feb-16 Jun-16
PT IE IT ES GR (rhs)
Note: Selected 10Y EA sovereign bond risk premia (vs. DE Bunds), in %.Sources: Thomson Reuters Datastream, ESMA.
0
1
10
100
Jun-14 Oct-14 Feb-15 Jun-15 Oct-15 Feb-16 Jun-16
EU Median GR ITIE PT ES
Note: Li quidity measured as difference of ask and bid yields for 10Y sovereignbonds, in basis points. EU M edian computed usi ng data for 24 countries.Logarithmic scale.
Sources: Bloomberg, ESMA.

ESMA Report on Trends, Risks and Vulnerabilities No. 3, 2016 7
R.10 R.11 CDS volumes Repo markets specialness
Broadly stable Signs of tension in sovereign repo markets
R.12 R.13 Corporate bond spreads Corporate bond bid-ask spreads
Decline in 2Q16 Increasing trend
ICAP Euro Euribor swap rates
R.14 R.15 Outstanding long term debt Covered bond spreads
Lower credit quality Reduction in spreads
R.16 R.17 Dispersion in sovereign yield correlation Dispersion in sovereign-corporate yield correlation
Decrease in correlation, increase in dispersion Strong decrease in correlation
0
5
10
15
20
25
Jun-14 Oct-14 Feb-15 Jun-15 Oct-15 Feb-16 Jun-16
DE ES FR IE IT PT
Note: Value of outstanding net notional soverei gn CDS for selected countries;USD bn.Sources: DTCC, ESMA.
0
3
6
9
12
Jun-14 Dec-14 Jun-15 Dec-15 Jun-16
Median 75th perc 90th perc
Note: Medi an, 75th and 90th percentile of weekly speci alness , measured as thedifference between general collater al and special collateral repo rates ongovernment bonds in selected countries, in basis points.
Sources: RepoFunds Rate (BrokerTec, MTS, ICAP), ESMA.
0
50
100
150
200
250
Jun-14 Oct-14 Feb-15 Jun-15 Oct-15 Feb-16 Jun-16
AAA AA A BBBNote: EA non-financi al corporate bond spreads by r ating between iBoxx non-financi al corporate yields and ICAP Euro Euribor swap rates for differentmaturities, basis points.
Sources: Thomson Reuters Datastream, ESMA.
30
40
50
60
Jun-14 Oct-14 Feb-15 Jun-15 Oct-15 Feb-16 Jun-16
Bid-Ask 1Y-MA
Note: EUR Markit Iboxx corporate bond index bid-ask spread in bp, computed asthe wei ghted sum of the bid-ask spr ead of its components in the current
composition. 1Y MA = one-year moving average.Sources: Markit, ESMA.
0
25
50
75
100
11Q2 12Q2 13Q2 14Q2 15Q2 16Q2
BB and lower BBB A AA AAA
Note: Outstanding amount of corpor ate bonds as of issuance date by ratingcategory, in % of the total.Sources: Dealogic, ESMA.
0
40
80
120
160
Jun-14 Oct-14 Feb-15 Jun-15 Oct-15 Feb-16 Jun-16
All AAA AA A 5Y-MA
Note: Asset swap spreads based on iBoxx covered bond indices, basis points.5Y-MA=five-year moving average of all bonds.Sources: Thomson Reuters Datastream, ESMA.
-1.0
-0.5
0.0
0.5
1.0
Jun-14 Oct-14 Feb-15 Jun-15 Oct-15 Feb-16 Jun-16
Top 25% Core 50%Bottom 25% Median
Note: Dispersion of correlati ons betw een 10Y D E Bunds and other EU countries'sovereign bond redemption yields over 60D rolling windows.Sources: Thomson Reuters Datastream, ESMA.
-1.0
-0.5
0.0
0.5
1.0
Jun-14 Oct-14 Feb-15 Jun-15 Oct-15 Feb-16 Jun-16
Top 25% Core 50%Bottom 25% Median
Note: Dispersion of correlation between Barclays Aggregate for corporate and10Y sovereign bond redemption yields for BE, ES, FI, FR, IT, NL.Sources: Thomson Reuters Datastream, ESMA.

ESMA Report on Trends, Risks and Vulnerabilities No. 3, 2016 8
R.18 R.19 Debt issuance growth Net sovereign debt issuance
Increased HY debt issuance Sovereign issuance subdued
R.20 R.21 HY issuance Hybrid capital issuance and outstanding
Issuance increasing in EU and US Low issuance
R.22 R.23 Debt maturity Debt redemption profile
Broadly stable Redemptions decreasing for banks
-2
-1
0
1
2
AB
S 1
4Q
2
AB
S 1
5Q
2
AB
S 1
6Q
2
HY
14
Q2
HY
15
Q2
HY
16
Q2
IG 1
4Q
2
IG 1
5Q
2
IG 1
6Q
2
CB
14
Q2
CB
15
Q2
CB
16
Q2
MB
S 1
4Q
2
MB
S 1
5Q
2
MB
S 1
6Q
2
MM
14
Q2
MM
15
Q2
MM
16
Q2
SO
V 1
4Q
2
SO
V 1
5Q
2
SO
V 1
6Q
2
10% 90% Current MedianNote: Growth rates of issuance volum e, in %, normalised by standard deviationfor the following bond classes: asset backed securities (ABS); high-yield (HY);investment grade (IG); covered bonds (CB); mortgage backed securities
(MBS); money market (MM); sovereign (SOV). Percentiles computed from 12Qrolling window. All data i nclude securities with a maturity higher than 18M. Barsdenote the range of values between the 10th and 90th percentiles.Sources: Dealogic, ESMA.
-80
-40
0
40
80
-50
-25
0
25
50
AT
BE
BG
CY
CZ
DE
DK
EE EL
ES FI
FR
HR
HU IE IT LT
LU
LV
MT
NL
PL
PT
RO
SE SI
SK
UK
EU
1Y high 1Y low 16Q2
Note: Quartely net issuance of EU sovereign debt by country, EUR bn. Netissuance calculated as the difference between new issuance over the quarterand outstandi ng debt maturing over the quarter. Highest and low est quarterly
net issuance in the past year are reported. EU total on right-hand scale.Sources: Dealogic, ESMA.
40
0
40
80
120
11Q2 12Q2 13Q2 14Q2 15Q2 16Q2
EU USA Asia ex JP Latin America
Note: Quarterly data on high-yield corporate bond issuance by regi on ofissuance; EUR bn.Sources: Dealogic, ESMA.
0
150
300
450
600
750
900
0
5
10
15
20
25
30
11Q2 12Q2 13Q2 14Q2 15Q2 16Q2Outstanding (rhs) Issuance5Y-MA Issuance
Note: Outstanding amount computed as the cumulated sum of previously issueddebt minus the cumul ated m atured debt prior to reference date. EUR bn.According to D ealogic classification, hybrid capital refers to subordi nated debt
Tier 1 capital mostly having perpetual maturity.Sources: Dealogic, ESMA.
-0.6
-0.4
-0.2
0.0
0.2
0.4
0.6
Sovereigns Banks Industr ials Util ities
EU AVG EU MIN (if on scale)
EU MAX (if on scale) CGIIPS
Non-CGIIPSNote: Quarterly change in maturity of outs tanding debt by sector and countrygroups in the EU, years. CGIIPS include CY, GR, IT, IE, PT and ES. Min and Maxmay not be displayed where they are out of the scale provided in the graph.
Sources: Dealogic, ESMA.
4Q15 1Q16 2Q16 4Q15 1Q16 2Q16 4Q15 1Q16 2Q16 4Q15 1Q16 2Q16 -10
0
10
20
30
-40
0
40
80
120
16Q2 16Q3 16Q4 17Q1 17Q2 17Q3 17Q4 18Q1 18Q2 18Q3 18Q4 19Q1 19Q2
Banks Ind and Util
Financials (rhs) Banks -1Y
Ind and Util-1Y Financials -1Y (rhs)
Note: Quarterly redemptions over a 3Y-horizon by European private corporates(banks, non-bank financials, and industrials and utilities), current and change overlast year (dotted lines), EUR bn. Excluding bank redemptions to central banks.
Sources: Dealogic, ESMA.
ESMA Report on Trends, Risks and Vulnerabilities No. 3, 2016 9
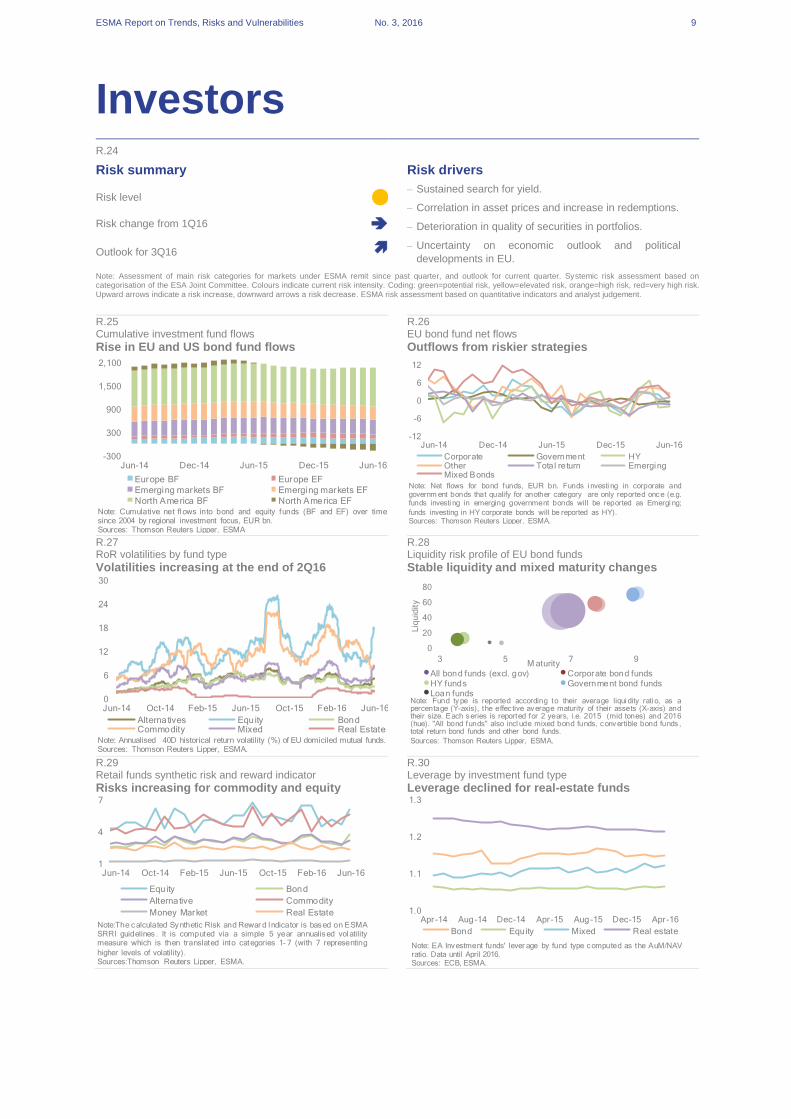
Investors R.24
Risk summary Risk drivers
Risk level – Sustained search for yield.
– Correlation in asset prices and increase in redemptions.
– Deterioration in quality of securities in portfolios.
– Uncertainty on economic outlook and political
developments in EU.
Risk change from 1Q16
Outlook for 3Q16
Note: Assessment of main risk categories for markets under ESMA remit since past quarter, and outlook for current quarter. Systemic risk assessment based on categorisation of the ESA Joint Committee. Colours indicate current risk intensity. Coding: green=potential risk, yellow=elevated risk, orange=high risk, red=very high risk. Upward arrows indicate a risk increase, downward arrows a risk decrease. ESMA risk assessment based on quantitative indicators and analyst judgement.
R.25 R.26 Cumulative investment fund flows EU bond fund net flows
Rise in EU and US bond fund flows Outflows from riskier strategies
R.27 R.28 RoR volatilities by fund type Liquidity risk profile of EU bond funds
Volatilities increasing at the end of 2Q16 Stable liquidity and mixed maturity changes
R.29 R.30 Retail funds synthetic risk and reward indicator Leverage by investment fund type
Risks increasing for commodity and equity Leverage declined for real-estate funds
-300
300
900
1,500
2,100
Jun-14 Dec-14 Jun-15 Dec-15 Jun-16
Europe BF Europe EF
Emerging markets BF Emerging markets EF
North America BF North America EFNote: Cumulative net fl ows into bond and equity funds (BF and EF) over timesince 2004 by regional investment focus, EUR bn.Sources: Thomson Reuters Lipper, ESMA
-12
-6
0
6
12
Jun-14 Dec-14 Jun-15 Dec-15 Jun-16
Corporate Government HYOther Tota l return EmergingMixed Bonds
Note: Net flows for bond funds, EUR bn. Funds i nvesti ng in corporate andgovernm ent bonds that qualify for another category are only reported once (e.g.funds investi ng in emerging government bonds will be reported as Emergi ng;
funds investing in HY corporate bonds will be reported as HY).Sources: Thomson Reuters Lipper, ESMA.
0
6
12
18
24
30
Jun-14 Oct-14 Feb-15 Jun-15 Oct-15 Feb-16 Jun-16
Alternatives Equity BondCommodity Mixed Real Estate
Note: Annualised 40D historical return volatility (%) of EU domiciled mutual funds.Sources: Thomson Reuters Lipper, ESMA.
0
20
40
60
80
3 5 7 9
Liq
uid
ity
M aturityAll bond funds (excl. gov) Corporate bond fundsHY funds Government bond fundsLoan funds
Note: Fund type is reported according to their average liqui dity rati o, as apercentage (Y-axis), the effec tive average maturity of their assets (X-axis) andtheir size. Each series is reported for 2 years, i.e. 2015 (mid tones) and 2016(hue). "All bond funds" also incl ude mixed bond funds, convertible bond funds ,total return bond funds and other bond funds.
Sources: Thomson Reuters Lipper, ESMA.
1
4
7
Jun-14 Oct-14 Feb-15 Jun-15 Oct-15 Feb-16 Jun-16
Equity Bond
Alternative Commodity
Money Market Real Estate
Note:The calculated Synthetic Risk and Rewar d Indicator is based on ESMASRRI guidelines . It is computed via a simple 5 year annualised vol atilitymeasure which is then translated into categories 1- 7 (with 7 representing
higher levels of volatility).Sources:Thomson Reuters Lipper, ESMA.
1.0
1.1
1.2
1.3
Apr-14 Aug-14 Dec-14 Apr-15 Aug-15 Dec-15 Apr-16
Bond Equity Mixed Real estate
Note: EA Investment funds' lever age by fund type computed as the AuM/NAVratio. Data until April 2016.Sources: ECB, ESMA.

ESMA Report on Trends, Risks and Vulnerabilities No. 3, 2016 10
R.31 R.32 Financial market interconnectedness Hedge fund interconnectedness
Slight increase across funds Interconnectedness increased for stabiliser HFs
0
20
40
60
80
0
5
10
15
20
25
11Q1 12Q1 13Q1 14Q1 15Q1 16Q1Total funds Hedge funds
Bond funds MMFs ( rhs)
Note: Loan and debt securities vis-à-vis MFI counterparts, as a share of totalassets. EA investm ent funds and MMFs, in %. Total funds includes: bond funds,equity funds, mixed funds, real estate funds, hedge funds, MMFs and other non-
MMFs investment funds.Sources: ECB, ESMA.
-0.02
-0.01
0
0.01
0.02
May-12 May-13 May-14 May-15 May-16
Destabiliser HF (coeff. +) Stabiliser HF (coeff. -)
Note: Systemic s tress indicator based on products of frac tions of regressi ons withpositive (negative) estimated coeffcient individual fund return's impact on averagereturn of sector significant at 99% level and respective average estimators.
Coefficients stem from VAR models regressing individual fund r eturns on lags andgeneral financial market indices. Measures aggr egated across i ndividualregressions. Data until September 2015.Sources: Barclayhedge, Eurekahedge, TASS, HFR, ESMA.

ESMA Report on Trends, Risks and Vulnerabilities No. 3, 2016 11
Infrastructures and services R.33
Risk summary Risk drivers
Risk level – Operational risks, incl. insufficient technology management,
cyber-attacks.
– Conduct risk, incl. intentional or accidental behaviour by
individuals, market abuse.
– Systemic relevance of individual operations, incl. market
share, complexity of operations, interconnectedness with
other infrastructures or financial activities, system
substitutability.
Risk change from 1Q16
Outlook for 3Q16
Note: Assessment of main risk categories for markets under ESMA remit since past quarter, and outlook for current quarter. Systemic risk assessment based on categorisation of the ESA Joint Committee. Colours indicate current risk intensity. Coding: green=potential risk, yellow=elevated risk, orange=high risk, red=very high risk. Upward arrows indicate a risk increase, downward arrows a risk decrease. ESMA risk assessment based on quantitative indicators and analyst judgement.
R.34 R.35 Market concentration Settlement fails
Dispersion among equity indices increased Fails more volatile for corporate bonds
R.36 R.37 IRS clearing Euribor – Dispersion in contributions
Volatile for some asset classes Slight decline end-2Q16
R.38 R.39 Euribor – Dispersion of submission levels Rating changes
Increased dispersion in submissions Negative for non-financials and sovereigns
0
20
40
60
80
Jun-14 Oct-14 Feb-15 Jun-15 Oct-15 Feb-16 Jun-16
Top 25% Core 50% Bottom 25% Median
Note: Concentration of notional value of equity tr ading by national indicescomputed as a 22D-MA of the Herfi ndahl-Hirschmann Index, i n %. Indicesincluded are FTSE100, CAC 40, DAX, FT SE MIB, IBEX35, AEX, OMXS30,
BEL20, OMXC20, OMXH25, PSI20, ATX.Sources: BATS, ESMA.
0
2
4
6
8
May-14 Sep-14 Jan-15 May-15 Sep-15 Jan-16 May-16
Corporate bonds Equities Government bonds
Note: Share of failed settlement instructi ons in EU; % of value, 5D-MA. Free-of-payment transactions not considered. Data available until May 2016.Sources: National Competent Authorities, ESMA.
40
50
60
70
80
90
100
Jun-14 Oct-14 Feb-15 Jun-15 Oct-15 Feb-16 Jun-16
Swap Basis Swap OIS FRA
Note: OTC interest rate derivatives cleared by CCPs, in % of total notionalamount.Sources: DTCC, ESMA.
0.0
0.2
0.4
0.6
0.8
Jun-14 Oct-14 Feb-15 Jun-15 Oct-15 Feb-16 Jun-16
Note: Normalised difference in percentage poi nts betw een the highestcontribution submitted by panel banks and the correspondi ng Euribor rate. Thechart shows the maximum difference across the 8 Euribor tenors. The increase
since 2013 is linked to technical factors such as low Euribor rates. The spike inAugust 2014 refl ects the fact that two panel banks submitted respectively aquote for the two-week tenor which was 7 times higher than Euribor and aquote for the 1M tenor which was 10 times higher than Euribor.Sources: European Money Markets Institute, ESMA.
-0.4
-0.2
0.0
0.2
0.4
Jun-14 Oct-14 Feb-15 Jun-15 Oct-15 Feb-16 Jun-16
Top 15% Core 70%
Bottom 15% 3M Euribor
Raw 3M Euribor ECB refinancing rate
Note: Dispersion of 3M Euribor submissions, i n %. The "Raw 3M Euribor" rate iscalculated without trimming the top and bottom submissions of the panel for the3M Euribor.
Sources: European Money Markets Institute, ESMA.
-60
-45
-30
-15
0
15
30
10H2 11H2 12H2 13H2 14H2 15H2Covered Bond FinancialsInsurance Non financialsSovereign Structured Finance
Note: Drift of ratings from all credit rating agencies, excluding CERVED and ICAP, by asset class computed as percentage number of upgrades minus percentage number of downgrades.Sources: CEREP, ESMA.

ESMA Report on Trends, Risks and Vulnerabilities No. 2, 2016 12


