European Organisation for Astronomical Research in the Southern Hemisphere European Southern Observatory Headquarters Garching KarlSchwarzschildStraße 2 85748 Garching bei München www.eso.org Programme: VLT Project/WP: Science Operations ESPRESSO User Manual Document Number: ESO319963 Document Version: 1.1 Document Type: Manual (MAN) Released On: 20180901 Document Classification: VLTMANESO135200253 Prepared by: Paolo Molaro, and the ESPRESSO Consortium Validated by: Steffen Mieske Approved by: Andreas Kaufer Maintained and edited by: Cédric Ledoux, and the ESPRESSO Instrument Operations Team
Transcript
European Organisation for Astronomical Research in the Southern Hemisphere
European Southern Observatory Headquarters Garching
Karl-Schwarzschild-Straße 2 85748 Garching bei München
Prepared by: Paolo Molaro, and the ESPRESSO Consortium
Validated by: Steffen Mieske
Approved by: Andreas Kaufer
Maintained and edited by: Cédric Ledoux, and the ESPRESSO Instrument Operations Team
ESPRESSO User Manual
Doc. Number: ESO-319963 Doc. Version: 1.1 Released on: 2018-09-01 Page: 2 of 35
Document Classification: Public
Authors Name Affiliation P. Molaro et al. Original authors from the
ESPRESSO Consortium
C. Ledoux et al. Editors from ESO - Directorate of Operations
Change Record from Previous Versions Issue/Rev. Date Affected
Section(s) Changes / Reason / Remarks
0.1 2017-02-01 All First draft
0.5 2017-02-28 All PAE version
0.6 2018-02-06 All Pepe’s revision of PAE document
0.8 2018-03-01 All First version for ESO Period 102
1.0 2018-07-01 All First version for Phase 2 submission
1.1 2018-09-01 All Updated version for Period 103
ESPRESSO User Manual
Doc. Number: ESO-319963 Doc. Version: 1.1 Released on: 2018-09-01 Page: 3 of 35
Document Classification: Public
Table of Content 1. Introduction ................................................................................................................... 7 1.1 Scope of this Document ......................................................................................... 7 1.2 Definitions, Acronyms and Abbreviations ............................................................... 7 1.3 More Information on ESPRESSO ........................................................................... 8
2.1.1 A Combined-Coudé Spectrograph in 1-UT or 4-UT Mode ............................. 9 2.2 The Spectrograph................................................................................................. 11
2.2.1 Optical Design ............................................................................................. 11 2.2.2 Opto-Mechanics and Thermal Control ......................................................... 13 2.2.3 Scientific Detectors...................................................................................... 15 2.2.4 The Calibration Unit..................................................................................... 16
4. Performances and Characteristics............................................................................... 22 4.1 Efficiency and RV Precision ................................................................................. 22 4.2 Wavelength Calibration and Drift Measurement ................................................... 25 4.3 Dark Current, Diffuse Light, Ghosts and Sky Background .................................... 26
5. Observing with ESPRESSO ........................................................................................ 27 5.1 Preparing the Observations .................................................................................. 27
5.1.1 Exposure Time Calculator ........................................................................... 27 5.1.2 Phase 2 ....................................................................................................... 28 5.1.3 The Effect of Precipitable Water Vapour ...................................................... 29
5.2 Observing: the Exposure Meter ............................................................................ 30 6. Calibration Plan ........................................................................................................... 32 7. End-to-End Operations................................................................................................ 34 7.1 Data Flow ............................................................................................................. 34 7.2 Data Reduction Software (DRS) ........................................................................... 34 7.3 Data Analysis Software (DAS) .............................................................................. 34
ESPRESSO User Manual
Doc. Number: ESO-319963 Doc. Version: 1.1 Released on: 2018-09-01 Page: 4 of 35
Document Classification: Public
List of Figures Fig. 1: UT Coudé Train and optical path to the CCL through the telescope and tunnels .... 9 Fig. 2: Side view of an individual Front-End Unit .............................................................. 10 Fig. 3: Top view of the Front-End Unit. Right: FE and the four UT beams in the CCL ...... 11 Fig. 4: Layout of the ESPRESSO spectrograph and its optical elements ......................... 12 Fig. 5: Conceptual description of pupil and fibre images at relevant locations of the
spectrograph............................................................................................................. 12 Fig. 6: Format of the red spectrum. Centre: format of the blue spectrum. Right: zoom in on
the pseudo-slit image. The latter shows the image of the target (bottom) and sky fibre (top). Each fibre is re-imaged into two slices. The image of the pseudo-slit on the science detectors, from left to right: in the standard resolution 1-UT mode, the ultra-high resolution 1-UT mode, and the medium-resolution 4-UT mode, are shown together. ................................................................................................................... 13
Fig. 7: Opto-mechanics of the ESPRESSO spectrograph ................................................ 14 Fig. 8: ESPRESSO inside the CCL, vacuum vessel and multi-shell thermal control system
................................................................................................................................. 14 Fig. 9: ESPRESSO inside the CCL, top view ................................................................... 15 Fig. 10: The first ESPRESSO e2v CCD in its just opened shipping container, handled inside
the ESO cleanroom .................................................................................................. 16 Fig. 11: Efficiency of ESPRESSO incl. slit losses and atmospheric transmission in HR (and
MR) mode for the blue (top) and red arm (bottom). A seeing of 0.8 arcsec and an airmass of 1 are assumed......................................................................................... 22
Fig. 12: Efficiency of ESPRESSO incl. slit losses and atmospheric transmission in UHR mode for the blue (top) and red arm (bottom). A seeing of 0.8 arcsec and an airmass of 1 are assumed. ..................................................................................................... 23
Fig. 13: Left: SNR vs. stellar magnitude obtained in the singleHR11 mode for exposure times of 60s (pink), 1200s (blue) and 3600s (red). The slope change defines the magnitude at which the measurement becomes detector read-out noise limited. SNR for 10 cm s-1 and 100 cm s-1 are shown. The values are rough estimates for slowly-rotating, inactive late-G or K dwarf stars, calculated for a seeing of 0.8 arcsec and an airmass of 1. Right: same but for the singleHR21 mode. .......................................... 24
Fig. 14: Same as Fig. 13 but for the singleUHR11 mode ................................................. 24 Fig. 15: Left: SNR vs. stellar magnitude obtained in the multiMR42 mode for exposure times
of 60s (pink), 1200s (blue) and 3600s (red). The slope change defines the magnitude at which the measurement becomes detector read-out noise limited. Right: same but for the multiMR84 mode. .......................................................................................... 24
Fig. 16: Example of raw frame (and zoom in, on the right-hand side) from the red CCD of ESPRESSO illuminated with the ThAr lamp (in Fibre A – to the right) and the Fabry-Pérot simultaneous calibration light (Fibre B;; continuous dots to the left).................. 26
Fig. 17: GUI of the exposure meter during observations .................................................. 31 Fig. 18: Overview of ESPRESSO's control environment .................................................. 35
ESPRESSO User Manual
Doc. Number: ESO-319963 Doc. Version: 1.1 Released on: 2018-09-01 Page: 5 of 35
Document Classification: Public
ESPRESSO User Manual
Doc. Number: ESO-319963 Doc. Version: 1.1 Released on: 2018-09-01 Page: 6 of 35
Document Classification: Public
List of Tables Table 1: Abbreviations and acronyms used in this document ............................................. 8 Table 2: Summary of ESPRESSO's observing modes and performances ....................... 17 Table 3: ESPRESSO detector modes .............................................................................. 18 Table 4: Frame size provided by each individual read-out port ........................................ 18 Table 5: Summary of ESPRESSO's instrument configurations ........................................ 18 Table 6: Spectral format of ESPRESSO's red-arm CCD .................................................. 20 Table 7: Spectral format of ESPRESSO's blue-arm CCD ................................................ 21 Table 8: ESPRESSO standard calibration plan ................................................................ 33
ESPRESSO User Manual
Doc. Number: ESO-319963 Doc. Version: 1.1 Released on: 2018-09-01 Page: 7 of 35
Document Classification: Public
1. Introduction 1.1 Scope of this Document This User Manual is intended to help users of ESPRESSO to decide on the opportunity to use the instrument for their own scientific applications and provide the necessary information on the capabilities and functionalities of the instrument. This manual should therefore be used as a reference when writing observing time proposals and preparing the observations. For this purpose, this document provides:
• An overall description of the technical characteristics of ESPRESSO, its performances and observing modes;;
• Information on the preparation of the observations;;
• Information on the observing process;;
• A description of the instrument calibration plan;;
• A brief introduction to the pipeline data reduction and data analysis software. The content of this manual is based on the work of the ESPRESSO Consortium. It is intended for ESPRESSO users and as such is written from an astronomer’s perspective. Comments and suggestions on the content of this manual is welcome and is to be addressed to the User Support Department (usd-[email protected]).
1.2 Definitions, Acronyms and Abbreviations This document uses a number of abbreviations and acronyms to refer concisely to an item after it is introduced. The aim of Table 1 is to help the reader in explaining the meaning of each short expression. 1T First temperature enclosure (convergence-point room) 3T Third temperature enclosure (surrounding the vacuum vessel) AD Applicable Document ADC Atmospheric Dispersion Corrector APSU Anamorphic Pupil Slicer Unit BCA Blue Camera BTM Blue Transfer Mirror BXD Blue Cross-Disperser BOB Broker of Observation Blocks CCD Charge-Coupled Device CCL Combined Coudé Laboratory CPL Common Pipeline Library CR Coudé Room CS Control Software CTE Charge Transfer Efficiency DAS Data Analysis Software DC Dichroic DFS Data Flow System DRS Data Reduction Software EG Echelle Grating ESO European Southern Observatory ESPRESSO Echelle Spectrograph for Rocky Exoplanets and Stable Spectroscopic
Observations ETC Exposure Time Calculator
ESPRESSO User Manual
Doc. Number: ESO-319963 Doc. Version: 1.1 Released on: 2018-09-01 Page: 8 of 35
Document Classification: Public
FE(U) Front-End (Unit) FITS Flexible Image Transport System FL Field Lens FM Field Mirror (also called RFM) FP(CS) Fabry-Pérot (Calibration Source) GUI Graphical User Interface HARPS High-Accuracy Radial-velocity Planet Searcher HDU Header/Data Unit HR High Resolution LDLS Laser-Driven Light Source LFC Laser Frequency Comb calibration source MC Main Collimator OB Observation Block PAE Provisional Acceptance Europe PLC Programmable Logic Controller RCA Red Camera RD Reference Document RFM Red Field Mirror (see FM) RTM Red Transfer Mirror RXD Red Cross-Disperser RV Radial Velocity SNR Signal-to-Noise Ratio TCCD Technical CCD ThAr Thorium-Argon hollow cathode lamp UHR Ultra-High Resolution UT Unit Telescope (8.2-metre telescope at Paranal) VLT Very Large Telescope VME VersaModule Eurocard VPHG Volume Phase Holographic Grating VV Vacuum Vessel
Table 1: Abbreviations and acronyms used in this document
1.3 More Information on ESPRESSO All ESPRESSO documentation is available from the ESPRESSO public WEB pages together with the most up-to-date information on the instrument: http://www.eso.org/sci/facilities/paranal/instruments/espresso Information and software tools for the preparation of service- and visitor-mode observations using ESPRESSO are available at: http://www.eso.org/sci/observing/phase2 http://www.eso.org/sci/observing/phase2/SMGuidelines.ESPRESSO Visiting astronomers will find instructions on the Paranal Science Operations WEB pages as well as the following public page: http://www.eso.org/sci/facilities/paranal/sciops http://www.eso.org/sci/facilities/paranal/instruments/espresso/visitor Any publication based on observations using ESPRESSO should cite the following paper: Pepe et al., 2013, The Messenger, 153, 6: “ESPRESSO — An Echelle SPectrograph for Rocky Exoplanets Search and Stable Spectroscopic Observations”
ESPRESSO User Manual
Doc. Number: ESO-319963 Doc. Version: 1.1 Released on: 2018-09-01 Page: 9 of 35
Document Classification: Public
2. Instrument Description 2.1 Overview ESPRESSO is a fibre-fed, cross-dispersed, high-resolution Echelle spectrograph at ESO’s VLT. The instrument is located in the Combined-Coudé Laboratory (CCL) where at the incoherent focus front-end units collect the light from up to the 4 Unit Telescopes (UTs) simultaneously. The telescope light is fed into the instrument via a `Coudé-Train’ optical system and through optical fibres. Target and reference light enter the instrument simultaneously through two separate fibres, which together form the `slits’ of the spectrograph.
2.1.1 A Combined-Coudé Spectrograph in 1-UT or 4-UT Mode Although foreseen in the original VLT plan, the incoherent combined focus was never implemented before. Located in the VLT’s CCL, ESPRESSO can receive light from any of the four UTs. The light of the single UT scheduled to observe is then fed into the spectrograph (1-UT mode). Alternatively, the light from all four UTs can be fed into ESPRESSO simultaneously (4-UT mode).
Fig. 1: UT Coudé Train and optical path to the CCL through the telescope and tunnels
ESPRESSO User Manual
Doc. Number: ESO-319963 Doc. Version: 1.1 Released on: 2018-09-01 Page: 10 of 35
Document Classification: Public
Transport of the light from the telescopes to the CCL is obtained through a full optics solution, with no use of fibre. The Coudé Trains pick up the light at the level of the Nasmyth-B platforms and with a prism root the beam through the UT mechanical structure down to the UT Coudé Rooms (CR), and then farther to the CCL along the incoherent light ducts as shown in Fig. 1. The light from the telescopes from the Nasmyth-B foci to the entrance of the tunnels in the CR below each UT is conveyed with a set of 4 prisms. The light is directed from the UT’s Coudé Room towards the CCL using a 2-mirrors periscope and 2 big lenses. In this way, the beams from the four UTs converge into the CCL, where mode selection and beam conditioning are obtained by a dedicated Front-End (FE) sub-system. The implementation of the Coudé Trains required substantial changes in the Paranal Observatory infrastructure resulting in a sophisticated interface management. The Front-End sub-system is composed of a rigid four-arm structure, each arm being oriented towards one of the UT’s incoherent tunnels, and four Front-End units containing all the active elements of the instrument. The beam received from the Coudé is corrected for atmospheric dispersion by four ADC units and then transported by the Front-End unit to the common focal plane on which the heads of the fibre-to-spectrograph feeding are located. While performing such a beam conditioning, the Front-End applies pupil and field stabilizations. These are achieved via two independent control loops each composed of a technical camera and a tip-tilt stage. Due to the already highly stable pupil, the pupil stabilization control loop, although available, is in practice not used. Another dedicated stage delivers a focusing function.
Fig. 2: Side view of an individual Front-End Unit
In addition, when needed, the Front-End provides the injection of the calibration light, both from white and spectral sources, into the corresponding spectrograph fibre. An inside view of a single Front-End Unit and its functionalities is given in Fig. 2. In this figure, the beam arrives through the tunnel and crosses the ADC (on the right-hand side outside of the figure). After that, the beam is deviated by the pupil- and field-stabilisations mirrors in the direction of the Fibre Head where the light is injected into the fibre link through a pinhole in the field mirror. A refocusing mechanism allows to focus the stellar image on the pinhole for optimum efficiency. The field mirror redirects the beam falling outside of the pinhole towards a guiding and a pupil camera for field and pupil visualizations, respectively. A top view of the whole Front-End is shown in Fig. 3, together with on the right side a picture of the interior of the CCL.
ESPRESSO User Manual
Doc. Number: ESO-319963 Doc. Version: 1.1 Released on: 2018-09-01 Page: 11 of 35
Document Classification: Public
Fig. 3: Top view of the Front-End Unit. Right: FE and the four UT beams in the CCL
The Fibre-Link sub-system relays the light from the Front-End to the spectrograph and forms the spectrograph pseudo-slit inside the vacuum vessel. The 1-UT mode uses a bundle of 2 octagonal fibres, one for the object and one for the sky or simultaneous wavelength reference. In the high-resolution (singleHR) mode, the fibres have a core of 140 μm, which is equivalent to 1 arcsec on the sky. In the ultra-high resolution (singleUHR) mode, the fibres’ core is 70 μm wide, equivalent to 0.5 arcsec on the sky. The two fibre pairs are located in separate bundles and heads that are brought at the focal plane of the specific Front-End of the corresponding UT. In the 4-UT mode (multiMR), four object fibres and four sky/reference fibres (one fibre head for a pair of each) converge together from the four UTs. The four object fibres, all with a core of 140 μm, finally feed a single square 280 μm object fibre;; the same for the four sky/reference fibres that feed a single square 280 μm sky/reference fibre. Thus, in the 4-UT mode, the spectrograph ‘sees’ a pseudo slit of four fibre images twice as wide as in the case of the 1-UT fibres. An essential task performed by the Fibre-Link sub-system is light scrambling. The use of a double-scrambling optical system ensures both scrambling of the near field and far field of the light beam. A high scrambling gain is crucial to obtain high radial-velocity (RV) precision and is best achieved using octagonal fibres (Chazelas et al, 2012, SPIE, V. 8450, p9).
2.2 The Spectrograph 2.2.1 Optical Design The optical design of the spectrograph is shown in Fig. 4. Several innovative optical solutions have been used to obtain both a high spectral resolution and a high efficiency. In order to minimize the size of the optics, particularly of the collimator and the Echelle grating, ESPRESSO implements anamorphic optics. At the spectrograph entrance, the Anamorphic Pupil Slicing Unit (APSU) shapes the beam in order to compress it in cross-dispersion direction and with a pupil slicer splits it up into two smaller beams, while superimposing them on the Echelle grating to minimize its size. The rectangular white pupil is then re-imaged and compressed. Given the wide spectral range, a dichroic beam splitter separates the beam into the blue and red spectroscopic arms, which in turn allows to optimize each arm in terms of image quality and optical efficiency. The cross-disperser has the function of separating the dispersed spectrum in all of its spectral orders. In addition, an anamorphism is re-introduced to make the pupil square and to compress the order height
ESPRESSO User Manual
Doc. Number: ESO-319963 Doc. Version: 1.1 Released on: 2018-09-01 Page: 12 of 35
Document Classification: Public
such that the inter-order space and the signal-to-noise ratio (SNR) per pixel are both maximized. Both functions are accomplished using Volume Phase Holographic Gratings (VPHGs) mounted on prisms. The shape and size of both the pupil and fibre images are shown in Fig. 5 for various locations along the optical beam of the spectrograph. Finally, two optimised camera lens systems image the full spectrum from 380 nm to 788 nm on two large 92 mm x 92 mm CCDs with 10 μm pixels.
Fig. 4: Layout of the ESPRESSO spectrograph and its optical elements
Fig. 5: Conceptual description of pupil and fibre images at relevant locations of the spectrograph
Without such a method, the collimator beam size would have had a diameter of 40 cm and the Echelle grating would have reached a size of 180 cm x 40 cm. Instead, the actual ESPRESSO design foresees the use of an Echelle grating of ‘only’ 120 cm x 20 cm and much smaller optics (collimators, cross dispersers, etc.). This solution significantly reduces the overall costs. The drawback is that each spectral element is covered by more detector
ESPRESSO User Manual
Doc. Number: ESO-319963 Doc. Version: 1.1 Released on: 2018-09-01 Page: 13 of 35
Document Classification: Public
pixels given the two image slices and their elongated shapes on the CCDs. In order to avoid increased detector noise, heavy pixel binning is performed in the case of faint-object observations, especially in 4-UT mode. The resulting (general) spectral format covered by the blue and red chips as well as the images of the pseudo-slits on the science detectors are shown in Fig. 6.
Fig. 6: Format of the red spectrum. Centre: format of the blue spectrum. Right: zoom in on the pseudo-slit image. The latter shows the image of the target (bottom) and sky fibre (top). Each fibre is re-imaged into two slices. The image of the pseudo-slit on the science detectors, from left to right: in the standard resolution 1-UT mode, the ultra-high resolution 1-UT mode, and the medium-resolution 4-UT mode, are shown together.
2.2.2 Opto-Mechanics and Thermal Control ESPRESSO is meant to be an ultra-stable spectrograph capable of reaching RV precisions of the order of 10 cm s-1, i.e., one order of magnitude better than its predecessor, HARPS. The spectrograph is therefore built in a totally fixed configuration and for the highest thermo-mechanical stability. The spectrograph optics is mounted on a tri-dimensional optical bench specifically designed to keep the optical system within the thermo-mechanical tolerances required for high-precision RV measurements. The bench is located inside a vacuum vessel in which 10-5-mbar class vacuum is maintained during the entire duty cycle of the instrument. An overview of the opto-mechanics of the spectrograph is shown in Fig. 7. The temperature at the level of the optical system is required to be stable at the mK level in order to avoid both short-term drifts and long-term mechanical instabilities. Such an ambitious requirement is fulfilled by locating the spectrograph in a multi-shell active thermal enclosure system as depicted in Fig. 8 and Fig. 9. Each shell improves the temperature stability by a factor of 10, thus getting from typically Kelvin-level variations in the CCL down to mK stability inside the vacuum vessel and on the optical bench.
ESPRESSO User Manual
Doc. Number: ESO-319963 Doc. Version: 1.1 Released on: 2018-09-01 Page: 14 of 35
Document Classification: Public
Fig. 7: Opto-mechanics of the ESPRESSO spectrograph
Fig. 8: ESPRESSO inside the CCL, vacuum vessel and multi-shell thermal control system
ESPRESSO User Manual
Doc. Number: ESO-319963 Doc. Version: 1.1 Released on: 2018-09-01 Page: 15 of 35
Document Classification: Public
Fig. 9: ESPRESSO inside the CCL, top view
2.2.3 Scientific Detectors ESPRESSO also implements innovative solutions in the area of CCDs, their packages and cryostats. One of the world’s largest monolithic state-of-the-art CCDs was selected to properly utilize the optical field of ESPRESSO and to further improve the stability compared to a mosaic solution like, e.g., that employed in HARPS. The CCDs have been procured from the e2v supplier. The sensitive area of the e2v chip is 92 mm x 92 mm covering about 9k9 pixels of 10 µm size. Fast read-out of such a large chip is achieved by using its 16 output ports at high speed. Other requirements on the CCDs are very demanding, e.g., in terms of Charge Transfer Efficiency (CTE) and all the other parameters affecting the definition of the pixel position, which is immediately reflecting into the RV precision and accuracy. An engineering sample is shown in Fig. 10. For better stability and thermal-expansion matching, the CCD package is made of Silicon Carbide. ESPRESSO’s aimed precision of 10 cm s-1 requires measuring spectral-line position changes of 2 nm in the CCD plane, equivalent to only 4 times the silicon lattice constant. The package of the CCDs, the surrounding mechanics and precision temperature control inside the cryostat head and its cooling system, as well as the thermal stability and the homogeneous dissipation of the heat locally produced in the CCDs during operations are of critical importance. For these purposes, ESO has built a new “super-stable” cryostat and performs continuous wiping and special read-out to produce constant heat dissipation in the chips.
ESPRESSO User Manual
Doc. Number: ESO-319963 Doc. Version: 1.1 Released on: 2018-09-01 Page: 16 of 35
Document Classification: Public
Fig. 10: The first ESPRESSO e2v CCD in its just opened shipping container, handled inside the ESO cleanroom
2.2.4 The Calibration Unit The Calibration Unit provides a set of lamps to calibrate the instrument:
- A Laser-Driven-Light Source (LDLS) for order localization (profile) and spectral flat-fielding,
- A Thorium-Argon hollow-cathode lamp (ThAr) for “coarse” wavelength calibration, - A second Thorium-Argon hollow-cathode lamp for simultaneous referencing (drift
measurement) in case of failure of another spectral lamp, - A Fabry-Pérot (FP)-cavity illuminated in white light for simultaneous-reference (drift)
measurements. This spectral lamp is also used in combination with the ThAr to extend and improve the wavelength calibration,
- A Laser-Frequency Comb (LFC) covering however only the 500-720 nm wavelength range, for accurate wavelength calibration. The extension of the calibration over the full spectral range must be performed using the FP source.
The Calibration Unit provides 8 calibration beams to the FE, 2 for each FEU, i.e., one for the ‘object’ fibre and the other one for the ‘reference’ fibre. The light from any of the CU lamps can be injected into any of the fibres. The FEU injection system reproduces a calibration beam identical in diameter and F-number to the scientific beam from the telescope. In the 1-UT as well as 4-UT modes, only one of the Front-End beams will receive the calibration light. Normally, FEU-1 is used for calibrations, although no problem should arise if another FEU is selected.
ESPRESSO User Manual
Doc. Number: ESO-319963 Doc. Version: 1.1 Released on: 2018-09-01 Page: 17 of 35
Document Classification: Public
3. Observing Modes 3.1 Instrument Modes The extreme precision required by the ESPRESSO science goals is obtained by adopting and improving the well-known HARPS concepts. The light of one or several UTs is fed by means of the Front-End Unit(s) into optical fibres that scramble the light and provide excellent illumination stability to the spectrograph. In order to improve light scrambling, non-circular fibre shapes are used. The object fibre can be fed with either light from an astronomical source or one of the calibration lamps. The reference fibre receives either sky light (faint-source mode) or wavelength-calibration light (for bright sources). In the latter case - the so-called simultaneous-reference technique, also adopted in HARPS - it is possible with ESPRESSO to track instrumental drifts down to the cm s-1 level. It is assumed that in this mode the measurement is photon-noise limited and the detector read-out noise is negligible. For faint sources instead, the detector noise and sky background may be significant. In this case, the reference fibre will allow the recording of the sky background whilst a slow read-out and a high binning factor will reduce the noise on the detector. The main characteristics of each observing mode are summarized in Table 2. Parameter/Mode singleHR (1-UT) singleUHR (1-UT) multiMR (4-UT)
Wavelength range 380-788 nm 380-788 nm 380-788 nm
Resolving power (median)
140’000 190’000 70’000
Aperture on sky 1.0 arcsec 0.5 arcsec 4x1.0 arcsec
Sky subtraction Yes (no sim. ref.) Yes (no sim. ref.) Yes (no sim. ref.)
Total peak efficiency ~9% ~4% ~9%
Instrumental RV precision using sim. ref. (requirement)
<10 cm s-1 < 5 m s-1 <5 m s-1
Table 2: Summary of ESPRESSO's observing modes and performances
3.2 Detector Modes ESPRESSO has three possible observing modes: singleHR, singleUHR and multiMR. Each mode is made available with specific detector read-out properties (a.k.a. instrument configurations) optimized for low or high-SNR measurements, respectively, as given in Table 3. For high SNR measurements, 1x1 and 2x1 pixel binning is offered to benefit from the highest spectral resolution, while fast read-out is used to maximize the duty cycle (open-shutter time). Opposite, for low SNR measurements, in order to reduce the RON, high binning factors and slow read-out are required. Given the usually long exposure times on
ESPRESSO User Manual
Doc. Number: ESO-319963 Doc. Version: 1.1 Released on: 2018-09-01 Page: 18 of 35
Document Classification: Public
faint targets, the duty cycle should not be significantly impacted by the read-out time in this configuration. The active area of the detector consists of 9216 optically active pixels in the cross-dispersion direction (X) and 9232 optically active pixels in the main dispersion direction (Y). The Echelle orders are aligned along the CCD columns (Y). The detector is read out through 2x8 ports, dividing the raw frames in 2 sections along Y and 8 sections along X. Table 4 indicates the raw-frame size provided by each individual read-out port after binning. Pre- and over-scan regions are produced in a symmetric and equal way for each read-out port. The Observing Software assembles the spectrum into a single FITS file containing two raw frames composed each of 2x8 individual sub-frames aligned according to the physical layout but separated by the pre- and over-scan regions of each sub-frame. Detector mode
Table 4: Frame size provided by each individual read-out port
3.3 Instrument Configurations Several instrument configurations are available for different types of scientific goals. Table 5 below lists all the available setups: Observing mode Purpose Templates Detector Binning
SINGLE_HR11 Spectroscopy and RV monitoring of bright targets (V<10-12) with 1 UT
singleHR FAST 1x1
SINGLE_HR21 Spectroscopy and RV monitoring of fainter targets (V>10-12) with 1 UT
singleHR SLOW 2x1
SINGLE_UHR11 Very high-resolution spectroscopy with 1 UT
singleUHR FAST 1x1
MULTI_MR42 Spectroscopy of faint targets with 4 UTs
multiMR SLOW 4x2
MULTI_MR84 Spectroscopy of very faint targets with 4 UTs
multiMR SLOW 8x4
Table 5: Summary of ESPRESSO's instrument configurations
The ESPRESSO 4-UT mode is offered starting in P103 in both the MULTI_MR42 and MULTI_MR84 instrument configurations.
ESPRESSO User Manual
Doc. Number: ESO-319963 Doc. Version: 1.1 Released on: 2018-09-01 Page: 19 of 35
Document Classification: Public
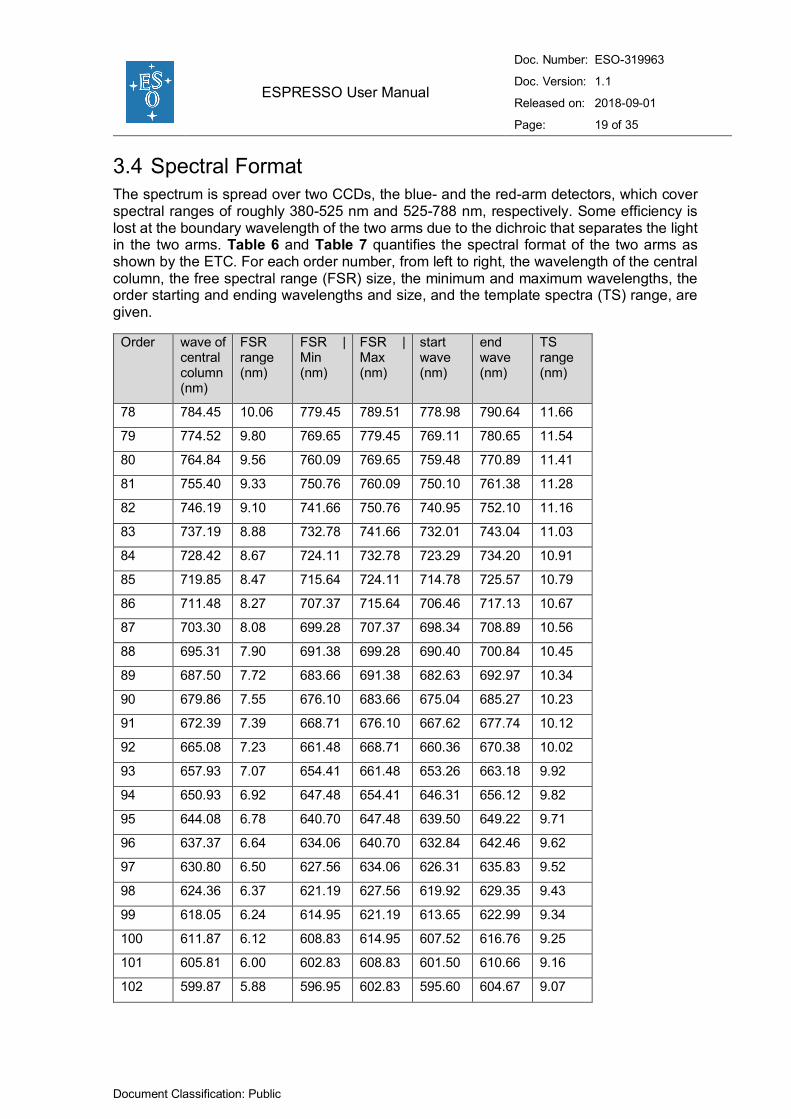
3.4 Spectral Format The spectrum is spread over two CCDs, the blue- and the red-arm detectors, which cover spectral ranges of roughly 380-525 nm and 525-788 nm, respectively. Some efficiency is lost at the boundary wavelength of the two arms due to the dichroic that separates the light in the two arms. Table 6 and Table 7 quantifies the spectral format of the two arms as shown by the ETC. For each order number, from left to right, the wavelength of the central column, the free spectral range (FSR) size, the minimum and maximum wavelengths, the order starting and ending wavelengths and size, and the template spectra (TS) range, are given.
Order wave of central column (nm)
FSR range (nm)
FSR | Min (nm)
FSR | Max (nm)
start wave (nm)
end wave (nm)
TS range (nm)
78 784.45 10.06 779.45 789.51 778.98 790.64 11.66
79 774.52 9.80 769.65 779.45 769.11 780.65 11.54
80 764.84 9.56 760.09 769.65 759.48 770.89 11.41
81 755.40 9.33 750.76 760.09 750.10 761.38 11.28
82 746.19 9.10 741.66 750.76 740.95 752.10 11.16
83 737.19 8.88 732.78 741.66 732.01 743.04 11.03
84 728.42 8.67 724.11 732.78 723.29 734.20 10.91
85 719.85 8.47 715.64 724.11 714.78 725.57 10.79
86 711.48 8.27 707.37 715.64 706.46 717.13 10.67
87 703.30 8.08 699.28 707.37 698.34 708.89 10.56
88 695.31 7.90 691.38 699.28 690.40 700.84 10.45
89 687.50 7.72 683.66 691.38 682.63 692.97 10.34
90 679.86 7.55 676.10 683.66 675.04 685.27 10.23
91 672.39 7.39 668.71 676.10 667.62 677.74 10.12
92 665.08 7.23 661.48 668.71 660.36 670.38 10.02
93 657.93 7.07 654.41 661.48 653.26 663.18 9.92
94 650.93 6.92 647.48 654.41 646.31 656.12 9.82
95 644.08 6.78 640.70 647.48 639.50 649.22 9.71
96 637.37 6.64 634.06 640.70 632.84 642.46 9.62
97 630.80 6.50 627.56 634.06 626.31 635.83 9.52
98 624.36 6.37 621.19 627.56 619.92 629.35 9.43
99 618.05 6.24 614.95 621.19 613.65 622.99 9.34
100 611.87 6.12 608.83 614.95 607.52 616.76 9.25
101 605.81 6.00 602.83 608.83 601.50 610.66 9.16
102 599.87 5.88 596.95 602.83 595.60 604.67 9.07
ESPRESSO User Manual
Doc. Number: ESO-319963 Doc. Version: 1.1 Released on: 2018-09-01 Page: 20 of 35
Document Classification: Public
103 594.05 5.77 591.18 596.95 589.82 598.80 8.99
104 588.34 5.66 585.52 591.18 584.14 593.05 8.90
105 582.74 5.55 579.97 585.52 578.58 587.40 8.82
106 577.24 5.45 574.53 579.97 573.12 581.86 8.74
107 571.84 5.34 569.18 574.53 567.76 576.42 8.66
108 566.55 5.25 563.94 569.18 562.50 571.08 8.58
109 561.35 5.15 558.79 563.94 557.34 565.85 8.51
110 556.25 5.06 553.73 558.79 552.27 560.71 8.43
111 551.24 4.97 548.76 553.73 547.30 555.65 8.36
112 546.31 4.88 543.89 548.76 542.41 550.69 8.29
113 541.48 4.79 539.09 543.89 537.61 545.82 8.22
114 536.73 4.71 534.39 539.09 532.89 541.03 8.15
115 532.06 4.63 529.76 534.39 528.25 536.33 8.08
116 527.48 4.55 525.21 529.76 523.70 531.71 8.01
117 522.97 4.47 520.74 525.21 519.22 527.16 7.94
Table 6: Spectral format of ESPRESSO's red-arm CCD
Order
wave of central column (nm)
FSR range (nm)
FSR | Min (nm)
FSR | Max (nm)
start wave (nm)
end wave (nm)
TS range (nm)
117 522.97 4.47 520.74 525.21 519.13 527.03 7.89
118 518.54 4.39 516.35 520.74 514.72 522.57 7.84
119 514.18 4.32 512.03 516.35 510.39 518.18 7.79
120 509.89 4.25 507.78 512.03 506.13 513.87 7.74
121 505.68 4.18 503.60 507.78 501.94 509.63 7.69
122 501.53 4.11 499.49 503.60 497.82 505.45 7.64
123 497.46 4.04 495.44 499.49 493.76 501.35 7.58
124 493.44 3.98 491.46 495.44 489.78 497.31 7.53
125 489.50 3.92 487.55 491.46 485.85 493.33 7.48
126 485.61 3.85 483.69 487.55 481.99 489.42 7.43
127 481.79 3.79 479.90 483.69 478.19 485.57 7.38
128 478.02 3.73 476.16 479.90 474.45 481.78 7.33
129 474.32 3.68 472.49 476.16 470.77 478.05 7.28
130 470.67 3.62 468.87 472.49 467.15 474.38 7.23
131 467.08 3.57 465.30 468.87 463.57 470.76 7.18
132 463.54 3.51 461.79 465.30 460.06 467.19 7.13
133 460.05 3.46 458.33 461.79 456.60 463.68 7.08
ESPRESSO User Manual
Doc. Number: ESO-319963 Doc. Version: 1.1 Released on: 2018-09-01 Page: 21 of 35
Document Classification: Public
134 456.62 3.41 454.92 458.33 453.19 460.22 7.04
135 453.24 3.36 451.57 454.92 449.83 456.82 6.99
136 449.91 3.31 448.26 451.57 446.52 453.46 6.94
137 446.62 3.26 445.00 448.26 443.26 450.15 6.90
138 443.39 3.21 441.78 445.00 440.04 446.89 6.85
139 440.20 3.17 438.62 441.78 436.87 443.68 6.81
140 437.05 3.12 435.50 438.62 433.75 440.51 6.76
141 433.95 3.08 432.42 435.50 430.67 437.39 6.72
142 430.90 3.03 429.38 432.42 427.64 434.31 6.67
143 427.88 2.99 426.39 429.38 424.64 431.27 6.63
144 424.91 2.95 423.44 426.39 421.69 428.28 6.59
145 421.98 2.91 420.53 423.44 418.78 425.33 6.55
146 419.09 2.87 417.66 420.53 415.91 422.42 6.50
147 416.24 2.83 414.83 417.66 413.08 419.54 6.46
148 413.43 2.79 412.03 414.83 410.29 416.71 6.42
149 410.65 2.76 409.28 412.03 407.53 413.91 6.38
150 407.91 2.72 406.56 409.28 404.82 411.15 6.34
151 405.21 2.68 403.88 406.56 402.13 408.43 6.30
152 402.55 2.65 401.23 403.88 399.48 405.75 6.26
153 399.92 2.61 398.61 401.23 396.87 403.10 6.22
154 397.32 2.58 396.03 398.61 394.30 400.48 6.18
155 394.76 2.55 393.49 396.03 391.75 397.90 6.15
156 392.23 2.51 390.97 393.49 389.24 395.35 6.11
157 389.73 2.48 388.49 390.97 386.76 392.83 6.07
158 387.26 2.45 386.04 388.49 384.31 390.34 6.03
159 384.83 2.42 383.62 386.04 381.89 387.89 6.00
160 382.42 2.39 381.23 383.62 379.50 385.47 5.96
161 380.04 2.36 378.87 381.23 377.15 383.07 5.93
Table 7: Spectral format of ESPRESSO's blue-arm CCD
ESPRESSO User Manual
Doc. Number: ESO-319963 Doc. Version: 1.1 Released on: 2018-09-01 Page: 22 of 35
Document Classification: Public
4. Performances and Characteristics 4.1 Efficiency and RV Precision The efficiency of a spectrograph critically depends on the ambient seeing conditions. We refer the reader to the ETC for detailed explanations and the calculation of slit losses. The total efficiency of ESPRESSO also depends on the entrance of the chosen fibre diameter. Similar efficiencies are expected for the HR and MR modes as they both use 1-arcsec fibres, while the UHR mode is expected to be more than a factor of 2 lower in efficiency due to its 0.5-arcsec fibre, especially under poor seeing conditions. In Fig. 11 and Fig. 12, we show the computed efficiency of ESPRESSO for the HR (and MR) mode and the UHR mode, respectively. The calculation was performed assuming a seeing of 0.8 arcsec. Given the sensitivity of the efficiency upon the astro-climatic conditions, we recommend to adopt a conservative approach.
Fig. 11: Efficiency of ESPRESSO incl. slit losses and atmospheric transmission in HR (and MR) mode for the blue (top) and red arm (bottom). A seeing of 0.8 arcsec and an airmass of 1 are assumed.
ESPRESSO User Manual
Doc. Number: ESO-319963 Doc. Version: 1.1 Released on: 2018-09-01 Page: 23 of 35
Document Classification: Public
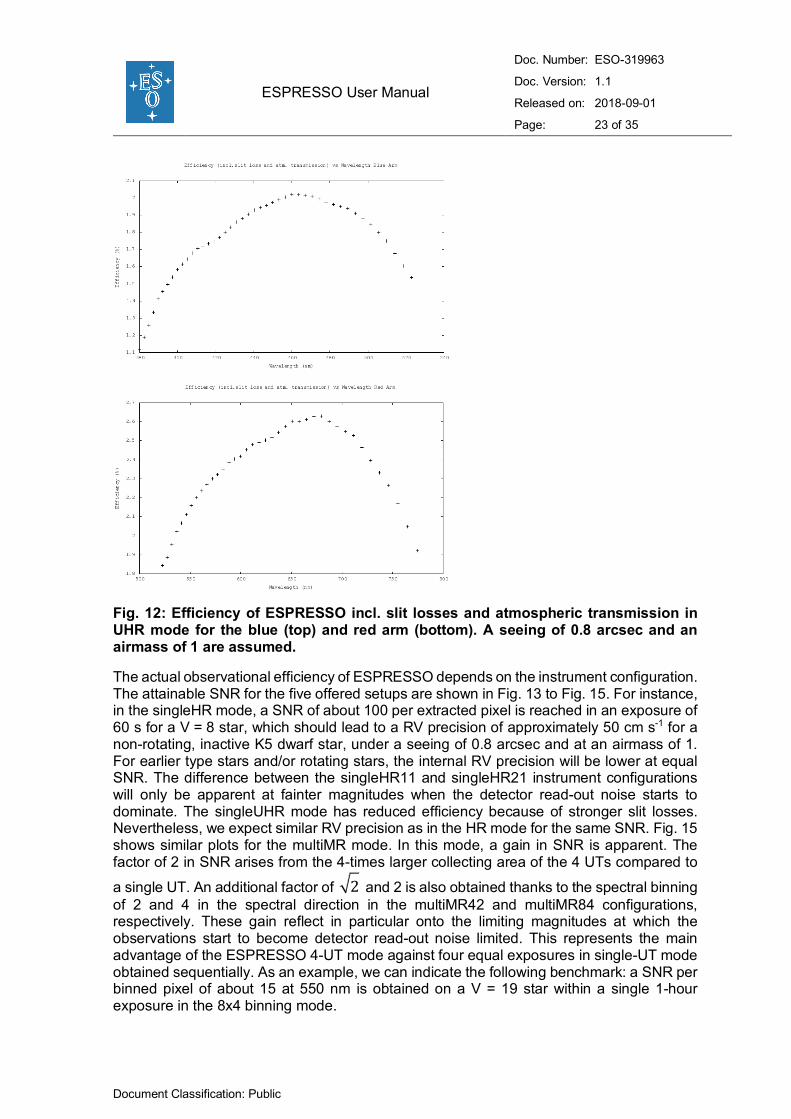
Fig. 12: Efficiency of ESPRESSO incl. slit losses and atmospheric transmission in UHR mode for the blue (top) and red arm (bottom). A seeing of 0.8 arcsec and an airmass of 1 are assumed.
The actual observational efficiency of ESPRESSO depends on the instrument configuration. The attainable SNR for the five offered setups are shown in Fig. 13 to Fig. 15. For instance, in the singleHR mode, a SNR of about 100 per extracted pixel is reached in an exposure of 60 s for a V = 8 star, which should lead to a RV precision of approximately 50 cm s-1 for a non-rotating, inactive K5 dwarf star, under a seeing of 0.8 arcsec and at an airmass of 1. For earlier type stars and/or rotating stars, the internal RV precision will be lower at equal SNR. The difference between the singleHR11 and singleHR21 instrument configurations will only be apparent at fainter magnitudes when the detector read-out noise starts to dominate. The singleUHR mode has reduced efficiency because of stronger slit losses. Nevertheless, we expect similar RV precision as in the HR mode for the same SNR. Fig. 15 shows similar plots for the multiMR mode. In this mode, a gain in SNR is apparent. The factor of 2 in SNR arises from the 4-times larger collecting area of the 4 UTs compared to
a single UT. An additional factor of and 2 is also obtained thanks to the spectral binning of 2 and 4 in the spectral direction in the multiMR42 and multiMR84 configurations, respectively. These gain reflect in particular onto the limiting magnitudes at which the observations start to become detector read-out noise limited. This represents the main advantage of the ESPRESSO 4-UT mode against four equal exposures in single-UT mode obtained sequentially. As an example, we can indicate the following benchmark: a SNR per binned pixel of about 15 at 550 nm is obtained on a V = 19 star within a single 1-hour exposure in the 8x4 binning mode.
2
ESPRESSO User Manual
Doc. Number: ESO-319963 Doc. Version: 1.1 Released on: 2018-09-01 Page: 24 of 35
Document Classification: Public
Fig. 13: Left: SNR vs. stellar magnitude obtained in the singleHR11 mode for exposure times of 60s (pink), 1200s (blue) and 3600s (red). The slope change defines the magnitude at which the measurement becomes detector read-out noise limited. SNR for 10 cm s-1 and 100 cm s-1 are shown. The values are rough estimates for slowly-rotating, inactive late-G or K dwarf stars, calculated for a seeing of 0.8 arcsec and an airmass of 1. Right: same but for the singleHR21 mode.
Fig. 14: Same as Fig. 13 but for the singleUHR11 mode
Fig. 15: Left: SNR vs. stellar magnitude obtained in the multiMR42 mode for exposure times of 60s (pink), 1200s (blue) and 3600s (red). The slope change defines the magnitude at which the measurement becomes detector read-out noise limited. Right: same but for the multiMR84 mode.
ESPRESSO User Manual
Doc. Number: ESO-319963 Doc. Version: 1.1 Released on: 2018-09-01 Page: 25 of 35
Document Classification: Public
Commissioning tests have demonstrated the extreme RV precision of ESPRESSO. The instrument can reach (photon-noise) uncertainties at the level of 10 cm s-1 in photon-noise-limited (i.e., high SNR) spectra of G-type stars. This precision is UT- and FE-independent at the level allowed by intrinsic stellar variability of a few tens of cm s-1. Different instrument configurations (see Sect. 3.3) show systematic RV offsets between one another, which is expected due to the properties of each setup (i.e., different spectral resolution and/or binning). The following RV offsets have been measured for solar-type stars: HR11-HR21~2.2 m s-1, UHR-HR21~18 m s-1 and MR42-HR21~-18.5 m s-1. The actual offsets will depend on the characteristics of the target so that the numbers given here should only be considered as illustrative. The bottom line is that the user is recommended to stick to the same observing mode to tackle a given science case (i.e., for a given target and science goal). The maximum RV span between the different instrument configurations is an indication that the RV accuracy of ESPRESSO all modes together is of the order of 50 m s-1. The RV precision of ESPRESSO within a given instrument configuration is much higher than that: from long sequences of observations in the HR mode, it has been shown during commissioning that a precision better than 15 cm s-1 is achieved in the short term (i.e., within one night). In the MR mode, a precision better than 1 m s-1 can be achieved over a few hours.
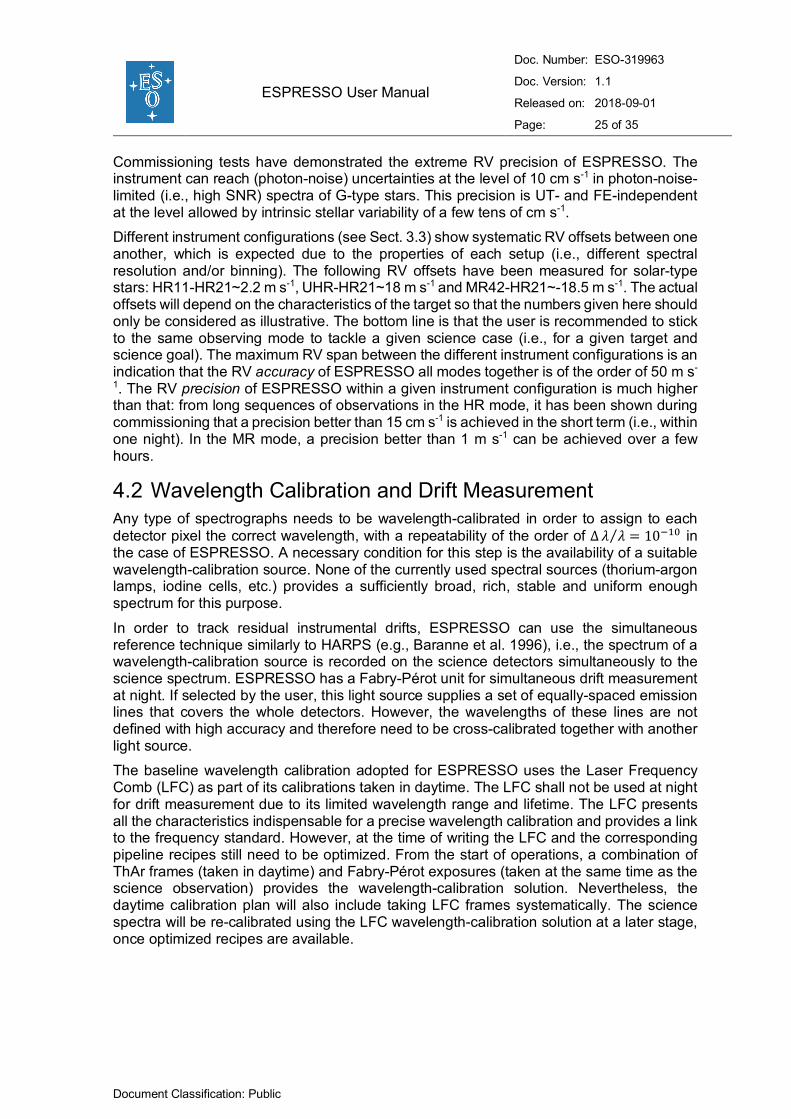
4.2 Wavelength Calibration and Drift Measurement Any type of spectrographs needs to be wavelength-calibrated in order to assign to each detector pixel the correct wavelength, with a repeatability of the order of ∆𝜆 𝜆⁄ = 10'() in the case of ESPRESSO. A necessary condition for this step is the availability of a suitable wavelength-calibration source. None of the currently used spectral sources (thorium-argon lamps, iodine cells, etc.) provides a sufficiently broad, rich, stable and uniform enough spectrum for this purpose. In order to track residual instrumental drifts, ESPRESSO can use the simultaneous reference technique similarly to HARPS (e.g., Baranne et al. 1996), i.e., the spectrum of a wavelength-calibration source is recorded on the science detectors simultaneously to the science spectrum. ESPRESSO has a Fabry-Pérot unit for simultaneous drift measurement at night. If selected by the user, this light source supplies a set of equally-spaced emission lines that covers the whole detectors. However, the wavelengths of these lines are not defined with high accuracy and therefore need to be cross-calibrated together with another light source. The baseline wavelength calibration adopted for ESPRESSO uses the Laser Frequency Comb (LFC) as part of its calibrations taken in daytime. The LFC shall not be used at night for drift measurement due to its limited wavelength range and lifetime. The LFC presents all the characteristics indispensable for a precise wavelength calibration and provides a link to the frequency standard. However, at the time of writing the LFC and the corresponding pipeline recipes still need to be optimized. From the start of operations, a combination of ThAr frames (taken in daytime) and Fabry-Pérot exposures (taken at the same time as the science observation) provides the wavelength-calibration solution. Nevertheless, the daytime calibration plan will also include taking LFC frames systematically. The science spectra will be re-calibrated using the LFC wavelength-calibration solution at a later stage, once optimized recipes are available.
ESPRESSO User Manual
Doc. Number: ESO-319963 Doc. Version: 1.1 Released on: 2018-09-01 Page: 26 of 35
Document Classification: Public
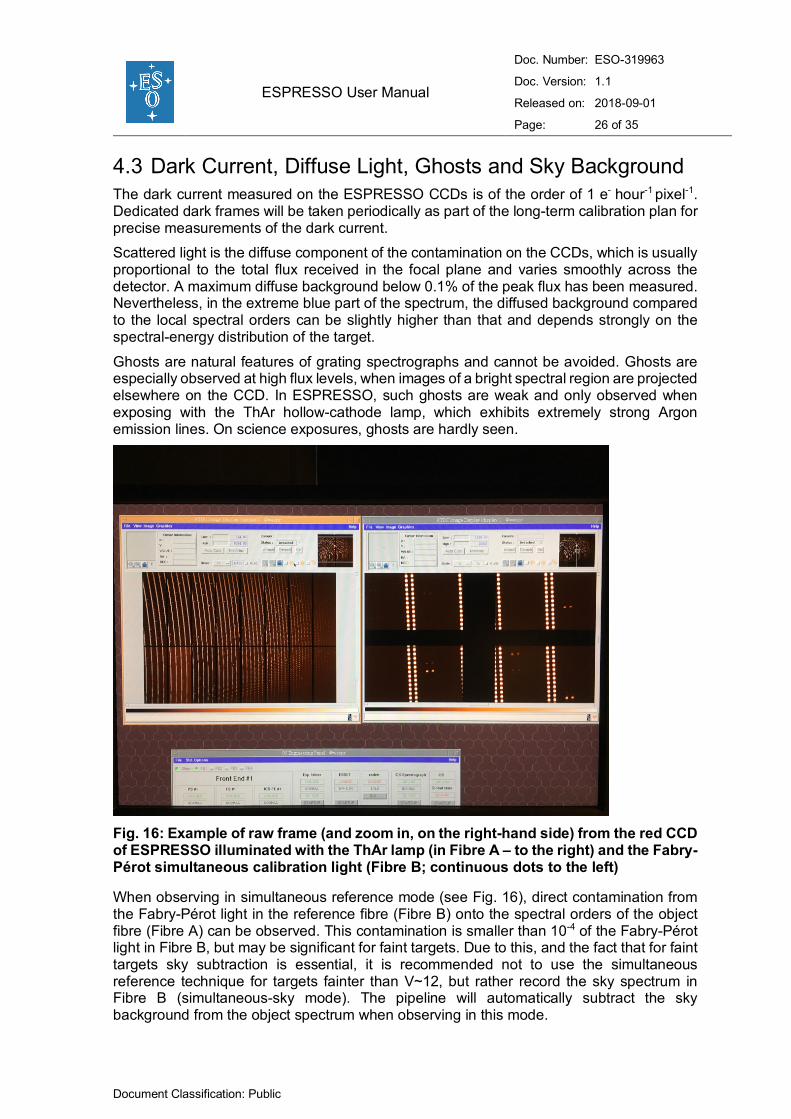
4.3 Dark Current, Diffuse Light, Ghosts and Sky Background The dark current measured on the ESPRESSO CCDs is of the order of 1 e- hour-1 pixel-1. Dedicated dark frames will be taken periodically as part of the long-term calibration plan for precise measurements of the dark current. Scattered light is the diffuse component of the contamination on the CCDs, which is usually proportional to the total flux received in the focal plane and varies smoothly across the detector. A maximum diffuse background below 0.1% of the peak flux has been measured. Nevertheless, in the extreme blue part of the spectrum, the diffused background compared to the local spectral orders can be slightly higher than that and depends strongly on the spectral-energy distribution of the target. Ghosts are natural features of grating spectrographs and cannot be avoided. Ghosts are especially observed at high flux levels, when images of a bright spectral region are projected elsewhere on the CCD. In ESPRESSO, such ghosts are weak and only observed when exposing with the ThAr hollow-cathode lamp, which exhibits extremely strong Argon emission lines. On science exposures, ghosts are hardly seen.
Fig. 16: Example of raw frame (and zoom in, on the right-hand side) from the red CCD of ESPRESSO illuminated with the ThAr lamp (in Fibre A – to the right) and the Fabry-Pérot simultaneous calibration light (Fibre B;; continuous dots to the left)
When observing in simultaneous reference mode (see Fig. 16), direct contamination from the Fabry-Pérot light in the reference fibre (Fibre B) onto the spectral orders of the object fibre (Fibre A) can be observed. This contamination is smaller than 10-4 of the Fabry-Pérot light in Fibre B, but may be significant for faint targets. Due to this, and the fact that for faint targets sky subtraction is essential, it is recommended not to use the simultaneous reference technique for targets fainter than V~12, but rather record the sky spectrum in Fibre B (simultaneous-sky mode). The pipeline will automatically subtract the sky background from the object spectrum when observing in this mode.
ESPRESSO User Manual
Doc. Number: ESO-319963 Doc. Version: 1.1 Released on: 2018-09-01 Page: 27 of 35
Document Classification: Public
5. Observing with ESPRESSO From the operational point-of-view, ESPRESSO is a relatively simple instrument, with a fixed spectral format and five well-defined instrument configurations to select from, depending on the user science cases (see Table 5). Since Period 102, ESPRESSO is offered for regular operations in 1-UT mode in both of its HR configurations (1x1 and 2x1 binning) as well as in UHR mode (1x1 binning). The 4-UT mode of ESPRESSO and its Medium Resolution (MR) configurations (4x2 and 8x4 binning) are offered for regular operations starting in Period 103. Once the instrument configuration is defined, the only remaining choice for the user relates to the nature of the light source illuminating Fibre B. The available options are: DARK, reference source (i.e., Fabry-Pérot or ThAr lamp), and SKY. The FP source must be used if the highest RV precision is required. The ThAr lamp is made available at night only in case of a failure of the FP. On faint targets (V>12), due to the contamination of the science spectrum by the simultaneous reference source (<10-4), the importance of sky-background subtraction, and the fact that the RV precision will be dominated by photon noise, it is recommended not to use the simultaneous reference source, but rather to record the sky spectrum in Fibre B. For the object spectrum in Fibre A, ThAr and LFC frames are taken in daytime to provide the absolute wavelength calibration. Alike any other ESO instruments, observations with ESPRESSO are aided by a set of tools such as p2/vOT and the ETC.
5.1 Preparing the Observations 5.1.1 Exposure Time Calculator The entry point to the ESO Exposure Time Calculator (ETC) is: http://www.eso.org/observing/etc which links to the ETCs of each of the La Silla/Paranal instruments. The user fills in an HTML/JavaScript input form, submits the parameters to the calculation engine on the server side, which in turn gives the results of the model in both typographic and graphic forms. All ESO Echelle spectrographs are supported by the same model, described here: http://www.eso.org/observing/etc/doc/helpuves.html. The ESPRESSO-specific ETC is available at: http://www.eso.org/observing/etc/bin/gen/form?INS.NAME=ESPRESSO+INS.MODE=spectro. The input form includes the following sections: 1 Target brightness, spectral and spatial distributions
- The brightness can be given in the Vega system or as AB magnitude, - The spectral-energy distribution can be given in the form of a stellar template, a
black-body spectrum, a power-law, or a single emission line. The user can also upload a custom spectrum.
2 Sky background, including moon phase and airmass - The sky background is based on the Cerro Paranal advanced sky model described
Doc. Number: ESO-319963 Doc. Version: 1.1 Released on: 2018-09-01 Page: 28 of 35
Document Classification: Public
_Model.pdf - The user can input a seeing value @550nm @zenith and the calculator will provide
the corresponding Image Quality (or the other way around) using a PSF model of the atmosphere, telescope and instrument (see: http://www.eso.org/observing/etc/doc/helpuves.html#seeing for details). An estimate of the probability of realization of the requested seeing is also given dynamically.
3 Instrument configuration and number of UT telescopes feeding the instrument (either 1 or 4)
- The spectral resolution and detector mode (depends dynamically on the chosen number of UTs),
- The exposure time per detector integration. 4 Optional outputs
- Output from the ETC includes a summary of the input configuration and results are given in two tables, one for each detector.
5.1.2 Phase 2 During Phase 2, the successful applicant prepares their instrument set-ups and observing strategy through the elaboration of so-called Observation Blocks and related material. Together with the Phase 2 documentation: http://www.eso.org/sci/observing/phase2/SMGuidelines.ESPRESSO.html and the ESPRESSO template manual (available from: http://www.eso.org/sci/facilities/paranal/instruments/espresso/doc.html), the information contained in this section provides a guideline for the Phase 2 preparation process for ESPRESSO observations. Observation Blocks An Observation Block (OB) for a typical science observation with ESPRESSO consists of one acquisition template and one observation template. Both templates need to use the same instrument mode (e.g., one of singleHR or singleUHR). It is possible to include several observation templates within a given OB to use different binning modes in the singleHR mode (1x1_FAST and 2x1_SLOW) although normally only one of the binning options should be used due to the existence of a RV offset of ~2 m s-1 between the two modes. The instrument-specific comment field of the OB shall include the expected SNR at a wavelength of 550 nm, as reported by the ETC. Main choices in the templates The available templates, their parameters and options are described in detail in the ESPRESSO template manual (available from http://www.eso.org/sci/facilities/paranal/instruments/espresso/doc.html). Here, we describe the main choices that have to be made during Phase 2. We also guide through the different options. Instrument mode (singleHR vs. singleUHR) This choice has already been made in the Phase 1 proposal. The median measured resolving power of the singleHR mode is 140’000 while the singleUHR mode yields R =
ESPRESSO User Manual
Doc. Number: ESO-319963 Doc. Version: 1.1 Released on: 2018-09-01 Page: 29 of 35
Document Classification: Public
190’000. The singleUHR mode should be used if the highest spectral resolution is needed for your science case. However, the UHR mode gives a lower SNR and a lower RV precision compared to the HR mode. As a result, if a high SNR or a high RV precision is important for your science case and the highest spectral resolution is not needed, the singleHR mode should be preferred. Detailed calculations should be performed with the ETC. Binning modes for the singleHR mode (1x1_FAST vs. 2x1_SLOW) Generally, the 1x1_FAST mode is used for relatively bright targets (V<10-12), while the 2x1_SLOW mode is used for fainter targets (V>10-12). Detailed calculations should be performed with the ETC. High-precision RV observations may preferentially be better executed with the 1x1_FAST setting. In any case, it is recommended to use only one of the two binning options and to stick to it for the observations of a given target due to a RV offset of ~2 m s-1 between the two modes. Source on Fibre B While the complete set of options includes: DARK / SKY / THAR / FPCS, the standard options are SKY or FPCS. The Fabry-Pérot calibration source (FPCS) is used for relatively bright targets and RV studies. The SKY option is used for fainter targets for which a sky subtraction is required and for which a contamination from the FPCS light needs to be avoided. The DARK option can be chosen in case of crowded fields or extended objects for which the SKY option might introduce contamination from another source in the field. With the DARK option, the entrance to Fibre B is blocked. The THAR source should normally not be used at night. It is only available in case of a failure of the FP. Calibration associated to Fibre A One can choose either ThAr or LFC frames to provide the absolute wavelength calibration during data reduction. This choice only refers to the online data reduction performed at the telescope. Both sets of daytime calibrations will be taken for the sake of offline data processing and analysis. Finding Charts The unobstructed Field-of-View for the target acquisition has a radius of 17 arcsec. Finding charts should display a field of 30x30 arcsec in the V band. The distance between Fibre A and Fibre B is 7.5 arcsec on sky. Due to the field rotation, Fibre B will move around the position of Fibre A while observing. Limiting magnitude for acquisition Acquisition has succeeded with sources of V magnitudes as faint as 20 to 21 in dark sky. Fainter targets can be acquired using a blind offset.
5.1.3 The Effect of Precipitable Water Vapour Precipitable Water Vapour (PWV) is the amount of water in gaseous form along a given column in the Earth atmosphere. Measured as a depth, it corresponds to the value one would measure if all the water in that column would be precipitated in rain. By knowing the PWV value during an observation as well as several other physical parameters, such as site altitude, temperature vertical profile, and humidity vertical profile, one can estimate the transmission spectra of water at any given wavelength. This predicting ability has been used
ESPRESSO User Manual
Doc. Number: ESO-319963 Doc. Version: 1.1 Released on: 2018-09-01 Page: 30 of 35
Document Classification: Public
extensively to measure and correct near-IR spectra, where water absorption band lines are deep and numerous. In the ESPRESSO wavelength range, there are three main telluric absorption species: O2, OH and H2O. Of these, water vapour is the one that affects the largest wavelength range. Its effects are not as pronounced as in the near-IR, but may have an impact on specific science cases. For reference, the median Paranal PWV value is 2.5 mm, ranging between 0.5 mm and 20 mm in extremely favourable (dry) and unfavourable conditions (humid), respectively. For wavelengths shorter than 700 nm, water absorption is observed to be at the percent level if the PWV value is 2.5 mm or lower, while for higher PWV values the depth of the water lines can reach up to 10%. On the other hand, the 700-800 nm wavelength range is strongly affected by water absorption, with numerous deep lines that can have an impact on the observations even in low PWV conditions. The user is referred to Querel, Naylor & Kerber (2011, PASP, 123, 222) and Kerber et al. (2014, MNRAS, 439, 247) for more information. If aiming at a high-spectral fidelity, the user should estimate the impact of the water vapour on the lines or wavelength ranges of interest. To this end, ESO provides two public tools;; the SkyCalc Sky Model Calculator: https://www.eso.org/observing/etc/bin/gen/form?INS.MODE=swspectr+INS.NAME=SKYCALC which allows to measure the impact of the PWV and other observing conditions based on the Cerro Paranal Sky Model (Noll et al., 2012, A&A, 543, A92;; Jones et al., 2013, A&A, 560, A91), and Molecfit (Smette et al., 2015, A&A, 576, A77): https://www.eso.org/sci/software/pipelines/skytools/molecfit which corrects astronomical observations for telluric absorption features, based on fitting synthetic transmission spectra calculated through a radiative transfer code. Users interested in spectral regions affected by deep telluric lines in the 700-800 nm domain may request a specific constraint on the PWV when preparing their OBs at Phase 2.
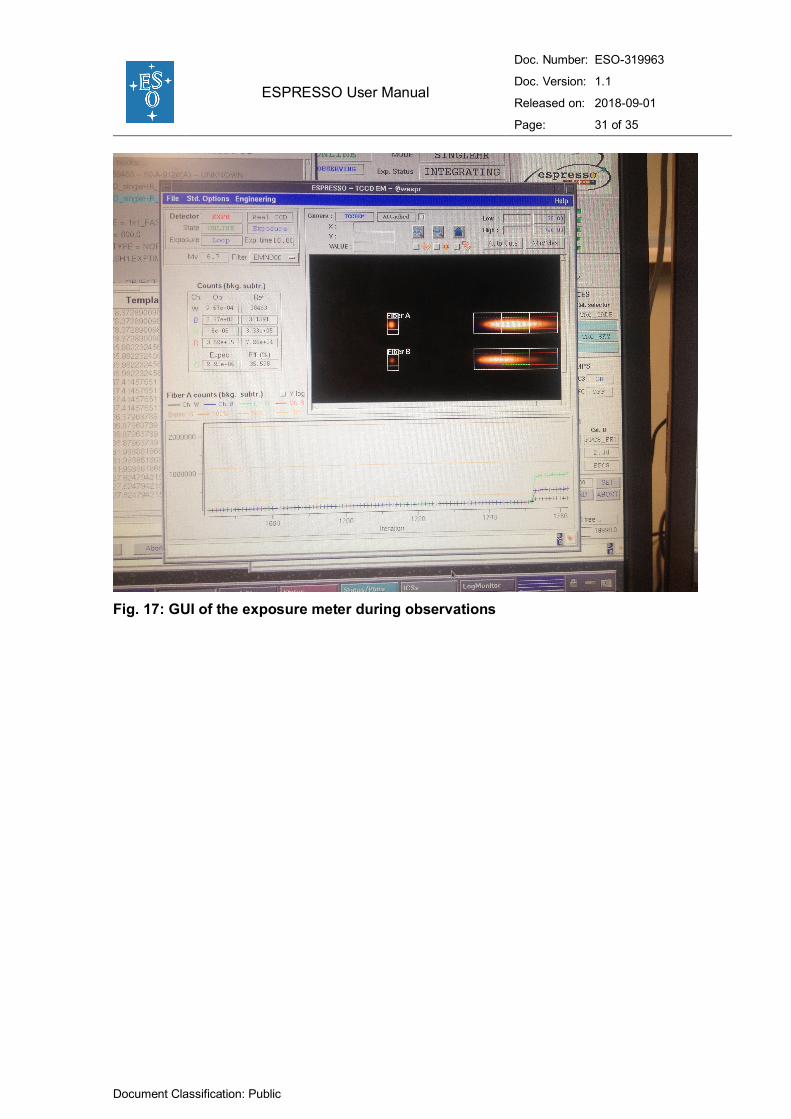
5.2 Observing: the Exposure Meter The spectrograph is equipped with an advanced Exposure Meter that measures the flux entering the spectrograph as a function of time. This function is necessary to calculate the flux-weighted mean exposure time at which the precise relative Earth motion must be subtracted from the RV measurement. The design is based on a simple diffraction grating and allows a flux measurement and a RV correction in different spectral channels in order to cope with possible chromatic effects. The use of several channels also provides a redundant, and thus more reliable, evaluation of the mean exposure time. In Fig. 17, we show the Exposure Meter graphical user interface (GUI). The zero (‘white’ channel) and first order of the dispersed light entering the spectrograph are visible (here in HR mode;; the relative positions of the UHR and MR modes are slightly displaced laterally). The lower spectrum shows the simultaneous reference or sky light in Fibre B. The instantaneous count rates in each channel are shown. For the ‘green’ channel, the expected count rate and the relative efficiency are also given. The efficiency and flux-weighted mean exposure time are stored in the FITS header of the scientific images, however only for the ‘green’ channel.
ESPRESSO User Manual
Doc. Number: ESO-319963 Doc. Version: 1.1 Released on: 2018-09-01 Page: 31 of 35
Document Classification: Public
Fig. 17: GUI of the exposure meter during observations
ESPRESSO User Manual
Doc. Number: ESO-319963 Doc. Version: 1.1 Released on: 2018-09-01 Page: 32 of 35
Document Classification: Public
6. Calibration Plan Starting in Period 103, ESPRESSO is offered in all five instrument configurations: singleHR11, singleHR21, singleUHR11, multiMR42 and multiMR84. Each of these produces its own, complete set of calibrations, and can therefore be thought of as a standalone instrument. Science data in any configuration can be fully calibrated with a set of 11 different exposure types (see below). When processed by the ESPRESSO pipeline, each type of calibration frames generates a number of high-level Quality Control (QC1) parameters for instrument monitoring purposes. The extreme precision and accuracy aimed for ESPRESSO can only be guaranteed if a full set of standard calibrations is obtained and passes quality control within 24 hours of any science observation. This 24-hour requirement is set by considering the probable timescales of instrument instabilities, partly based on the HARPS experience. An example is the localization of spectral orders on the detector, which is fixed by the calibrations and used for extraction of the science spectrum without further adjustment. Another example is the drift of the wavelength calibration, which is not all measured in simultaneous reference mode and should be kept below ~1 m s-1. The average drift is measured in simultaneous reference mode, but complex distortions of the wavelength scale must be avoided, which also applies to calibrations taken close in time to the science data. Standard calibrations in both singleHR modes are executed every day, whether or not science data or exposures used for instrument monitoring on sky are taken. Besides providing a full set of calibrations in these modes, these daily exposures are used for instrument health check. Standard calibrations for singleUHR and multiMR configurations will be executed within 24 hours of any science observations performed in these modes. Long-term calibrations have to be executed less frequently, typically once per month or less. In principle, these must be executed for all supported instrument configurations. Table 8 gives details on the ESPRESSO standard calibration plan. Calibration type Frequency # of frames Comments
Detector bias Daily for both singleHR modes;; within 24 hours of science for singleUHR and multiMR.
10 Bias frames to measure over-scan, bias level and read-out noise.
Order definition Daily for both singleHR modes;; within 24 hours of science for singleUHR and multiMR.
2 (1 per fibre) Continuum-source spectra on both science and reference fibres to trace order/slice positions.
Flat-field, blaze and order profile
Daily for both singleHR modes;; within 24 hours of science for singleUHR and multiMR.
20 (10 per fibre) Continuum-source spectra on both science and reference fibres to measure spectral flat-field, blaze function and order profile in cross-dispersion direction.
Wavelength calibration
Daily for both singleHR modes;; within 24 hours of science for singleUHR and multiMR.
2 per setup Lamp setups for the two fibres: FP_FP, THAR_FP, FP_THAR, LFC_FP, FP_LFC, THAR_THAR.
ESPRESSO User Manual
Doc. Number: ESO-319963 Doc. Version: 1.1 Released on: 2018-09-01 Page: 33 of 35
Document Classification: Public
Contamination by simultaneous reference
Daily for both singleHR modes;; within 24 hours of science for singleUHR and multiMR.
1 Depends on which source is used for the drift measurement. FP is used as baseline since P102:
Fibre A: CONTAM (no light)
Fibre B: FP
Detector dark current
Monthly for all modes 5 (x 3600s) Dark frames to measure average dark current and create hot-pixel mask.
Detector flat-field and gain
Quarterly for all modes 15 (3 x 5 different exposure times)
Detector LED flat-field frames to measure gain and create bad-pixel map.
Detector linearity
Quarterly for both singleHR modes
20 (2 x 10 different exposure times)
Sequence of frames with FP source on both fibres with different exposure times.
Fibre-to-fibre relative efficiency
Monthly for both singleHR modes and singleUHR;; multiMR when in 4-UT mode only (VM).
1 Blue-sky observations with both fibres to measure relative fibre efficiency:
Fibre A: SKY
Fibre B: SKY
Spectro-photometric calibration
Monthly for singleHR11 and singleUHR;; multiMR when in 4-UT mode only (VM).
1 Observation of a spectro-photometric standard star to measure absolute efficiency on any UT:
Fibre A: spectro-photometric standard star
Fibre B: SKY
Table 8: ESPRESSO standard calibration plan
The execution of standard calibration sequences and long-term calibrations from the ESPRESSO calibration plan is under the responsibility of Paranal Science Operations. OBs for any additional day or night-time calibrations beyond the ESPRESSO calibration plan should be prepared by the user (and only these). Telescope time for any additional on-sky calibrations should be included in the total time allocation of the programme.
ESPRESSO User Manual
Doc. Number: ESO-319963 Doc. Version: 1.1 Released on: 2018-09-01 Page: 34 of 35
Document Classification: Public
7. End-to-End Operations 7.1 Data Flow ESPRESSO has been conceived from the beginning to provide the observer at the telescope with scientific data as complete and accurate as possible within a short time after the end of an exposure, so as to increase the overall efficiency and scientific output of the instrument. For this purpose, a software-cycle integrated view, from the preparation of the observations to the data reduction and analysis has been adopted. Coupled with a careful design, it also ensures optimal compatibility and easiness of operations and maintenance within the existing ESO Paranal Data Flow infrastructure both in service and in visitor mode. The ESPRESSO Data Flow System (DFS) includes the following main components:
- ESO’s p2 tool for Phase-2 preparation,
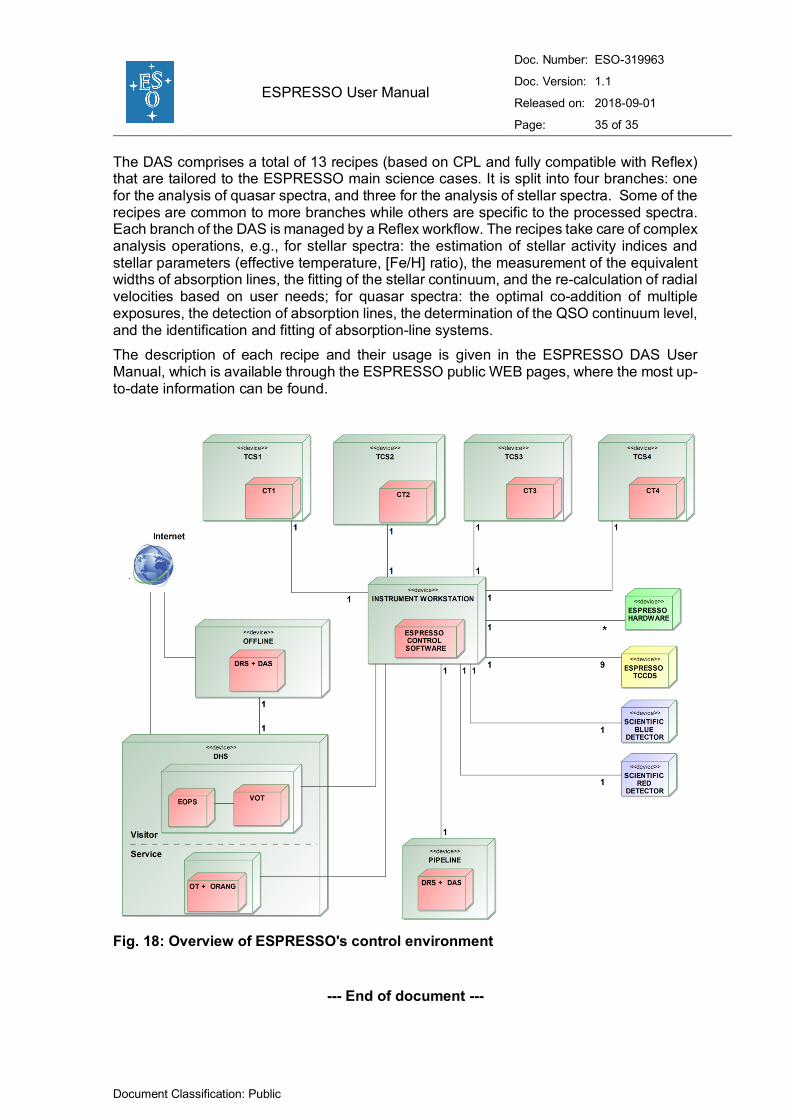
- Specific instrument control and observation templates: ESPRESSO is compliant with the usual VLT control software environment and concepts. However, compared to other VLT instruments, the internal complexity of ESPRESSO’s acquisition arises from the requirement to be able to use any combination of UTs, besides the proper handling of the simultaneous reference technique. At the instrument control level, PLCs (Programmable Logical Controllers), as well as new component off-the-shelf TCCDs, contribute to placing ESPRESSO at the forefront of current instrument control systems. An overview of the ESPRESSO control environment is given in Fig. 18;;
- The DRS (Data Reduction Software) and DAS (Data Analysis Software): a brief description of these is given below. The interested reader is referred to the corresponding reference documents for more detailed information.
7.2 Data Reduction Software (DRS) ESPRESSO has a fully automatic data-reduction pipeline with the aim of providing the observer with high-quality reduced spectra. The DRS on Paranal will automatically be triggered once raw FITS files are produced via the ESPRESSO Control Software, and in visitor mode it can also be used step by step. The DRS is also offered to any user for offline data processing. The calculation of the RV, which is an integral part of the DRS, is performed by cross-correlation of the observed spectrum with a mask (obtained from a synthetic spectrum corresponding to the spectral type of the target). The pipeline optimally removes the instrumental signature, and takes into account the complex spectral and multi-HDU FITS format of the data. It handles the simultaneous reference technique and the multi-UT mode when needed. The reference document for the pipeline is the ESPRESSO DRS User Manual which is available through the ESPRESSO public WEB pages, where the most up-to-date information can be found.
7.3 Data Analysis Software (DAS) The ESPRESSO DAS is the first dedicated data analysis system for an ESO instrument and is meant to work in close interaction with the ESPRESSO DRS. Both tools are installed for use in the VLT control room on Paranal. While the DRS is automatically triggered by the generation of new observational raw data files, the DAS is available for visiting astronomers to process their data offline. They are also provided as downloadable self-installing kits for Fedora Linux and Mac OS X platforms.
ESPRESSO User Manual
Doc. Number: ESO-319963 Doc. Version: 1.1 Released on: 2018-09-01 Page: 35 of 35
Document Classification: Public
The DAS comprises a total of 13 recipes (based on CPL and fully compatible with Reflex) that are tailored to the ESPRESSO main science cases. It is split into four branches: one for the analysis of quasar spectra, and three for the analysis of stellar spectra. Some of the recipes are common to more branches while others are specific to the processed spectra. Each branch of the DAS is managed by a Reflex workflow. The recipes take care of complex analysis operations, e.g., for stellar spectra: the estimation of stellar activity indices and stellar parameters (effective temperature, [Fe/H] ratio), the measurement of the equivalent widths of absorption lines, the fitting of the stellar continuum, and the re-calculation of radial velocities based on user needs;; for quasar spectra: the optimal co-addition of multiple exposures, the detection of absorption lines, the determination of the QSO continuum level, and the identification and fitting of absorption-line systems. The description of each recipe and their usage is given in the ESPRESSO DAS User Manual, which is available through the ESPRESSO public WEB pages, where the most up-to-date information can be found.
Fig. 18: Overview of ESPRESSO's control environment