ESSAYS ON THE EU TRADE POLICY REFORMS AND THE NAMIBIAN BEEF SECTOR By Hikuepi B. Katjiuongua A DISSERTATION Submitted to Michigan State University In partial fulfillment of the requirements of DOCTOR OF PHILOSOPHY Agricultural, Food and Resource Economics 2011
Transcript
ESSAYS ON THE EU TRADE POLICY REFORMS AND THE NAMIBIAN BEEF SECTOR
By
Hikuepi B. Katjiuongua
A DISSERTATION
Submitted to Michigan State University
In partial fulfillment of the requirements of
DOCTOR OF PHILOSOPHY
Agricultural, Food and Resource Economics
2011
ABSTRACT ESSAYS ON THE EU TRADE POLICY REFORMS AND THE NAMIBIAN BEEF SECTOR
By
Hikuepi B. Katjiuongua
Linking farmers to dynamic high value agricultural commodity markets is viewed as
important for economic growth and poverty reduction in a global economy. Yet, many factors on
the supply side and demand side combined with protective trade policies hinder broad-based
participation of many smallholder farmers in developing nations. Namibia’s beef exports to the
European Union (EU) market presents an interesting case of a mixed success story whereby a
small country consistently meets high EU market requirements, yet supply constraints combined
with uncertainties related to EU trade policy reforms undermine participation of cattle farmers.
In the first essay, utilizing primary data, a double hurdle model is used to estimate the
participation of cattle farmers in the beef export channel. In the first stage a probit model is used
to measure the impact of transaction cost related variables and socio-economic variables on
participation. In the second stage a factional logit model is applied to measure the intensity of
participation. Grade uncertainty, being a male-headed household, having a land title, ownership
of a transport equipment and membership in a farmer’s association were found to significantly
influence the participation of farmers in the international beef export channel. Payment delay,
grade uncertainty, and distance to the market, premiums, part-time farming and cost per head of
cattle significantly influenced the intensity of a cattle farmer’s participation. Having indirect
contracts with the export abattoirs and herd size are particularly important to communal farmers’
supply decisions.
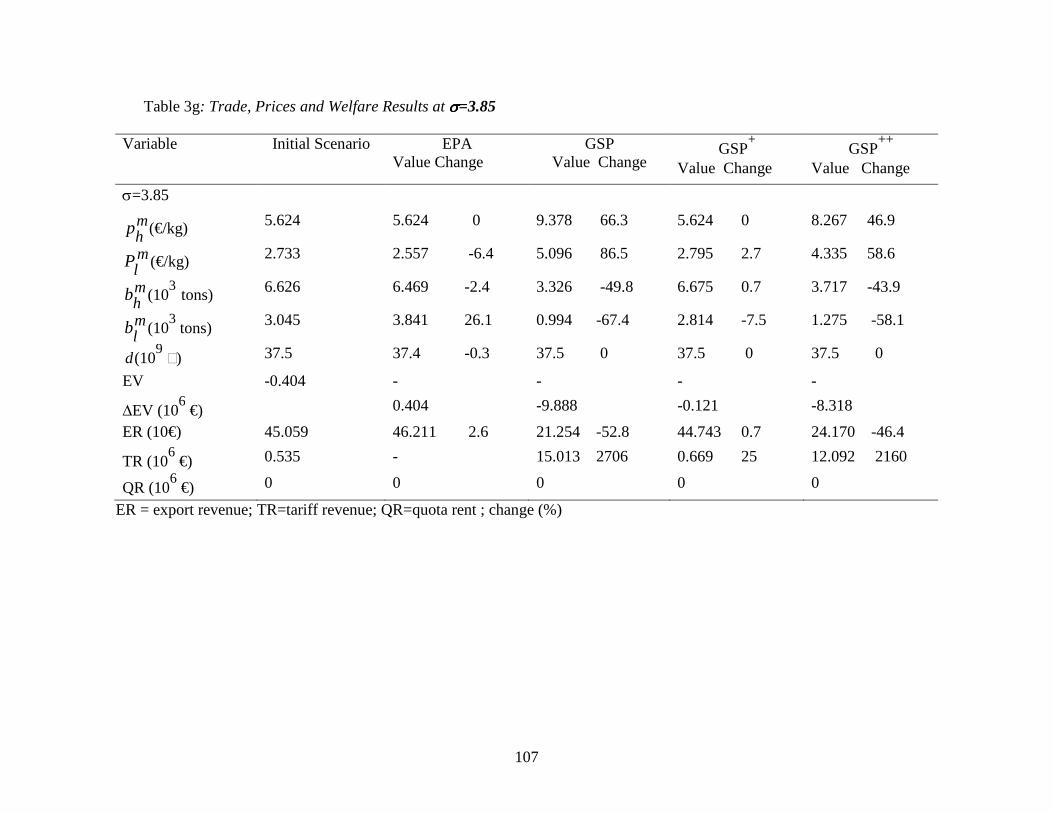
The second essay estimates EU import demand of beef from Namibia in response to five
trade policies scenarios. Beef is treated as a differentiated product composed of both high and
low quality beef varieties in all five scenarios: (1) Preferential Market Access, (2) the Economic
Partnership Agreement (EPA) and its alternatives, (3) the standard generalized system of
preferences (GSP), and two enhanced GSP options (4) GSP+ and (5) GSP
++. Results show that
the trade alternatives have different effects on the composition of beef imports. The results are
consistent with the Alchian-Allen conjecture that demonstrate how per unit transaction cost
lowers the relative price and increases the demand for high quality goods, resulting in exporting
high quality goods, and selling lower quality goods domestically. Overall, the results show that
the EPA trade policy is the optimal option for the EU and Namibia.
Copyright by HIKUEPI B. KATJIUONGUA 2011
v
In memory of my Beloved Kaomoo, Gottlieb Pule Uatanaua Katjiuongua Thank you for your pure and endless love.
I miss you!
vi
ACKNOWLEDGEMENTS
I would like to thank my dissertation committee composed of Drs. Dave D.
Weatherspoon, David Schweikhardt, Steven Matusz and Dr. Chris Wolf. Dave, thank you for
your commitment, advice and enormous support throughout my graduate time at MSU. It is
difficult to capture my gratitude in words. You always rendered your time and sensitive ear
selflessly. Dr. Schweikhadt, your knowledge, questions, intuition and advise, especially at a
critical time of my dissertation writing was so invaluable and improved the quality of my work
enormously. Dr. Matusz, each and every comment you made and question you asked improved
the quality of this dissertation. Dr. Wolf, thank you for your support, comments and clarity.
I am enormously grateful to my beloved Elliot and Zoya. Elliot, thank you for being
there, for loving me, for your beautiful mind and sense of humor. Thanks for the most precious
gift of all, our beautiful Zoya. My family in Namibia made this achievement possible through
their unconditional love, joy and sacrifice. Thanks Mom, Kuki, Mpho, Vashe, Tuaa, Ouma Emii,
Marx, Leff, Tiki, Mamani and Papa Bruno. Thanks to Uerikuua and Audline for your love.
Thanks for the love and support of my friends: Miriam, Justice, Kay, Gina, Eleni, Denise,
Lovisa, Gao, late MaPriscila Omae, Hilda, the Wards, Seabrooks and Schimmings. Thanks to all
my colleagues in Cook Hall (especially Amin, Frank, Kwami, Athur, San, Joshua, Rui, Youssouf
and late Lesiba Bopape). Thank you to all the faculty and staff in the department, especially, Drs.
Reardon, Peterson, Oehmke, Hailu, and Drs. Wooldridge and Badiane. Finally, thank you to the
Ministry of Education of Namibia and the Borlaug LEAP Fellowship for their financial support.
vii
TABLE OF CONTENTS LIST OF TABLES..................................................................................................................ix
LIST OF FIGURES………………………………………………………..……………..….x
LIST OF ABREVIATIONS...................................................................................................xi CHAPTER 1: GENERAL INTRODUCTION………………………………………….…....1 CHAPTER 2 2.1 Introduction…………………………………………………………………….……...5 2.2 Overview of Cattle Marketing in Namibia……………………………..……………...9 2.3 Transaction Costs of Cattle Marketing in Namibia…..…………………………….…15 2.4 Empirical Model: The Double Hurdle model………………………………….……..18 2.4.1 The Participation Decision…………………………………………….……...21 2.4.2 Intensity of Supply Decision………….…………………………...………….22 2.4.3 The Estimation Equations………………………………………………….....24 2.5 Data and Definition of Variables………………………………………………….…..25 2.5.1 Data and Definition of Variables……………………………………………...25 2.5.2 Potential Estimation Issues…………………………………………………....35 2.6 Empirical Results………………………………………………………………….…..38 2.6.1 Participation Decision Results……...………..……………………………......38 2.6.2 Supply Intensity Decision Results………………………………….……........43 2.7 Conclusion and Policy Recommendations……………………………………….........51 APPENDICES………………………………………….......……………………..…...55 Appendix 2A Map Namibia…………………………………………………….….....56 Appendix 2B Number of Cattle Sold (1998-2008)…………………….………….....57 Appendix 2C Marketing of Cattle Production in Numbers (1998-2008)………........57 Appendix 2D Average Producer Price (N$/kg) by Grade (2002-2008)………………58 Appendix 2E Average Beef Carcass Grade Distribution (2005-2008)………………..59 Appendix 2F Asymptotic Variance of Estimators in the Fractional Logit Model…....59
REFERENCES…………………………………………………………..……………..60 CHAPTER 3 3.1 Introduction………………………………………………………………………........68 3.2 Literature Review…………………………………………………………..….……....70 3.3 Policy Background……………………………………………………………………..73 3.3.1 Preferential Market Access………………………………………………….....73 3.3.2 EU-ACP Post Cotonou Trade Alternatives……………………………….……75 3.3.2.1 Economic Partnership Agreements………………………………….…75 3.3.2.2 The Generalized System of Preferences and Enhanced GSP………....77 3.4 Namibia and World Beef Market………………………………………………..….….80 3.5 Empirical Model and Conceptual Framework………………………………………....86 3.5.1 Theoretical Context………………………………………………………….…86 3.5.2 Consumer Optimization Problem…………………………………………..….87
Reardon, 2003; Reardon et al, 2003; Kirsten et al, 2002; and Reardon & Barrett, 2000) analyzed
market participation and channel choice in agricultural marketing using value chain analysis,
supply chain cost analysis and various econometric methods. This emerging literature focuses on
market participation in modern marketing channels such as supermarkets and large-scale
distributors of high value agricultural commodities. Their analyses shed light on the procurement
approaches and requirements of these marketing channels and their implications for smallholder
participation. Even in these studies, transaction costs related factors such as grade uncertainty
and contracts play an important role participation of producers
There is a dearth of quantitative empirical research on cattle marketing in Namibia.
Kakujaha-Matundu (2002) provides a detailed analysis and discussion on common pool resource
management among livestock pastoralist in Eastern Namibia, but no empirical results on the
factors that influence Namibian farmers marketing decisions. Given the importance of the beef
sector on rural household income and subsistence, urban employment from the beef processing
industry, and on foreign exchange and revenue earnings, this study will help policy makers to
better understand the bottlenecks in cattle marketing, and to better target resources to assist
communal cattle farmers’ participation in the international beef export market.
This paper assesses the effects of transaction costs and other socio-economic factors on
not only participation, but also the degree of Namibia cattle farmers’ participation in the
international beef export market. To assess these two decisions in the context of transaction
costs, we apply the double hurdle model. But unlike many previous papers that use the tobit
9
model for the supply intensity hurdle, this paper applies the fractional logit model to investigate
the role of transaction costs in the intensity of cattle supply in the export channel. Based on the
data we analyze monitoring, negotiation transaction costs related variables and other variables
that indirectly measure information related transaction costs.
The next section gives an overview of cattle marketing in Namibia.
2.2 Overview of Cattle Marketing in Namibia
Cattle production is the most important agricultural activity for many farmers in Namibia.
The beef sector generates over 60% of the livelihood of Namibia’s population of 2 million.
There are two livestock farming systems in Namibia: commercial and communal. The key
distinction is that commercial farming is operated on private land and commercial farmers hold
land titles, while communal farmers live on communal land shared as common property among
many households. Approximately 70% of Namibia’s population lives in rural areas located on
communal farmland and depend on livestock farming for their livelihoods. There are
approximately 4,000 commercial farmers in Namibia each holding an average of 7,000 hectares
of land located below the North veterinary line1. There are about 68,000 communal farmers
spread across the country with a greater proportion located North of the veterinary line.
Selling cattle is a significant source of cash for many livestock communal farmers. In
addition, the number of cattle that a farmer owns is an important symbol of wealth for many
1 Veterinary cordon (VC): this cordon extends west to east in the Northern part of Namibia; it
was put in place to control foot and mouth disease (FMD) in livestock, but its size and location has a political history. The black dash line on the map (Appendix 2A) indicates the VC.
10
communal farmers. Similar to previous observations (Barrett et al, 2006; Lybbert et al, 2004;
Little et al, 2001) of pastoralists’ behavior in Eastern Africa, livestock communal farmers in
Namibia prefer to hold wealth in the form of livestock. In addition to cultural reasons including
the sentimental value attached to cattle, holding cattle for milk, the lack of trust in the
commercial banking institutions may explain the preference of a ‘walking’ bovine bank. The
absence of a banking tradition among many communal farmers means that communal farmers
primarily sell their cattle when they need cash (e.g., to pay for school fees, hospital fees and
funerals). In spite of this, key informants indicate that in the last ten years they have observed an
increased (but slow) commercial mindset among communal farmers especially among the
Ovaherero pastoralists. On the other extreme, there exists a strong commercial farming sector
and commercial farmers control approximately 52% of Namibia’s arable land.
Many cattle farmers in Namibia sell their cattle in multiple channels for a variety of
reasons, including the desire to diversify sources of income to better manage finances, and
having to finance emergencies such as funerals or medical needs. Also, the time-lag in getting
paid in the different marketing channels combined with the different timing and frequencies of
sales enables the farmers to sell in multiple channels to meet different financial needs and to
respond to various market conditions. Furthermore, Namibia’s semi-arid climate is prone to
frequent droughts which influence farmers’ marketing decisions. For example, when there is a
prolonged severe drought farmers may prefer to sell weaners2 and older cows to minimize losing
cattle due to wasting and to minimize the costs related to cattle feed and supplements. During
2 In Namibia a weaner producer refers to a cattle farmer who predominantly produces and
markets young calves (6-10 months); a calf of that age is called a weaner.
11
such times they may sell more at auctions and permits. Figure 2a depicts the cattle marketing
channels in Namibia.
Figure 2a: Cattle Marketing in Namibia
Cattle Industry National Herd: 2.3 mil Av. annual Cattle production: 318,399
Permit
Sellers: Communal (90%) Other (10%) Payment: immediately Frequency: 1-2 per month Price: Closed bidding
Export Abattoir
Sellers: Commercial (85%) Other (15%) Payment: 7-14 days Frequency: daily/contract Price: Formula pricing
Auction
Sellers: Commercial (50%) Other (50%)
Payment: immediately Frequency: 1-2 per month Price: Open bidding
Domestic Retail
- Supermarkets - Food Service Industry - Meat processors/butcheries
Feedlots
- South Africa: 95% - Domestic: 5%
Export
- EU: 45% - Regional:
- South Africa: 35% - Other: 20%
12
A cattle farmer in Namibia can sell cattle at an auction, a permit3 or to export licensed
abattoirs. At an auction multiple buyers bid for the cattle offered and the highest bidder takes
all. Auctions are held once-twice a month in some locations and every three months in other
locations. Prospective sellers announce their intention to sell and buyers announce their
intention to buy. The permit outlet usually has one buyer. However, there is a bidding process in
the permit channel: multiple buyers make written offers and the highest bidder is given the
opportunity to buy as a single buyer. The Meat Board of Namibia4 publishes
5 auction and
abattoir prices on a weekly basis, thus the general public has an idea of what the market would
pay for what they intend to sell. The buyer bidding to buy at a permit day will have to
benchmark their bidding offers against the market trend. This process allows the producer to
have a floor price to bargain with and the buyer cannot pay below what he/she offered in the
bidding document. In addition, the buyer usually travels to the farmers’ location to buy the
cattle.
The auction and permit outlets are similar in that cattle prices are based on live weight.
Communal farmers make up approximately 90% and 40% of the sellers at permit markets and
auctions respectively. Communal farmers dominate the permit channel because buyers come to
their location, and this reduces transaction and transport costs for the farmers. In addition, for a
3 The permit system resulted from livestock market liberalization in the 1980s to enable
commercial farmers to fulfill their quotas at abattoirs. Prior to this, as part of the apartheid laws in Namibia, White commercial farmers were not allowed to buy cattle in Black populated communal areas. The system is dubbed ‘permit’ because potential pastoralist sellers had to obtain a permit from the Department of Veterinary Services and invite a commercial farmer to buy cattle in their communal area. 4 This is a marketing board that facilitates export of livestock, meat and products, Namibia’s traceability farming scheme. 5 Average weekly prices are announced over the radio.
13
variety of reasons including cost and risk considerations, communal farmers are mainly
weaner producers; hence they tend to sell more at auctions and permits; while abattoirs buy
young cattle to fatten at their feedlot, they generally prefer to buy heavier6 cattle. Buyers at
auctions and permits are predominantly speculators who buy cattle for feedlots where cattle are
fattened up and then sold to abattoirs (90% are sold to SA feedlots).
In contrast to auctions and permit channels, prices for cattle sold to the export channel are
based on deadweight carcass and grade. With a market share of over 60%, Meatco is the
dominant export abattoir. To ensure that Meatco does not pay producers below what they would
fetch in SA, a formula was agreed upon to determine a parity price7. Thus, Meatco usually pays
above the SA parity price and the additional payment depends on the grade and weight of the
carcass. Most sellers sign delivery agreements and deliver the cattle to the abattoirs. Only 10% of
communal farmers sell cattle directly to export abattoirs under contracts. On the other hand,
commercial farmers make up about 90% of contracted suppliers at Meatco.
The export of live cattle to South Africa (SA) poses strong competition to Meatco. To
minimize hold-up problems and assure a profitable operational capacity of its plants, Meatco
provides incentive programs8 for cattle suppliers. For example, (1) premiums are paid to
suppliers if they deliver a certain proportion of the cattle that they promised to deliver under the
6 Cattle that weigh 320 kg or more. 7 To determine the SA parity price, data are generated from abattoirs in SA to determine what producers could get in RSA minus transport, SAMIC levy (statutory levy in RSA) and adjustment for veldt hide. 8 Tjimune (2010): Meatco procurement manager.
14
delivery contract; (2) as part of profit-sharing, producers who delivered cattle in a particular
financial year receive bonuses (equal to dividends) from that year-end financial profits, and (3)
producers who sign a contract and deliver cattle earn points under a merit point system, this point
system provides a means for producers to compete for slaughter allocation especially during the
peak season. In addition, to encourage communal farmers to sell their cattle to its abattoirs,
Meatco holds ‘farmers’ days’ where they go to communal areas to buy, instead of requiring
farmers to deliver the cattle.
Key informants9 (industry experts) report that it is expensive to export to the EU market
because: export abattoirs face two to three unannounced inspections per year; frequent changes
in standard specifications including strict requirements and frequent changes in the slaughter
methods; carcass and water testing which increase laboratory expenses; and regular annual
upgrading at the processing plants. Furthermore, the EU recently required that cattle have double
ear tags10; such a requirement adds significant costs for farmers and many industry informants
do not see the additional benefits in terms of food safety and product quality.
Appendix 2B shows the number of cattle sold in the different channels. The average
cattle sold live (auctions and permit) in the last seven years are 165,664, and the average number
of cattle sold to export abattoirs is 135,332. During this period, 45% of beef slaughtered at the
export abattoirs was exported to the EU and the remainder to South Africa and other regional
markets. Only cattle purchased south of the veterinary cordon shown in appendix 2A, and that
9 Koos Claassens (Meatco); Tujendapi (Meat Board of Namibia).
10 Ear tags cost $N6.20/tag (about $0.90 USD/tag); all animals being sold must be tagged.
15
meet the grades A and AB are sold to the EU. This is important because grades A and AB fetch
the highest producer prices as shown in appendix 2D. In the last five years, grades A and AB
made up about 13% and 25% of the average grades respectively, while grades B and C
constituted 62% of the average grades collectively (shown in appendix 2E).
Based on the data and analyses by key informants in Namibia, transaction costs are a
major problem for cattle farmers and limit supply of cattle to export abattoirs. Given the
importance that transaction costs play as a barrier to entry in high value markets for smallholder
farmers we will analyze cattle marketing in Namibia within the transaction cost framework.
The next section provides a simple conceptual framework of cattle marketing in Namibia under
transaction costs.
2.3 Transactions Costs of Cattle Marketing in Namibia
This section provides a formal description of the cattle marketing in Namibia in the
context of transaction costs. It presents a simple framework to illustrate how transaction costs
influence cattle marketing decisions. The equations in this section are not used as the estimating
equations, but I simply use them to mathematically conceptualize the farmer’s problem. There
are three channels in which farmers sell their cattle: export channel (EC)11
auction (A), and
permit (PE).
Let ∏x denote profit and qx amount of cattle sold in marketing channel x. The amount
of cattle produced is determined by channel specific technologies. Thus, a farmer who primarily 11
Cattle farmers sell cattle to export abattoirs in the export channel; export abattoirs and export channel are used interchangeably.
16
participates in the export channel faces different costs of production compared to a farmer that
primarily sells cattle at a permit market. However, making channel specific production decisions
does not preclude the farmer from selling cattle to the other marketing channels. For
simplification, assume that production decisions are pre-determined, and the farmer is only
making a marketing decision. Further assume that per period profit function is additively
separable in the marketing channels. This assumption does not preclude the effects of outcomes
from previous periods. Given these assumptions, profits are determined by output prices, amount
of cattle and channel specific transaction costs.
Channel specific transactions costs depend on channel characteristics (EC, PE, A); for example,
TEC EC,Z( ) represents transaction costs in the export channel. Socio-economic characteristics of
the farmer such as farm size are denoted by (Z)
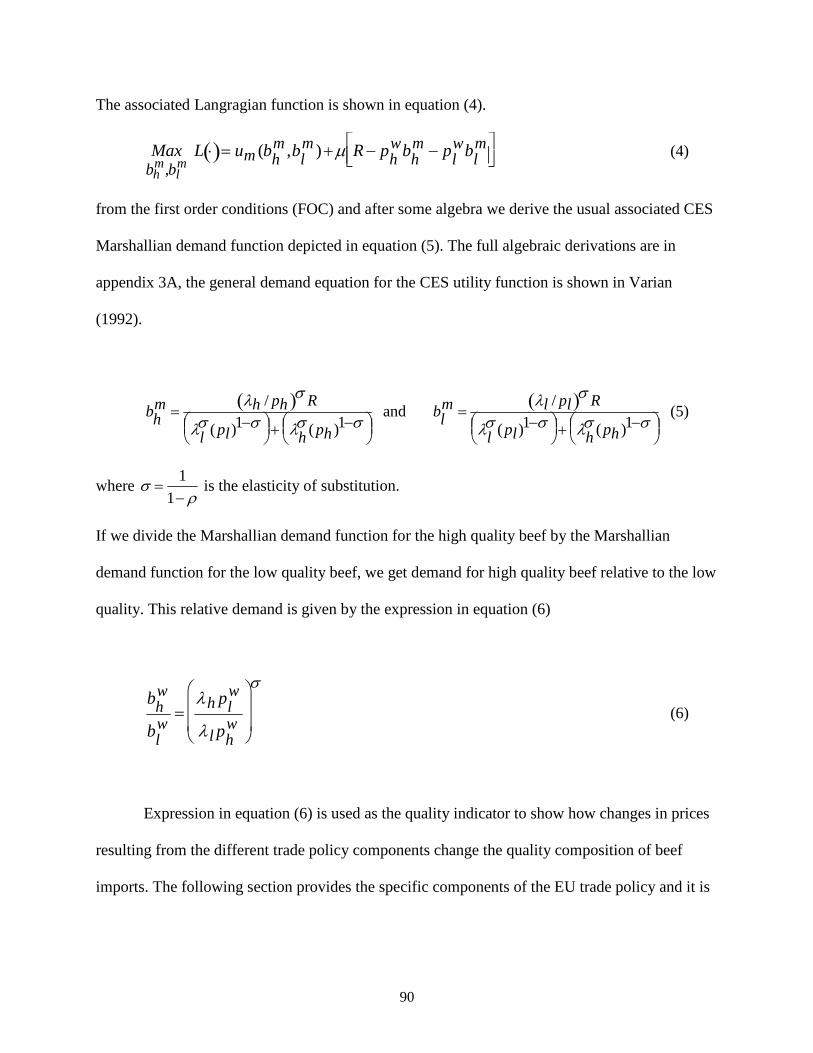
∏EC = ∏ PEC,qEC,TEC(EC,Z)( ) (1)
∏PE = ∏ PPE,qPE,TPE(PE,Z)( ) (2)
∏A = ∏ PA,qA,TA(A,Z)( ) (3)
The profit of selling in marketing channel x is given by:
= qxx∏ Px − TCx Z,X( )( ) (4)
Since farmers sell cattle in multiple marketing channels, we can view the problem in terms of
proportions. Let Yx∗ be the optimal proportion of cattle sold into marketing channel x and
letPEC ≥ max PEC,PA[ ] and assume that Tx > 0, then:
In summary, equation (5a) shows that if the price offered by export abattoirs is greater or
equal to the maximum of the price offered in the other two channels and the farmer’s chosen
optimal quantity to export abattoirs is zero, then it must be that the transaction costs associated
with the export channel are greater than the transaction costs associated with the other two
channels. But if the farmer chooses a proportion between zero and one, as shown in equation
(5c), then it could mean that the transaction costs associated with the export channel are less or
equal to the transaction costs associated with the other two channels. A farmer may sell all cattle
in the export channel (5b) under two possible scenarios: firstly, if the transaction costs associated
with the export channel are strictly less than the transaction costs associated with the other two
channels, or secondly, if the price offered in the export channel strictly exceed the price offered
in the other two channels even if the transaction costs of doing is a little higher than the
transaction costs of either of the other two channels. In addition, if the price offered in the export
channel strictly exceeds the transaction costs of all channels, PEC > TCx ,∀x ∈ EC,PE,A( ),
such that the price PEC offsets all costs of selling cattle to the export channel, then a rational
farmer may sell all cattle in the export channel.
Direct observation of the profits for each marketing channel is not possible. Participation
in the export channel is identified by the farmer’s indication of whether he/she sells cattle to an
export abattoir. It is a binary response that takes on the value one to indicate participation and
zero to indicate non-participation. The proportion of cattle that the farmer sells to export
abattoirs measures the intensity of participation in the export channel. It takes on values between
0 and 1 (100 per cent). The higher the value, the higher the proportion of cattle sold through the
export channel and the lower the proportion sold through the other two channels (auction or
18
permit). The next section provides the empirical model to measure farmers’ participation and
their intensity of participation in the beef export channel.
2.4 The Empirical Approach: Double Hurdle Model
Given the description of cattle marketing outlets, we expect data to take strictly positive
values. Since some farmers never sell directly to export abattoirs, and some sell all their cattle to
export abattoirs, the dependent variable takes zero values with positive probability and the data
are likely to be censored at both an upper and lower limit of zero and one (0 and 100 per cent).
The tobit model has been used widely to address this type of data, and applied to questions of
marketing channel selection (Holloway et al, 2002; Gong et al, 2007, Reardon et al, 2006 &
Abdulai et al, 2009). However, the tobit model attributes censoring to corner solutions (Yen et
al, 1996). Thus, it would not be clear whether a value of zero indicates that the farmer does not
sell cattle in a particular channel or that she does, but did not sell in the particular period.
Further, the tobit model does not adequately characterize the two decisions that occur in market
channel selection: participation and intensity12
of participation. A realistic approach is to
separate these two decisions: first, the farmer decides to participate; second, the farmer decides
how many cattle to sell in the chosen channel. Such a separation is closer to the data generating
mechanism of how farmers choose to market cattle through the various marketing channels in
Namibia. Furthermore, while the tobit model yields sensible partial effects and non-negative
predicted values of the dependent variables, the marginal effect of explanatory variables is
constant rather than diminishing (Wooldridge, 2002).
12
How much to sell once the participation decision is taken.
19
An alternative approach includes the use of sample selections methods (as used by Alene
et al, 2008; Hernandez, 2006 & Goetz, 1992). Most of these approaches are similar to the
Heckman’s (1979) two-stage sample selection model where the participation and supply
decisions are modeled sequentially using the same independent variables for the participation
and supply decisions. To correctly identify parameters an exclusion restriction is required and
this approach precludes corner solutions.
Given this type of data, a more appropriate approach is to model the decision process as a
Double-Hurdle model as proposed by Cragg (1971). It allows for censoring at both decision
stages: positive outcomes can only be supplied if the farmer entered the market and the farmer is
not at a corner solution in the sales decision (Angula, 2010). This model was originally applied
to model household consumption. It assumes that the household makes two decisions when
purchasing an item: a household first decides whether or not to purchase a good, and second
depending on the intensity of the preference, the household decides how much of the good to
purchase. Each decision is determined by a different set of explanatory variables, and different
set of latent variables is used to model each decision process with a probit part determining the
participation decision and tobit model determining the expenditure hurdle (Blundell and Meghir,
1987). The double hurdle model allows for the use of the same independent variables for both
decisions. To deal with the exclusion requirement in addressing parameter identification
problems, it assumes independent error terms between the two decision stages. The double
hurdle model has been applied widely since its introduction (including work on the supply side
by Balagtas, 2007; Aristei et al, 2007, Zhang, 2006; Yen et al, 1996 and Jones, 1989). Cragg’s
independent Double Hurdle model is applied by maximizing the likelihood function.
20
The log-likelihood function of the double-hurdle model with independent error terms is
given as:
LL = ln 1− Φ ′ x 1iβ1( )Φ′ x 2iβ2σ
0
∑ + ln Φ ′ x 1iβ1( ) 1σ
ϕpi − ′ x 2iβ2
σ
+∑ (6)
where the first term in equation (6) accounts for the probability of passing the participation
hurdle and the second term indicates the density of observing non-zero sales. I assume that there
are no spillover effects among channels during the current period and examine the problem as
static. The double hurdle model can be estimated by maximizing the likelihood functions of the
participation and supply intensity components separately. Still, the independence of the error
terms is a strong assumption, so to account for possible bias, I first estimated a probit model for
the participation in the beef export channel, then generated the inverse mills ratio and used it in
the second stage of cattle supply intensity model. In contrast to other papers that use the tobit
model to estimate the second hurdle, I use the fractional logit model to measure the supply
intensity decision because it is more appropriate for the data that were collected and the nature of
cattle marketing decisions faced by the average Namibian cattle farmer. Thus, the second term in
equation (6) is estimated by maximizing the likelihood function of the fractional logit model
given by equation (13) on page 24. The fractional logit model is discussed in detail in section
(2.4.2).
The following section presents a detailed operationalization of the double hurdle model
for both the participation and supply intensity decisions.
21
2.4.1 The Participation Decision
Given the context of the analytical framework described in the previous section, a
determination of whether the farmer sells cattle to export abattoirs is analyzed. This is a binary
response of the probability that the farmer sells cattle to an export abattoir, given various
explanatory factors. The formal probit model is presented in equations (7) through (11).
Let yi∗ = xiθ+ei (7)
where xi is a vector of independent variables, ei the disturbance term and it is
independent of xi and ei Normal (0,1) and θ is a vector of parameters. yi∗ is a latent variable,
however, instead of observingyi∗, we observe yi which takes on two values: yi =1 yi
∗ > 0
,
when a farmer sells cattle to export abattoirs, and yi = 0 yi∗ ≤ 0
if the farmer does not sell
cattle to export abattoirs.
As shown in Wooldridge (2002) the distribution of yi xi is:
P yi =1( )= P yi* > 0 xi
= P xiθ + ei > 0 xi( ) yi
∗ > 0
, (8)
= P ei > −xiθ xi( )=1− Φ −xiθ( )= Φ xiθ( )
and P yi = 0xi( )=1− Φ xiθ( ) (9)
22
where Φ ⋅() denotes the standard normal cumulative distribution function given by
Φ ⋅()= 2π( )1/2exp −z2 /2
(10)
The density of yi given xi is
f yi xi( )= Φ xi( )[ ]y1− Φ xiθ( )[ ]1−y
, y = 0,1 (11)
Equations (8)-(11) show the distribution of the probability of a farmer participating in the export
channel conditional on the transaction cost related and socio-economic characteristic explanatory
variables. We discuss the supply intensity model in the next section.
2.4.2 Intensity of Supply Decision Model
As discussed in the description of cattle marketing in section 2.2, many farmers in
Namibia sell their cattle in multiple channels. It is thus appropriate to view the dependent
variable as fractional in nature, given a farmer’s choice to market cattle in multiple channels.
Hence, the dependent variable takes on values between the lower and upper values and has a
continuous distribution. Modeling such fractional dependent variables directly can be
conveniently and appropriately done using the fractional logit modeling approach proposed by
Papke and Wooldridge (1996).
Papke and Woolridge’s (1996) approach directly models the conditional mean of the
fractional response that keeps the predicted values in the unit interval. They applied quasi-
maximum likelihood estimation (QMLE) method to obtain robust and efficient properties. Others
23
(Sivakumar, 2002; Ye, 2004; Hausman et al, 1998; Liu et al, 1999 & Wagner, 2001) extended
and applied this method in several studies.
The estimation procedure follows a quasi-likelihood method as described by Gourieroux
et al (1984): to motivate, first let G(⋅)be a well-defined function for 0 < G(⋅) >1 to ensure that
the predicted values if y lie in the interval (0,1). Then,
E(yi xi ) = G(yi xi ) =exp(xiβ)
exp(xiβ)∑ (12)
and the Bernoulli log-likelihood function is given by
L(β;x) = yi log[G(xiβ)]+ (1− yi ) log[1− G(xiβ)] (13)
Papke and Woolridge (1996) showed that because (13) is a member of the linear
exponential family, the quasi-maximum likelihood estimator (QMLE), ˆ β , obtained by
maximizing equation (13) is consistent and asymptotically normally distributed regardless of the
distribution of yi xi provided that equation (12) holds. But the logit QMLE assumes that
Var yi xi( )= σ 2G β,xi( )1− G β,xi( )[ ], and this causes over-dispersion or under-dispersion in
the variance of the estimators. To correct for the over and under dispersion in the variance, Papke
and Woolridge (1996) estimated asymptotically robust inference for the conditional mean
parameters (see appendix 2F). With equations (12) and (13) we can consistently estimate β
using the Bernoulli QMLE. The next section provides the estimation equations for both
decisions: to participate in the export channel and how many cattle to sells once the farmer
decides to participate.
24
2.4.3 The Estimation Equations
The export channel participation estimation equation is given as:
Export Channel
Participation = α + βk∑ TransactionCost + η
n∑ FarmCharacteristics+ µ (14)
where the dependent variable is a binary variable and equal to 1 if the farmer participates in the
export channel and 0 otherwise. The supply intensity estimation equation is given as:
Proportion Sold = α + γk∑ TransactionCost + θ
n∑ FarmCharacteristics + ε (15)
where the dependent variable is the proportion of cattle that a farmer sold to export abattoirs in
the specified agricultural marketing period. In both equations the TransactionCost variable is the
vector of transaction costs related variables and FarmCharacteristic is the vector of farm level
and farmers’ socioeconomic characteristics variables.
According to Newman (as cited in Angula, 2010) the double hurdle model is not based on
any formal choice theory, thus it is difficult to choose which explanatory variables to include in
each decision stage. However, the underlying assumption is that the first (participation) stage is
often the result of socio economic variables. With this in mind, a large number of variables were
regressed against the dependent variables then tested for their individual and joint significance. I
dropped the ones that were not significant, but kept those that I expect to have a direct
relationship with the dependent variables.
25
2.5 Data and Definition of Variables
2.5.1 Data and Definition of Variables
The primary data used in this study come from a random sample of 201 cattle farmers in
the following three regions of Namibia: Otjozondjupa, Omaheke and Erongo. All three regions
are located south of the veterinary line in Namibia. Livestock farming is the main agricultural
activity, and it is the principal source of income in many of the communal areas in these regions.
The data were collected from June through November 2007. Pre-tested structured questionnaires
were used. Enumerators were hired to assist in administering the questionnaires. In addition,
interviews with key informants including industry and farmer association representatives, and
key policy makers were conducted.
The data cover a range of variables including transaction costs related factors, cattle
marketing information, household assets and other descriptive information. Table 2b shows the
variables, summary statistics and their expected direction of influence on participation and
intensity to supply based on a priori expectations. Ex post monitoring transaction costs include
grade uncertainty and payment delay; negotiations related transaction costs include the premium
(the payment that suppliers receive over the sales price for supplying the delivery promise) and
the type of contract that a farmers has with the export abattoir. Ex ante information transaction
costs include membership to a farmer association and whether a farmer farms part-time or full-
time. Other ex ante transaction costs include distance to market, ownership of transport
equipment, premium, and the type of contract that the farmer has with the buyer.
26
Table 2b: Variables and Summary Statistics
Variable N Mean Min Max SD Expected
sign Participation
Expected Sign
Supply Intensity
Dependent Variables
Sell to export abattoir (yes=1)
201
0.507 0 1 0.501 N/A N/A
Proportion of cattle sold to export abattoirs
201 0.177 0
1 0.265 N/A
N/A
Explanatory variables
TC Related variables
Grade uncertainty (yes=1)
201
0.691
0
1
0.463 −
−
Payment delay (yes=1)
200
0.91 0
1
0.287 −
−
Distance to market
(km)
201
46.442
3
205
56.323
−/+
−
Transport equipment
(yes=1)
201
0.716
0
1
0.451
+
+
Farmer group member (yes=1)
201
0.821
0
1
0.384 +
+
Premium (yes=1)
201
0.497
0
1
0.501 +
+
Type of contract (own=1)
201
0.574
0
1
0.501
+
+
27
Table 2b (continued): Variables and Summary Statistics
*N$1=7.54 (USD) at current exchange rate.
In this sample the average participation rate of respondents in the export channel is
50.7%. As expected, commercial farmers participated more: approximately 90% of commercial
Variable N Mean Min Max SD Expected
sign Participation
Expected Sign
Supply Intensity Farmer household
characteristics
Total Herd (number)
201
171.6
4
1600
228.2 +
+
Herd Ownership (% of total herd)
201
0.93
0.26
0
1 +
+
Education (years)
200
10.07
0
18
4.67 +/−
+/−
Experience (years)
201
25.66
5
55
11.84 +/−
+/−
Running water (yes=1)
201
0.73
0.44
0.11
2.5 +
+
Land title (yes=1)
201
0.254
0
1
0.44 +
+
Gender of head (female=1)
201
0.338
0
1
0.47 −
−
Relies solely on family labor (yes=1)
201
0.228
0
1
0.421 +
−
Hired labor (number)
201
2.701
0
80
6.17 +
+
Farming time (full time=1)
201
0.766
0
1
0.42 +
+/-
Cost per head (N$)*
179
368.5
11.6
3083
461.1 +/−
+
28
farmers participate in the export channel, while only 39% of communal farmers sell cattle to
export abattoirs. According to the main export abattoir procurement manager, participation by
communal farmers has been increasing over the last seven years because many are now
developing a market-oriented mindset.
Overall, the average proportion of cattle sold to the export channel in the 2007
agricultural marketing period was 17%. The proportion of cattle sold to export abattoirs
measures the intensity of supply. In this sample, approximately 30% of farmers who sold cattle
to the export channel sold a proportion of over 50% and only 6.9% of farmers sold a proportion
of exactly unity. In that period, commercial and communal farmers sold on average 37% and
11% of cattle to export abattoirs respectively.
Sixty-nine percent of the respondents said that they face grade uncertainty when they sell
their cattle. Grade uncertainty and payment delay are forms of ex post monitoring costs. They
arise due to uncertainty, information asymmetry and potential opportunistic behaviors.
Uncertainties arise from imperfect or incomplete information. Grade uncertainty is hypothesized
to decrease the probability of participating in the export channel. Cattle delivered at the export
abattoirs must wait 24 hours before slaughter and the grade is based in the dead carcass. Most
farmers are usually not present to monitor their cattle during the time of slaughter and while the
cattle are transported to the abattoir. Thus, the farmer may approximate the grade of their live
animal based on physical inspection including counting its teeth, but the grade based on the
deadweight may differ. Holding other factors constant, this uncertainty creates friction and
lowers the level of trust between suppliers and the buyer, especially when the farmer gets a
29
different grade from what he/she expected. Likewise, when a seller is not paid immediately,
uncertainty arises as to whether the buyer will honor the promise. The longer the lag between the
sale and payment, the greater the uncertainty and this reduces the incentive to sell. Hence,
payment delay is expected to decrease the probability of participation and to lessen the intensity
of participation in the beef export channel.
The average distance of the main road from the farmer’s homestead to the cattle market is
46 km. Approximately 21% of the households in this sample travel less than 10 km to get to the
market where they sell their cattle, and about 14% travel over 100 km to get to the market. Being
located far away from markets requires more effort to discover market information and makes it
difficult to establish closer relations with the buyers. Distance increases the time it takes to reach
the market and introduces risk with respect to carcass shrinkage during travel time. The extent of
the effect of distance on transaction costs depends on the conditions of the roads and the means
of transportation used for traveling; if the road infrastructure is good, the effect of distance may
be minimal. On the other hand, shorter distances with bad roads have significant influence on
market participation. While theoretically and based on previous findings (Arlene, 2008;
Balsevich, 2006), one would expect distance to have a negative influence on participation, we
have to evaluate distance in the context of cattle farming in Namibia. Most of the commercial
farmland is located farther away from the central district because of the availability of land for
large-scale livestock farming. As a result, there is a structural condition whereby, households that
have large herd of cattle and who own more grazing hectares of land per cattle tend to be located
farther away from the center where export abattoirs are located. As a result, distance may have a
positive or negative effect on the likelihood of participating in the export channel. On the other
30
hand, we expect distance to have a negative impact on the intensity of supply. Ownership of a
transport vehicle is expected to enhance market participation through its role in facilitating
access to information, in facilitating the transport of cattle to markets and thereby reducing time
that it takes for the farmer to arrange for transportation time. Previous studies including (Alene et
al, 2008; Heltberg et al, 2002) found that ownership of transport equipment enhances market
participation.
On average, 76% of respondents are full time farmers and 82% are members of a farmer
group organization. We do not have variables that directly measure information search costs.
But, membership to a farmers’ organization enables farmers to gain access to marketing and
pricing information, and it allows farmers to pool resources together (e.g., arrange for the
transport of cattle as group). Further, it reduces transaction costs including search costs, and
makes the exchange or transfer of cattle ownership less costly for farmers. Thus, we use it as a
proxy for information related transaction costs and we expect it to have a positive effect on the
probability of participation and on the intensity of participation in the beef export channel.
Previous studies (by Nyoro and Ngugi, 2007; Poulton et al, 2004, Minot & Ngigi, 2004; Reardon
et al, 2003) found a positive association between market participation and farmer group
membership. Alene, et al (2008) found mixed results: their results show that membership to a
farmers’ group decreased market participation, but it significantly enhanced participation
intensity for maize farmers in Kenya.
Cattle farmers supplying an export abattoir can sell cattle directly under their own contact
or indirectly through another’s party’s contract. With own contracts, the farmer signs a direct
31
contract with the abattoir and promises to deliver a specified amount of cattle in a specified
period. With an indirect contract, farmers sell cattle under a farmers association’s contract or
under another individual’s contract. Approximately 57% of respondents supply cattle under their
own contracts. Contracting is essential for the export abattoirs because of the degree of asset
specificity of their physical investments, i.e. their processing plants and feedlots. The use of
these facilities is highly specialized; thus, it is not easy redeploy them to alternative uses without
sacrificing their productive value. In addition, it is costly for the export abattoirs to operate
below a certain level of slaughtering capacity. Hence, contracting is an important institutional
arrangement to assure a profitable capacity utilization level by reducing hold-up problems. For
suppliers, signing a contract provides a kind of market guarantee for slaughter allocation
especially during the peak season. There is a greater element of trust through direct contracts and
should the seller fail to deliver the promised quantity, it is easier for the buyer to follow-up. On
the other hand, with indirect contracts there is another layer of partners between the buyer and
the seller; this makes it more difficult to enforce the contract or to plan if the seller is not able to
deliver the promised quantity. In addition, direct contracting reduces transaction costs by
reducing incentive for opportunistic behaviors, including diverting the promised quantity to other
buyers.
Furthermore, research on the smallholder farmer participation and supply in modern
marketing channels of high value agricultural commodities and products highlights the use and
importance of contracts in the procurement of products by supermarkets and large-scale
distributors. In some cases it is a requirement for market entry. Results in these studies
(including Weatherspoon & Reardon, 2003; Reardon et al, 2003; Kirsten and Sartorius, 2002;
32
Reardon and Barrett, 2000) show that signing contracts with the buyer enhances market
participation and supply. As a result, we predict that direct contracts will have a positive effect
on the proportion of cattle sold to export abattoirs.
The variable that denotes whether a farmer is a part-time or full time farmer indirectly
captures some degree of information related cost. Part-time farmers are more educated, and they
work and live in urban areas where export abattoirs are located. Thus, they are likely to be better
informed about abattoir’s requirements and they are on average more likely to access
information at a lower cost than a full time farmer who lives in a remote location. As a result,
part-time farmers are expected to have a higher intensity of participation in the export channel.
However, most full time farmers rely solely on farming as their main source of income. Holding
all other factors constant, they are more likely to participate in multiple channels to diversify the
sources of the farm income and to respond to their different needs. As a result, we expect being a
full time farmer to have a positive relationship with the participation decision, although its
influence in the supply intensity decision is ambiguous.
The average total number of cattle per household in this sample is 171. Approximately
29.8% of the households have less than 50 cattle, 14% of the households own over 300 head of
cattle, while 5% of households own over 500 cattle. In this sample, the average number of herd
size per household was 266 in the Omaheke region, 179 in the Otjozondjupa region and 57 in the
Erongo region.
33
About 27% of households had at least primary school education, but the average number
of years of schooling in the Erongo region is just below primary school. Thirty percent of
respondents in the sample completed high school and 20% completed schooling beyond high
school. Education13 could enhance or decrease the probability of participation. It could increase
the probability of participation because education enhances the probability of accessing and
understanding information including market requirement. Arlene (2008) found education to
increase participation and supply among maize farmers in Kenya. Angula (2010) also found
education to enhance participation among coffee producers in Uganda. Balsevich (2006) found
mixed results on the effect of education on market participation of tomato producers in
Nicaragua, and Blandon et al (2009) found education to decrease market participation among
fruit and vegetable smallholder farmers in Honduras. The effect of education on supply intensity
could be negative because a more educated individual is most likely to have other sources of
income including formal employment.
Female-headed households make up 30% of the sample. We expect female-headed
households to participate less intensely in the export marketing channel because most female-
headed households in Namibia own less cattle compared to male-headed households: the average
total number of cattle in female-headed households is 96 cattle while the average total number of
cattle in male-headed households is 210.
13
Education was only included in the participation decision, but not in the intensity model. It was individually and statistically not significant when regressed against the dependent variable (proportion cattle sold to the export channel).
34
Having access to grazing land and water is vital in raising cattle, especially in a semi-arid
country where cattle graze extensively. On average, 25% of respondents have land titles. Having
a land title is expected to increase the probability of participation and intensity of supplying
cattle to the beef export channel. Research on household endowments of productive assets such
as land show a positive relationship between landholding and market participation (Barrett,
2008; Cadot et al, 2006; Heltberg & Tarp, 2002; Nyoro et al, 1999). Barrett (2008) indicates
that the association between landholding and gross market participation as a seller is striking and
clear in several studies on market participation in southern and eastern Africa. Having a land title
enables a farmer to access adequate grazing land, fatten cattle to meet the weight requirement of
export abattoirs. Compared to farmers on communal land, farmers on private land face limited
land degradation and bush encroachment problems as there is relatively less grazing pressure on
their land and their cattle face less stress especially during the dry season. Most importantly, land
is an important form of collateral that enables farmers to access credit markets, thus enabling
them to borrow and the make the necessary investments to increase the productivity and quality
of their enterprise. Communal farmers do not possess land titles cannot use land as a means to
access credit.
Similar to land, water availability is extremely important given that Namibia has a semi-
arid climate. Having running water at the homestead enables a farmer to give water to the cattle
without having to trek the cattle over a long distance, and thus it influences the quality and
weight of the cattle, and this further can influence a farmer’s channel choice. For example, if a
farmer in a communal area experiences frequent problems with water availability or there is a
drought, that farmer may decide to sell his/her young cattle rather than risk losing them, and
35
because the young cattle may not meet the weight required by export abattoirs, the farmer may
sell the cattle at an auction or permit. Having running water is predicted to enhance participation
and intensity of supply of cattle to the export channel. Labor is a critical factor in raising and
marketing. Cattle farmers on both communal land and private farms have to trek cattle over long
distances for grazing, to find water and to sell cattle. Some communal farmers rent land on
commercial land during prolonged dry seasons and need labor to care for their cattle. Also, cattle
theft is an increasing challenge to many farmers and workers are needed to find missing cattle.
Hired labor is expected to have a positive relationship with market participation and
supply intensity decisions. Reliance on family labor is expected to have a positive relationship
with market participation. Family labor includes both adults and children because both engage in
different activities related to cattle rearing. Children usually take cattle to water points and to the
veldt for grazing, trek cattle to marketing locations; adults engage in all the aforementioned
activities, but primarily responsible for cattle marketing, branding, finding lost cattle in distant
locations, etc. On average, 22% of respondents rely solely on family labor and 78% hire labor.
The average number of hired workers in this sample is 2.7 with a maximum of 80 workers.
The next section presents the estimation issues and is followed by the empirical results.
2.5.2 Potential Estimation Issues
Most of the ex ante transaction costs are generally exogenous because these costs occur
prior to the actual transactions. Before selling, a farmer spent time to find information about
prices and product requirements in certain marketing channels. Some ex post transaction costs
36
can be endogenous and should be treated with caution. For example effort to find transportation
could be endogenous. While the level of effort could determine the proportion sold to an abattoir,
it can also be determined by having chosen to sell to an export abattoir. One way to deal with this
is to find a variable that is related to transportation effort, but that is not determined by the
marketing channel (after controlling for all the other variables). In this paper distance to the
market is used as a proxy for transportation effort, because farmers take their location as given
(at least for a particular agricultural period’s marketing decisions).
The timing perspective of the dependent variable is important in whether some of the ex
post transaction costs are endogenous. Since it is measured in terms of historical sales to the
export abattoir, the speed of payment may not be a problem because a farmer has historical
knowledge of the speed of payment in a particular marketing channel. Likewise, farmers also
have historical knowledge of the amount premium payments in the various channels. In addition,
we tested whether payment delay and whether a farmer receives a premium are endogenous, and
the tests revealed that they are not endogenous.
Most of the farmer characteristics are exogenous. However, herd size could be
endogenous. Farm size is an alternative variable to approximate a farmer’s capacity to supply.
However, it is difficult to measure in the context of Namibia where the majority of farmers live
in communal areas where their cattle graze extensively and sometimes in more one communal
area. Herd size is more appropriate to measure capacity than farm size in the context Namibia’s
communal land set up. Herd size was tested for endogeneigty: first, I regressed herd size against
37
the other explanatory variables and obtained its residuals, then regressed the dependent variable
(proportion of cattle sold to the export channel) against the other explanatory variables
and the herd size residuals, and then tested significance of herd size residuals from this
regression. It was statistically not significant at the 1% significance level. Therefore, I rejected
the null hypothesis that herd size is endogenous. The next section discusses the empirical results.
38
2.6 Empirical Results
2.6.1 The Participation Decision Results
Two participation models were estimated and the marginal effects are provided for the
whole sample and for a communal farmers sub-sample. The participation model using the whole
sample fits the data well with 61% of participation outcomes being correctly predicted and the
Wald test of the hypothesis that all regression coefficients jointly equal zero is rejected. The
pseudo R-square for the model is 0.32. The sample size for the whole sample was 200 and 145
for the communal farmer sample. Overall, the model fit the data well and grade uncertainty,
membership in a farmers’ organization, having a transport equipment, ownership of a land title
gender of household head, reliance on family labor, and having running water at the homestead
were statistically significant.
The transaction costs variables were all found to be significant in at least one model.
Table 2c shows that grade uncertainty is statistically significant at the 10% significance level,
and on average, it decreases the probability of participation by 21%. Farmers who were
interviewed expressed concern regarding grade uncertainty at export abattoirs. This is because,
grading at abattoirs is based on deadweight carcass; upon arrival cattle have to wait 24 hours
before slaughter after having been transported over a long distance. In addition, most farmers are
not present to monitor the handling of their cattle at the abattoirs, which decreases their level of
trust in grading by the export abattoir. Results for communal farmers show that grade uncertainty
reduces the likelihood of participating in the export channel, but it was not significantly.
Distance (km) -0.00343* (0.00202) -0.00524 (0.00323) Farming time (full =1; part =0)
-0.640*** (0.247) -0.627 (0.410)
Transport Vehicle (yes=1) 0.389 (0.444) 0.665 (0.577) Farmer Characteristics Cost per head (N$/head) 0.000625** (0.00029) 0.000677** (0.000281) Running Water (yes=1) 0.604 (0.382) 0.410 (0.379) Hired Labor (number) 0.0489 (0.0440) 0.168 (0.158) Total Herd 0.000775 (0.000670) 0.00275** (0.00126) Gender of head (female=1) -0.211 (0.292) -0.292 (0.461) Inverse Mills Ratio 0.377 (0.407) 1.138 (0.796) Constant 0.293 (0.863) -0.505 (1.000) Observations
Pseudo R2
Wald χ2(12) AIC BIC
75 0.403 232.36*** 1.261 -249.12
39 0.3799 167.32*** 1.533 -86.448
Note: *, **, *** represent significance at 10%, 5%, and 1%
45
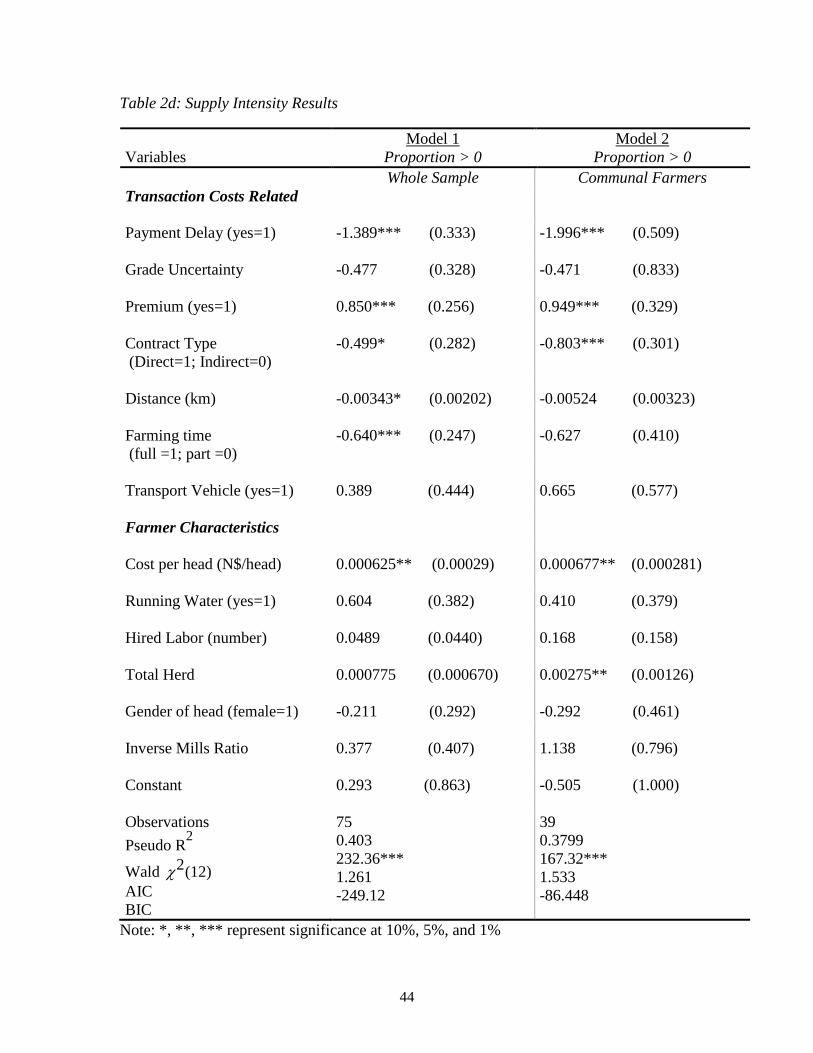
The pseudo R-square of both supply intensity models are good with 40% for the whole
sample and 38% for the communal farmers’ subsample. The Wald test results show that all the
regression coefficients in both models are statistically jointly significant. Payment delay,
premium, farming time, having a direct contract with the export abattoir, distance, total herd and
cost per head were statistically significant in both models. The results show that transaction costs
do matter in farmers’ intensity of participation in the export channel. Approximately 71% of the
transaction costs variables are statistically significant.
Consistent with a priori expectations, payment delay has a negative effect on the
proportion of cattle that farmers sell to export abattoirs. Payment delay is significant at the 1%
level. Farmers who strongly prefer to be paid immediately supply less to the export abattoirs.
This result implies that payment delay strongly deters farmers from selling cattle to export
abattoirs. In addition, many communal farmers who sell cattle to pay school fees or to finance
emergencies prefer immediate payment. Thus, if export abattoirs want to attract more communal
farmers, they must address payment preferences of these cattle suppliers.
Surprisingly grade uncertainty was not significant in both models. Grade uncertainty
reduces the proportion of cattle that farmers sell to export abattoirs. It is possible that farmers
who have supplied strictly greater than zero proportions to the export abattoirs over a number of
years, developed a stronger level trust and relation with the buyer, and thus face less grade
uncertainty compared to farmers who do not supply regularly. As a result, grade uncertainty is
not significant which is consistent with previous findings (including Reardon et al, 2008; Pingali
et al, 2008; Jaffee et al, 2004 & Farina et al, 2000.)
46
Premium has the expected positive effect on the proportion of cattle sold into the export
channel. It was significant at the 1% level in both models. Premiums offered by export abattoirs
provide incentives for farmers to supply cattle and to meet most of their delivery promise.
Premiums are based on the quantity that farmers deliver and farmers receive additional payment
when they deliver at least 90% of their delivery promise.
A surprising result is that having a direct contract14
with an export abattoir has a negative
effect on the proportion of cattle that an average farmer sells to export abattoirs. This was
significant at the 10% level in model 1 and it was significant at the 1% level for communal
farmers in model 2. There are two possible explanations for this result: first, this result shows
that farmers who sell under direct contracts sell proportionally less to the export channel.
Farmers who sell under direct contracts tend to have more cattle to sell and they are most notably
commercial farmers. In this sample, farmers under direct contract sold on average 94 cattle and
those who sold under indirect contract sold an average of 22 cattle. Since these farmers sell on
average more cattle, they tend to participate more in the other marketing channels, especially
auctions, where they are paid immediately. Thus, while on a whole they sell more cattle in
absolute value, they proportionally sell less to export abattoirs. Because they have more cattle to
sell, they can participate more in the other marketing channels to diversify their sources cash
flow.
Second, the results imply that indirect contracts are highly significant in communal
farmers’ supply decisions to sell to export channel. An individual communal farmer sells on
14
Contract type was interacted with a size dummy (large=1). The coefficient was positive, but statistically insignificant and the overall results did not change.
47
average fewer cattle on his own and may therefore not be able to sign a direct delivery contract
with an export abattoir. However, when that farmer pools resources together with other farmers
and organizes to deliver through the farmers’ association he/she can deliver to the export abattoir
through an indirect contract. Besides limited capacity, the uncertainty of not being able to deliver
the promised quantity of cattle to the export abattoir could hinder communal farmers from
signing direct contracts
Distance to the market where cattle is sold has a significant and negative impact on the
proportion of cattle sold to the export channel. While distance to the market is negative in both
supply intensity models, it is significant at the 10% level in model 1, but it is not significant in
model 2. Model 1 captures more farmers who are located farther away from the export abattoirs
compared to model 2. The average distance from the farm to the market for farmers who
supplied strictly greater than zero proportions in model 1 is 65 km. On the other hand, the
average distance for communal farmers who supplied strictly greater than zero proportions is 39
km.
Being a full-time farmer has a negative effect on the proportion of cattle on average
farmer sells to an export abattoir. This variable is significant at the 1% level in model 1, but it is
not significant in model 2. This result indicates that an average full-time farmer sells
proportionally fewer cattle to export abattoirs compared to the average part-time farmer. This
result is supported by the data: overall, the average proportion of cattle sold by a full-time farmer
is 0.15 compared to 0.25 sold by a part-time farmer. Furthermore, full-time communal farmers
participate the least intensely: full-time communal farmers sold a proportion of 0.07 of their
48
cattle to the export channel compared to 0.23 sold by part-time communal farmers. The reason
for this is because part-time farmers are more likely to have access to better marketing
information and they are more likely to be better informed regarding the procurement
requirements by export abattoirs because most part-time farmers work and reside in urban areas
where export abattoirs are located. In addition, the data suggest that part-time farmers have on
average more years of schooling compared to full-time farmers: an average part-time farmer
completed high school while an average full-time farmer only completed primary school. Also,
77% of the farmers who have completed university15
training are part-time farmers. These
information advantages mitigate transaction costs and enable them to supply more intensely.
Lastly, most full time farmers rely solely on farming as their main source of income.
Holding other factors constant, they are more likely to participate in multiple channels to
diversify their sources of farm income and to meet their needs at different times of the year.
Hence, while they may sell more cattle in absolute number, they sell proportionally less to one
particular channel to diversify their farm income sources.
The per unit cost variable includes both variable costs such as farm operational costs
(includes diesel, electricity), cattle input costs (e.g., licks, water, vaccination), costs related to
improving the quality of cattle (e.g., buying a bull), and fixed costs expenditures such as
installing a borehole and costs related to fencing the farm. The results show that per unit cost has
a positive effect on the proportion of cattle sold to export abattoirs. It is significant at the 5%
level in both supply intensity models. The interpretation of this variable is somewhat problematic
15
Education (measured by the number of years of schooling) did not have individual nor joint significance in the supply intensity models, and it was thus not included in the final models.
49
simply because variable and fixed costs are not treated separately in the data set. Barrett (2006)
found fixed costs to have a significant positive effect on the quantity of cattle sold in the market
among livestock pastoralists from Kenya and Ethiopia, while variable costs had a significantly
negative effect on sales volume. The results of this study imply that the more a farmer spends per
head, the higher the proportion of cattle the farmer sells to export abattoirs. Furthermore, the
implication is that farmers who spend more per head are more likely to meet requirements by
export abattoirs including weight and grade specifications. Farmers who sold cattle to the export
abattoir spend on average twice per head compared to those farmers who did not sell. The data
show that the average annual cost per head for farmers who sold cattle to export abattoirs is
$N528, which is about $69 USD at the current exchange rate. On the other hand, farmers who
did not sell to the export channel spent on average approximately N$239 (about $31 USD)
annually per head. In this data set it is more likely that fixed costs outweigh variable costs for the
farmers who sold strictly greater than zero proportions to the export abattoir because the majority
of these farmers are commercial farmers who make investments on their land since they own the
land. In this case, our results are consistent with previous findings by Bellemare et al (2006).
While some communal farmers participate in the export channel, others may choose to
forgo the export channel because they would have to spend more money per head. Thus, some
farmers may be maximizing their incomes by choosing to forgo the beef export channel due to
higher per unit costs16. Again, Bellemare et al (2006) find fixed costs to have an increasing, but
16 Per unit cost had a negative effect on participation, but it was individually and jointly insignificant (it was not included from the participation model).
50
concave effect on market entry. Thus, when costs are extremely high, at some critical amount,
farmers may choose not to enter the market.
Total herd size is significant at the 5% level for communal farmers. This result is
consistent with previous research (by Barrett et al, 2006; Lybbert et al, 2004; Little et al, 2001).
Being a female-headed household has a negative, but statistically insignificant effect on the
proportion of cattle sold to the export channel. Thus, female-headed households not only have a
lower probability of market entry, but they also supply less intensely once they enter. Female-
headed households represent 17% of the respondents who supplied greater than zero proportion
of cattle. While farmers’ endowment of productive assets including land, labor and running
water is significant in farmers’ participation decisions, total herd size and the cost of raising
cattle for the export channel play a critical role in their intensity of supply decisions.
Overall, the impact of transaction cost related variables on farmers’ intensity of
participation in the beef export channel is significant. Payment delay, distance to the market and
supplying through a direct contract significantly reduce the proportion of cattle that farmers sell
to the export channel. On the other hand, premium and being a part-time farmer significantly
increase the intensity of supply in the export channel. Total herd size and the type of contracts
that a farmer has with the export abattoir are significant in communal farmers’ decision on how
much to supply the export channel. Access through indirect contracts (e.g. through farmers
associations) is key for communal farmers’ intensity of participation in the beef export market.
51
2.7 Conclusion and Policy Recommendations
Primary data collection on cattle farmers in Namibia was used to assess the effects of
transaction cost related variables and socio-economics variables on farmers’ participation, and
the degree of their participation in the international beef export market. This study used a double
hurdle model with a probit model measuring participation and a fractional logit model assessing
the intensity of supply to answer the key research question.
The results revealed that transaction costs have a significant effect on farmers’ market
entry and intensity of supplying in the beef export channel. Grade uncertainty had a significantly
negative impact on market entry and payment delay significantly reduces farmers’ intensity of
supply to export abattoirs. Furthermore, membership in a farmer association was highly
significant in cattle farmers’ participation in the export market and it plays a critical role in
intensity of supply for communal farmers. Farmer organizations appear to play a paramount role
in mitigating transaction costs and give farmers a platform to pool resources together. The
empirical results point to practical, yet important actions that will partially address the limited
supply of cattle from communal areas. Export abattoirs should address grade uncertainty and
payment delay issues by shortening the lag between payment and delivery of cattle; these actions
will give strong incentive for communal farmers to sell more to export abattoirs. Results show
that farmers’ associations are an important institution for both market entry and the degree of
market participation. I recommend that export abattoirs form increased partnerships with
farmers’ associations, especially in communal areas. This will help both export abattoirs and
farmers to improve communication, build trust and address issues like grade uncertainty
efficiently, and increase a market-oriented mind-set among communal farmers. Such efforts will
52
in the medium to long-term benefit the export abattoirs to minimize supply constraint problems
as they seek new markets, and they will also increase their operating capacity and bottom line.
The results provide evidence that programs such as premiums that provide incentive for
farmers to supply to export abattoirs seem to be working. These programs should be continued
and must be innovatively extended to address the different issues facing various cattle farmers.
Results reveal that farmers who own land titles participate more, overall, these farmers tend to be
commercial farmers. This paper did not directly address or model land distribution issues, but the
result on the effect of private land ownership on market entry supports increased access to land
as a policy approach for government. I recommend that the government of Namibia revisit its
land reform policy17. Effective land reform policies that result in more land ownership among
communal farmers, that assure that the ‘right’ people are resettled and clearly assign property
rights, and that provides post resettlement support for farmers to ensure productive use of the
land is key to increasing farmers’ participation in the beef export channel and to address supply
constraints challenges.
Female-headed households have a significantly lower probability of participating in the
beef export market and those who participated supplied less proportion of cattle to export
abattoirs. As a result, development projects and private-governmental partnerships must channel
resources to increase female participation in the international beef export market. In addition,
17 The current “willing seller, willing buyer” basis of the policy has not produced efficient and increased land resettlement of communal farmers.
53
there is a need to further analyze the underlying factors that limit female-headed households
participation.
Results show the importance that farmer organizations play in market entry decisions for
communal farmers. Investing in and strengthening these type of organizations and increasing
their role in marketing and educational information dissemination to farmers is important. While
changing the cultural mindset of a pastoral cattle farmer is challenging, efforts that show the
benefits of selling cattle when prices are high instead of just when the need arises combined with
information on using the well developed banking system in Namibia to save money can slowly
change communal farmers’ marketing behaviors to improve their incomes, and eventually
alleviate rural poverty in Namibia.
Due to data limitations this study did not directly address information related transaction
costs. Information related constraints were captured through other variables including
membership in farmers’ associations and whether a farmer farms full time or part time. Direct
proxies for information related transaction would add value to empirical results. The quantitative
results do not capture the cultural and sentimental value that farmers attach to cattle. Since these
values influence farmers’ marketing decisions, further research should incorporate this aspect in
the modeling. In addition, farmers participate both as sellers and buyers in the various marketing
channels. Due to data availability this paper analyzed the cattle farmers’ decision to sell, and not
to buy. Further research would be useful to incorporate both aspects.
54
Overall, this paper sheds light on important factors that significantly affect marketing
decisions of cattle farmers in Namibia. Its findings reveal practical policy options for various
stakeholders in the Namibian beef industry that can increase farmers’ participations in beef
export channel, and thereby increase rural cattle farmers’ incomes.
55
APPENDICES
56
APPENDICES
APPENDIX 2A Figure 2a. Map of Namibia
For interpretation of the references to color in this and all the figures, the reader is referred to the electronic version of this dissertation.
57
APPENDIX 2B Table 2a: Number of Cattle Sold (1998-2008) Year Export Abattoirs Live (South Africa) Butcheries 1998 126,824 148,739 26,620 1999 159,522 152,416 20,021 2000 140,589 79,969 22,956 2001 142,624 110,127 41,073 2002 149,833 148,350 15,654 2003 143,885 150,601 9,950 2004 139,162 144,573 9,191 2005 141,348 210,945 8,477 2006 132,991 172,790 12,016 2007 134,341 172,587 10,893 2008 128,819 127,426 9,798
Source: Meat Board of Namibia Note: Live (cattle bought at auctions and permits), Butcheries: sell processed meat, cut meat further and sell to retailers and end-consumer; abattoirs: buy and slaughter live cattle, sell at a wholesale level. APPENDIX 2C Figure 2c: Marketing of Cattle Production in Numbers (1998-2008)
Marketing of Cattle Production
0
50,000
100,000
150,000
200,000
250,000
1998
1999
2000
2001
2002
2003
2004
2005
2006
2007
2008
Year
Export
Live (SA)
Butchers
Source: Author based on Meat Board of Namibia data; “Export” refers to export licensed abattoirs; “Live” includes cattle sold at auctions and permits
58
APPENDIX 2D Figure 2d: Average Producer Price (N$/kg) by Grade (2002-2008)
Average Producer Price
0
5
10
15
20
25
2002 2003 2004 2005 2006 2007 2008
Year
A2
AB2
C2
C0
Source: Author (based on Meat Board of Namibia data) Note: The numbers next to grade refer to number of teeth that the cattle has
59
Appendix 2E Figure 2e: Average Beef Carcass Grade Distribution (2005-2008)
Beef Carcass Distribution (%)
13%
25%
38%
24%
A
AB
B
C
Source: Author based on Meat Board of Namibia data; only grade A and AB is exported to the EU market
Appendix 2F: Asymptotic Variance of Estimators in Fractional Logit Model
Papke and Wooldridge (1996) estimate the asymptotic variance of the ̂ β to be
ˆ A −1 ˆ B A−1 where ˆ A −1 is the inverse of the estimated Hessian matrix
where ˆ A ≡ˆ g i ′ x i xi
ˆ G i 1− ˆ G i( )[ ]i =1
N
∑ , and G ˆ β ,x1,x2,...,xN( )≡ ˆ y i is the expectation of yi and ˆ g i ≡ g xiˆ β ( ).
ˆ B ≡ˆ u i2gi
2 ′ x i xi
ˆ G i 1− ˆ G i( )[ ]2i =1
N
∑ is the outer product of the estimated first derivative of the log-likelihood
function, and ̂ u = yi − G xiˆ β ( ).
60
REFERENCES
61
REFERENCES
Abdulai, A. (2009). Determinants of Non-farm Earnings of Farm based Husband and Wives in Northern Ghana. American Journal of Agricultural Economics. 81(2) 117-130.
Alene, A., Manying, V., Omanya, G., Mignouna, H., Bokanga, M, & Odhiambo, G. (2007). Smallholder market participation under transaction costs: maize supply and fertilizer demand in Kenya. Food Policy. 33, 318-328.
Angula, M. (2010). Determinants of Sustainable Coffee Marketing Channel Choice and Supply Response among Organic and UTZ Certified Smallholder Farmers: Evidence from Uganda. Master’s Thesis. Michigan State University. Michigan.
Aristei, D., Perali, F., & Pieroni, L. (2007) Cohort, Age and Time Effects in Alcohol Consumption by Italian Households: A Double Hurdle Approach. Empirical Economics. DOI 10.1007/s001818-007-0142-5.
Balagtas, J. and Coulibaly, J. (2007). Dairy Market Participation with Endogenous Livestock Ownership: Evidence from Cote d’Ivoire.
Bailey, D. (1999) et al. Livestock Markets and Risk Management among East African Pastoralists: A Review and Research Agenda. Working Paper
Bailey, D. and Hunnicutt. (2002). The role of Transaction Costs in Market Selection: Market Selection in Commercial Feeder Cattle Operations. Paper presented at the American Agricultural Economics Association Annual Meeting, CA, 2002.
Balsevich, F. (2006) “Essays on Producers’ participation in market channels in Central
America. A Ph.D. Dissertation. Department of Agricultural Economics, Michigan State University.
Barrett, C. (2008). Smallholder Market Participation: Concepts and Evidence from Eastern and Southern Africa. Food Policy. 33(4), 299-317.
Barrett, C.B. (1997). Food Marketing Liberalization and Trader Entry: Evidence from Madagascar. World Development. 25(5), 763-777.
62
Bellemare, M.F., & Barrett, C.B. (2006). An Ordered Tobit Model of Market Participation: Evidence from Kenya and Ethiopia. American Journal of Agricultural Economics. 88(2), 324-337.
Blandon, J., Henson, S., & Cranfield, J. (2009). Small-scale farmer Participation in New Agrifood Supply Chains: Case of the Supermarket Supply Chain for Fruit and Vegetables in Honduras. Journal of International Development. 21(7), 971-986.
Blundell, R.W. and Meghir, C. (1987). Bivariate Alternatives to the Univariate Tobit Model. Journal of Econometrics. 34 (1), 179-200.
Cadot, O., Du Toit, L. & O'Larreaga, M. (2006). How Costly Is It for Poor Farmers to Lift
Themselves out of Subsistence? World Bank Policy Research Working Paper No. 3881.
Coase, R.H. (1937). The Nature of the Firm. Economic, 4: 386-405.
Cragg, J. (1971). Some Statistical Models for Limited Dependent Variables with an Application
for Durable Goods. Econometrica. 39(5), 829-844.
De Janvry, A., Fafchamps and Sadoulet (1991). The Peasant Household Behavior with Missing
Markets. Some Paradoxes Explained. The Economic Journal. 101(), 1400-1417.
Delgado , C. (1995). Agricultural Diversification and Export Promotion in sub-Saharan Africa. Food Policy. 20 (3). 225-243.
Eggertson, T. (1999). Effective Behaviors and Institutions. Cambridge Survey Economic Literature. Reprint. Cambridge University Press, Cambridge.
FAO, 2006, “Livestock Report”. www.fao.org.
Farina E., and Reardon T. (2000). Agrifood Grades and Standards in the Extended Mercosur: Their Role in the Changing Agrifood System. American Journal of Agricultural Economics, 82( 5), 1170-1176.
63
Ferto. I. & Szabo, G. (2002). The choice of Supply Channel in Hungarian Fruit and Vegetable Sector. Paper Presented at the American Agricultural Economics Association Annual Meeting. Long Beach , CA.
Goetz, S. (1992). A selectivity Model of Household Food Marketing Behavior in Sub-Saharan Africa. American Journal of Agricultural Economics. 74(2), 444-452.
Gong, W. & Zhou, Z. (2007). Transaction costs and cattle farmers’ choice of marketing channels in China: A Tobit Analysis. University of Sydney, Sydney, Australia.
Gourierroux, C., Monfort, A., & Trognon, A. (1984). Pseudo-maximum likelihood methods: theory. Econometrica. 52, 6821-700.
Hausman, J., Abrevaya, J., & Scott-Morton, F. (1998). Misclassification of the dependent variable in discrete-response setting. Journal of Econometrics. 87(2), 239-269.
Heltberg, R. and Tarp, F. (2002). Agricultural Supply Response and Poverty in Mozambique.
Food Policy. 27(1), 103-124.
Hernandez, R. (2009). Supermarkets, Wholesalers and Tomato Growers in Guatemala. A Master’s Thesis. Michigan State University. Michigan.
Hobbs, J. (1997). Measuring Transaction Costs in Cattle Marketing. American Journal of Agricultural Economics, 79(4), 1083-1095.
Holloway, G., Nicholson, C., Delgago, C., Staal, S. & Ehui, S., (2000). Agro- industrialization through institutional innovation: Transaction costs, cooperatives and milk-market development in the east-African Highlands. Agricultural Economics. 23(), 279-288.
Holtzman, J. (1992). Livestock Marketing and Trade in the Central Corridor of West Africa. Agricultural Marketing Improvement Project, Sahel West Africa Office. USAID, Washington DC.
Jaffee, S. & Henson, S. (2004). Standards and Agro-Food Exports from Developing Countries: Rebalancing the Debate. World Bank Policy Research Paper No.3348.
Jaffee, S. & Morton, J. (1995). Marketing Africa’s High Value Foods: Comparative Experiences
of an Emergent Private Sector. Dubuque, Kendall Hunt Publishing Company.
64
Jones, A. (1989). A Double Hurdle Model of Cigarette Consumption. Journal of Applied Econometrics. 4 (1), 23-39.
Kakujaha-Matundu, O. (2003). Common Pool Resource Management: The case of Eastern Communal Rangelands in Semi-Arid Namibia. Shaker Publishing, The Netherlands.
Kirsten, J. & Sartorius, K. (2002). Linking Agribusiness and Small-scale farmers in Developing Countries: IFPRI Working Paper. Washington.
Key, N., Sadoulet, E. & de Janvry, A. (2000). Transaction cost and the agricultural household supply response. American Journal of Agricultural Economics. 81(1), 245-259.
Kydd, J. & Doward, A. (2003). Implications of Market and Coordination failures for Rural Development in Least Developed Countries. Paper Presented at the Development Studies Association Annual Conference, Strathclyde University, Glasgow, September, 10-12.
Little, P.D., Smith, B.A., Cellarius, D.L, Coppock, & Barrett, C.B., (2001). Avoiding Disaster: Diversification and Risk Management among East African Herders. Development and Change. 32, 401-433.
Liu, J., Liu, J., Hammit, J. & Chou, S. (1999). The Price Elasticity of Opium in Taiwan. Journal of Health Economics. 18(6), 795-810.
Lybbert, T., Barrett, C., Desta, S. & Copock, D. (2004). Stochastic Wealth Dynamics Risk Management among a Poor Population. Economics Journal. 114, 750-777.
Makhura, M.T. (2001). Overcoming Transaction Costs Barriers to Market Participation of Smallholder Farmers in the Northern Province of South Africa. Unpublished PhD Thesis. University of Pretoria Thesis and Dissertations.
MacInnis, B. (2003). Transaction Costs and Organic Marketing: Evidence from U.S. Organic Framers. Selected paper for Presentation at the American Agricultural Economics Association Annual Meeting, Denver, Colorado, August, 1-4.
65
Minot, N. & Ngigi, M. (2004) Are Horticultural Exports a Replicable Success Story? Evidence from Kenya and Cote d’Ivoire. EDPTD Discussion Paper N0. 120. IFPRI, Washington.
North, D. (1990). Institutions, Institutional Change and Economic Performance. New York: Cambridge University Press.
North, D. (2005). Institutions and Performance of Economies over Time. In Menard C. (Ed): Handbook of New Institutional Economics. Springer, The Netherlands.
Nyoro, J.K., & Ngugi, I.K. (2007). A Qualitative Analysis of Success and Failure factors of Agricultural Co-operatives in Central Kenya. In: Barrett, C.B., Mude, A.G., Omitim, J.M (Eds), Decentralization and the Social Economics of Development. Lessons from Kenya. CAP International.
Okello, J. et al. (2007). Compliance with International Food Safety Standards in Kenya’s Green Bean Industry: Comparison of a Small and a Large-scale Farm producing for Export. Review of Agricultural Economics, 29(2).
One World Action. (2006). Making Trade Work for Women: The Likely Impact of Economic Partnership Agreements on Women Rights and Gender Equality: Beef Sector in Namibia
Papke and Wooldridge, J. (1996). Econometric Methods for Fractional response Variables with an Application to 401(k) Rates. Journal of Applied Econometrics. 11(6), 619-632.
Paskin D. et al (2005). Animal welfare and developing countries: opportunities for trade in high-welfare products from developing countries. Rev. sci. Off. Int. Epiz. 24 (2), 783-790.
Pingali P. (2008). The Transformation of Agri-food Systems: Globalization, Supply Chains and Smallholder Farmers. Food Agriculture Organization of the United Nations and Earthscan. London. Sterling, VA.
Poulton, C., Gibbon, P., Hanyani-Mlambo, B., Kydd, J., Maro, W., Larsen, M.N. Osorio, A., Tschirley, D. & Zulu, B. (2004). Competition and Coordination in Liberalized African Cotton Market Systems. World Development. 32(3), 519-536.
66
Reardon, T. and Barrett, C.B. (2000). Agroindustrialization, Globalization & International Development: An Overview of Issues, Patterns and Determinants. Agricultural Economic. 23, 195-205.
Reardon, T., Timer, C.P, Barrett, C.B., and Berdegue, J. (2003). The Rise of Supermarkets in Africa, Asia, and Latin America. American Journal of Agricultural Economics, 85(5), 1140-1146.
Reardon, T. & Hopkins, R. (2006). The Supermarket Revolution in Developing Countries: Policies to Address Emerging Tensions Among Supermarkets, Suppliers and Traditional Retailers. The European Journal of Development Research. 18, 522-545.
Reardon, T. Timmer, C., & Berdegue, J. (2008). The Rapid Rise of Supermarkets in Developing Countries: Induced Organizational, Institutional and Technological Change in Agri-food Systems Chapter 2. In The Institutional Agrifood Systems.
Ruben, R., Lu, H. & Kuiper, E. (2003). Marketing chains, transaction costs and quality performance: efficiency and trust within the vegetable supply chain in Nanjing City. Paper presented at the SERENA Seminar, Nanjing, (October).
Ruben, R., Boselie, D., & Lu, H. (2007). Vegetable procurement by Asian supermarkets: a transaction cost approach. Supply Chain Management: An International Journal. 12(1), 60-68.
Sadoulet, E. and de Janvry, A. (1995). Quantitative Development Policy Analysis. Johns Hopkins University Press, Baltimore.
Sivakumar, A. & Bhat, C.R. (2002). Fractional Split Distribution Model for Statewide Commodity Flow Analysis Transportation Research Record. 1790, 80.
Staal, S., Delgado C., & Nicholson C. (1997). Smallholder Dairying under Transaction Costs in East Africa. World Development. 25(5), 779-794.
Wagner, J. (2001). A Note on the Firm Size – Export Relationship. Small Business Economics. 17(4), 229-237.
67
Weatherspoon, D. & (2006). Supermarkets Procurement Practices in Developing Countries: Redefining the role between Public and Private Sectors. American Journal of Agricultural Economics. 85(5), 1155-1161.
Williamson, O. (1986). Economic Organization: Firms, Markets and policy Control. Hertfordshire, UK: Harvester Wheatsheaf.
Williamson, O. (1985). The Economic Institutions of Capitalism. New York. Free Press.
Williamson, O. (1975). Market and Hierarchies: Analysis and Antitrust Implications, New York, Free Press.
Wooldridge, J. (2003). Introductory Econometrics: A modern Approach. Thomson South-Western.
Wooldridge, J. (2002). Econometric analysis of cross section and panel data. Cambridge, Massachusetts Institute of Technology.
World Bank Report. (2008). Agriculture for Development. World Bank. Washington DC.
Ye, X. and Pendyala, R. (2004). A Model of Daily Time Allocation Using Fractional Logit Methodology. Selected Paper for 84th Annual Meeting of Transportation Research Board. Washington D.C., 2005.
Yen, S. & Huang, C. (1996). Household Demand for Finfish: A generalized Double Hurdle Model. Journal of Agricultural Economics. 21(2), 220-234.
Zhang, F. (2006). Modeling Fresh Organic Produce Consumption: A Generalized Double Hurdle Model Approach. Selected Paper for the Southern Agricultural Economics Association Annual Meeting, Orlando, Florida, Februar5-8.
68
CHAPTER 3:
IMPORT COMPOSITION EFFECTS OF THE EU TRADE POLICY REFORMS: T HE CASE FOR BEEF IMPORTS FROM NAMIBIA
3.1 Introduction
There is uncertainty regarding the status and potential effects of the EU economic
partnership agreement (EPA) with the Southern African development community (SADC). The
aim of the proposed economic partnership trade agreement is to establish a new trading
relationship between the EU and African, Caribbean and Pacific (ACP) countries that will
enforce compliance to the WTO rules of non-discriminatory trading arrangements. As a result,
EPAs are free trade agreements with the salient feature of reciprocity18
in contrast to the former
Lomè Agreement that was non-reciprocal (Stevens, 2004). There is concern regarding the
potential effects of increased competition for domestic producers and lower trade tax revenue for
governments in the SADC region. Moreover, the impact of the trade policy reforms on sensitive
agricultural sectors of ACP countries that had historically enjoyed preferences under various
commodity protocols is a major concern. This is the case with the Namibian beef sector.
18
Reciprocity entails that trade preferences extended by one country or a group of countries (e.g.
EU) to another country or group of countries be designed with an obligation being placed on the
second group of countries to grant trade preferences to the first group of countries. Non-
reciprocal trade preferences to developing countries under WTO are allowed, but on a non-
discriminatory basis (i.e. all developing countries at the same level of development benefit from
the same trade preferences).
69
Although beef exports from Namibia constitutes only 2.9% market share of EU total beef
imports, the beef sector is a key sector for the Namibian economy and the EU is one of the
largest trading partners of Namibia. The agricultural sector contributes approximately 11% to
GDP in Namibia, but more than 60% of the population depends directly and indirectly on income
generated from the beef sector (AfDB, 2002). Furthermore, the beef sector accounts for 25% of
Namibia’s foreign exchange earnings (Bank of Namibia, 2005) and it is the number one source
of employment in the country19
. Approximately 31% of total Namibian exports destined to the
EU are food and agricultural products (COMEXT, 2006), of which approximately 50%
constitutes beef products. The combined value of Namibian beef and beef products exports is
about US$200 million (USAID, 2003).
In light of the sensitive role the beef sector plays in the Namibian economy, any new
trading arrangements that will arise deserves close analysis and empirical estimation. The
general objective of this study is to estimate the potential economic effects of the proposed EU-
ACP trade policy reforms on Namibian beef exports to the EU market. Specifically, we use
simulations to analyze how the three trade scenarios will affect the quantity and the quality
composition of imported beef from Namibia into the EU market. To illuminate quantity and
quality composition, five trade scenarios are analyzed, they are: (1) Preferential Market Access,
(2) the Economic Partnership Agreement and its alternatives, (3) the standard generalized system
of preferences (GSP), and two enhanced GSP options (4) GSP+ and (5) GSP
++.
19
Employing approximately 35,000 Namibians (Chiriboga et al 2008).
70
3.2 Literature Review
There are no empirical studies on the effects of the trade policy reforms on the Namibian
beef sector. The few existing studies are merely descriptive (Meyn, 2004, 2005 & 2007). Tekere
et al (2002) discusses the challenges that the Southern African Custom Union (SACU)20
countries face in the EPA negotiations with respect to the South Africa – EU free trade
agreement. A descriptive study by One World Action (2006) focused on the Namibian beef
industry and it examined the likely impact of EPAs on women’s rights and gender equality. In
general, there is a dearth of studies
that focus on specific agricultural sectors, and none empirically examine the trade effects of the
proposed EPAs and policy alternatives on the Namibian beef sector.
Several studies (Karingi et al, 2005; Busse et al, 2004; Tekere et al, 2003; Milner et al,
question of the potential effects of EPAs on ACP countries using general and partial equilibrium
models. Most of these studies examine the Viner's trade creation and trade diversion effects of
regional trade agreements and make inference regarding the impact on welfare depending on the
type of trade effects. Results from these studies are mixed. Tekere et al (2003) find that trade
creation effects outweigh trade diversion effects, and they reported larger positive welfare effects
with regional integration than without regional integration for the SADC region. On the other
hand, Milner (2005) reports larger trade diversion effects for the East African Community. In
almost all the studies large negative tariff revenue losses are reported. Other studies (Martin,
20
SACU is a custom union among Namibia, South Africa, Botswana, Swaziland and Lesotho.
71
2005 and Bouet et al, 2005) based their trade policy reform analyses on multi-country
simulations and concluded that large EU tariff reductions are required to increase EU imports.
It is difficult to assess the import composition effects of a trade agreement using large
aggregated data. Yet, there is an important relationship between product quality and the export
price that the exporting country receives. Wooldridge (2002) argues that even though export
prices are no longer exact measures of quality, they can still be used as indicators of quality.
CGE models provide important welfare results on the impact of the trade policy reforms on the
larger economy and related sectors, but they typically do so by a great deal of data aggregation.
Thus, detailed information available for thousands of tariff lines are reduced to 20 or 30
aggregate commodities (Martin W, et al 2003). Ramos (2010) points out those large-scale
models that take beef as a single commodity might underestimate the future growth of beef
imports by the EU, especially in light of market analysts who point out the growing trend of high
quality beef products imports into the EU market.
It is important to consider the quality composition aspect of beef exports in the context of
Namibia because of the dual nature of its agricultural system. There are two livestock farming
systems in Namibia: commercial and communal. The key distinction is that commercial farming
is operated on private land and commercial farmers hold land titles, while communal farmers
live on communal land shared as common property among many households. Approximately
70% of Namibia’s population lives in rural areas located on communal farm land and depend on
livestock farming for their livelihoods. There are approximately 4,000 commercial farmers in
Namibia holding an average of 7,000 hectares of land each located South of the veterinary line.
72
There are about 68,00021
communal farmers spread across the country with a greater
proportion located North of the veterinary line. Due to the dual system, commercial farmers
dominate Namibia’s beef export channel as they have greater capacity to fatten cattle to meet the
weight requirements demanded by the beef export abattoirs for cattle that yield more of the
prime cuts. On the other hand, communal farmers face many constraints and they tend to have
less heavy cattle that yield less prime cuts. Thus, an increase in the import demand of high
quality beef could result in the exclusion of certain types of suppliers, such as small communal
farmers. If so, this is an important factor to consider in the trade reform analyses so that capacity-
building measures can be put in place to address such an outcome.
Ramos (2010) studied the import composition effects of the ongoing EU-Mercosur trade
agreement on beef exports. This paper applies her approach to analyze the potential economic
and composition effects of the trade policy reforms on Namibia’s beef export to the EU market.
Since negotiations between the EU and ACP countries on the proposed trading regime are still
ongoing, this study has practical value in estimating the potential economic effects of the EPA
and other alternative trading policies on the Namibian beef sector.
The following section provides a background on the EU-ACP trade policy reforms,
discusses the five aforementioned trade policy alternatives in detail, and provides a background
of the Namibian beef exports.
21
Figures on communal farmers are difficult to come by; the 68,000 figures are based on a survey by the Namibia National Farmers Union (a communal farmers’ organization).
Trade preferences for many ACP countries were formalized under the Lomè Agreement
in 1975. In addition, separate trading protocols for bananas, sugar, and beef and veal became an
integral part of the EU-ACP trade relations. For example, with the beef and veal protocol, the EU
refunded the relevant ACP countries 90% of the tax that was normally paid for beef imports
(Eurostat, 2005). Agricultural products not included in specific commodity protocols were
subject to import duties that were far below those specified in the GSP (Bergtold, 2004).
Many countries would like to maintain preferential market access to the EU market, but
many question if it improved economic performance of ACP countries. Bergtold (2004) argues
that the use of non-reciprocal trade as a mechanism to stimulate export growth in the ACP
countries was unsuccessful, but he attributes low export performance primarily to supply-side
factors. Brenton and Ikezuki (2006) argue that the costs of satisfying the rules of governing
preferences reduce the extent to which they raise the actual returns in developing countries and
they conclude that preferences have done little to stimulate the export of a broader range of
products. McQueen et al (1999) attribute the export of primary commodities that tend to have
low income elasticity of demand as a major reason for the poor export performance of ACP
countries.
In a small number of countries such as Mauritius, preferences resulted in relatively strong
economic performance and diversification. Commodities that were granted preferential market
access under various EU commodity protocols have played a significant role in Mauritius’ rural
74
employment (Subramanian and Roy, 2003). While Panagariya (2005) is not a proponent of
preferential trading, he argues that through preferential market access many low income
countries have had access to EU internal prices kept artificially high to protect EU producers, but
depressed world market prices for various agricultural commodities such as sugar and beef. This,
he argues, benefits both exporting and importing countries of these agricultural commodities.
The one-way preferential provisions were challenged under the rules of WTO and
preferences granted for specific developing countries can only be maintained in a GATT-
consistent manner, on the basis of reciprocity (Milner, 2006). Consequently, with the expiration
of the Lomè IV convention in 2000, the EU initiated a new trading regime. In the Cotonou
Agreement that followed, the EU proposed various negotiations of EPAs to place trade between
the EU and ACP countries on a reciprocal footing under various regional configurations. Under
the proposed EPAs, ACP countries are expected to remove tariffs on “substantially all” (i.e.
most, but not all) imports from the EU during an implementation period (Kennan, J. et al, 2005).
Some countries entered into interim EPA agreements with the EU, but the nature of the new
interim trade regime has not been concluded yet. This uncertainty raises questions: will non-
reciprocal preferential market access be extended? If not, what degree of reciprocity will be
adopted in the final EPA agreement? What other trade policy alternatives may be pursued if an
agreement is not reached? And which trading scenario will most likely emerge? Based on the
interim EPA agreement, it is almost certain that non-reciprocal preferences will not be continued.
The next two sections provide a detailed description the proposed EPA trade agreement and its
alternatives.
75
3.3.2 EU-ACP Post Cotonou Trade Regime Alternatives
3.3.2.1 Economic Partnership Agreements (EPAs)
The current interim EPA provides duty-and quota-free market access for ACP countries
into the 27 EU member state. Since most ACP exports entered the EU market at relatively lower
duties, most of the trade liberalization will be required from ACP countries. Based on other free
trade agreements, substantially all trade has been defined as ranging from 86-90% of their traded
products (Ochieng, 2007). The expected economic effects of EPAs include loss of preference
margin, increased competition from the EU products, and government tariff revenue losses. The
proposed EPAs include an economic development component that aims to enhance foreign direct
investment, production and supply capacity of ACP countries.
There are three regional EPA groupings in Africa, namely Eastern and Southern Africa
(ESA), Economic Community of West Africa States (ECOWAS), and the Southern African
Development Community (SADC) of which Namibia is part of. Members of the EPA- SADC
configuration, except South Africa signed an interim EPA agreement with the EU in December
2007. However Namibia voiced several concerns that it wants the EU to address before it signs
the full EPA.
According to Weidlich (2008), the contentious issues that Namibia has reservations about
include the most favored nation (MFN) provisions demanded by the European Commission
(EC), which compels non-least developed countries (non-LDCs) including Namibia to extend the
same conditions to the EU as are contained in future trade agreements with any other countries.
In addition, Namibia voiced concern about the EC’s demand that export levies and taxes on
76
Namibian goods be scrapped as the country uses these as incentives for local value addition. The
EC further demands the abolition of internal quantitative restrictions on EU exports to the rest of
the Southern African Customs Union (SACU), which may be inconsistent with the regional trade
arrangements under both the SACU and SADC agreement. Negotiations are currently ongoing to
resolve these contentious issues, and to finalizing the interim EPA agreement.
These concerns attest to the tension inherent within the WTO between the principles of
reciprocity, and special and differential treatment (S&D)22
. This is at the heart of the differences
between the EU and ACP countries over the desirability, applicability and interpretation of
‘reciprocity’ (Ochieng, 2007). ACP countries prefer to maintain some preferential market access
justified under special and differential treatment of the WTO Enabling Clause23
, but the EU
prefers to satisfy the WTO rule of non-discrimination with the reciprocity requirement. What the
final full EPA agreement will entail remains uncertain, however it is most likely to mirror the
stipulations of the interim agreement with respect to market access, but it will have an additional
component related to the service industries, and a development and aid package. Failure to sign a
final EPA could result in the imposition of the standard (GSP) duties on export to the EU market
(Agritrade, 2007).
22 WTO Agreement contains provisions that give developing countries special rights and which give developed countries the possibility to treat developing countries more favorably than other WTO members. 23
It was adopted under GATT in 1979 and forms the legal basis for GSP and regional arrangements among developing countries [Decision of 28 November 1979 (L4903)].
77
3.3.2.2 The Generalized System of Preferences (GSP) and Enhanced GSP
Should negotiations fail, the GSP is an alternative trade regime between the EU and ACP
countries (Meyn, 2007; Agritrade, 2008). The concept of the GSP system is that industrialized
countries will autonomously grant developing countries special trade preferences, which will
exempt their exports from the normal custom duties. This creates incentive for traders to import
them and increase their competitiveness on the international markets (George, 2006). The
Enabling Clause of the GATT system in 1979 provided the legal foundation for the GSP system
and it was to be reviewed every ten years. Under this clause, preferential treatment provided
under the GSP must be ‘non-discriminatory, non-reciprocal and autonomous’. Tariff levels are
linked to the most favored nation (MFN) tariff levels for four categories of products, namely:
very sensitive, semi-sensitive, sensitive and non-sensitive.
The GSP system provides enhanced market access for LDCs under the Everything But-
Arms (EBA) initiative, but Namibia is classified as a lower-income developing country and is
not eligible for the EBA initiative. However, Namibia can try to get LDC classification on the
grounds that the calculation of its average income per capita does not take into account the
highly unequal income distribution24
and the number of people who live in poverty. For
example, in 2002 the Namibian minister of finance requested the USA to treat it as a LDC nation
under the Africa growth and opportunity act (AGOA)25
(Namibia Economist, 2006). As a result,
24
Namibia has the world’s most skewed income distribution with a Gini coefficient of 0.70 (UN Human Development Report (2007-2008). 25
AGOA is a trade agreement between the US and Sub-Saharan African countries.
78
the 2006 AGOA IV granted Namibia LDC-like status making it eligible for the “Special Rule”26
provisions. Therefore, it is reasonable to envision a possible scenario under which Namibia can
qualify for LDC provisions provided under the enhanced GSP system. We model two enhanced
GPS options: GSP+ and GSP
++. Both include a reduction from the MFN tariffs tariff levels. The
GSP+ has a quota but no specific tariffs and the GSP
++ is quota-free, but includes specific tariffs,
and both have ad valorem tariffs.
Under the standard GSP alternative, Namibia’s beef export could face the MFN rates
applied to other developing countries. On the other hand, under the enhanced GSP options,
Namibian beef exports could face ad valorem and specific tariff rates reductions27
under the
sensitive good category. Trade provisions under the GSP are usually not unconditional.
Conditions related to labor and environmental issues, and contingency of preferences on
minimum value addition rules apply and make the qualification process under the enhanced GSP
difficult. According to Panagariya A. (2002), these “side conditions” introduce a certain element
of uncertainty for exporters: the benefit may be withdrawn at any time under the pretext of a
specific standard not being fulfilled.
In spite of the current delays and tensions over its various components, the proposed EPA
trade policy regime is the most likely outcome of all three scenarios for several reasons: first,
while the reciprocity requirement makes the EPA option unattractive; duty-free and quota-free
26
Provides LDCs additional preference of duty-free and quota-free access for apparel made from fabric originating from anywhere in the world. 27
A 3.5. percentage point reduction of the MFN ad valorem and a 30% reduction in specific tariff (specified in Council Regulation (EC) No 732/2008: Section1 Article 6).
79
market access into the EU market as implemented through the interim EPA makes it very
attractive to suppliers. Second, the asymmetry in bargaining power between the negotiating
parties combined with ACP countries’ reluctance to jeopardize their relationship with the EU
bolsters the outcome of the EPA trading scenario. Third, the EU may be reluctant to agree to the
modified enhanced GSP trade scenario proposition on the grounds that it is more likely to be
challenged under WTO rules of reciprocity, even though it could be justified under the WTO
‘Enabling Clause’. Finally, as the EU continues to sign free trade agreements with other
countries (e.g. Mercosur countries) that grant ACP countries’ competitors enhanced market
access, ACP countries may experience pressure to finalize the full economic partnership
agreement.
Table 3a below summarizes the key trade components of the policy alternatives. The
trade policy simulations will be based on one base scenario option, the preferential market access
(PMA), and four possible trade agreements that will likely replace the PMA discussed above.
The next section provides a background on Namibian beef exports to the EU.
80
Table 3a Summary of the Trade Policy Alternatives
3.4 Namibia and the World Beef Market
Namibia has an annual total cattle population of approximately 2 million head. Since
1992, an average of 350,000 cattle are marketed annually of which 45% are sold to EU licensed
export abattoirs. Of the remaining, 35% are exported (primarily live) to South Africa (Meat
Board of Namibia Meat, 2007) and the rest is sold in the domestic market and other regional
markets in Southern Africa. The beef is exported as fresh and frozen (all boneless).
PMA EPA GSP (standard) GSP+/GSP
++
Key
Feature
Non-reciprocal Reciprocal Non-reciprocal Non-
reciprocal
Market
Access
Highly reduced
tariffs
Quota
Duty-free
Quota free
MFN tariff rates
Quota free
Reduced
MFN tariffs
Quota/quota-
free
Trade-
offs
- Preferences margin
- Enhanced market
access
- High tariff revenue
- WTO incompatible
- Preference margin
loss
- Enhanced market
access
- Competition from EU
beef products
- Tariff revenue losses
- WTO compatible
- Development support
- Increased
competition
- Less market
access
- No tariff revenue
losses
- High tariff costs:
may end beef
exports
- WTO compatible
- Increased
competition
- Limited
tariff revenue
losses
- WTO
compatible
81
Figure 3a: EU Beef Imports in 100kg from Namibia by Category, (1999-2009)
EU Beef Imports from Namibia
0.00
100.00
200.00
300.00
400.00
500.00
600.00
700.00
1999
2001
2003
2005
2007
2009
Year
High (Fresh)
Low (Frozen)
Source: Author (based on Comext data)
As shown in figure 3a, Namibia exported almost twice the amount fresh beef as frozen
since 1999. Beef exports to the EU fell between 2006 and 2007 as more cattle were sold live to
South African feedlots in response to increased weaner prices and increased demand in South
Africa due to the preparation of the FIFA 2010 world cup. Only cattle South of the veterinary
cordon (NVC)28
are sold to the EU market. Approximately 90% of contracted cattle suppliers of
the main beef exporters are commercial farmers and the remaining 10% are communal farmers29
located south of the veterinary line. However, 55% of Namibian communal farmers are located
in the northern communal areas (NCA), located north of the veterinary line,
28
The NVC hampers market access for communal farmers and the political history of the size and location is contentious; the government is debating to relocate the fence further north while keeping in mind the objective of disease prevention. 29
Other communal farmers supply under their farmers’ association contract.
82
and 95% of cattle slaughtered in the NCA are sold to South African markets and 5% is sold in
the domestic market.
In terms of value, the EU market continues to be an important market for the Namibian
beef industry. Table 3b below shows the percentage of sales value of the leading Namibian beef
exporter by export destination and the EU constitutes almost 40% share of Namibian export
value followed by South Africa and then Norway.
Table 3b: Distribution of Sales Value by Export Destination (2009) Destination Percentage of Sales Value European Union 39.6 South Africa 29.5 Norway 13.5 Namibia 12.8 Reunion 2.4 Switzerland 1.4 Other African countries 0.9
Source: Meatco (2009)
Namibia was the sixth largest exporter of beef to the EU in 2009 (Agritrade, 2010), but
Namibia accounted for only 2.9% of total beef imports. Low-cost beef producing Latin
American suppliers like Brazil and Argentina pose a competitive challenge to Namibia. Brazil,
Argentina and Uruguay collectively supply 80% of all EU imports (Comext, 2007). The EU
quota allocated to the Latin American exporters amount to 40,300 tons. Namibia underutilized its
quota allocation of 13,000 metric tonnes which Chiriboga et al (2008) attributes to various
supply constraints including risks related to environmental conditions such as droughts, bush
encroachment and land degradation. There was a sharp reduction in Brazilian beef exports to the
EU in 2007 due to stricter EU hygiene rules. The competitive threat from Mercosur suppliers is
83
enhanced by the potential reduction in tariffs on Brazilian and Argentinean beef products
through the EU free trade agreement with Mercosur countries. Negotiations between these
countries are still ongoing.
Figure 3b: EU Imported Beef Prices (CIF)30
in Euro/kg by Category (1999-2009)
Beef Prices (CIF)
0
1
2
3
4
5
6
7
1999
2000
2001
2002
2003
2004
2005
2006
2007
2008
2009
Year
Fresh
Frozen
Source: Author’s calculation based on Comext Data
Figure 3b depicts the price of fresh beef and frozen beef varieties. The price of fresh
beef has been on average 56 % higher than that of frozen beef between 1999 and 2009. The fall
in prices after 2001 is attributed to various measures of the EU common agricultural policy
reforms. There was an increase in EU beef carcass prices after 2007, but this is largely due to the
30
Includes cost, insurance and freight.
84
fall in Brazilian beef exports to the EU. In addition, only beef that meet grades A and AB is
destined for the EU market, the lower grades are sold in the domestic and regional markets.
Market analysts report that there is a growing trend in the EU market of importing
increasing volumes of high quality meat products while exporting high volumes of low-quality
meat products (Agritrade, 2008). EU beef exports to ACP countries consist entirely of low-
quality beef destined to the low-priced end of the market (Agritrade, 2006). For example, Angola
and the Democratic Republic of Congo are now among the top ten destinations for EU beef
products. The increase in imports of low-priced beef products from the EU poses competition for
Namibia in expanding beef exports into the regional sub-Saharan Africa markets and is likely to
compete directly with the production of small communal and emergent commercial farmers’
production.
This paper does not focus on the cost of exporting to the EU market. However we note
that exporting to the EU comes at a high cost of meeting stringent phytosanitary and food safety
standards and quality specifications. The leading Namibian beef exporters are HACCP and ISO
certified. In addition, the extension of animal welfare rules to all producers who export animal
products to the EU market could significantly increase costs of exporting to the EU market. It is
the additional specifications beyond HACCP requirements that also add to costs. For example,
the EU recently required that cattle have double ear tags31
; such a requirement add significant
costs for farmers and many industry informants do not see the value of such a requirement.
Given the overall small volume of beef exports by ACP countries, the cost of setting up
31
Ear tags cost $N6.20/tag (about $0.90 USD/tag); all animals being sold must be tagged.
85
compliance verification systems could outweigh the benefits. Key industry informants32
in the
Namibian beef industry argue that the costs of meeting EU standards are high, but the value of
exporting to the EU currently outweighs the costs. Thus, there is a revealed preference for the
EU market in terms of profits. In addition, protected access to the EU market enabled the
Namibian meat industry to upgrade its production facilities and to meet international standards
and increased the marketability of Namibian meat products not only in the EU, but also in high-
end niche markets in South Africa. The leading export abattoir spends approximately N$1.8
million (about 240,000 USD) in maintenance per plant per year. Despite these heavy
investments to meet EU quality standards, Agritrade (2009) reports that Namibian farmers
receive a price premium of N$ 183 million (about 24 million USD) above the prices received by
comparable South African farmers.
The challenge to Namibia and other ACP countries is: how should they market their
beef in the EU market? Given that there is a surplus of low-quality beef in the EU combined with
imports from Latin American suppliers targeting the low-end EU meat market, how can Namibia
export profitably to the EU’s high-end market in light of ever increasing food safety and quality
standards? While the answers to these questions remain unclear, the Namibian beef industry is
currently adopting a highly differentiated marketing strategy including vacuum packing of
individual beef cuts to meet high-end niche markets in the EU.
The discussion in this section points out that the Namibia and other ACP beef exporters
receive different values for the different beef varieties they export to the EU market. It is thus
important to analyze whether the proposed policy reforms have different implications for
32
Tujendapi (Meatboard of Namibia) and Koos Classens (Meatco).
86
different types of beef products. Given this, a theoretical framework that captures the effects of
trade policy instruments on quality composition is needed. Section 3.5 presents a conceptual
framework and the consumer optimization problem that will be measured by the empirical
simulations.
3.5 Empirical Model and Conceptual Framework 3.5.1 Theoretical Context In “shipping out the good apples”, Alchian and Allen (1964), demonstrate how per unit
transaction cost lowers the relative price and increases the demand for high quality goods. Thus,
per unit costs such as transportation costs lead firms to ship out the high quality goods abroad;
but sell more of the lower quality goods in the domestic market. Put another way, fixed per unit
transport costs results in a higher relative price of the least expensive quality and shifts the
composition of imports raising the consumption of the higher priced good (Ramos, 2010). While
Alchian and Allen applied their hypothesis in a two-good world, their basic hypothesis was
further supported in a multiple-good world (Silberberg et al 1978; Umbeck, 1980; Buaman,
2004).
Some trade policy instruments including tariffs and quotas result in the Alchian-Allen
effect similar to per unit transportation costs. For example, in a small country scenario, specific
rate tariffs alter relative prices and result in export bias toward the higher (priced) quality good
(Boorstein & Feenstra, 1991). Furthermore, other authors (Borcherding and Silberberg (1978)
and Falvey, (1979) conclude that quota and specific taxes likely cause quality upgrading. On the
other hand, ad valorem tariffs do not change the relative prices, (Boorstein and Feenstra, 1991),
87
and thus do not affect import composition. Quotas and quality controls affect both levels and
composition of imports (Feenstra, 1991; Aw, 1986).
The EU trade policy of tariff rate quotas (TRQs) uses a combination of all the
aforementioned policy instruments. Specifically, an exporter faces varying specific and ad
valorem tariff rates depending on whether the exported goods are below or above the allocated
quota. The EU trade policy is complex and the effects of varying its various components depend
on the starting point of the quota fill rate (i.e. if the imported amount exceeds or is below the
allocated quota).
Following Ramos (2010), the next section provides the conceptual framework that
describes the trading regime of beef products between the EU and Namibia. It presents the
optimization problem faced by the consumer under various simplifying assumptions and
provides results for measuring import composition changes in response to the varying trade
policy instruments.
3.5.2 Consumer’s optimization problem
Assume a representative consumer who maximizes their utility. Further, assume that the
consumer’s utility function is homogenously separable. Thus, elementary goods can be
consistently aggregated to form composite goods, which can be treated as the elementary goods.
In this problem, we focus on the beef sector with three types of goods: a domestic beef product,
88
bd, and two imported qualities33
of beef products, a high quality type denoted by bhm and a low
quality type denoted by blm. This study assumes the EU to be one homogenous trade region.
Since Namibia only has a 2.9% market share of EU beef imports and even less than that of the
world beef trade, we treat it as a small country34
. Thus, Namibia’s competitors (notably
Mercosur beef suppliers) will not respond to its policy since under the small country
assumptions, the actions that Namibia take do not affect world beef prices. Since the EU is
formalizing this trade policy with a small country, the same argument is extended to its
competitors’ response to EU-EPA trade negotiations. As a result, we only consider Namibia in
the trade policy analysis and simulations. Further, assume that the consumer solves the utility
maximization problem in two separate stages. First, they maximize the overall utility by
choosing between the domestic and imported products. Second, they choose between the two
imported beef qualities.
Let the first stage of the utility maximization problem be represented by a Cobb-Douglas
utility function35
. I use the Cobb-Douglas to simplify the comparative statics results presented in
section 3.6.2. After a monotonic transformation to the Cobb-Douglas utility function, the utility
function is written as a function built from sub-utility functions udand um as shown in equation
(1): where ud denotes the sub-utility function for the domestic beef product and um denotes the
sub-utility function for the imported beef product.
33
Both low and high quality beef products are hormone-free, free-rage and pasture-fed. 34
If the country is "small" in international markets, then it has a very small share of world market for the product, and its policies are unable to affect the world price of the good. 35
We relax this assumption later.
89
U(bd,m) = αd log(ud (bd ))+αm log(um(bhm,bl
m)) (1)
This paper focuses on the trade policy effects and import composition, thus we will
analyze the second stage of the maximization problem, namely maximizing (um), taking into
account that import expenditure equals R= I − d, where I denotes total consumer income and d
is the expenditure on the domestic good. Let the consumer’s relative preferences of the two
imported products be represented by a constant elasticity substitution (CES). The CES function
in applied work allows direct inclusion of elasticities and price values into the equation
(Rutherford, 1995). Equation (2) is the CES utility function for the imported beef varieties where
all parameters are positive and ρ ≤1. λ represents the consumer’s relative preferences between
the high and low quality beef products, and λh > λ l .
Um(bhm,bl
m) = [λh (bhm)ρ + λ l (bl
m)ρ ]1/ρ (2)
First, solve the consumer’s maximization problem under free trade (in the absence of trade
restrictions):
Maxbh
m,blm
Um(bhm,bl
m) s.t R= phwbh
m + plwbl
m and bhm,bl
m ≥ 0 (3)
where phw and pl
w are assumed to be exogenous world prices36
.
36 Both do not include tariffs and they reflect what the exporters get.
90
The associated Langragian function is shown in equation (4).
Maxbh
m,blm
L ⋅()= um(bhm,bl
m)+ µ R− phwbh
m − plwbl
m
(4)
from the first order conditions (FOC) and after some algebra we derive the usual associated CES
Marshallian demand function depicted in equation (5). The full algebraic derivations are in
appendix 3A, the general demand equation for the CES utility function is shown in Varian
(1992).
bhm =
λh / ph( )σ R
λlσ (pl )
1−σ
+ λh
σ (ph)1−σ
and bl
m =λl / pl( )σ R
λlσ (pl )
1−σ
+ λh
σ (ph)1−σ
(5)
where σ =1
1− ρ is the elasticity of substitution.
If we divide the Marshallian demand function for the high quality beef by the Marshallian
demand function for the low quality beef, we get demand for high quality beef relative to the low
quality. This relative demand is given by the expression in equation (6)
bhw
blw
=λh pl
w
λ l phw
σ
(6)
Expression in equation (6) is used as the quality indicator to show how changes in prices
resulting from the different trade policy components change the quality composition of beef
imports. The following section provides the specific components of the EU trade policy and it is
91
followed by a formal presentation of comparative statics on how changing the different trade
policy components change the quality composition of beef imports.
3.6 EU Trade Policy
3.6.1 Tariff Rate Quota
As described in the EU trade policy section, the EU trade regime consists of the tariff rate
quota (TRQ) and mixed tariff structure. The TRQ is only applied to the high quality good. The
TRQ consists of a quantitative ceiling (qh), and an in-quota ad valorem tariff rate (th), which
differs from out-of-quota ad valorem tariff rate, t and a specific tariff rate (T ). TRQ is not
applied to the low quality product. The low quality product is subjected to mixed tariffs equal to
the out-of quota tariffs for the high quality product and it is not affected by quantitative
restrictions.
The above TRQ components introduce several restrictions, and we rewrite the
maximization problem as a mixed-complimentarity problem (MCP). The motivation for the
mixed complimentarity problem37
by Rutherford (1995) is provided in appendix 3B. Following
Rutherford’s MCP the consumer’s optimization problem becomes:
Maxbh
m,blm
Um(bhm,bl
m) s.t (7)
37 MCP is a mathematical way to formulate an optimization that is not free or that has bounds, which can be solved by finding the Khun-Tucker conditions. It is needed to model TRQs because the utility optimization problem has restrictions that are expressed as inequalities and some variables have two possible results: zero or positive only (e.g. imports in-quota or imports out –of quota). See appendix 3B and Rutherford (1995) for further motivation on MCP.
92
R= phwbh
m + plwbl
m (8)
bhm = bh
min + bhmout bh
min < qh; (9)
tm ≤T
phw
+ t − th (10)
bhm,bl
m,bhmin ,bh
mout ,tm ≥ 0 (11)
where bhmout and bh
min are the out of quota and in-quota high quality beef imports respectively;
phw and pl
w are the world beef prices for high and low quality beef respectively and both do not
include tariffs’ tmdetermines the value of the marginal tariff rate and its value depends on
whether the quota is filled. The value that tm takes depends on the three quota fill rates:
(1) in-quota: tm = 0 if bhmin < qh (12)
(2) at-quota: 0< tm < t +T
phw
− th
if bh
min < qh (13)
(3) out-of quota: tm =T
phw
+ t − th if bhmin < qh (14)
When the quantity of the high beef products is below its quota, the marginal tariff rate is
zero. The marginal tariff is the tariff equivalent quota premium. It is the extra protection over the
in-quota tariff that is due when the quota is binding. The at-quota marginal tariff lies between
zero and t +T
phw
− th , and marginal tariff in the out-of-quota outcome is tm = t +T
phw
− th (this
93
expression determines the quota rent). The exogenous world price and tariff rates determine the
prices for high-quality beef for the in-quota and out-of quota outcomes. When the quota is
binding, the value of tm determines the domestic price for high quality beef product:
ph = phw 1+ th + tm( )+ T where tm varies with the equilibrium outcome and ph
w is the high
quality beef product price and it approximates cost, insurance and freight (CIF). Composite
tariffs affect the low quality beef imports such that pl = plw 1+ t( )+ T , where pl
w < phw by
assumption38
is the CIF price for the low quality beef product.
To facilitate the use of the mixed complimentarity problem technique and to show how
the simulations are set up, we re-write the TRQ restrictions above as the complimentarity
conditions in equations (15) – (18). Each TRQ possible outcome is associated with bhmin ,bh
mout
and tm.
ph ≤ phw 1+ th( ) ⊥bh
m ≥ 0; phw(1+ th) − ph
bh
min = 0 (15) 39
qh ≥ bhmin ⊥tm ≥ 0; qh − bh
min
tm = 0 (16)
ph ≤ phw 1+ t +
T
phw
(17)
38 This assumption is based on price data for fresh/chilled and frozen beef product varieties. 39 ⊥ (“perp”): symbol indicates pair-wise complimentarity between the specified variable in front of ⊥ and the other variables and its bounds. It means that the results on each side are complements in order to fill the equality condition.
94
⊥bhmout ≥ 0; ph
w 1+ t +T
phw
−
ph
bh
mout = 0 (18)
3.6.2 Trade Quality Composition Effects
This section provides comparative statics on how relative demand (quality composition
ratio shown in equation (6), changes in response to changes in the trade policy instruments. The
effects of the EU trade policy on the trade quality composition vary according to specific
components and the initial trading regime (according to the fill rate of the quota). These results
are summarized in table 3c.
3.6.2.1 Quality Composition Effects
The comparative statics analysis below reveals the effects of specific tariffs, ad valorem
tariff and quotas on quality composition. The relative demand function for the free trade scenario
is given by equation (6), bhm
blm
=λhpl
w
λl phw
σ
. But when we include the different components of the
TRQ and mixed tariff structure of the EU trade policy, the relative demand function takes on the
various components of the trade restrictions depending on the quota fill rate as shown in the
following two equations:
bhm
blm
=λhpl
λl ph
σ
= λhpl
w(1+ t) + T
λl phw(1+ th)
σ
(bhm < q h)
95
bhm
blm
=λhpl
λl ph
σ
= λh(pl
w(1+ t) + T)
λl (phw(1+ th) + T)
σ
(bhm > q h)
Change in In-Quota Ad Valorem Tariffs
In-quota ad valorem tariffs apply when the high quality beef imports are below the given quota
level or at the quota level. When bhm < q h the marginal change in the relative demand of high and
low quality beef in response to change in the ad valorem tariff th is:
∂bhm /bl
m
∂th= −
plw(1+ t) + T
σλh pl
w(1+ t) + T
λh /(1+ th)ph
wλl )σ−1
1+ th( )2 phwλl
< 0 (19)
A reduction of th has an upgrading effect on the quality composition of imports. However,
when the quota is binding, reducing th only increases the quota rent. Since, ph and bhm remain
unchanged, changing th has no impact on quality composition when the quota is binding.
Change in Specific Tariff
When the imports of high quality beef are below the quota level, a decrease in the specific tariff
affects only the price of low quality beef imports. Such a change decreases the relative price of
low-quality imports; hence, the relative share of low quality imports increases and this leads to a
quality downgrading effects as shown (20).
96
∂bhm /bl
m
∂T=
σλh plw(1+ t) + T
λh
/ ph
w(1+ th)phwλl )
σ −1
phw(1+ th)λl
> 0 if bhm < qh (20)
When high quality imports exceed the quota, bhm > qh, reducing the specific tariff also has a
quality downgrading effect due to the Alchian-Allen effect. The following equation shows the
downgrading effect:
∂bhm /bl
m
∂Tσ
λh
phw(1+ t) + T
λl
−plw(1+ t) + T
λh
phw(1+ t) + T
2
λl
×plw(1+ t) + T
λh
phw(1+ t) + T
λl
σ−1
> 0 (21)
When the fill rate of the TRQ is exactly binding (bhm = qh), changing the specific tariff affects
both pl and the upper bound of the marginal tariff (tm). This can result in a shift to an out-of-
quota import scenario. If so, both bhm and bl
m will increase, but a decrease in T results in
quality downgrading because it affects low quality imports (blm) more than high quality imports
(bhm). If changing T leaves import scenario at the at-quota outcome, then bl
m will increase
resulting in quality downgrading. Overall, equations (20) and (21) show that a decrease in the
specific tariff result in quality downgrading since it affects low quality beef imports (blm) more
than high quality beef imports (bhm) due to the Alchian-Allen effect.
97
Change in Ad Valorem Tariff
Out-of quota ad valorem tariffs, t , is imposed on both types of beef qualities. Its effect on
quality composition changes depending on the TRQ fill rate. When high quality imports are
below the quota, changing t has a quality downgrading effect because it only affects low quality
beef imports and results in an increase in the low quality beef imports as demonstrated below:
∂bhm /bl
m
∂t=
plwσλh pl
w(1+ t) + T
λh
/ 1+ th( )ph
wλl
σ −1
(1+ th)phwλl
> 0 if bhm < qh (22)
If high quality imports exceed the quota, bhm > qh, changing t has a quality upgrading effect on
the average quality.
∂bhm /bl
m
∂tσ
plwλh
phw(1+ t) + T
λl
−phw pl
w(1+ t) + T
λh
phw(1+ t) + T
2
λl
×plw(1+ t) + T
λh
phw(1+ t) + T
λl
σ−1
< 0 (23)
Change in High Quality Quota
If the initial import level is in-quota, an increase in the high quality beef quota level does not
affect quality composition. This scenario particularly applies to Namibia since it has never
exported above its quota level. However, when the quota is binding, increasing the quota level
will increase high quality beef imports. Increasing qh reduces the marginal tariff (tm) and ph
98
since ∂tm∂qh
< 0. A reduction in ph implies a reduction in blm [if bh
m and blm are gross
substitutes (σ >1)].
∂bhm/bl
m
∂qh=
plw(1+ t)+T
σ
λlσR
× λhσ(ph
w(1+ th+ tm)
1−σ
+λlσ(pl
w(1+ t +T)1−σ
2
+(1−σ)λhσ qhph
w
(phw(1+ th+ tm)σ
∂tm∂qh
>0
(24)
If the new quota level is larger than the initial high quality equilibrium, then the new equilibrium
will be at-quota or in-quota levels, and in both cases, bhmwill increase while ph and bl
m
decrease. This results in quality upgrading. Since Namibia has only exported below its allocated
quota, we will only focus on the changes at the in-quota and at–quota levels. Table 3c
summarizes the effects on quality composition in response to changes in the various trade policy
instruments at the three possible trade TRQ equilibria.
99
3.6.2.2. Summary of Comparative Statics Results
Table 3c summarizes the results of the comparative statics results that we derived in the
previous section. Results are summarized according a change in each policy instrument by the
three TRQ regimes. The (+) sign denotes quality upgrading and the (-) sign denotes quality
The effects on import composition from changing ad valorem tariffs vary according to
the TRQ regime. Since, the proposed trade scenarios include varying both instruments
simultaneously under some policies the overall effect on import composition depends on which
instrument has a stronger impact. To assess how the trade policies affect consumers’ welfare we
discuss one such measure, the equivalent variation, in the next section.
3.7 Equivalent variation
The simulations based on the details provided in the previous sections show how trade
alternatives change the composition of beef quality, prices and traded volumes. To provide an
indication on how the policy alternatives affect the consumers’ welfare, we calculate the
100
equivalent variation. Equivalent variation can be thought of as the dollar amount that the
consumer will be indifferent to about accepting in lieu of the price change. That is the change in
her wealth that would be equivalent to the price change in terms of its welfare impact (Mas-
Colell, 1995). Equivalent variation is negative if the price change makes the consumer worse off.
Equation (25) shows the calculation of equivalent variation in the initial trade regime. In this
analysis, the initial scenario refers to the preferential trade regime and it is denoted by the index
“0” in the calculation.
EVo = E pw,uo
− E pw,to,th
o,To,qho
,uo
(25)
Where E(pw,uo) is the expenditure function (inverse of the consumer’s indirect utility
function) and it gives the minimum amount of income necessary to achieve utility level uo of
the initial trade scenario (preferential market access) at free trade price, pw and the level of
protection of the initial trade scenario denoted by ad valorem tariffs, to,tho for both beef
varieties, specific tariff To, and quota, q o.
To show how equivalent variation changes with the different trade alternatives, I
calculate the change in equivalent variation, denoted by ∆EVi for each trade alternative i . Then
one can compare equivalent variation in each trade scenario i to the EV in the initial scenario,
EVo. Therefore, a positive ∆EVi is a positive net gain for the consumer. Equation (26) presents
the calculation of change in equivalent variations, ∆EVi .
101
∆EVo = E pw,ui
− E pw,ti ,th
i ,Ti ,qhi
,ui
− E pw,uo
− E pw,to,th
o,To,qho
,uo
(26)
In addition to equivalent variation, tariff revenue is calculated for the EU. Export revenue
and quota rent represent some form of welfare measure for Namibia. Appendix 3B shows the
expressions we use to calculate the aforementioned measures.
The next section discusses the data used in the simulations and the stylized trade scenarios.
3.8 Data and Stylized Trade Scenarios
3.8.1 Calibration Data
This study utilizes beef imports from Namibia to the 27 EU member countries and their
cost insurance freight (CIF) value at the CN 8-digit level of the EU classification (a domestic
sub-division of the United Nations Harmonized System). I use secondary trade data. Detailed
import quantities from Namibia (in 100 kg) and CIF values (in euros) are used. The CIF price
data was calculated by dividing the CIF values by the import quantities. As noted before, the EU
is treated as one homogenous region. The different types of beef qualities40
are classified
according to two preservation modes (fresh and frozen) used by the European commission. Fresh
boneless represents the high quality variety and frozen boneless beef represents the low-quality
type.
40 High quality includes line 020130 and low quality includes line 020230 from COMEXT database. Note that only meat from beef carcass of grades A, AB and some B are exported to the EU market from Namibia. Thus, these two preservation modes include these grades. The available data do not differentiate according to grade.
102
The calibration data are based on 2005 beef imports. This benchmark year represents a
stable agricultural year in which there were no disruptions in supply due to droughts, and the
preferential market regime was still in effect in the benchmark year. The European import values
are from the Eurostat’s COMEXT database. The baseline is characterized by an in-quota
equilibrium whereby Namibian beef exports to the EU are below the quota level. The unit values
of imports are used to approximate CIF prices. The high quality beef quota, in-quota and out-of-
quota tariff rates are from the TARIC database. The tariff rates for the initial trade scenario are
from various secondary sources (including Agritrade, 2007; Meyn, 2006). Table 3d below
bhw (100 kg) Imported beef (high quality) 66,266 COMEXT
blw (100 kg) Imported beef (low quality) 30,451 COMEXT
d (€ billion) Expenditure on domestic beef 37.5 INRA/OFIVAL
phw (€/kg) CIF high quality beef price 4.81 COMEXT
plw (€/kg) CIF low quality beef price 2.12 COMEXT
t (%) In–quota Ad valorem tariff 12.8 TARIC th (%) Out-of quota ad valorem tariff 0 TARIC T (€/100kg) Specific tariff 24.2 TARIC qh (thousand tons) Quota 13 TARIC
ph (€/kg) Price of high quality imported beef sold in the EU market
5.62 Calculated
pl (€/kg) Price of low quality imported beef sold in the EU market
2.73 Calculated
pd Price for domestic beef sold in the EU
1 Assumption
σ (€/kg) Elasticity of substitution 3.85 GTAP
103
The EU domestic beef expenditures figures are from the French marketing board
(OFIVAL). The global trade analysis project (GTAP) elasticity for bovine meat, σ =3.85, is used
for the elasticity of substitution. Also, we use alternative elasticity values to carry out sensitivity
analysis.
As mentioned before, a LES-CES specification is used to replace the Cobb-Douglas
utility specification in the numerical simulations. The specification embodies more realistic
assumptions41
concerning the substitution between domestic production and imports (Ramos,
2009). The 2005 base data are used as initial values of the expenditure share in calibrating the
coefficients of the LES-CES function and other parameters. The system of equations is solved
using the GAMS software package to find the equilibrium solution. The next section discusses
the stylized trade scenarios.
41
It specifies a subsistence quantity where no utility is obtained; the remaining income, after the subsistence expenditure, is allocated between the domestic good and the two imported beef varieties.
104
3.8.2 Stylized Trade Policy Scenarios
Table 3e shows the stylized trade scenarios used in the policy simulations. We put the
rates specified in this table directly into the model developed in sections (4) and (5) to simulate
the results for the five trade policy scenarios.
Table 3e: Stylized Trade Scenarios Quota Specific tariff
(€/kg) Ad valorem tariff
(%) 1. Preferential Market Access: PMA
13 (103)
High: 0.242 Low: 0.176
High: 0 Low: 0
2. Economic Partnership Agreement: EPA
0
High: 0 Low: 0
High: 0 Low: 0
3. Generalized System of Preferences: GSP
0
High: 3.034 Low: 2.211
High: 12.8 Low: 12.8
4. Enhanced GSP A: GSP+
13 (103)
High: 0 Low: 0
High: 9.3 Low: 9.3
5.Enhanced GSP B: GSP++
0
High: 2.12 Low: 1.54
High: 9.3 Low: 9.3
*High= fresh beef and Low= frozen beef
The preferential market access (PMA) is the initial trade scenario. The economic
partnership agreement (EPA) is based on the interim EPA agreement of 2007. This scenario
105
involves eliminating all tariffs (specific and ad valorem) for both high quality and low quality
beef varieties, and quotas. In essence, this alternative is similar to a free trade scenario. In the
standard GSP alternative ad valorem tariff rate of 12.8% is applied to both beef varieties. In
addition, a specific tariff rate of 3.034€/kg is applied to high quality beef, while 2.211€/kg is
applied to low quality beef.
The enhanced GSP scenarios include two options: The GSP+42
has an effective quota of
13,000 tons of beef and a 3.5 percentage point reduction of the MFN ad valorem tariff rates, i.e
9.30% in ad valorem tariff, and no specific tariff rates. The GSP++43
is quota-free, and it has the
same ad valorem tariff rates as the GSP+ and 30% reduction in MFN specific tariff rate for both
beef varieties. Thus, the high and low quality beef varieties face 2.12 €/kg and 1.54 €/kg in
specific tariffs respectively.
The above trade alternatives are compared to the initial preferential market access (PMA)
trade regime. The PMA has a quota of 13,000 tonnes, no ad valorem tariff rates for both beef
varieties, but it applies 0.242€/kg specific rates for high quality beef and 0.176€/kg specific
tariffs for the low beef variety. Export volumes are below the quota level in the initial trading
situation. The following section presents the results and conclusion.
42
Specified in Council Regulation (EC) No 732/2008: Section1 Article 6; includes quota, no specific tariffs. 43 Specified in Council Regulation (EC) No 732/2008: Section1 Article 6.
106
3.9 Empirical Results
Table 3f reports the quality composition effects of the different trade scenarios at
different values σ (elasticity of substitution). This quality indicator is calculated according to
equation (6) in the conceptual framework section. The quality composition indicator gives an
idea about the import demand of high quality beef relative to low quality beef. When the change
in the quality composition indicator from the base scenario to any other trade scenario is positive,
then it denotes quality upgrading and when the change is negative then it denotes quality
downgrading. The quality indicator also indicates the orientation of trade. When it is greater than
1, then trade is oriented toward the high quality segment and when it is less than 1, then trade is
oriented toward the low quality segment. The preferential market access (PMA) scenario is the
initial or base scenario. The change in the quality indicator is analyzed relative to the initial trade
scenario results.
Table 3f: Quality Composition Effects
Tables 3g, 3h and 3i report the trade, price and welfare results at different values of σ at σ=3.85,
σ=2 and σ=6.5 respectively.
Trade Scenario σ = 3.85 σ = 2 σ = 6.5
PMA 4.785 4.785 4.785
EPA 3.704 4.188 3.104
GSP 7.352 5.981 9.879
GSP+ 5.215 5.004 5.534
GSP++
6.411 5.570 7.841
107
Table 3g: Trade, Prices and Welfare Results at σσσσ=3.85
Table 3f reveals that the overall trade orientation is toward high quality beef. Change in
the quality indicator reveals quality upgrading in all the trade scenarios except the EPA. In the
EPA scenario, moving from preferential market access to the economic partnership agreement,
all tariffs and quotas are eliminated. This policy change has a quality downgrading effect on the
EU’s beef imports from Namibia. The downgrading effect is consistent at all levels of σ . The
ratio between high and low quality beef imports shifts from 4.7 to 3.7 at σ = 3.85 and it is lowest
at 5.6=σ . The price for low quality beef falls by 6.4% and low quality beef imports rise by
26%. This change is consistent with a priori expectations. On the other hand, the price for high
quality beef remains unchanged, but high quality beef imports fall slightly by 2.4%. Since the
starting regime is below quota, the change in import composition is primarily attributed to the
elimination in specific tariffs instead of the quota elimination. This result is consistent with the
Alchian-Allen conjecture. The removal of specific tariffs lowers the relative price of the low
quality beef product and increases the import demand of the low quality product. Overall, this
scenario grants free trade access into the EU market and it is most favored by Namibian beef
exporters.
The second policy option includes exporting beef under the standard GSP regime. Under
this scenario, Namibia would pay the most favored nation (MFN) ad valorem tariff rate of
12.8%, and the specific tariffs would increase by approximately 92%. This policy change results
in a significant increase in the quality composition indicator. The quality composition changes
from 4.7 to 7.35 at σ = 3.85, and to 5.9 at 2=σ . This policy change results in quality
upgrading. Since, this scenario is quota-free the quality upgrading is due to specific tariffs and ad
valorem tariffs; i.e. more of the “good beef is shipped out”. Prices of both beef qualities increase,
111
and the imported volume of both beef varieties fall, but the volume of low quality beef falls by
18 percentage points more than that of the high quality beef. It is difficult to differentiate what
weight each instrument contributes to the upgrading effect, but it is reasonable to argue that the
92% increase in specific tariffs contributed more to the quality upgrading.
In the enhanced GSP options (GSP+ and GSP
++), beef exporters pay ad valorem tariff
rates, specific tariffs are eliminated in the GSP+ alternative and not in GSP
++ option, and the
GSP+ option has a quota. The ratio between high quality and low quality beef imports increases
under both scenarios. The quality composition indicator increases from 4.7 to 5.21 and 6.41
under the GSP+ and GSP
++ respectively. Thus, shifting from preferential trade to the enhanced
GSP options has a quality upgrading effect; the quality upgrading effect is stronger in the GSP++
option that has both types of tariffs. However, since the ad valorem tariffs are the same for both
beef qualities under the GSP++ scenario, the quality upgrading is due to the specific tariffs.
The level of tariff protection is the same for both beef varieties under the GSP+ option,
thus the quality upgrading effect is due to the quota which is the only effective protection in this
trade scenario. High quality beef import demand increase slightly by 0.7% under GSP+, but fall
significantly by 43% under the GSP++
option, because the relative high quality beef price
increases. Low quality beef imports fall under both options, but it falls more in the GSP++
alternative due to the higher tariffs. The demand for high quality beef increases under the GSP+
112
scenario by 0.7%, but falls in the EPA option by 2.4%. Since both trade scenarios are quota free
and specific tariffs are removed, the slight increase in the demand for high quality beef may be
due to the 9.3% ad valorem tariffs. Overall, the results are consistent with the Alchian-Allen
conjecture, and confirm that per unit specific and quantitative restrictions have a quality
upgrading effect.
Figure 3c: Annual Namibian Export Revenue Results by Trade Regime and σ at 3.85, 6.5 and 2.
Note: Revenue is in Euro (million)
Figure 3c shows that shifting from the preferential trade regime (PMA) to the economic
partnership agreement (EPA) increases export revenue for Namibia slightly by 2.6% at σ=3.85
and by 1.36% at σ=2. On the other hand, shifting to the standard GSP regime decreases export
revenue significantly by 52.8%, and Namibia would earn approximately 21 million euros instead
of 45 million euros per year under the preferential market trade agreement. Export revenue falls
Export Revenue (Namibia)
0
5
10
15
20
25
30
35
40
45
50
PMA
(1975 -
2006)
EPA
(interim
since
2007)
GSP+ GSP++ GSP
Trade Regime
3.85
6.5
2
113
by 0.7% under the GSP+; regime and by 44% under the GSP
++. Thus, from an export revenue
perspective, the best option for Namibia is the EPA followed by GSP+; the worse alternatives are
the standard GSP, followed by the GSP++
. As expected, tariff revenue for the EU increases
significantly under the standard GSP and GSP++
trading arrangements, while it is insignificant
under the GSP+ and zero under the EPA agreement.
Change in equivalent variation is negative under all trade scenarios except for the EPA
option. Thus, only the EPA trade scenario represents a net gain for EU consumers. The GSP and
GSP++
represent the worse scenarios for the consumer, because more income would have to be
taken away from them at free trade prices, to leave them just as well off as they would be under
the initial preferential trade regime. Hence, the EU consumer is better off at the free trade
scenario, which, in a sense is represented by the EPA trade agreement44
.
3.9 Conclusion
Preferential market access marked the trading relationship between the EU and ACP
countries for three decades. After a successful challenge from other developing countries, the
WTO ruled the non-reciprocal preferential trade agreement to be inconsistent with the WTO
non-discriminatory trading requirement. As a result, the EU embarked upon a new trading
regime, the economic partnership agreement with ACP countries. There is uncertainty regarding
44
To make a sound conclusion, one has to estimate more welfare measures including changes in consumer surplus, the potential effect of the loss of tariff revenue in the provision of public services, and other cost and benefit analyses.
114
the potential effects on the proposed agreement on certain sectors that had previously enjoyed
significant preferential market access under various commodity protocols. This is the case with
the Namibian beef exports to the EU.
The EU tariff structure consists of a combination of TRQs, specific and ad valorem tariff
rates. Specific tariffs and quotas result in an Alchian-Allen effect and introduce bias in the
import composition. These quality composition effects are important to consider as they have
different implications to suppliers upstream in the beef supply chain. In this paper we presented
a framework to analyze the potential impact of three trade policy alternatives on Namibian beef
exports of the EU market. Specifically, we analyze how changes in the various components of
the EU tariff regime affect not only trade volumes, but also the quality composition of beef
imports.
The EPA trade agreement has a quality downgrading effect on beef imports from
Namibia. The results show that all the GSP trade alternatives have a quality upgrading effect and
are consistent at all the chosen elasticity levels. Namibian beef exporters currently implement a
highly differentiated beef marketing strategy in the EU focusing on the high quality end of the
beef market. This strategy is sensible in light of the high volumes of low quality beef varieties
from low cost beef producers like Brazil, and in light of the higher prices for high quality beef.
However, if Namibia signs the final EPA trade agreement, results show that the EPA has an
quality downgrading effect on the demand for beef imports from Namibia. This may make it
easier for communal farmers to supply cattle that yield more of the frozen meat category,
because most communal farmers especially in the Northern Communal Area have smaller
115
framed cattle (based on the Sanga breed). Thus, the quality downgrading effect of the EPA
agreement could increase communal farmers’ participation in the beef export channel, and this
has positive implications for rural poverty alleviation.
The key finding is that high and low quality beef imports respond differently to the
changes in the EU trade policy instruments. Hence, beef exporters should consider these quality
composition effects in their marketing strategy and trade agreement negotiations. For example,
focusing on the high quality end of the market makes sense in terms of market positioning, but
the EPA results also present an opportunity to expand the frozen beef category. Overall, from a
market access perspective, the EPA agreement is the favorable option for Namibian beef
exporters and for the EU consumers. The standard GSP trade alternative will significantly
diminish the value of the EU beef market for Namibian beef exporters.
These results are based on simplifying assumptions; no changes in world beef prices; the
cost of exporting to the EU market; the EU’s domestic common agricultural policy reforms are
not taken into account. Nonetheless, these findings are important to consider in the trade policy
reform analyses and negotiations. Further research should take into account the cost of exporting
to the EU market, especially in terms of meeting EU grades and standards and quantifying the
cost of non-trade barriers, and should pay attention to imports and domestic production
substitution.
The key aspect of this study is that we do not treat beef as just a commodity, but as a
differentiated product. Our results show that the different quality varieties of beef respond
116
differently to the trade policy alternatives. In light of the importance that the beef sector plays in
the livelihoods of many Namibians, these results point to an important feature for trade
negotiators to consider. These results add value to the debate, because the EPA trade agreements
are still ongoing.
3.11 Policy Recommendations
Among the policy alternatives discussed in this study, the economic partnership
agreement is the favorable option for the Namibian beef sector. If Namibia and the other SADC
countries manage to resolve the remaining contentious issues described in section 3.2.1, it is
recommended that Namibia negotiate a full EPA agreement. The next best option is the GSP+
and it can only be implemented if Namibia succeeds to attain a least developed country status.
The results based on the economic partnership trade agreement provide an opportunity for
greater communal farmers’ participation in the beef export channel. Increased communal
farmers’ participation in the beef export channel is necessary for the EPA to have a greater
impact on poverty alleviation and rural development. However, to increase communal farmers’
participation, supply side constraints and factors that hinder communal farmers participation in
the beef export channel must be addressed.
A two-pronged approach is recommended to expand exports from communal areas: the
Namibian government should aggressively implement the necessary steps to extend the
veterinary line further north, so that an increased portion of the Northern Communal area (NCA)
can attain a foot and mouth disease-free status. This will allow more cattle in NCA to be sold to
the EU market. Second, a key constraint to communal farmer participation is land availability.
117
Thus, it is recommended that the government revisit its land reform policy to assure more land
resettlement.
Export abattoirs should increase their efforts to increase cattle procurement in communal
areas. Measures including stronger cooperation with farmers’ association, changing export
abattoirs’ payment system so that farmers do not wait long for payment after selling their cattle
and efforts to create a more market-oriented mindset among communal farmers are important in
increasing communal farmers’ cattle supply to export abattoirs.
Given the uncertainty of the EPA agreement combined with internal EU common
agricultural policy reforms, I recommended that the Namibian beef industry seek other export
markets including the Chinese and US beef markets, and regional markets in Sub-Saharan
Africa. The Namibian beef industry should invest in creating a strong brand name for its free-
range, pasture-fed and hormone-free beef qualities. Beef products of these quality attributes can
be sold in niche markets that target health conscious and animal-welfare conscious meat
consumers in developed markets.
118
APPENDICES
119
APPENDICES
Appendix 3A: Consumer Maximization Problem
Maxbh
m,blm,µ
L ⋅()= um(bhm,bl
m) + µ R− phwbh
m − plwbl
m[ ]
L ⋅()= um(bhm,bl
m) + µ R− phwbh
m − plwbl
m[ ]+ phw(1+ th) − ph[ ]+ tm qh − bh
min( )+ bhmout ph
w 1+ t +T
phw
FOC: set phw =1 ph = ph
w (1+ th + tm) pl = plw (1+ t)+T
The Kuhn-Tucker conditions are as follows: ∂L
∂blb
=∂U(⋅)
∂blb
− µplw ≥ 0, bl
w ≥ 0
∂L
∂bhb
=∂U(⋅)
∂bhb
− µphw ≥ 0, bh
w ≥ 0
∂L
∂µ= I − ph
wbhw − pl
wblw
≥ 0 µ ≥ 0
∂L
∂bhbin
=1+ th + tm − ph ≥ 0, bhmin ≥ 0
∂L
∂bhbout
=1+ th +T
phw
− ph ≥ 0, bhmout ≥ 0
∂L
∂tm= qh − bh
min ≤ 0, tm ≥ 0
Solving the equations above, we get the following Marshallian CES demand functions for low
and high quality beef imported products:
120
bhm =
λh / ph( )σ R
λlσ (pl )
1−σ( )+ λhσ (ph)1−σ( )
blm =
λl / pl( )σ R
λlσ (pl )
1−σ( )+ λhσ (ph)1−σ( )
Dividing bhw by bl
w we get the following relative demand function: bh
w
blw
=λh pl
w
λ l phw
σ
Appendix 3B: Rutherford’s Mixed Complimentarity Problem Rutherford’s Mixed Complimentarity Problem is:
GivenF : RN → RN, l,u ∈ RN
Find: z,w,v( )∈ RN
s.t. F(z)− w+ v = 0
l ≤ z≤ u, w ≥ 0,v ≥ 0
′ w z− l( )= 0, ′ v u− z( )= 0
where −∞ ≤ l ≤ u+ ∞ and F are continuously differentiable. Integrability issues are done away
with using MCP, as the formulation does not formerly involve the use of an objective function
(Bergtold, 2002).
121
APPENDIX 3C: Export Revenue, Tariff Revenue and Quota Rent Expressions We use the following expressions to calculate export revenue, tariff revenue and quota rent. Appendix 3C.1 Tariff Revenue
TREU = thbhin
m phw + t(b
hout
m phw + bl
mplw )+T(b
hout
m + blm)
Since Namibia beef exports did exceed quota allocation, we only have an in-quota equilibrium.
∴TREU = thbhin
m phw + tbl
mplw +T(bh
m + blm)
Appendix 3C.2 Export Revenue
ERNamibia= phw (b
hin
m + bhout
m )+ blmpl
w
At an in-quota equilibrium, export revenue becomes,
ERNamibia= phwb
hin
m + blmpl
w
Appendix 3C.3 Quota Rent The quota rent is determined by the marginal tariff. At an in-quota equilibrium, the quota rent
given by equation (12): tm = 0 if bhm < q h .
122
REFERENCES
123
REFERENCES
African Development Bank. (2002). Annual Report 2002.
African Trade Policy Center (ATCP). EPA Negotiations: African Countries Continental Review. Review Report February 2005. United Nations Commission for Africa.
Alchian, A. & Allen, W.R. (1964). University Economics: Elements of Inquiry. Belmont,
California: Wadsworth.
Alchian, A. & Allen, W.R. (1983). Exchange and Production: Competition, Coordination and Control. Belmont, CA: Wadsworth Publishing Company.
Aw, B. and Roberts, M. (1986). Measuring quality change in quota-constrained import markets. Journal of International Economics. 21, 45-60.
Bank of Namibia Annual Report. (2005).
Bauman, Y. (2004). Shipping the good apples out: a new perspective. Economic Inquiry, 42(3), 534-536.
Bergtold, J., Norton G., and Brewster C. (2005). Lome to Cotonou: trade policy alternatives for the Senegalese groundnut sector. Agricultural Economics. 33 (3), 315-323.
Bhagwati, J. (1998). Trading Preferentially: theory and Policy The Economic Journal (108). 1128-1148.
124
Boorstein, R. and Feenstra, R.C. (1991). Quality upgrading and its welfare cost in US steel imports, 1969-74. In E. Helpman and A. Razin (eds). International Trade and Trade Policy. Cambridge, MA: MIT Press.
Borcherding, T.E. and Silberberg, E. (1978). Shipping the good apples out: the Alchian and Allen theorem reconsidered. Journal of Political Economy. 86(1), 131-138.
Bouet, A., Bureau, J., Deccreaux, Y, and Jean, S. (2005). Multilateral agricultural trade liberalization: the contrasting fortunes of developing countries in the Doha Round. World Economy. 28(9). 1329-1354.
Busse, M., Borrman, A., and Grossman, H. (2004). The Impact of ACP/EU Partnership Agreements on ECOWAS Countries: An Empirical Analysis of the Trade and Budget Effects. Hamburg Institute of International Economics.
Chiriboga, L., Fan, R., & Gawande, K. (2008). Does Namibia have a comparative advantage in beef production? Bush School of Government and Public Service, Texas A&M University. Comext Database. (2006). www.epp.eurostat.ec.
Gotor, E. and Tsigas M. (2006). Effects of EU Sugar Trade Reforms on Poor Households in Africa: A General Equilibrium Analysis. Draft: Presented at the 9th Annual Conference on Global Economic Analysis, Addis Ababa Ethiopia.
Brenton P., and Ikezuki, T. (2005). The Value of Trade Preferences for Africa. World Bank, Washington D.C.
Drogue, S, and Ramos, M. (2005). Tariff-Rate Quotas and Agricultural: an application to the free-trade negotiation between the MERCOSUR and the EU. INRA, Working paper 2005/01.
Falvey, R.E. (1979). The composition of trade within import-restricted product categories. Journal of Political Economy. 87, 1105-1114.
Feenstra, R. E. (1992). How Costly is Protectionism? Journal of Economic Perspectives. 6(3), 159-178. Feenstra, R. C. (1997). Voluntary export restraint in U.S. autos, 1980-81: quality, employment, and welfare effects. In: J.N. Bhagwati (ed), International Trade: Selected Readings (pp.203-230). Cambridge, MA: MIT Press.
George C. (2006). New Preferential Arrangements for Developing Countries: The EU GSP in 2006. Commonwealth, Issue No. 40, London, U.K.
Hallak, J.C. (2006). Product quality and the direction of trade. Journal of International Economics, 68(1), 238-265.
Harker, P. and Pang, J. (1990). Finite dimensional variational inequality and nonlinear complimentarity problems. Mathematical Programming, 48 (1) pp. 161-220.
Karingi, S. (2005). Economic and Welfare Impacts of the EU-Africa Economic Partnership Agreements. United Nations Commission for Africa. African Trade Policy Center. ATPC No.1, No. 10.
Mas-Collel, A., Whinston, M., and Green, J. (1995). Microeconomic Theory. Oxford University Press.
Martin, W., van der Mensbrugghe, D., & Manole, V. (2003). Is the devil in the details? In: Assessing the Welfare Implications of Agricultural and Non- Agricultural Trade Reforms. Presented at the 6th Annual Conference on Global Economic Analysis. Scheveningen, The Hague, the Netherlands.
McQueen M et al. (1999). The impact studies on the effects of EPAs between ACP and EU. EDCPM Discussion Paper, Maastricht.
Meat Board of Namibia. (2007). Annual Report 2007.
126
Melchior, A. (2005). Trade policy differentiation between developing countries under GSP schemes. Norwegian Institute of International Affairs. No.685.
Meyn, M. (2004). The EU-South Africa FTA and its effect on EPA negotiations. Conference Paper presented at University of Western Cape.
Meyn, M. (2005). The Challenges of EPAs for Regional Integration. Conference Paper. ESSA
Milner, C. (2005). Some Simple Analytics of the Trade and Welfare Effects of EPAs. Journal of African Economies. 14 (), 337-358.
Monnig C. (2003). TRQ: Does Administration Matter? Center for International Development and Environmental Research, Working Paper No. 16
ODI. (2006). The Potential Effects of EPAs. Briefing Paper. No.5 Ochieng, C. (2007). The EU Economic Parnership Agreements and the ‘Development
Question’: Constraints and Opportunities. Journal of International Economics Law. 10 (2), 363-395.
One World Action. (2006). The likely Impact of Economic Partnership Agreements on Women Rights and Gender Equality: Beef Sector in Namibia. www.oneworldaction.org
Panagariya, A. (2002). EU Preferential Trade Arrangements and Developing Countries. Blackswell Synergy.com. Panagariya, A. ( 2005). Agricultural Liberalization and the Least Developed Countries: Six Fallacies. The World Economy, 28 (9), 1277-1299.
Ramos, M., Bureau, J., & Salvatici, L. (2010), Trade composition effects of EU tariff structure: beef imports from Mercosur. European Review of Agricultural Economics, V., No., 1-26.
Roza P. (2005). Impact of EU sugar policy reforms on developing countries. Agricultural Economics Research Institute (LEI). Report 6.05.09, The Hague.
127
Rutherford, T. (1995). Extensions of GAMS for complementarity problems arising in applied economic analysis. Journal of Economic Dynamics and Control. 19(), 1299-1324.
Rutherford, T. (1998). Economic Equilibrium Modeling with GAMS: An introduction to GAMS/MCP and GAMS/MPSGE. GAMS Development Corporation.
Skully D. (1999). The Economics of TRQ Administration. International Agriculture and Trade Research Consortium, Minneapolis, MN.
Stevens, C & Kennan, J. (2005). Preparing for Economic Partnership Agreement: A Briefing Note. Institute of Development Studies. Brighton, UK.
Stevens, C. (2006). Economic Partnership Agreements (EPA): Where we are. ODI Briefing Paper 4. Brighton, UK.
Tekere, M. (2005). Regional Integration and EPAs. Paper for EPA Workshop Umbeck, J. (1980). Shipping the good apples out: some ambiguities in the interpretation of fixed charge. Journal of Political Economy 88(1), 199-208.
USDA Foreign Agricultural Services. (2005). Livestock and Products: US beef faces strong competition on the EU market”. GAIN Report, No. E35178.
Weidlich, B. (2008, February 15). EPA damages regional cooperation in Southern Africa. IPS News (ipsnews.net).