Page 1
1
ESSAYS ON THE IMPACT OF FOREIGN DIRECT INVESTMENT IN AFRICAN
ECONOMIES
By
Prosper Chitambara
Supervisor:
Professor Christopher Malikane
A dissertation submitted to the Faculty of Commerce, Law and Management, University of the
Witwatersrand, Johannesburg, in fulfilment of the Requirements for the Degree of Doctor of
Philosophy
19 August 2015
Page 2
i
DECLARATION
I, Prosper Chitambara, do hereby declare that the research work contained in this thesis is my own
work, except where otherwise acknowledged or indicated. It is submitted for the degree of Doctor
of Philosophy in Economics, University of the Witwatersrand, Johannesburg. This thesis has not,
either partially or wholly, been submitted to this university or any other university for a degree or
diploma.
Name of Student: Prosper Chitambara
Signed:
Date: 19 August 2015
Page 3
ii
DEDICATION
This work is dedicated to my Lord and Savior, Jesus Christ, for His love and grace upon my life
and also to my wife and family for their unwavering support and encouragement.
Page 4
iii
ACKNOWLEDGEMENTS
I am greatly indebted to my supervisor, Professor Christopher Malikane for his guidance,
constructive comments and patience throughout this journey. I am also grateful to the World Bank,
the IMF and the UNCTAD for making available the data used in this thesis.
Page 5
iv
ABSTRACT
This thesis focusses on the impact of Foreign Direct Investment (FDI) on economic performance
in selected African countries over the period 1980-2012. The thesis is divided into five chapters
and three of them are empirical. Chapter 1 is the introduction. Chapters 2, 3 and 4 are empirical
chapters examining the impact of FDI on various indicators of economic performance. Chapter 5
concludes by giving policy recommendations.
In chapter 1 we provide a background, motivation, objectives, hypothesis to be tested, gaps in the
literature, contributions of the study and the main findings. Chapter 2 examines the link between
FDI and domestic investment and the role of host country factors namely financial development,
institutional development and trade openness. We use the ordinary least squares, random effects,
fixed effects and the system GMM methodologies on a panel of 48 African countries over the
period 1980 to 2012. The results show that FDI has a crowding out effect on domestic investment
and that improved institutions and trade openness do mitigate the substitutionary effect of FDI on
domestic investment. This implies a need to come up with policies to improve local conditions by
strengthening institutional quality and enhancing trade openness.
Chapter 3 investigates the impact of FDI on productivity growth and the role of relative
backwardness (the technology gap) on a panel of 45 African countries over the period 1980-2012.
We use two measures of relative backwardness namely: the distance from technological frontier
and the income gap. We apply the fixed effects, random effects and system GMM method to
account for the issues of endogeneity. The results show a general insignificant effect of FDI on
TFP growth. This suggests that FDI has a limited effect on productivity growth. The analysis of
the advantage of relative backwardness does not support the convergence theory of Findlay (1978)
and Wang and Blomstrom (1992). The large technology gaps in African countries hinder their
ability to absorb foreign technologies from advanced countries.
Chapter 4 analyses the long run dynamic relationship between FDI, exports, imports and profit
outflows in 47 African countries over the period 1980-2012 by means of panel cointegration
techniques. The results from the panel cointegration tests show that a long run relationship exists
Page 6
v
between the variables. Our findings provide evidence on the adverse long run effects of FDI on
the current account in African economies. In particular, the results show that, FDI inflows lead to
a decrease in exports and an increase in both imports and profit remittances. These findings
confirm that indeed profit outflows by multinational companies are one of the main factors driving
current account deficits in African countries.
Chapter 5 is the conclusion. We provide a key summary of the key issues covered, the main
findings, the key contributions of the study and the policy recommendations. We also suggest areas
for further research in the future.
Page 7
vi
Table of Contents DECLARATION.......................................................................................................................................... i
DEDICATION............................................................................................................................................. ii
ACKNOWLEDGEMENTS ...................................................................................................................... iii
ABSTRACT ................................................................................................................................................ iv
LIST OF ACRONYMS .............................................................................................................................. x
CHAPTER 1: INTRODUCTION .............................................................................................................. 1
1.1 Background ................................................................................................................................. 1
1.2 The Problem Statement .............................................................................................................. 2
1.3 Motivation of the Study .............................................................................................................. 5
1.4 Objectives of the Study ............................................................................................................... 7
1.5 Research Questions and Hypotheses Testing ........................................................................... 8
1.6 Gaps in the Literature ................................................................................................................ 8
1.7 Contributions of the Study ....................................................................................................... 10
1.8 Main Findings of the Study ...................................................................................................... 11
1.9 Organisation of the Study......................................................................................................... 13
CHAPTER 2: THE IMPACT OF FOREIGN DIRECT INVESTMENT ON DOMESTIC
INVESTMENT IN AFRICAN ECONOMIES ....................................................................................... 14
2.1 Introduction ............................................................................................................................... 14
2.2 Trends and Patterns of FDI inflows in Africa ........................................................................ 16
2.3 Literature Review ..................................................................................................................... 19
2.4 Data and Model Specification .................................................................................................. 23
2.4.1 Data Description ................................................................................................................ 23
2.4.2 Model Specification ........................................................................................................... 28
2.5 Estimation and Results ............................................................................................................. 29
2.5.1 Methodology ...................................................................................................................... 29
2.5.2 Results ................................................................................................................................ 31
2.6 Robustness Checks .................................................................................................................... 41
2.7 Conclusion and Policy Recommendations .............................................................................. 47
CHAPTER 3: THE IMPACT OF FOREIGN DIRECT INVESTMENT ON PRODUCTIVITY IN
AFRICAN ECONOMIES ........................................................................................................................ 49
3.1 Introduction ............................................................................................................................... 49
Page 8
vii
3.2 Literature Review ..................................................................................................................... 51
3.3 Model Specification and Data Description ............................................................................. 54
3.3.1 Model Specification ........................................................................................................... 54
3.3.2 Data Description ................................................................................................................ 57
3.4 Estimation and Results ............................................................................................................. 61
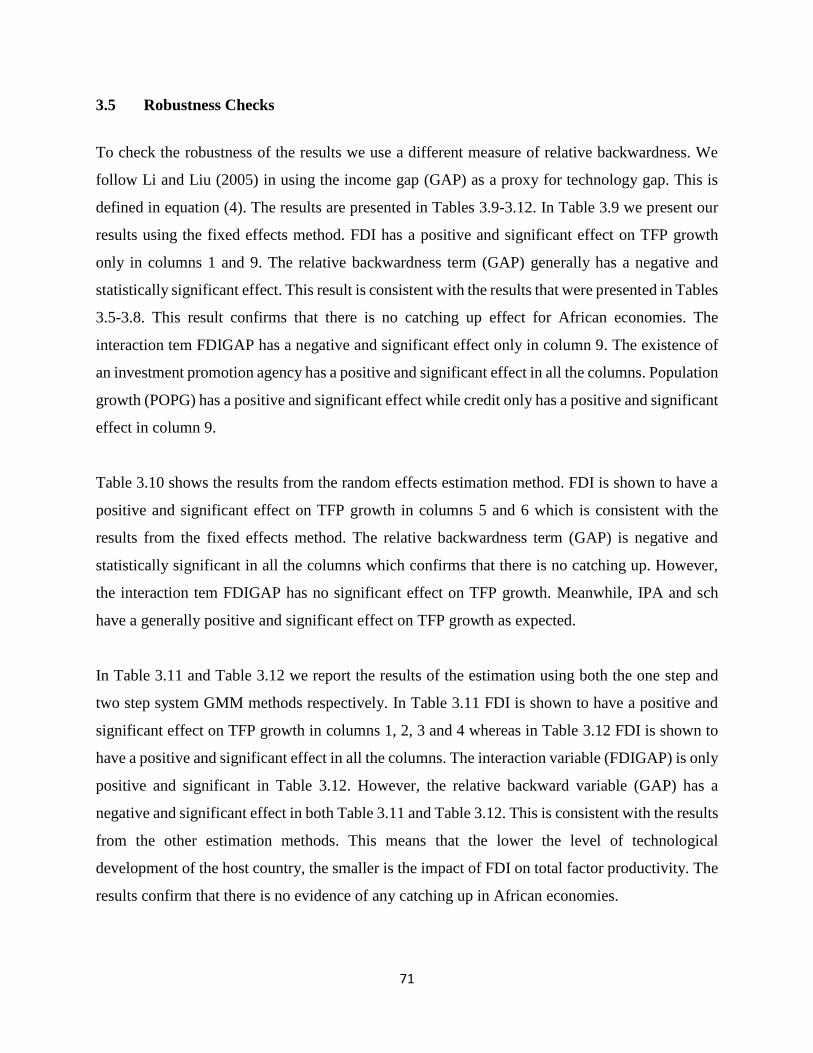
3.5 Robustness Checks .................................................................................................................... 71
3.6 Conclusion and Policy Recommendations .............................................................................. 78
CHAPTER 4: THE IMPACT OF FOREIGN DIRECT INVESTMENT ON EXPORTS,
IMPORTS AND PROFIT OUTFLOWS IN AFRICAN COUNTRIES ............................................... 80
4.1 Introduction ............................................................................................................................... 80
4.2 Trends in the Current Account and Selected Macroeconomic Indicators FDI in Africa .. 82
4.3 Literature Review ..................................................................................................................... 84
4.4 Empirical Methodology ............................................................................................................ 86
4.4.1 Data Description ................................................................................................................ 88
4.5 Estimation and Results ............................................................................................................. 89
4.5.1 Panel Unit Root Test ......................................................................................................... 89
4.5.2 Panel Cointegration Analysis ........................................................................................... 90
4.5.3 Estimating the long run relationship ............................................................................... 94
4.5.4 Testing for long run causality .......................................................................................... 96
4.5.5 Impulse Response .............................................................................................................. 97
4.5.6 Variance Decomposition ................................................................................................. 100
4.6 Conclusion and Policy Recommendations ............................................................................ 102
CHAPTER 5: CONCLUSION AND POLICY IMPLICATIONS ..................................................... 104
5.1 Key Issues ................................................................................................................................ 104
5.2 Policy Recommendations ........................................................................................................ 105
5.3 Suggested Areas for Further Research ................................................................................. 107
6. References ........................................................................................................................................ 108
Page 9
viii
LIST OF TABLES
Table 1.1: Trends in FDI in SSA………………………………………………………………………….2
Table 2.1: Top Ten Recipients of FDI in Africa, 2008, 2010 and 2012………………………………....17
Table 2.2: Regional Distribution of FDI………………………………………………………………....18
Table 2.3: List of Countries………………………………………………………………………….…...24
Table 2.4: Descriptive Statistics………………………………………………………………………….27
Table 2.5: Pair wise Correlation Matrix…………………………………………………………….......28
Table 2.6: Panel Unit Root Tests…………………………………………………………………………32
Table 2.7: Dynamic OLS Model Estimation Results…………………………………………………....36
Table 2.8: Fixed Effects Model Estimation Results……………………………………………………..37
Table 2.9: Random Effects Model Estimation Results …………………………………………………38
Table 2.10: One step System GMM Model Estimation Results………………………………………...39
Table 2.11: Two step System GMM Model Estimation Results………………………………………..40
Table 2.12: List of natural resource intense countries………………………………………….............41
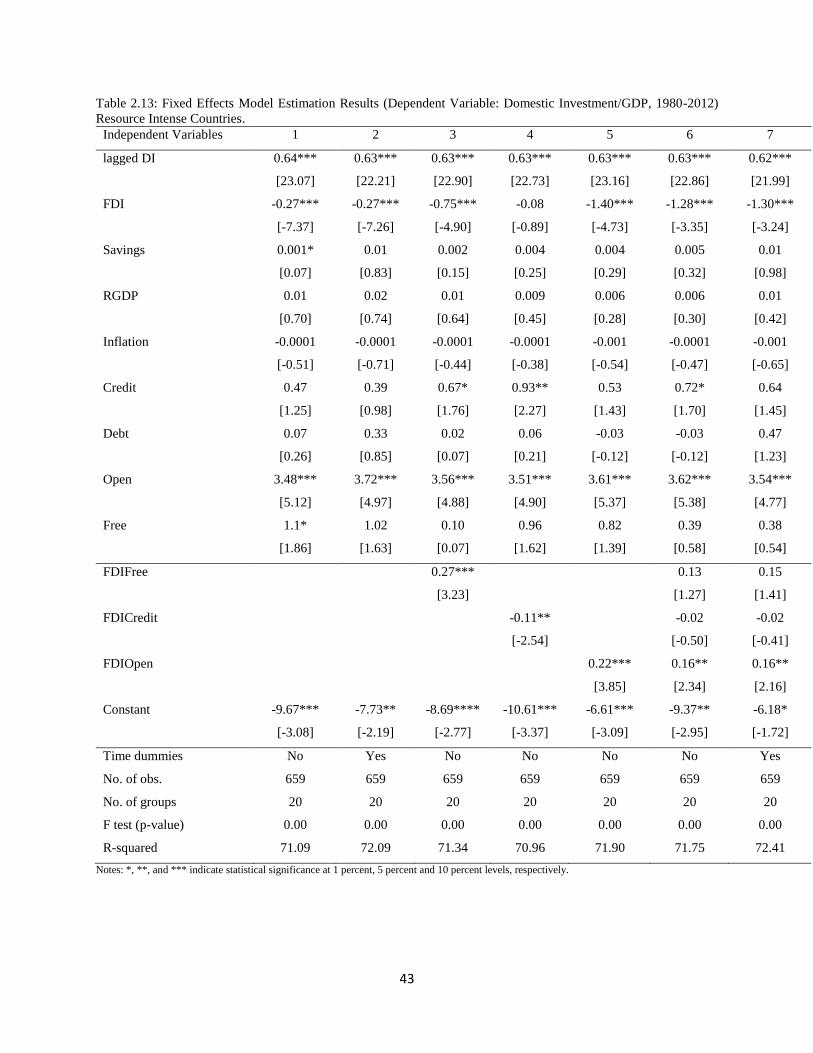
Table 2.13: Fixed Effects Model Estimation Results……………………………………………………43
Table 2.14: Random Effects Model Estimation Results………………………………………………...44
Table 2.15: One step System GMM Model Estimation Results………………………………………...45
Table 2.16: Two step System GMM Model Estimation Results………………………………………..46
Table 3.1: List of countries……………………………………………………………………………….59
Table 3.2: Descriptive Statistics………………………………………………………………………….60
Table 3.3: Correlation Matrix: 1980-2012………………………………………………………………61
Table 3:4: Panel Unit Root tests………………………………………………………………………….62
Table 3.5: Fixed Effects Model Estimation Results……………………………………………………..65
Table 3.6: Random Effects Model Estimation Results………………………………………………….67
Table 3.7: One step System GMM Model Estimation Results………………………………………….69
Table 3.8: Two step System GMM Model Estimation Results…………………………………………70
Table 3.9: Fixed Effects Model Estimation Results……………………………………………………..72
Table 3:10: Random Effects Model Estimation Results……………………………………………….74
Table 3.11: One step System GMM Model Estimation Results………………………………………..76
Table 3.12: Two step System GMM Model Estimation Results………………………………………..77
Table 4.1: Selected Macroeconomic Indicators for SSA……………………………………………….82
Table 4.2: Savings and Investments (% of GDP) for SSA………………………………………………83
Table 4.3: Variables used in the econometric analysis………………………………………………….88
Page 10
ix
Table 4.4: List of Countries………………………………………………………………………………88
Table 4.5: Panel Unit Root Test Results…………………………………………………………………90
Table 4.6(a): Results of Panel Cointegration Tests……………………………………………………..92
Table 4.6(b): Results of Panel Cointegration Tests……………………………………………………..93
Table 4.7: Johansen Test Result for Cointegration………………………………………………..........94
Table 4.8: Estimation Results of DOLS and FMOLS…………………………………………………..95
Table 4.9: Wald Test……………………………………………………………………………………...95
Table 4.10: Critical Value Bounds of the F-statistic…………………………………………….............95
Table 4.11: ARDL Test Results………………………………………………………………………….96
Table 4.12: Results of Long Run Panel Causality Analysis…………………………………………….97
Table 4.13: Response of FDI……………………………………………………………………………..98
Table 4.14: Response of Exports…………………………………………………………………………99
Table 4.15: Response of Imports………………………………………………………………………...99
Table 4.16: Response of Profit………………………………………………………………………….100
Table 4.17: Variance Decomposition of FDI…………………………………………………………...101
Table 4.18: Variance Decomposition of Exports………………………………………………………101
Table 4.19: Variance Decomposition of Imports………………………………………………………102
Table 4.20: Variance Decomposition of Profit…………………………………………………………102
Page 11
x
LIST OF ACRONYMS
ADF Augmented Dickey Fuller
AIC Akaike Information Criterion
ARDL Auto Regressive Distributed Lag
BOP Balance of Payments
BRICS Brazil, Russia, India, China and South Africa
DOLS Dynamic Ordinary Least Square
DPD Dynamic Panel Data
DRC Democratic Republic of Congo
DTF Distance to Technological Frontier
ECOWAS Economic Community of West African States
EU European Union
FDI Foreign Direct Investment
FE Fixed Effects
FMOLS Fully Modified Ordinary Least Square
GFCF Gross Fixed Capital Formation
GMM Generalised Method of Moments
IMF International Monetary Fund
LDCs Least Developed Countries
M&As Mergers and Acquisitions
MNCs Multinational Corporations
MNEs Multinational Enterprises
NEPAD New Partnership for Africa’s Development
OECD Organisation for Economic Cooperation and Development
OLS Ordinary Least Squares
RGDP Real Gross Domestic Product
R&D Research and Development
RE Random Effects
SIC Schwartz Information Criterion
SSA Sub Saharan Africa
Page 12
xi
TFP Total Factor Productivity
UK United Kingdom
UNCTAD United Nations Conference on Trade and Development
US United States
USD United States Dollar
VAR Vector Auto Regressive
VECM Vector Error Correction Model
WB World Bank
WDI World Development Indicator
Page 13
1
CHAPTER 1: INTRODUCTION
1.1 Background
FDI can be defined as ‘a category of international investment that reflects the objective of a
resident in one economy (the direct investor) obtaining a lasting interest in an enterprise resident
in another economy (the direct investment enterprise). The lasting interest implies the existence of
a long-term relationship between the direct investor and the direct investment enterprise, and a
significant degree of influence by the investor on the management of the enterprise. A direct
investment relationship is established when the direct investor has acquired 10 percent or more of
the ordinary shares or voting power of an enterprise abroad’ (IMF, 1993: p. 86). The notion of FDI
does not necessarily imply total control of the domestic firm, as only a threshold of 10 percent
ownership is required to establish a direct investment relationship. FDI comes in two basic forms
namely: greenfield investments which involve the creation of new production processes and
mergers and acquisitions (M&As) which involve the purchase of assets of existing local
companies. FDI can also be classified according to its purpose namely: natural resource seeking,
market seeking, efficiency seeking and strategic asset seeking (Dunning, 1993).
Over the past few decades there has been a significant increase in FDI flows on the African
continent. FDI inflows into Africa have targeted the extractive sectors and have therefore been
concentrated in a few resource rich countries. According to the 2014 Africa Economic Outlook,
resource intense countries accounted for 65 percent of total FDI flows in 2013 down from 78
percent in 2008. The United States (US), the United Kingdom (UK) and France accounted for 64
percent of total FDI stock in Africa in 2012, while the share of the BRICS in Africa’s total FDI
stock rose from 8 percent in 2009 to 12 percent in 2012 (OECD, 2014). Table 1.1 shows the trends
in FDI flows into SSA for selected periods as a percentage of gross domestic product (GDP) and
gross fixed capital formation (GFCF). The share of FDI flows as a percentage of GDP provides an
indicator of the significance of FDI in the economy. On the other hand, the share of FDI flows in
GFCF measures the importance of FDI in total domestic investment.
Page 14
2
As presented in Table 1.1, FDI inflows as a percentage of both GDP and GFCF have grown
considerably in SSA since 1980. In 1980, FDI accounted for only 0.09 percent of the continent’s
GDP and by 2000 this figure had risen to 1.94 percent. In 2012, the share of FDI in GDP had risen
to 3.29 percent. Meanwhile, the share of FDI in GFCF rose from 0.5 percent in 1980 to 11.54
percent in 2000 and then to 16.39 percent in 2012. According to the 2014 Africa Economic
Outlook, over the period 2001-2011 FDI, accounted for about 16 percent of GFCF in Africa
surpassing the global average of 11 percent. Over the past few years FDI inflows have become
more diversified. The Herfindahl index for sectoral concentration of FDI for 39 sectors went down
from 0.43 in 2003 to 0.14 in 2012 with the share of projects in the services sector rising markedly
(AfDB, 2014). Ernst & Young (2013) reports that in 2012, 73.5 percent of the total value of
greenfield investments to Africa was concentrated in manufacturing and infrastructure-related
activities, up from 68.3 percent over the previous decade.
Table 1.1: Trends in FDI in SSA.
Year FDI/GDP (%) FDI/GFCF (%)
1980 0.09 0.5
1990 0.42 2.13
2000 1.94 11.54
2010 2.75 14.45
2011 3.29 17.37
2012 3.19 16.39
Source: World Development Indicators (WDI) database.
1.2 The Problem Statement
The growth in FDI flows into African countries has stimulated debate about the impact of FDI on
economic performance (Adams, 2009). Economic theory highlights the importance of FDI in
promoting economic development (Apergis et al, 2006). FDI can generate positive externalities
through providing financing, complementing domestic investment and enhancing competitiveness
(Adams, 2009; Kobrin, 2005). The various channels through which positive externalities
associated with FDI can take place are summarised by Hermes and Lensink (2003) as follows: (i)
competition channel, where increased competition is likely to result in improved productivity,
efficiency and investment in human and physical capital; (ii) linkages channel, whereby foreign
Page 15
3
investment is often accompanied by technology diffusion into the host country; and (iii)
demonstration channel, whereby domestic firms learn and adopt technologies used by
multinational companies. Empirical evidence on the impact of FDI on economic performance
however remains inconclusive and mixed (Ang, 2009).
Despite the huge increase in FDI and other capital flows, these resources have not had a meaningful
impact on development in Africa (Asiedu, 2002). Moreover, FDI inflows to Africa have been
volatile, concentrated in a few resource rich countries and targeting the extractive sectors
(Ndikumana and Verick, 2008). Lim (2001) argues that FDI in the extractive sector may have
limited positive impact on growth because of the involvement of mega projects that often are not
labour-intensive and do not utilise locally produced intermediate inputs. Hsiao and Hsiao (2006)
observe that FDI inflows have resulted in the development of an enclave economy. On the other
hand, domestic investment in Africa remains low and insufficient and there is a huge technology
gap (UNCTAD, 2003).
Most African countries also continue to experience high current account deficits, foreign exchange
shortages and growing indebtedness. FDI has a negative effect on the current account through
profit remittances by multinational companies (Jansen, 1995; Seabra and Flach, 2005; Mencinger,
2008). UNCTAD (1999) reports that for every USD1 transferred to developing countries in the
form of FDI, around USD0.30 leaves in the form of repatriated earnings. Mold (2008) argues that
once profit remittances are taken as a proxy for the price of FDI, FDI becomes an expensive form
of financing. The UNDP (2011), reports that total remitted profits and dividends from FDI in the
developing world increased by about 736 percent from $33 billion in 1995 to $276 billion in 2008.
The report also observes that profit remittances are increasing at a faster pace than FDI inflows,
for instance, while profit remittances constituted about 29 percent of FDI inflows in 1995, by 2008
the figure had risen to 36 percent.
A number of scholars argue that FDI spillovers depend on the host country’s ‘absorptive capacity.’
Absorptive capacity refers to local conditions in the host country such as: human capital
development; financial market development; the level of institutional quality; the technological
gap; the level of economic development and trade openness. Borensztein et al (1998) find that FDI
Page 16
4
contributes to economic growth only when the host country has achieved a certain threshold in
terms of human capital development. They show that FDI has a positive impact on growth when
the average years of secondary schooling of the male population above 25 years of age exceeds
the threshold of 0.52. Insufficient human capital development limits the diffusion of technology
by multinational companies in the host country. Balusubramayam et al (1999) show that trade
openness increases the contribution of FDI to economic growth. Using panel data for Arab
countries from 1975-2000, Sadik and Bolbol (2003) find that a certain threshold of financial
market development must be reached to gain from FDI inflows.
Durham (2004) demonstrates the role of institutions in enhancing the positive influence of FDI on
growth. Li and Liu (2005) demonstrate that the lower the level of technological development in
the host country, the smaller is the positive impact of FDI on growth. They calculate a threshold
value for the technology gap of 12.6, above which FDI is no longer beneficial for the recipient
country. Massoud (2008) observes that the level of financial development is important because
lack of financial market development may prevent foreign and domestic investors from accessing
the necessary financial resources.
In contrast, scholars such Carkovic and Levine (2002), argue that host country factors do not have
a significant impact on the relationship between inward FDI and economic growth. Using the
system GMM, they find that neither FDI nor the interaction terms are statistically significant. They
note that previous studies that show that FDI has a positive effect on growth have to be viewed
with caution because they do not adequately control for endogeneity. In view of the above
contradictions, the question that needs to be answered is how the spillovers from FDI can be
realised in Africa. This helps to strengthen the developmental role of FDI. This thesis therefore
seeks to determine the impact of FDI on economic performance in African economies and examine
the local conditions under which FDI can be more beneficial to African countries.
Page 17
5
1.3 Motivation of the Study
The role of FDI as a source of capital is particularly important for Africa owing to the prevailing
huge financing gap and widening current account and fiscal deficits. This has been exacerbated by
the low gross national savings and the binding budget constraint facing most African economies.
Scholars such as Todaro and Smith (2003) argue that the inflow of FDI could fill the gap between
the desired investment and domestically mobilised savings. Moreover, since the majority of
African countries do not have ready access to international financial markets they have to rely on
alternative sources of finance which include FDI and aid (Adeleke, 2014). Kosova (2010)
highlights that from the mid-1990s FDI has become the major source of external finance for
developing countries and is twice as large as official development aid.
FDI is also viewed as an important channel for the transmission of technology for many developing
countries. This is because FDI often entails the transfer of knowledge from one country to another
by establishing production units using advanced technologies in the recipient country (Borensztein
et al, 1998). A number of studies such as Klenow and Rodriguez-Clare (1997) and Hall and Jones
(1999), show that differences in technological growth are key to explaining divergences in
economic growth among countries. Empirical literature has also identified the importance of the
host country’s absorptive capability in absorbing the spillovers of foreign firms’ technology. This
implies that FDI contributes to productivity growth when a sufficient absorptive capability of the
advanced technologies is available in the developing host countries (Lai et al, 2006). In particular,
Sub-Saharan Africa is lagging not just in terms of volume but also in terms of technological content
in its manufacturing activity (UNCTAD, 2003).
It has also been argued that FDI can have an effect on current account through three different
channels, namely exports, imports as well as profit remittances. Although FDI may seem beneficial
as a source of financing means for the current account deficit, it can also have adverse effects on
current account because of profit outflows of foreign companies (Yalta, 2011). The problem of the
increasing current account deficit coupled with a huge increase in profit remittances has recently
become a major concern in many African countries. It is therefore important to investigate the
impact of foreign direct investment flows on the components of the current account balance.
Page 18
6
The development experiences of a number of fast-growing East Asian economies have also
buttressed the notion that FDI is vital for bridging the resource and technological gaps in African
economies. Many African countries have therefore, intensified their efforts to attract FDI by
providing a number of generous tax and non-tax incentives to multinational companies (Carkovic
and Levine 2002). On the other hand, a number of scholars find that differences in productivity
growth account for the huge cross country variations in growth (Acemoglu, 2009; Caselli 2005;
Easterly and Levine 2001; Parente and Prescott 2001). Since FDI is regarded as an important
channel for technology transfer a study of the impact of FDI on productivity growth is of great
significance to policy makers in Africa as it provides evidence on one key factor that can help
African countries to develop.
Some studies have however questioned the role and sustainability of FDI. Turner (1991) explains
that capital flows magnify current account disequilibria, with deficit countries confronted by
capital outflows and surplus countries by capital inflows. Calvo et al. (1996) observe that the
widening current account deficit is one of major problems associated with capital inflows.
UNCTAD (2002) reports that rising FDI inflows can affect the balance of payments because of
profit outflows by multinational companies. Bhinda and Martin (2009) note that FDI inflows in
Africa are often surpassed by profits repatriated raising questions about whether FDI is sustainable.
Guerin (2012) argues that the unsustainable current account deficit is one of the undesirable effects
of capital flows in developing countries.
The role of FDI in Africa is particularly important as it has been shown that FDI can create positive
externalities under certain conditions (Kobrin, 2005). These host country factors determine the
extent to which host countries can absorb and hence benefit from FDI (Krogstrup and Matar,
2005). It is therefore, important to determine whether those conditions exist in Africa and what
African countries need to do to create favourable conditions and hence benefit from FDI inflows.
The increase in the volume and share of FDI inflows into Africa provides motivation to empirically
investigate the role of FDI and its developmental impact. More importantly, as mentioned by
Amighini et al. (2015), assessing the role of FDI and the conditions under which FDI is likely to
be beneficial or detrimental to development has far-reaching policy implications for African
Page 19
7
governments. Firstly, it enables African governments to review and evaluate the efficiency,
effectiveness and sustainability of the incentives being provided to multinational companies.
Secondly, in the light of growing discussions among African policymakers on the need for the
continent to industrialise it is pertinent to provide clarity on the developmental role of FDI so as
to enhance evidence-based policy formulation.
1.4 Objectives of the Study
• To find out whether there are positive externalities and spillovers from FDI on African
economies.
• To examine the role of absorptive capacity and to determine how to maximise the potential
spillovers.
• To suggest policy proposals on how to improve the developmental impact of FDI in Africa.
Specific Objectives
Chapter 2
• To investigate the impact of FDI on domestic investment.
• To analyse the role of absorptive capacity in the FDI-domestic investment nexus.
Chapter 3
• To examine the effects of FDI on productivity growth in Africa.
• To determine the role of the technology gap on the FDI-productivity growth nexus.
Chapter 4
• To investigate the impact of FDI on exports, imports and profit outflows.
Page 20
8
1.5 Research Questions and Hypotheses Testing
Research Questions
• Chapter 2: Does FDI crowd-in domestic investment in Africa?
• Chapter 3: Does FDI enhance productivity growth in Africa?
• Chapter 4: Does FDI improve the current account in Africa?
Hypotheses Testing
• H10: FDI does not crowd in domestic investment in Africa.
• H20: FDI does not improve productivity growth in Africa.
• H30: FDI does not improve the current account in Africa.
1.6 Gaps in the Literature
While there is a lot of literature on the impact of FDI on economic growth in developing countries,
surprisingly little has been published on the effect of FDI on domestic investment at the macro
level (Adams, 2009; Al Sadig, 2013; Ashraf and Herzer, 2014; Mutenyo et al, 2010). There are
also few studies that investigate the role of host country factors on the relationship between FDI
and domestic investment. Two such studies are by, Farla et al (2014) and Morrissey and
Udomkerdmongkol (2012). Morrissey and Udomkerdmongkol (2012) use annual aggregate data
for 46 developing countries covering the period 1996-2009 to investigate whether the relationship
between FDI and private investment is affected by governance. Farla et al (2014) investigate the
role of institutions on the relationship between FDI and domestic investment using the same
dataset as Morrissey and Udomkerdmongkol (2012).
While results from such studies may be informative, it can be argued that they may be biased and
not representative enough of some countries because of the huge disparities in economic, social
and political conditions among countries in the sample. The studies also only investigate the role
of institutions and yet there are other host country factors that could affect the relationship between
Page 21
9
FDI and domestic investment. Chapter 2 therefore, is an investigation of the role of a number of
host country factors that may influence the nexus between FDI and domestic investment in African
economies both separately and simultaneously. In particular, the chapter analyses how institutional
quality, financial development and trade openness separately and simultaneously affect the impact
of FDI on domestic investment in Africa.
Studies on the impact of FDI inflows on productivity have been mainly concentrated at the micro
level. There is a paucity of literature assessing the role of FDI on productivity growth at cross-
country level (Roy, 2008). Importantly, the role of the technology gap is often neglected. Some of
the studies that attempt to address this issue are Baltabaev (2014); Roy (2008) and Senbeta (2008).
Baltabaev (2014) uses data for 49 countries (including both developed and developing countries)
over the period 1974-2008. The study by Baltabaev (2014) however only includes a few
developing countries. Roy (2008) uses data for a sample of 89 countries in Latin America and
Africa. Senbeta (2008) examines the FDI-productivity nexus for 22 SSA countries for the period
1970-2000. However, the study does not consider the role of the technology gap. Chapter 3
therefore, aims to provide clarity on the impact of FDI on productivity growth conditional on
relative backwardness in 45 African countries over the period 1980-2012.
Chapter 4 provides empirical evidence on the relationship between FDI, exports, imports and profit
outflows in Africa. This is an area that remains largely unexplored in literature. Strauss (2015)
observes that the notion of how profit outflows associated with FDI are driving developing
economies’ current account deficits ‘remains heavily under researched.’ Most of the existing
studies only examine the relationship between FDI and the current account through exports and
imports separately while neglecting the potential role of profit outflows. Hence, the studies do not
consider the overall effect of FDI on the current account deficit through other channels (Kaur et
al, 2012).
Some of the studies that consider the relationship between FDI and profit remittances include:
Seabra and Flach (2005), Yalta (2012) and Strauss (2015). These studies are based on time series
data and do not consider African economies. Seabra and Flach (2005) examine the relationship
between FDI and profit remittances in Brazil while Yalta (2012) analyses the various channels
Page 22
10
through which FDI affects the current account in Turkey. Strauss (2015) studies the contribution
of income repatriations from FDI to South Africa’s current account deficit post-1994. It is therefore
necessary to investigate the relationship between FDI flows and the various components of the
current account in African economies using panel data analysis. Hence, Chapter 4 is an analysis
of the impact of FDI on exports, imports and profit outflows based on panel cointegration and
causality tests.
1.7 Contributions of the Study
Chapter 2 contributes to the existing literature in a number of ways. Firstly, it has been noted by
some scholars, Kumar and Pradhan (2002 and Sylwester (2005), that FDI has differential effects
in different regions. This implies that findings based on cross-regional studies must be interpreted
with caution as they may not be representative enough. For instance, Sylwester (2005) uses a
sample of 29 countries with only two African countries, Tanzania and South Africa. The focus on
African countries therefore helps to reduce any bias that may arise due to sample selection. Our
study builds on the work by Adams (2009) in a number of ways. Firstly, we update the dataset up
to 2012 and use a longer time frame.
Secondly, we incorporate more variables to capture host country factors. Thirdly, we use the
system GMM estimation to control for possible endogeneity among the regressors. Lastly, we
examine how the absorptive capacity factors influence the relationship between FDI and domestic
investment both separately and simultaneously. Previous studies only focus on one absorptive
capacity factor. Solomon (2011) posits that a model that includes multiple interactions of the
absorptive capacity factors and FDI helps to address the problem of omitted variable bias which
may arise owing to the correlation between the absorptive capacity factors. By using a large panel
of 48 African countries over a longer time period (1980-2012) we are able to clarify the impact of
FDI on domestic investment in Africa and the role of host country factors in influencing this
relationship.
Chapter 3 contributes to literature in many ways. Firstly, as in Chapter 2, we narrow our focus to
African countries (45) to help reduce any bias that may arise due to sample selection. This is
Page 23
11
important because of the differential effects of FDI on productivity growth in different regions
(Kumar and Pradhan, 2002 and Sylwester, 2005). This chapter builds on the study by Baltabaev
(2014) who uses a panel of 49 countries (both developed and developing) to examine the
relationship between FDI and productivity growth over the period 1974-2008. We use a dummy
variable for the existence of Investment and Export Promotion Agencies (IPA). We update the
dataset to 2012 and we use two measures of relative backwardness namely: the distance to the
technology leader and the income gap. We analyse both the individual and simultaneous
interactions of FDI with these relative backwardness measures and their impact on productivity
growth. We control for endogeneity, by using the system GMM estimation. We also use the fixed
effects estimation to check for the robustness of the results.
Chapter 4 contributes to literature by uncovering the possible different channels through which
FDI affects the current account in Africa. By focusing on Africa the study captures the unique
characteristics of the region and provides regional-specific policy recommendations. We build on
the work by Yalta (2012) who examines the different channels through which FDI affects the
current account in Turkey. We use panel cointegration techniques that are robust to omitted
variables to estimate the long run relationship between FDI, exports, imports and profit outflows.
Given that we include 47 countries over the period 1980-2012 our sample includes more countries
over a longer time period than the samples used in previous studies in this area. Moreover, by
including lagged explanatory variables panel procedures allow control for potential endogeneity
problems.
1.8 Main Findings of the Study
In Chapter 2, we find that FDI has a negative and mostly significant impact on domestic
investment. In other words FDI has a crowding out effect on domestic investment. These results
are in line with Adams (2009) who finds that a one percent increase in FDI is associated with a
decrease in domestic investment. The interaction terms FDIFree (capturing institutions) and
FDIOpen (capturing trade openness) have a positive and significant effect on domestic investment.
This implies that institutional quality and trade openness play a positive role in mitigating the
substitutionary effect of FDI on domestic investment. Durham (2004) stresses the role of
Page 24
12
institutional development in enhancing the capacity of host countries to absorb superior
technologies. Balasubramanyam et al. (1999) find that FDI is more significant for economic
growth in countries with more open trade regimes. This means that trade openness positively
affects the role of FDI in growth.
In Chapter 3, we find that FDI has general positive but insignificant effect on productivity growth.
This suggests that FDI has a limited impact on productivity growth in Africa. This is line with
findings by, Woo (2009), Ang (2009), Ng (2007) and Ng (2006). Our analysis of the advantage of
relative backwardness does not support the convergence theory of Findlay (1978) and Wang and
Blomstrom (1992). This is seen from the negative and significant sign of the relative backwardness
variables, distance to technological frontier (DTF) and income gap (GAP). Also the interaction
variables FDIDTF and FDIGAP are negative and significant in most of the columns. This is in line
with findings by Li and Liu (2005). This suggests that the lower the technological development in
the host country the smaller is the spillovers from FDI. Therefore, the larger the technological gap
between the US and the African countries, the smaller the spillovers. This observation is also
shared by Glass and Saggi (1998) who posit that relative backwardness is a deterrent as it limits
the kind of technology that can be transferred. Falvey et al (2005) emphasise that having a huge
technological gap is unlikely to lead to greater knowledge diffusion and catch-up, unless certain
preconditions exist that allow countries to absorb the inflow of foreign ideas and knowledge.
In Chapter 4, we find that there is a long run relationship among the variables. Our findings provide
evidence on the adverse long run effects of FDI on the current account in African economies. In
particular, the results show that, FDI inflows lead to a decrease in exports; and an increase in both
imports and profit remittances. These findings confirm that indeed profit outflows by multinational
companies are a main factor driving current account deficits in African countries. The findings are
in line with the results from Yalta (2012); Mencinger (2008); Seabra and Flach (2005); Woodward
(2003) and Campbell (2001)
Page 25
13
1.9 Organisation of the Study
The rest of the study is organised as follows: Chapter 2 examines the ‘The Impact of Foreign Direct
Investment on Domestic Investment in African Economies.’ Chapter 3, focusses on, ‘The Impact
of Foreign Direct Investment on Productivity in African Economies.’ Chapter 4 analyses the ‘The
Impact of Foreign Direct Investment on Exports, Imports and Profit in African Economies.’
Finally, Chapter 5 concludes the study with some policy implications and areas for future research.
Page 26
14
CHAPTER 2: THE IMPACT OF FOREIGN DIRECT INVESTMENT ON DOMESTIC
INVESTMENT IN AFRICAN ECONOMIES
2.1 Introduction
This chapter examines the relationship between FDI and domestic investment conditional on host
country factors, on a panel of 48 African countries over the period 1980-2012. FDI can generate
positive externalities through providing financing, complementing domestic investment and
enhancing competitiveness (Adams, 2009; Kobrin, 2005). The role of FDI as a source of capital is
particularly important for Africa owing to the prevailing huge financing gap and widening current
account and fiscal deficits. This has been exacerbated by the low private domestic savings and the
binding budget constraint facing most African economies. Scholars such as Todaro and Smith
(2003) argue that the inflow of FDI could fill the gap between the desired investment and
domestically mobilised savings. Furthermore, since the majority of African countries do not have
ready access to international financial markets they have to rely on alternative sources of finance
which include, FDI and aid (Adeleke, 2014). Kosova (2010) highlights that from the mid-1990s
FDI has become the major source of external finance for developing countries and is twice as large
as official development aid.
Scholars such as Asiedu (2002) observe that in spite of the huge increase in FDI and its potential
benefits, these resources have not had meaningful impact on development in Africa. Moreover,
FDI inflows to Africa are volatile, concentrated in a few resource rich countries and targeting the
extractive sectors (Pigato, 2000 and Ndikumana and Verick, 2008). Lim (2001) argues that FDI in
the extractive sector may have limited positive impact on growth because of the involvement of
mega projects that often are not labour-intensive and do not utilise locally produced intermediate
inputs. Consequently, as Hsiao and Hsiao (2006) point out, FDI inflows have resulted in the
development of an enclave economy. This concentration of FDI in the extractive sector may
therefore account for the limited positive spillovers from FDI (UNECA, 2006).
The objective of this study is to investigate the impact of FDI on domestic investment in African
economies, taking into account the role of host country factors. These host country factors
determine the extent to which host countries can absorb and hence benefit from FDI (Krogstrup
Page 27
15
and Matar, 2005). The increase in the volume and share of FDI inflows into Africa provides
motivation to empirically investigate the role of FDI and its developmental impact. More
importantly, as mentioned by Amighini et al. (2015), assessing the role of FDI and the conditions
under which FDI is likely to be beneficial or detrimental to development has far-reaching policy
implications for African governments. This is especially pertinent in light of the growing
discussions among African policymakers on the need for the continent to industrialise.
Most studies examine the determinants of FDI flows and their impact on growth. However, there
are surprisingly few studies on the impact of FDI on domestic investment in African countries.
These few studies are also based on a few countries and on dated datasets (see Adams, 2009 and
Herzer et al., 2008). Besides Adams (2009), the limited existing studies on the impact of FDI on
domestic investment do not examine the role of country factors (local conditions). This chapter
therefore aims to fill this gap by providing a clearer understanding on the link between FDI and
domestic investment and the possible role that host country factors may play in shaping this link.
We analyse both the individual and simultaneous interactions of FDI with other domestic
investment determinants and their impact on domestic investment. This entails examining
individually and simultaneously the local conditions that could generate the most auspicious
environment for positive spillovers from FDI. We provide policy-relevant evidence on local
conditions that enhance or hinder the impact of FDI on domestic investment in Africa.
The chapter contributes to the existing literature in a number of ways. Firstly, it has been noted by
some scholars, Kumar and Pradhan (2002 and Sylwester (2005), that FDI has differential effects
in different regions. This implies that findings based on cross-regional studies must be interpreted
with caution as they may not be representative enough. For instance, Sylwester (2005) uses a
sample of 29 countries with only two African countries, Tanzania and South Africa. The focus on
African countries may therefore help to reduce any bias that may arise due to sample selection.
Our study builds on the work by Adams (2009) in a number of ways. Firstly, we update the dataset
up to 2012 and use a longer time frame. Secondly, we incorporate more variables to capture host
country factors. Thirdly, we use the system GMM estimation to control for possible endogeneity
among the regressors. Lastly, we examine how the host country (absorptive capacity) factors
influence the relationship between FDI and domestic investment both individually and
Page 28
16
simultaneously. Most of the previous studies only focus on one absorptive capacity factor at a
time. Solomon (2011) highlights that a model that includes multiple interactions of the absorptive
capacity factors and FDI helps to address the problem of omitted variable bias which may arise
owing to the correlation between the absorptive capacity factors. Therefore, by including a number
of host country factors this chapter clarifies the impact of FDI on domestic investment in Africa.
To conduct the empirical investigation we apply the dynamic ordinary least squares (OLS), fixed
effects (FE), random effects (RE) and the system GMM models on annual data for 48 African
economies from 1980 to 2012. Using different methods helps to check the robustness of the results.
In particular, the use of the system GMM approach is an improvement from the estimation
methodologies of past literature which used the fixed and random effects models. The system
GMM methodology helps to control for the potential endogeneity of all variables and the
unobserved country effects (Solomon, 2011). The rest of the chapter is organised as follows:
section 2.2 details the trends and patterns of FDI inflows in Africa. Section 2.3 reviews and
discusses the related literature. Section 2.4 presents the data description and model specification.
Section 2.5 presents the estimation and analysis of the results and section 2.6 conducts robustness
checks. Section 2.7 concludes with some policy recommendations.
2.2 Trends and Patterns of FDI inflows in Africa
FDI to Africa has grown rapidly in recent decades. Despite this, a number of studies have
highlighted that Africa remains largely marginalised in terms of financial globalisation
(Ndikumana and Verick, 2008; Ogunleye, 2009). Many governments in SSA have proactively
sought and provided a number of generous tax and non-tax incentives to attract FDI in an effort to
leverage the potential positive externalities and to close the huge financing and technology gaps.
African countries have also considered FDI to be a driver of economic development. In fact, one
of the principal objectives for the establishment of the New Partnership for Africa’s Development
(NEPAD) is to accelerate FDI inflows to the region (Funke and Nsouli, 2003).
In 1980, FDI inflows as a percentage of SSA GDP equalled 0.09 percent, while in 2012 the share
had risen to 3.19 percent. On the other hand, FDI inflows as a percentage of gross fixed capital
Page 29
17
formation equalled about 0.5 percent in 1980, and increased to 16.39 percent in 2012 (see Table
1.1). FDI inflows to Africa have been unevenly distributed with a few, mostly large and resource
intensive, countries attracting a significant proportion of the FDI inflows at the expense of smaller
and resource-deficient countries. As shown in Table 2.1, in 2012 the top 10 FDI recipients received
83.4 percent of the total FDI inflows to Africa. Three African countries namely: Nigeria,
Mozambique and South Africa accounted for 41 percent of total FDI inflows into Africa.
Table 2.1: Top Ten Recipients of FDI in Africa, 2008, 2010 and 2012.
2008 2010 2012
South Africa (23.5%)
Nigeria (21.5%)
Sudan (6.8%)
Congo (6.6%)
DRC (4.5%)
Angola (4.4%)
Tanzania (3.6%)
Ghana (3.2%)
Madagascar (3.0%)
Zambia (2.4%)
Nigeria (20.4%)
DRC (9.8%)
Equatorial Guinea (9.1%)
Ghana (8.4%)
Congo (7.4%)
Sudan (6.9%)
Tanzania (6.1%)
Zambia (5.8%)
South Africa (4.1%)
Mozambique (3.4%)
Nigeria (17.1%)
Mozambique (12.7%)
South Africa (11.2%)
DRC (8.1%)
Ghana (8.0)
Congo (6.7%)
Sudan (6.0%)
Equatorial Guinea (5.2%)
Uganda (4.2%)
Tanzania (4.2%)
Total (79.5%) Total (81.4%) Total (83.4%)
Source: FDI data is from the UNCTAD database.
FDI inflows to Africa have traditionally been concentrated mainly in the extractive sectors such as
oil, gas and mining. This trend is however slowly changing with a rising share of FDI targeted at
the non-extractive sector such as light manufacturing and services (UNCTAD, 2012). A number
of studies find that the effect of FDI on growth and development depends on the sector through
which FDI enters the country (Alfaro, 2003; Alfaro and Charlton, 2007; Blalock and Gertler, 2009)
and also the local conditions existing in the host country (Durham, 2004; Hermes and Lensick,
2003). Alfaro (2003) analyses data for 47 countries over the period 1981-1999 to investigate the
role of the different sectors in the FDI-growth nexus. The results show that the impact of FDI on
growth is conditional on the sector through which FDI enters the host country. In particular, he
finds that FDI contributes to growth only when it enters the host country through the manufacturing
sector and that FDI through the primary sector has a negative effect on growth. The results are
however ambiguous for the services sector. In a related study, Alfaro and Charlton (2007) uses
Page 30
18
industry level data from 29 countries for the period 1985-2000 and find that FDI increases growth
when we account for the ‘quality’ of FDI, adding that FDI at the industry level contributes to
higher growth. FDI inflows to Africa have been highly volatile and this volatility can affect the
current account, increase macroeconomic uncertainty and undermine the ability of governments’
ability to implement and sustain long-term development plans. Fosu (2001) argues that by
introducing instability into private investment or imports, such volatility may adversely affect
growth. Table 2.2 presents the regional distribution of FDI as a total share of FDI inflows to
developing countries for Africa, Latin America and Asia.
Table 2.2: Regional Distribution of FDI.
1970-1980 1980-1990 1990-2000 2000-2010
Africa
Nigeria
South Africa
15.9
5.4
1.6
6.4
2.1
0.1
3.9
1.3
0.7
5.2
1.2
1.1
Latin America
Argentina
Brazil
Mexico
47.6
2.2
21.4
7.6
31.8
2.8
8.4
11.6
35.6
5.8
8.4
7.2
30
1.9
7.7
8.1
Asia
China
Hong Kong
South Korea
Singapore
29.3
0.0
4.5
1.8
5.1
43.3
7.9
10.4
1.6
9.3
56.2
7.6
2.1
2.0
7.2
55.4
12.5
2.4
3.6
6.3
Note: FDI is measured as a share of total FDI inflows to developing countries.
Source: FDI data is from the UNCTAD database.
As shown in Table 2.2 Latin America was the biggest recipient of FDI among developing countries
in the 1970s. This however changes from the 1980s as Asia overtakes Latin America. Africa on
the other hand has attracted a miniscule share of FDI inflows into developing countries, averaging
only a paltry 5.2 percent in the 2000s down from 15.9 percent in the 1970s. This is in spite of the
fact that FDI inflows as a percentage of GDP increased from 0.09 in 1980 to 0.42 percent in 1990
and 1.94 percent in 2000 and 2.75 percent by 2010 (see Table 1.1). According to the 1999
UNCTAD Report on Foreign Direct Investment in Africa: Performance and Potential, FDI in
Africa lags far behind the flows to other developing regions in part because of the generally
negative image of the continent which tends to obfuscate the diverse opportunities that investors
Page 31
19
can exploit. Moreover, growth in Africa has lagged behind other developing countries. The
changes in the regional distribution of FDI over the years also reflects the rising dominance of the
Asian economies notably China as economic powerhouses.
African countries that have been able to attract most FDI have been those with an abundance of
natural and mineral resources as well as large domestic markets. Traditionally, foreign investors
to Africa came from Europe and to a lesser extent from North America. Lately, investors from the
BRICS, Malaysia, and South Korea have been increasingly engaged in African countries. Intra-
Africa FDI is also increasing, led by South African company investments, particularly in Southern
Africa. Nevertheless, many of these South African companies have significant foreign ownership.
Linkages between local and foreign firms in Africa have been very low (UNCTAD, 2013). The
2013 UNCTAD report highlights that the many generous incentives offered to foreign investors
by many African governments have disadvantaged domestic firms and hence they have been
detrimental to the growth of local enterprises and domestic entrepreneurship. Moreover, these
incentives have not attracted FDI inflows into strategic and priority sectors of the African
economies such as manufacturing and infrastructure development. While FDI has been on the
increase, public and private investments remain inadequate. Fosu et al. (2012) find that growth in
African countries has been hampered by public ‘underinvestment’ as actual public investment has
remained below the level required to attain high growth.
2.3 Literature Review
At the theoretical level FDI has been shown to be beneficial to the host country. In the neoclassical
growth model for instance, FDI promotes economic growth by augmenting the capital stock and
enhancing its efficiency (Li and Liu, 2005). In the endogenous growth model, FDI raises economic
growth by generating technological diffusion from the developed countries to the underdeveloped
host country (Borensztein et al, 1998). Thus, FDI is often seen as a composite bundle of capital
stock, knowledge and technology which can improve the existing stock of knowledge in the
recipient economy through labor training, skill acquisition and diffusion, and the introduction of
efficient management practices (Balasubramanyam et al, 1999 and De Mello, 1999).
Page 32
20
Empirical literature on the impact of FDI on domestic investment is mixed. Some scholars argue
that FDI complements (crowds in) domestic investment (Amighini et al, 2015; Farla et al, 2014;
Al-Sadig, 2013; Ramirez, 2011; Ndikumana and Verick, 2008). On the other hand, some scholars
contend that FDI crowds out domestic investment (Morrissey and Udomkerdmongkol, 2012;
Mutenyo et al., 2010; Titarenko, 2006). Some studies view FDI as having a neutral effect on
domestic investment (Chowdhary and Kushwaha, 2013; Sağlam and Yalta 2012; Lipsey, 2000).
Studies by scholars such as Agosin and Machado (2005) and Wang (2010) find that FDI inflows
have a neutral effect, crowding in effect or crowding out effect on domestic investment depending
on the country. Furthermore, Agosin and Machado (2005) argue that FDI can influence the
structure of the capital stock which, depending on the response by local investors, may lead to
either a crowding in or crowding out effect.
The proponents of the crowding in effect argue that the entry of foreign firms creates new demand
for inputs which can be provided by local firms as complements to those imported from the home
countries (Cardoso and Dornbusch, 1989). De Mello (1999), highlights that competitive local firms
may positively respond to FDI inflows by enhancing and updating their capital stock. Similarly,
Hermes and Lensick (2003) argue that increased competition is likely to lead to increased
productivity, efficiency and investment in both human and physical capital. Furthermore, the
increase in competition may result in reduction in prices, changes in the industrial structure
towards more competitiveness and export-oriented production.
However, FDI may also have negative effects on the host country. FDI can decrease domestic
investment when it takes away investment opportunities of local investors through licenses, skilled
labour, credit facilities, which may reflect the superiority of FDI over domestic investment
(Markusen and Venables, 1999). Easterly (1993) observes that the generous incentives offered to
foreign firms may distort incentives for domestic firms thereby discouraging investment by local
firms. This effect is called, the ‘adverse incentive effect.’ Similarly, Colen et al (2008) highlight
that offering tax and non-tax incentives to attract FDI inflows may create a distortion that
negatively affects domestic investment thereby limiting the spillover effects. Gardiner (2000)
argues that the ‘monopolistic tendencies’ of multinational enterprises (MNEs) may displace local
Page 33
21
firms and that the larger the proportion of the economy of host countries controlled by these MNEs
the greater the negative externalities. Herzer et al (2008) argue that the entry of MNEs may create
unfair competition that displaces domestic firms.
Morrissey (2012) highlights the limited impact that FDI has had in African economies with respect
to the creation of linkages and spillovers on the local economy. These limited effects are generally
attributed to (i) limited ‘absorptive capacity’ of domestic firms; (ii) concentration of FDI inflows
in the resource sector rather than in manufacturing; (iii) the presence of corruption and political
instability, which limits the inflows of market-seeking and efficiency-seeking FDI. In turn,
Amendolagine et al. (2013) examine the factors that affect linkages between foreign and local
firms using firm-level data for 19 countries in SSA. They find that the lack of a vibrant domestic
private sector, lack of adequate infrastructure and skilled labour, low absorptive capacity, and
policy incoherence also contribute to weak linkages between local and foreign enterprises.
In a seminal paper that developed a theoretical model of FDI, Agosin and Machado (2005) analyse
the extent to which FDI in developing countries crowds in or crowds out domestic investment. The
study uses panel data for the period 1971–2000 based on 12 countries drawn from Africa, Asia
and Latin America. The results show that, in all the three developing regions, FDI has, at best, left
domestic investment unchanged, and that there are several sub-periods for specific regions where
FDI crowds out domestic investment. In particular, there seems to be a clear crowding out of
domestic investment in Latin America. Adams (2009) in an empirical examination of the impact
of FDI and domestic investment on economic growth in 42 Sub-Saharan Africa for the period
1990-2003 also finds a net crowding out effect.
On the other hand, Elboiashi et al. (2009) examine the relationship between FDI inflows, domestic
investment and economic growth in Egypt, Morocco and Tunisia during the period 1970–2006
using cointegration and causality tests. They find that FDI inflows had a short run negative effect
and a long run positive effect on both domestic investment and economic growth. Additionally,
they also find that there is a unidirectional causality between FDI inflows and economic growth in
Egypt and Morocco and a bidirectional causality between FDI inflows and economic growth in
Tunisia. FDI inflows crowded in domestic investment in the short run while FDI inflows crowded
Page 34
22
out domestic investment in the long run. Similarly, Eregha (2012) investigates the relationship
between FDI and domestic investment in the ECOWAS countries over the period 1970-2008 using
panel error correction methodology. The results show that foreign direct investment crowds out
domestic investment in the region during the sample period.
Some emerging literature has shown that the effect of FDI is determined by the local conditions
existing in the host country (Hermes and Lensink 2003; Durham, 2004). Some of these local
conditions (absorptive factors) include: the level of human capital (Lu and Liu 2005); the level of
financial development (Durham, 2004; Alfaro et al, 2004); the level of institutional quality
(Durham, 2004); the technological gap (De Mello, 1999); the level of economic development
(Blomstrom et al, 1994) and trade openness (Makki and Somwaru, 2004). Massoud (2008) argues
that the level of financial development is important because lack of financial market development
may prevent foreign and domestic investors from accessing the requisite financial resources. Using
panel data for Arab countries from 1975-2000 Sadik and Bolbol (2003) find that a certain threshold
of financial market development must be reached to gain from FDI inflows.
Other studies for instance, Carkovic and Levine (2002), however argue that host country factors
do not have a significant effect on the relationship between inward FDI and economic growth.
Using the system GMM, they find that neither FDI nor the interaction terms are statistically
significant. They note that previous studies that indicate that FDI has a positive effect on growth
have to be viewed with caution because they do not adequately control for endogeneity.
However, while there is a lot of literature on FDI and growth in developing countries, surprisingly
little has been published on the effect of FDI on domestic investment in African countries at the
macro level (Adams, 2009; Al Sadig, 2013; Ashraf and Herzer, 2014; Mutenyo et al, 2010). More
importantly, there are few studies that investigate the role of multiple host country factors on the
relationship between FDI and domestic investment in African economies. Two such studies are
by, Farla et al (2014) and Morrissey and Udomkerdmongkol (2012). Morrissey and
Udomkerdmongkol (2012) use annual aggregate data for 46 developing countries covering the
period 1996-2009 to investigate whether the relationship between FDI and private investment is
affected by governance. Farla et al (2014) investigate the role of institutions on the relationship
Page 35
23
between FDI and domestic investment using the same dataset as Morrissey and
Udomkerdmongkol (2012). While results from such studies may be informative, it can be argued
that they may be biased and not be representative enough of some countries because of the huge
disparities in economic, social and political conditions between countries in the sample. The
studies also only investigate the role of institutions and yet there are other host country factors that
can affect the relationship between FDI and domestic investment.
This chapter therefore, investigates the role of a number of host country factors that may influence
the nexus between FDI and domestic investment on African economies both individually and
simultaneously. In particular, the chapter analyses how institutions, financial development and
trade openness individually and simultaneously influence the impact of FDI on domestic
investment in African economies. The focus on Africa with largely similar social, economic and
political conditions helps to make the results more representative and reduce any bias due to
sample selection (Adams, 2009).
2.4 Data and Model Specification
2.4.1 Data Description
We use annual data obtained from the World Bank World Development Indicators (WDI), the
International Monetary Fund (IMF) World Economic Outlook database, the UNCTAD database
and the Freedom House database for the period 1980 to 2012. We use a panel comprising 48
African countries. Table 2.3 below shows the list of countries included in our sample.
Page 36
24
Table 2.3: List of Countries.
Algeria Congo Libya Senegal
Angola DRC Madagascar Seychelles
Benin Egypt Malawi Sierra Leone
Botswana Equatorial Guinea Mali South Africa
Burkina Faso Ethiopia Mauritania Sudan
Burundi Gabon Mauritius Swaziland
Cameroon Gambia Morocco Tanzania
Cape Verde Ghana Mozambique Togo
Central Africa Republic Guinea Namibia Tunisia
Chad Guinea-Bissau Niger Uganda
Cote d'Ivoire Kenya Nigeria Zambia
Comoros Lesotho Rwanda Zimbabwe
The choice of control variables is influenced by existing literature and importantly also the
availability of data. The dependent variable is the measure of the ratio of domestic investment (DI)
to gross domestic product (GDP) as a percentage. We subtract FDI inflows as a share of GDP from
gross fixed capital formation (GFCF) so as to prevent double counting (Kumar and Pradhan, 2002;
Nath, 2005). . In many developing countries domestic savings have been shown to play a key role
in financing investment (Agenor, 2004). Hence, we use gross national savings as another control
variable. We follow Roubini and Sala-i-Martin (1992) by incorporating inflation to control for
macroeconomic instability and uncertainty. It is expected to have a negative effect on domestic
investment.
We include the lagged GFCF/GDP to capture the fact that current investment decisions have a
strong path dependence owing to depreciation and the structural dynamics in the economy (Agosin
and Mayer, 2000; Kumar and Pradhan, 2002; Amighini et al, 2015). This is expected to encourage
local investors to invest more since this may be a sign of a favorable investment climate (Al Sadig,
2013). Moreover, the lagged dependent variable helps to capture short run autoregressive behavior
of the dependent variable (Adams, 2009). The lagged dependent variable also helps to control for
the effect of potentially relevant, but omitted, variables and to control for serial correlation (Ashraf
and Herzer, 2014). We use the growth rate in real GDP (RGDP) to capture the accelerator effect
and it is expected to have a positive effect on domestic investment.
Page 37
25
We use the degree of openness of the host country which is measured by the sum of exports and
imports as a percentage of GDP. A high degree of trade openness is expected to lead to an increase
in domestic investment. We follow Alfaro et al (2004) who use private credit as a share of gross
domestic product (GDP) to measure financial development. This is expected to have a positive
effect. The quality of institutions is proxied by an index of democracy from Freedom House. The
index combines measures of political rights and civil liberties. The data ranges from one to seven.
A rating of one implies “there are competitive parties or other political groupings, the opposition
plays an important role and has actual power” and a rating of seven indicates that political rights
are absent (Asiedu and Lien, 2010). We also include public investment as a percentage of GDP.
Emerging literature has shown that the impact of FDI on both economic growth and domestic
investment is affected by local conditions in the host country. Some of these factors include: trade
openness, the level of financial development and the level of institutional quality. The level of
financial development is important because a lack of financial market development may prevent
investors from accessing the financial resources required (Massoud 2008). Hermes and Lensink
(2003) and Alfaro et al. (2004) argue that countries with a better financial system can exploit FDI
more efficiently. They point out that a more developed financial system positively contributes to
the process of technological diffusion associated with FDI inflows. Therefore, the quality of
financial system may influence the impact of FDI on the diffusion of technology in the host
country. The diffusion of technology is more efficient in host countries with a better financial
system.
A number of scholars identify the importance of trade openness in enhancing or mitigating the
effect of FDI on domestic investment and economic growth. Grossman and Helpman (1990) posit
that an open trade regime is significantly related with good investment climates, technological
externalities and learning effects. They emphasise that trade contributes to the diffusion of
knowledge largely through the process of imitation of the knowledge capital embedded in the
product. Balasubramanyam et al. (1999) and Makki and Somwaru (2004) find that the effect of
FDI inflows on economic growth is dependent on the degree of openness. Edwards (1998) argues
that a country with a greater degree of openness can absorb the new technology brought by FDI at
a faster rate than a country with a lower degree of openness. Frankel and Romer (1999) also argue
Page 38
26
that trade openness can help to facilitate more efficient production of goods and services through
shifting production to economies that have comparative advantages. Adhikary (2011) argues that
a more open trade policy framework promotes the allocative efficiency of investment by
reorienting production factors to sectors that have comparative advantages in trade, thereby
boosting economic growth.
Other scholars highlight the role of institutional quality. Olofsdotter (1998) argues that the ability
to absorb the new technology provided by FDI inflows can be emphasised in countries with higher
institutional quality. Similarly, Durham (2004) finds that FDI inflows are more beneficial in
countries with higher levels of institutional (as measured by business regulation index and property
rights index). Durham also finds that the host country that passes a minimum threshold of
institution quality enjoys a positive impact of FDI on economic growth. Ayal and Karras (1998)
examine the effect of institution quality measured by economic freedom index components on
economic growth in 58 countries from 1975 to 1990 and find that economic freedom index has a
positive impact on economic growth.
We therefore, include 3 interaction terms namely: FDICredit; FDIOpen and FDIFree to capture
the impact of these host country factors on the FDI-domestic investment nexus. FDICredit is the
interaction term between FDI and financial market development. FDIFree is the interaction term
between FDI and institutions. FDIOpen is the interaction term between FDI and trade openness.
The interaction terms capture the effect of host country factors. If the coefficient on the interaction
term is significant, it implies that the effect of FDI on domestic investment depends on the level
of absorptive capacity (Azman-Saini et al, 2010).
Table 2.4 presents the summary statistics for the variables used in the analysis. Domestic
investment is on average around 17.52 percent of GDP in the 48 African countries with a minimum
value of -12.4 percent in Angola in 2003 and a maximum value of 58.1 percent in the Republic of
Congo in 1982. FDI averages 2.67 percent with a minimum value of -14.68 percent in Sierra Leone
in 1986 and a maximum value of 90.46 in Equatorial Guinea in 1996. Gross national savings have
a mean value of 15.83 percent with a minimum value of -107.36 in Cape Verde in 1980 with a
maximum value of 97.02 in Sudan in 1982. RGDP averages 3.86 percent with a minimum value
Page 39
27
of -62.08 percent in Libya in 2011 and a maximum value of 149.97 percent in in Equatorial Guinea
in 1997. Inflation averages 23.71 percent over the period with huge variations ranging from -19.41
percent in Togo in 1989 to 23,773.1 percent in the DRC in 1994. Credit has an average value of
2.66 and ranges from -0.38 in Burundi in 1997 to 5.12 in South Africa in 2007 while debt averages
-0.74 with a minimum value of -7.92 in Chad in 2011 and a maximum value of 4.01 in Cape Verde
in 2012. Open averages 4.14 with a minimum value of 1.84 in Ghana in 1982 and a maximum
value of 5.62 in Equatorial Guinea in 1998. Institutions (Free) have the lowest variation with a
standard deviation of 0.49 and averages 1.5.
Table 2.4: Descriptive Statistics.
Variable Obs Mean Std. Dev. Min Max
DI 1584 17.52 8.4 -12.4 58.1
FDI 1584 2.67 5.55 -14.68 90.46
Savings 1584 15.83 13.63 -107.36 97.02
RGDP 1584 3.86 7.75 -62.08 149.97
Inflation 1584 23.71 611.13 -19.41 23773.1
Credit* 1584 2.66 0.89 -0.38 5.12
Debt* 1584 -0.74 1.28 -7.92 4.01
Open* 1584 4.14 0.5 1.84 5.62
Free* 1584 1.5 0.49 0 1.94
FDIFree 1584 3.91 9.65 -23.63 176.02
FDIOpen 1584 12.06 27.59 -48.35 495
FDICredit 1584 6.63 12.33 -24.8 139.51
*This variable is included as ln (variable).
Source: the author calculations.
Table 2.5 presents the pair-wise correlation among the variables. The correlation matrix provides
a crude expectation of the relationship between these variables. There is a negative and statistically
significant relationship between domestic investment and FDI at the one percent level of
significance. This preliminary result indicates that FDI has a crowding out effect on domestic
investment. Domestic investment has a strong positive correlation with Savings, RGDP, Credit,
and Open. While Inflation, Free, FDIFree, FDIOpen and FDICredit have a negative and
statistically significant relationship with domestic investment.
Page 40
28
Table 2.5: Pair-wise Correlation Matrix.
DI FDI Savings RGDP Inflation Credit
DI 1
FDI -0.1*** 1
Savings 0.35*** 0.04* 1
RGDP 0.07*** 0.27*** 0.15*** 1
Inflation -0.04 -0.02 -0.03 -0.04* 1
Credit 0.28*** -0.09*** 0.16*** -0.08*** -0.11*** 1
Debt 0.01 -0.09*** -0.1*** -0.11*** 0.04 -0.07***
Open 0.24*** 0.37*** 0.3*** 0.14*** -0.03 0.24***
Free -0.1*** -0.04 -0.08*** -0.06*** 0.03 -0.25***
FDIFree -0.1*** 0.96*** 0.03 0.27*** -0.01 -0.14***
FDIOpen -0.08*** 0.99*** 0.05* 0.27*** -0.02 -0.09***
FDICredit -0.06*** 0.91*** 0.07*** 0.19*** -0.02 0.09***
Debt Open Free FDIFree FDIOpen FDICredit
Debt 1
Open -0.02 1
Free 0.05** -0.22*** 1
FDIFree -0.09** 0.32*** 0.12*** 1
FDIOpen -0.08** 0.38*** -0.03 0.97*** 1
FDICredit -0.08** 0.38*** -0.14*** 0.81*** 0.89*** 1
Notes: *, **, and *** indicate statistical significance at 10%, 5% and 1% levels, respectively.
Source: the author’s calculations.
2.4.2 Model Specification
The theoretical model used in this study is a ‘partial adjustment’ model adapted from Agosin and
Machado (2005). Domestic investment in the economy is the sum of the investment undertaken
by the domestic firms and the investment undertaken by multinational companies (MNCs). This
can be represented as follows:
𝐷𝐼𝑖𝑡 = 𝐼𝑑,𝑖𝑡 + 𝐼𝑓,𝑖𝑡 (2.1)
𝐼𝑑,𝑖𝑡 is assumed to be a stock adjustment model that responds to the difference between the desired
capital stock (K*) and the actual capital stock (K). Domestic investment is assumed to adjust
partially to this difference owing to the fact that domestic firms face liquidity constraints.
Page 41
29
Following Azman-Saini et al (2010), we model the impact of FDI on domestic investment and the
conditional role of absorptive country factors (ABC) as follows:
𝐷𝐼𝑖𝑡 = 𝛼𝐷𝐼𝑖𝑡−1 + 𝛽1𝐹𝐷𝐼𝑖𝑡 + 𝛽2(𝐹𝐷𝐼𝑖𝑡 ∗ 𝐴𝐵𝐶𝑖𝑡) + 𝛽3𝑋𝑖𝑡 + 𝜂𝑖 + 휀𝑖𝑡 (2.2)
where 𝑖 is the home country index, 𝑡 is the time index, 𝛼 and 𝛽 are the unknown parameters to be
estimated, 𝐴𝐵𝐶𝑖𝑡 is the absorptive capacity (host country factor) in home country, 𝑋𝑖𝑡 is a vector
of control variables that affect domestic investment, 𝜂𝑖 is unobserved country-specific effect term,
and 휀𝑖𝑡 is the error term. (𝐹𝐷𝐼𝑖𝑡 ∗ 𝐴𝐵𝐶𝑖𝑡) is the interaction term. The interaction term captures the
effect of the local conditions. We include the interaction terms FDI*Credit to test the role of
financial market development; (FDI*Open), to test the role of trade openness; and FDI*Free to
test the role of institutions.
If the coefficient on FDI (𝛽1) is positive and significant (𝛽1> 0) then it means an increase in FDI
leads to crowding in of domestic investment and if the estimated coefficient on FDI is negative
and significant (𝛽1 < 0) then it means an increase in FDI is associated with a decrease in the
country’s domestic investment or a crowding out effect. If the coefficients of the interaction terms
are positive and significant, then it is interpreted that FDI positively affects domestic investment
through either interactions with trade openness, financial market development or institutions.
2.5 Estimation and Results
2.5.1 Methodology
This chapter applies the dynamic ordinary least squares (OLS), fixed effects (FE), random effects
(RE), and the system GMM methodologies. We estimate a linear dynamic panel data (DPD) model
to capture the effect of lagged domestic investment on current domestic investment. Hsiao (1986)
argues that a dynamic panel model allows dynamic effects to be introduced into the model and
allows feedback from current or past disturbances. Thus, by including lagged domestic investment
this helps to account for the dynamic process of domestic investment. The lagged dependent
variable also helps to control for the effect of potentially relevant, but omitted, variables and to
deal with the problem of serial correlation (Ashraf et al, 2014).
Page 42
30
The system GMM estimator enables us to control for the unobserved country-specific factors. FDI
inflows are likely to be endogenous and determined jointly with the rate of domestic investment.
That is, there is a two-way relationship between domestic investment and FDI flows. The system
GMM estimator helps to solve the endogeneity problem by using internal instrumental variables
based on lagged values of the dependent and independent variables. In this case, the instruments
for the regression in differences are lagged levels while those for the regression in levels are the
lagged differences of the corresponding variables.
Following Arellano and Bond (1991), we transform equation (2.2) into first differences to
eliminate country specific effects as follows:
𝐷𝐼𝑖𝑡 − 𝐷𝐼𝑖𝑡−1 = 𝛼(𝐷𝐼𝑖𝑡−1 − 𝐷𝐼𝑖𝑡−2) + 𝛽1(𝐹𝐷𝐼𝑖𝑡 − 𝐹𝐷𝐼𝑖𝑡−1) + 𝛽2(𝐹𝐷𝐼𝑖𝑡 ∗ 𝐴𝐵𝐶𝑖𝑡 − 𝐹𝐷𝐼𝑖𝑡−1 ∗
𝐴𝐵𝐶𝑖𝑡−1) + 𝛽3(𝑋𝑖𝑡 − 𝑋𝑖𝑡−1) + (휀𝑖𝑡 − 휀𝑖𝑡−1) (2.3)
To address the possible simultaneity bias of explanatory variables and the correlation between
(𝐷𝐼𝑖𝑡−1 − 𝐷𝐼𝑖𝑡−2) and (휀𝑖𝑡 − 휀𝑖𝑡−1) we use the lagged levels of the regressors as instruments in line
with Arellano and Bond (1991). However, this is only valid assuming that: the error term is not
serially correlated and that the lag of the explanatory variables is weakly exogenous. This is known
as difference GMM estimation and results in the following moment conditions being established:
Ε[𝐷𝐼𝑖𝑡−𝑠 · (휀𝑖𝑡 − 휀𝑖𝑡−1)] = 0 𝑓𝑜𝑟 𝑠 ≥ 2; 𝑡 = 3, … , 𝑇 (2.4)
Ε[𝐹𝐷𝐼𝑖𝑡−𝑠 · (휀𝑖𝑡 − 휀𝑖𝑡−1)] = 0 𝑓𝑜𝑟 𝑠 ≥ 2; 𝑡 = 3, … , 𝑇 (2.5)
Ε[𝐴𝐵𝐶𝐼𝑖𝑡−𝑠 · (휀𝑖𝑡 − 휀𝑖𝑡−1)] = 0 𝑓𝑜𝑟 𝑠 ≥ 2; 𝑡 = 3, … , 𝑇 (2.6)
Ε[𝑋𝑖𝑡−𝑠 · (휀𝑖𝑡 − 휀𝑖𝑡−1)] = 0 𝑓𝑜𝑟 𝑠 ≥ 2; 𝑡 = 3, … , 𝑇 (2.7)
The difference GMM estimation however has some problems. Alonso-Borrego and Arellano
(1999) and Blundell and Bond (1998) show that when the explanatory variables are persistent the
Page 43
31
lagged levels of the variables become weak instruments. This results in biased parameter estimates
in small samples and larger variance asymptotically (Blundell and Bond, 1998). To eliminate this
problem Arellano and Bover (1995) propose the system GMM which combines both the difference
equation (2.3) and the level equation (2.2). Additional moment conditions for the second part of
the system (the regression in levels) are established as follows:
Ε[(𝐷𝐼𝑖𝑡−𝑠 − 𝐷𝐼𝑖𝑡−𝑠−1) · ( 𝜂𝑖 + 휀𝑖𝑡)] = 0 𝑓𝑜𝑟 𝑠 = 1 (2.8)
Ε[(𝐹𝐷𝐼𝑖𝑡−𝑠 − 𝐹𝐷𝐼𝑖𝑡−𝑠−1) · ( 𝜂𝑖 + 휀𝑖𝑡)] = 0 𝑓𝑜𝑟 𝑠 = 1 (2.9)
Ε[(𝐴𝐵𝐶𝑖𝑡−𝑠 − 𝐴𝐵𝐶𝑖𝑡−𝑠−1) · ( 𝜂𝑖 + 휀𝑖𝑡)] = 0 𝑓𝑜𝑟 𝑠 = 1 (2.10)
Ε[(𝑋𝑖𝑡−𝑠 − 𝑋𝑖𝑡−𝑠−1) · ( 𝜂𝑖 + 휀𝑖𝑡)] = 0 𝑓𝑜𝑟 𝑠 = 1 (2.11)
2.5.2 Results
We first carry out panel unit root tests in order to determine if the variables are stationary or not.
This is an important step which has however been ignored by past researchers. Since panel data
methodology uses both time and cross sectional analyses it is imperative that the variables should
be stationary in order to avoid possible spurious relationships among the variables (Bayar, 2014).
We use the Levin, Lin and Chu (2002) and the Im, Pesaran and Shin (2003) unit root tests to test
for the presence of a unit root in the panel. As shown in Table 2.6 all the variables are stationary.
Page 44
32
Table 2.6: Panel Unit Root Tests.
DI FDI Savings RGDP Inflation Credit
IPS W-stat
Levels -2.67*** -2.48*** -9.27*** -16.46*** -13.51*** 0.57
[P-value] [0.00] [0.00] [0.00] [0.00] [0.00] [0.71]
Differences -24.66*** -27.81*** -29.72*** -37.28*** -32.69*** -17.58***
[P-values] [0.00] [0.00] [0.00] [0.00] [0.00] [0.00]
LLC t*-stat
Levels -3.03*** -2.29*** -10.87*** -12.5*** -8.61*** -1.11*
[P-value] [0.00] [0.01] [0.00] [0.00] [0.00] [0.09]
Differences -19.89*** -21.37*** -28.53*** -28.17*** -27.04*** -15.22***
[P-value] [0.00] [0.00] [0.00] [0.00] [0.00] [0.00]
Debt Open Free FDIFree FDIOpen FDICredit
IPS W-stat
Levels 3.78 -2.36*** -2.59*** -3.56*** -2.12*** -1.62**
[P-value] [0.99] [0.00] [0.00] [0.00] [0.01] [0.05]
Differences -13.96*** -23.67*** -22.41*** -27.67*** -27.66*** -26.98***
[P-values] [0.00] [0.00] [0.00] [0.00] [0.00] [0.00]
LLC t*-stat
Levels 3.12* -3.65*** -3.69*** -2.7*** -1.82** -0.89
[P-value] [0.09] [0.00] [0.00] [0.00] [0.03] [0.10]
Differences -11.92*** -21.31*** -18.85*** -21.2*** -21.13*** -19.61***
[P-value] [0.00] [0.00] [0.00] [0.00] [0.00] [0.00]
Notes: *, **, and *** indicate statistical significance at 10%, 5% and 1% levels, respectively. P-values are in square brackets.
Source: the author’s calculations.
The estimation results for the whole sample are summarised and presented in Tables 2.7-2.11. The
variables of interest are FDI and the interaction terms (FDICredit, FDIOpen and FDIFree). Firstly,
we determine whether FDI has any effect on domestic investment without conditioning on the
absorptive capacity. Importantly, the results in all the Tables show that FDI has a negative and
mostly significant effect on domestic investment. In other words FDI has a crowding out effect on
domestic investment.
The results from the dynamic ordinary least squares estimation are presented in Table 2.7. We
carry out a Hausman test to determine the appropriateness of the fixed effects and random effects
models. The results are not reported but show that the fixed effects is the more appropriate model
Page 45
33
since the p-value is less than 5 percent. We however report results from both models to check for
robustness. Table 2.8 presents the results of the fixed effects estimation and Table 2.9 shows the
results of the random effects estimation. Table 2.10 presents the results from the one step system
GMM and Table 2.11 shows the results from the two step system GMM.
As shown in Table 2.7, a one percent increase in FDI is associated with a decrease in domestic
investment ranging from 0.14-0.63 percent in the current period. Likewise, in Table 2.8 we see
that a one percent increase in FDI is associated with a decrease in domestic investment of between
0.09-0.65. In Table 2.9 we observe that a one percent increase in FDI is associated with a decrease
in domestic investment of between 0.06-0.63 while the decrease is between 0.31-2.44 percent in
Table 2.10 and 0.35-2.00 percent in Table 2.11. This therefore confirms that there is a crowding
out effect of FDI on domestic investment. The results are in line with those by Adams (2009) who
finds that a one percent increase in FDI is associated with a decrease in domestic investment of
0.51-0.82 percent in the current period. The results are also in line with Braunstein and Epstein
(2002), Kumar and Pradhan (2002), Fedderke and Romm (2006), Titarenko (2006),
Udomkerdmongkol and Morrissey (2008) who also report a crowding out effect.
The results from the dynamic OLS estimation presented in Table 2.7 show that the lagged domestic
investment, savings, RGDP, credit and open all have a positive and significant effect on domestic
investment in all the columns as expected. Inflation has the expected negative sign but is not
significant. Debt has the expected sign only in column 5. It is however not significant in any one
of the columns. This is in line with Udomkerdmongkol et al (2006) whose findings suggest that
external debt has no impact on domestic investment. The results also show that current domestic
investment is a function of past domestic investment reflecting a high inertia in domestic
investment. Columns 3, 4 and 5 report the results after adding each of the three interaction terms
separately while columns 6 and 7 report the results after adding all interaction terms
simultaneously. The interaction terms between FDI and Free (column 3) and FDI and Open
(column 5) have a positive and significant coefficient while the coefficient on FDI and Credit has
a negative but insignificant coefficient. This implies that African countries have to attain a certain
threshold in terms of trade openness and institutional quality for FDI to have a positive effect on
Page 46
34
domestic investment. However, when considered simultaneously in columns 6 and 7 none of the
interaction terms has any significant impact.
The OLS has a number of problems and hence estimates may not be consistent so we also consider
results from the fixed effects, random effects and the system GMM. Table 2.8 presents the fixed
effects estimation results. FDI has a negative and significant effect on domestic investment in all
the models, which confirms the crowding out effect. Lagged domestic investment, savings, RGDP,
credit and open have a positive and significant effect on domestic investment as expected. Free is
positive and significant only in column 1 while inflation and debt have a generally negative but
not significant effect on domestic investment. The interaction terms: FDI and Free (FDIFree); and
FDI and Open (FDIOpen) have a positive and significant effect on FDI when considered separately
as shown columns 3-5. However, when considered simultaneously only the interaction term
FDIFree has a positive and significant effect on domestic investment as reported in columns 6 and
7. This confirms the role of institutional quality in mitigating the negative effect of FDI on
domestic investment. The results from the random effects estimation reported in Table 2.9 confirm
the results of the fixed effects estimation presented in Table 2.8. However, as shown in Table 2.9
none of the interaction terms have any significant effect on domestic investment when considered
simultaneously.
Table 2.10 and Table 2.11 present the results of the estimation using the one step and two step
system GMM estimation methods respectively. In both Table 2.10 and Table 2.11, FDI is shown
to have a negative and significant effect on domestic investment which confirms the crowding out
effect. In Table 2.10 lagged domestic investment, savings, credit, open and free have a positive
and significant effect on domestic investment. Inflation has a negative but insignificant effect
while both RGDP and debt have a positive but insignificant effect on domestic investment. The
interaction terms FDIFree and FDIOpen both have a positive and significant effect on domestic
investment while the interaction term FDICredit has a negative and significant effect on domestic
investment as shown in columns 3, 4 and 5. However, when considered simultaneously (columns
6 and 7) the interaction terms FDIFree and FDIOpen have a positive and significant effect on
domestic investment. This implies that institutions and trade openness play a positive role in
mitigating the crowding out effect of FDI on domestic investment in Africa.
Page 47
35
The results of the two step system GMM estimation method which are reported in Table 2.11
confirm the crowding out effect of FDI on domestic investment. This is shown by the negative and
significant coefficient on FDI in columns 1, 2, 4 and 5. Lagged domestic investment, savings,
RGDP, credit, open and free all have a positive and significant effect on domestic investment while
inflation has a negative and significant effect on domestic investment. The interaction terms
between FDIFree and FDIOpen have a positive and significant effect. This confirms the positive
effect of institutions and trade openness in mitigating the deleterious effect of FDI on domestic
investment. Durham (2004) stresses the role of institutional development for the capacity of host
countries to absorb superior technologies. Balasubramanyam et al. (1999) find that FDI is more
significant for economic growth in countries with more open trade regimes.
Page 48
36
Table 2.7: Dynamic OLS Model Estimation Results (Dependent Variable: Domestic Investment/GDP, 1980-2012).
Independent Variables 1 2 3 4 5 6 7
lagged DI 0.77*** 0.77*** 0.77*** 0.77*** 0.77*** 0.77*** 0.77***
[50.26] [49.44] [50.26] [50.13] [50.19] [50.13] [49.41]
FDI -0.14*** -0.14*** -0.35*** -0.06 -0.59*** -0.6** -0.63**
[-5.88] [-5.67] [-3.52] [-1.01] [-2.90] [-2.29] [-2.34]
Savings 0.05*** 0.05*** 0.05*** 0.05*** 0.05*** 0.05*** 0.05***
[5.05] [5.18] [5.11] [5.13] [5.08] [5.11] [5.19]
RGDP 0.05*** 0.06*** 0.05*** 0.05*** 0.05*** 0.05*** 0.06***
[3.44] [3.78] [3.24] [3.20] [3.21] [3.11] [3.44]
Inflation -0.002 -0.001 -0.0002 -0.0002 -0.004 -0.0003 -0.001
[-0.15] [-0.54] [-0.12] [-0.10] [-0.19] [-0.16] [-0.53]
Credit 0.3** 0.25* 0.33* 0.39** 0.31** 0.33** 0.27*
[2.06] [1.72] [2.23] [2.48] [2.10] [2.04] [1.66]
Debt 0.006 0.05 0.01 0.01 -0.009 0.001 0.06
[0.06] [0.54] [0.14] [0.13] [-0.10] [0.01] [0.64]
Open 1.16*** 1.14*** 1.14*** 1.15*** 1.07*** 1.08*** 1.03***
[4.18] [4.06] [4.12] [4.12] [3.80] [3.85] [3.63]
Free 0.15 0.10 -0.22 0.09 0.09 -0.15 -0.20
[0.61] [0.39] [-0.73] [0.34] [0.35] [-0.49] [-0.62]
FDIFree 0.12** 0.08 0.07
[2.16] [1.16] [1.22]
FDICredit -0.04 -0.003 -0.005
[-1.51] [-0.09] [-0.02]
FDIOpen 0.09** 0.07 0.09
[2.22] [1.46] [1.50]
Constant -2.36* -1.15 -1.70 -2.36 -1.76 -1.49 -0.19
[-1.93] [-0.80] [-1.35] [-1.94] [-1.42] [-1.15] [-0.13]
Time dummies No Yes No No No No Yes
No. of obs. 1583 1583 1583 1583 1583 1583 1583
F test (p-value) 0.00 0.00 0.00 0.00 0.00 0.00 0.00
R-squared 69.41 69.63 69.67 69.43 69.48 69.48 69.7
Mean VIF 1.18 1.82 5.45 2.49 19.66 27.25 9.42
Notes: Multicollinearity has been tested by the creation of Variance Inflation Factors (VIF).
*, **, and *** indicate statistical significance at 10 percent, 5 percent and 1 percent levels, respectively.
Page 49
37
Table 2.8: Fixed Effects Model Estimation Results (Dependent Variable: Domestic Investment/GDP, 1980-2012).
Independent Variables 1 2 3 4 5 6 7
lagged DI 0.65*** 0.64*** 0.64*** 0.65*** 0.65*** 0.64*** 0.64***
[36.01] [35.11] [35.83] [35.87] [36.05] [35.78] [34.87]
FDI -0.2*** -0.2*** -0.56*** -0.09 -0.59*** -0.65** -0.59**
[-8.02] [7.56] [-5.10] [-1.50] [-2.80] [-2.44] [-2.13]
Savings 0.03*** 0.03*** 0.03*** 0.03*** 0.03** 0.03*** 0.04***
[2.74] [3.05] [2.88] [2.91] [2.85] [2.91] [3.15]
RGDP 0.04** 0.04*** 0.04*** 0.03** 0.04 0.03** 0.04**
[2.36] [2.69] [2.24] [2.15] [2.20] [2.17] [2.55]
Inflation -0.0001 -0.0001 -0.0001 -0.0001 -0.0001 -0.001 -0.001
[-0.34] [-0.71] [-0.27] [-0.26] [-0.34] [-0.27] [-0.63]
Credit 0.59** 0.46 0.76*** 0.78** 0.62** 0.77*** 0.60**
[2.45] [1.87] [2.50] [2.99] [2.57] [2.95] [2.26]
Debt -0.01 0.12 -0.04 -0.03 -0.06 -0.06 0.15
[-0.07] [0.54] [-0.22] [-0.15] [-0.34] [-0.30] [0.69]
Open 2.92*** 3.00*** 2.91*** 2.87*** 2.89 2.89*** 2.88***
[6.46] [6.17] [6.45] [6.34] [6.39] [6.39] [5.89]
Free 0.6* 0.42 -0.006 0.52 0.54 0.03 -0.13
[1.69] [1.08] [-0.02] [1.44] [1.51] [0.61] [-0.30]
FDIFree 0.21*** 0.19** 0.19**
[3.07] [2.47] [2.45]
FDICredit -0.05* -0.004 -0.001
[-1.89] [-0.14] [-0.02]
FDIOpen 0.08* 0.03 0.01
[1.85] [0.61] [0.29]
Constant -8.49*** -7.18*** -7.80*** -8.58 -8.30 -7.81*** -6.07***
[-4.17] [-3.11] [-3.82] [-4.22] [-4.08] [-3.81] [-2.60]
Time dummies No Yes No No No No Yes
No. of obs. 1583 1583 1583 1583 1583 1583 1583
No. of groups 48 48 48 48 48 48 48
F test (p-value) 0.00 0.00 0.00 0.00 0.00 0.00 0.00
R-squared 68.1 68.87 67.94 68.09 68.12 67.96 68.88
Notes: *, **, and *** indicate statistical significance at 1 percent, 5 percent and 10 percent levels, respectively.
Page 50
38
Table 2.9: Random Effects Model Estimation Results (Dependent Variable: Domestic Investment/GDP, 1980-2012).
Independent Variables 1 2 3 4 5 6 7
lagged DI 0.77*** 0.77*** 0.77*** 0.77*** 0.77*** 0.77*** 0.77
[50.26] [49.44] [50.26] [50.13] [50.19] [50.13] [49.41]
FDI -0.14*** -0.14*** -0.35*** -0.06 -0.59*** -0.60*** -0.63
[-5.88] [-5.67] [-3.52] [-1.01] [-2.90] [-2.29] [-2.34]
Savings 0.05*** 0.05*** 0.05*** 0.05*** 0.05*** 0.05*** 0.05
[5.05] [5.18] [5.11] [5.13] [5.08] [5.11] [5.19]
RGDP 0.05*** 0.06*** 0.05*** 0.05*** 0.05*** 0.05*** 0.06
[3.44] [3.78] [3.24] [3.20] [3.21] [3.11] [3.44]
Inflation -0.0002 -0.0001 -0.0002 -0.0001 -0.003 -0.0003 -0.001
[-0.15] [-0.54] [-0.12] [-0.10] [-0.57] [-0.16]** [-0.53]
Credit 0.3** 0.25* 0.33** 0.39** 0.31** 0.33** 0.27
[2.06] [1.72] [1.84] [2.48] [2.10] [2.04] [1.66]
Debt 0.006 0.05 0.01 0.01 -0.008 0.001 0.06
[0.06] [0.54] [0.14] [0.13] [-0.10] [0.01] [0.64]
Open 1.16*** 1.14*** 1.14*** 1.15*** 1.07*** 1.08*** 1.03
[4.18] [4.06] [4.12] [4.12] [3.80] [3.85] [3.63]
Free 0.15 0.1 -0.22 0.09 0.09 -0.15 -0.2
[0.61] [0.39] [-0.73] [0.34] [0.35] [-0.49] [-0.62]
FDIFree 0.12** 0.08 0.09
[2.16] [1.16] [1.22]
FDICredit -0.04 -0.002 -0.005
[-1.51] [-0.09] [-0.02]
FDIOpen 0.09** 0.07 0.07
[2.22] [1.46] [1.50]
Constant -2.36* -1.15 -1.70 -2.36* -1.77 -1.49 -0.19
[-1.93] [-0.80] [-1.35] [-1.94] [-0.39] [1.15] [-0.13]
Time dummies No Yes No No No No Yes
No. of obs. 1583 1583 1583 1583 1583 1583 1583
No. of groups 48 48 48 48 48 48 48
F test (p-value) 0.00 0.00 0.00 0.00 0.00 0.00 0.00
R-squared 69.58 70.42 69.67 69.62 69.67 69.71 70.55
Notes: *, **, and *** indicate statistical significance at 1 percent, 5 percent and 10 percent levels, respectively.
Page 51
39
Table 2.10: One step System GMM Model Estimation Results (Dependent Variable: Domestic Investment/GDP,
1980-2012).
Independent Variables 1 2 3 4 5
lagged DI 0.17*** 0.18*** 0.18*** 0.18*** 0.18***
[7.30] [7.63] [7.50] [7.66] [7.76]
FDI -0.31*** -1.38*** 0.02 -2.35*** -2.44***
[-9.84] [-10.27] [0.24] [-9.70] [-7.91]
Savings 0.07*** 0.08*** 0.08*** 0.08*** 0.09***
[4.00] [4.65] [4.34] [4.88] [5.02]
RGDP 0.009 0.02 0.01 0.01 0.02
[0.59] [1.06] [0.61] [0.81] [1.06]
Inflation -0.0001 -0.0001 -0.0001 -0.0001 -0.0001
[-0.49] [-0.50] [-0.46] [-0.46] [-0.48]
Credit 1.43*** 1.53*** 2.02*** 1.47*** 1.46***
[3.13] [3.44] [4.29] [3.31] [3.17]
Debt 1.24 1.05 1.22 1.13 1.04
[4.78] [4.14] [4.74] [4.50] [4.16]
Open 2.73*** 3.01*** 2.87*** 2.3*** 2.61***
[3.71] [4.20] [3.92] [3.22] [3.64]
Free 4.59*** 3.05*** 4.2*** 4.03*** 3.27***
[7.32] [4.79] [6.68]*** [6.60] [5.18]
FDIFree 0.63*** 0.40***
[8.16] [4.07]
FDICredit -0.16*** 0.01
[-4.57] [0.37]
FDIOpen 0.41*** 0.29***
[8.47] [4.99]
Constant -4.95 -4.41 -6.5** -2.48 -2.79
[-1.51] [-1.38] [-1.98] [-0.78] [-0.87]
No. of obs. 1488 1488 1488 1488 1488
No. of groups 48 48 48 48 48
No. of instruments 71 72 72 72 74
Sargan p-value 0.00 0.00 0.00 0.00 0.00
Notes: *, **, and *** indicate statistical significance at 1 percent, 5 percent and 10 percent levels, respectively.
Page 52
40
Table 2.11: Two step System GMM Model Estimation Results (Dependent Variable: Domestic Investment/GDP,
1980-2012).
Independent Variables 1 2 3 4 5
lagged DI 0.14*** 0.14*** 0.15*** 0.16*** 0.15***
[6.40] [6.74] [6.96] [8.29] [6.82]
FDI -0.35*** -1.36*** 0.05 -1.96*** -2.00***
[12.47] [-7.31] [0.85] [-3.46] [-2.82]
Savings 0.06*** 0.07*** 0.07*** 0.06*** 0.07***
[7.34] [5.66] [6.24] [5.10] [5.27]
RGDP 0.02*** 0.02*** 0.01* 0.02*** 0.02***
[2.42] [3.76] [1.73] [2.77] [3.44]
Inflation -0.0001* -0.001*** -0.0001** -0.0001*** -0.001*
[1.91] [-3.00] [-2.48] [-2.92] [-1.79]
Credit 3.06*** 3.09*** 3.21*** 2.65*** 2.30***
[3.87] [2.82] [3.54] [3.70] [2.80]
Debt 1.2 0.63 0.98 0.64 0.61
[5.26] [2.51] [3.19] [2.15] [1.55]
Open 4.14*** 4.18*** 4.12*** 2.93** 2.23
[3.44] [3.82] [3.13] [2.29] [1.51]
Free 3.58*** 1.56* 3.09*** 2.95*** 3.38***
[5.10] [1.94] [4.09] [3.77] [3.57]
FDIFree 0.61*** 0.29***
[5.93] [3.12]
FDICredit -0.2*** -0.06
[-8.13] [-0.89]
FDIOpen 0.33*** 0.26***
[3.07] [2.68]
Constant -12.68*** -9.81* -12.69** -6.02 -3.26
[2.74] [-1.84] [-2.09] [1.08] [-0.48]
No. of obs. 1488 1488 1488 1488 1488
No. of groups 48 48 48 48 48
No. of instruments 71 72 72 72 74
Sargan p-value 0.98 0.98 0.98 0.99 0.99
AR(1) p-value 0.00 0.00 0.00 0.00 0.00
AR(1) p-value 0.02 0.02 0.01 0.02 0.06
Notes: *, **, and *** indicate statistical significance at 1 percent, 5 percent and 10 percent levels, respectively.
Page 53
41
Overall, the results show that FDI has a crowding effect on domestic investment and that
institutions and trade openness do mitigate the substitutionary impact of FDI on domestic
investment.
2.6 Robustness Checks
We identify the natural resource rich countries in the sample. We follow Collier and O’Connell
(2006) who classify a country as resource rich if primary commodity rents exceed 10 percent of
GDP. We run regressions on this natural resource rich sub sample using the fixed effects, random
effects and the system GMM regressions. Table 2.12 below shows the list of the natural resource
intense countries.
Table 2.12: List of natural resource intense countries.
Algeria Congo Libya South Africa
Angola DRC Morocco Sudan
Botswana Egypt Mozambique Zambia
Cameroon Equatorial Guinea Nigeria
Cape Verde Gabon Senegal
Cote d'Ivoire Ghana Sierra Leone
The results are shown in Tables 2.13-2.16. The results in all the Tables confirm that FDI has a
crowding out effect on domestic investment. This confirms the results from the whole sample.
Table 2.13 shows that a one percent increase in FDI is associated with a decrease in domestic
investment of between 0.08-1.40 percent in the current period. In Table 2.14 it is shown that a one
percent increase in FDI is associated with a decrease in domestic investment of between 0.20-1.48.
Similarly, Table 2.15 shows that a one percent increase in FDI is associated with a decrease in
domestic investment of between 0.29-2.93 while the decrease is between 0.45-1.58 percent as
shown in Table 2.16. These results are in line with the results for the whole sample reported in
Tables 2.7-2.11. Adams (2009) also finds that a one percent increase in FDI is associated with a
decrease in domestic investment of about 0.51-0.82 percent in the current period.
Page 54
42
The results of the Hausman test which are not reported confirm that the fixed effects method is
better than the random effects method. We however report results from both methods. Table 2.13
presents the fixed effects estimation results. FDI has a negative and significant effect on domestic
investment in all the models which confirms the crowding out effect. Lagged domestic investment
and open have a positive and significant effect on domestic investment. Savings and Free have a
positive and significant effect on domestic investment only in column 1. The rest of the variables
are not significant. The interaction terms FDIFree and FDIOpen have positive coefficients and are
also significant while FDICredit is significant but has a negative effect when considered separately
in columns 3, 4 and 5. However, when considered simultaneously only the interaction term
FDIOpen has a positive and significant effect on domestic investment as reported in columns 6
and 7. This confirms the role of trade openness in mitigating the negative effect of FDI on domestic
investment. The results from the random effects estimation reported in Table 2.14 confirm the
results of the fixed effects estimation in Table 2.13.
Tables 2.15 and Table 2.16 report the results of the estimation using the one step and two step
system GMM estimation methods respectively. Tables 2.15 shows that FDI has a negative and
significant effect on domestic investment as shown in the columns 1, 2, 4 5 while in Table 2.16
FDI has a negative and significant effect on domestic investment only in columns 1 and 2. This
confirms the crowding out effect of FDI. In Table 2.15 lagged domestic investment, savings, credit,
open and free have a positive and significant effect on domestic investment. The interaction terms,
FDIFree and FDIOpen both have a positive and significant effect on domestic investment while
the interaction term FDICredit has a negative and significant effect on domestic investment. This
implies that institutional quality and trade openness play a positive role in mitigating the crowding
out effect of FDI on domestic investment.
The results of the two step system GMM estimation method reported in Table 2.16 support the
crowding out effect of FDI on domestic investment only in columns 1 and 2. This is shown by the
negative and significant coefficient on FDI. The rest of the variables are not significant.
Page 55
43
Table 2.13: Fixed Effects Model Estimation Results (Dependent Variable: Domestic Investment/GDP, 1980-2012)
Resource Intense Countries.
Independent Variables 1 2 3 4 5 6 7
lagged DI 0.64*** 0.63*** 0.63*** 0.63*** 0.63*** 0.63*** 0.62***
[23.07] [22.21] [22.90] [22.73] [23.16] [22.86] [21.99]
FDI -0.27*** -0.27*** -0.75*** -0.08 -1.40*** -1.28*** -1.30***
[-7.37] [-7.26] [-4.90] [-0.89] [-4.73] [-3.35] [-3.24]
Savings 0.001* 0.01 0.002 0.004 0.004 0.005 0.01
[0.07] [0.83] [0.15] [0.25] [0.29] [0.32] [0.98]
RGDP 0.01 0.02 0.01 0.009 0.006 0.006 0.01
[0.70] [0.74] [0.64] [0.45] [0.28] [0.30] [0.42]
Inflation -0.0001 -0.0001 -0.0001 -0.0001 -0.001 -0.0001 -0.001
[-0.51] [-0.71] [-0.44] [-0.38] [-0.54] [-0.47] [-0.65]
Credit 0.47 0.39 0.67* 0.93** 0.53 0.72* 0.64
[1.25] [0.98] [1.76] [2.27] [1.43] [1.70] [1.45]
Debt 0.07 0.33 0.02 0.06 -0.03 -0.03 0.47
[0.26] [0.85] [0.07] [0.21] [-0.12] [-0.12] [1.23]
Open 3.48*** 3.72*** 3.56*** 3.51*** 3.61*** 3.62*** 3.54***
[5.12] [4.97] [4.88] [4.90] [5.37] [5.38] [4.77]
Free 1.1* 1.02 0.10 0.96 0.82 0.39 0.38
[1.86] [1.63] [0.07] [1.62] [1.39] [0.58] [0.54]
FDIFree 0.27*** 0.13 0.15
[3.23] [1.27] [1.41]
FDICredit -0.11** -0.02 -0.02
[-2.54] [-0.50] [-0.41]
FDIOpen 0.22*** 0.16** 0.16**
[3.85] [2.34] [2.16]
Constant -9.67*** -7.73** -8.69**** -10.61*** -6.61*** -9.37** -6.18*
[-3.08] [-2.19] [-2.77] [-3.37] [-3.09] [-2.95] [-1.72]
Time dummies No Yes No No No No Yes
No. of obs. 659 659 659 659 659 659 659
No. of groups 20 20 20 20 20 20 20
F test (p-value) 0.00 0.00 0.00 0.00 0.00 0.00 0.00
R-squared 71.09 72.09 71.34 70.96 71.90 71.75 72.41
Notes: *, **, and *** indicate statistical significance at 1 percent, 5 percent and 10 percent levels, respectively.
Page 56
44
Table 2.14: Random Effects Model Estimation Results (Dependent Variable: Domestic Investment/GDP, 1980-2012)
Resource Intense Countries.
Independent Variables 1 2 3 4 5 6 7
lagged DI 0.77*** 0.76*** 0.77*** 0.77*** 0.76*** 0.76*** 0.76***
[33.30] [32.04] [33.33] [33.22] [33.03] [33.00] [32.07]
FDI -0.20*** -0.20*** -0.54*** -0.10 -1.34*** -1.48*** -1.41***
[-5.85] [-5.56] [-3.71] [-1.20] [-4.59] [-3.87] [-3.48]
Savings 0.02 0.03** 0.02 0.02 0.02 0.02 0.03**
[1.51] [2.19] [1.50] [1.53] [1.64] [1.62] [2.22]
RGDP 0.03 0.03 0.03 0.03 0.02 0.02 0.03
[1.50] [1.48] [1.39] [1.35] [1.12] [1.15] [1.25]
Inflation -0.0003 -0.0001 -0.0001 -0.0001 -0.001 -0.0006 -0.001
[-0.14] [-0.43] [-0.11] [-0.07] [-0.25] [-0.27] [-0.52]
Credit 0.24 0.21 0.27 0.38 0.26 0.21 0.18
[1.06] [0.91] [1.01] [1.54] [1.18] [0.85] [0.71]
Debt -0.52** -0.57** -0.46** -0.51** -0.50** -0.48** -0.41
[-2.25] [-2.18] [-2.00] [-2.20] [-1.67] [-2.10] [-1.54]
Open 2.33*** 2.48*** 2.36*** 2.30*** 2.23*** 2.26*** 2.28***
[4.67] [4.81] [4.73] [4.59] [4.37] [4.54] [4.40]
Free 0.22 0.13 -0.56 0.08 -0.01 -0.22 -0.24
[0.54] [0.32] [-1.08] [0.18] [-0.04] [-0.41] [-0.42]
FDIFree 0.19** 0.07 0.07
[2.38] [0.68] [0.63]
FDICredit -0.06 0.03 0.03
[-1.47] [0.57] [0.65]
FDIOpen 0.22*** 0.22*** 0.20***
[3.92] [3.18] [2.83]
Constant -6.47*** -4.55* -5.20** -6.33** -5.20** -4.85** -2.69
[-2.98] [-1.79] [-2.34] [-2.92] [-1.22] [-2.18] [-1.01]
Time dummies No Yes No No No No Yes
No. of obs. 659 659 659 659 659 659 659
No. of groups 20 20 20 20 20 20 20
F test (p-value) 0.00 0.00 0.00 0.00 0.00 0.00 0.00
R-squared 72.67 74.19 72.91 72.76 73.30 73.33 74.67
Notes: *, **, and *** indicate statistical significance at 1 percent, 5 percent and 10 percent levels, respectively.
Page 57
45
Table 2.15: One step System GMM Model Estimation Results (Dependent Variable: Domestic Investment/GDP,
1980-2012) Resource Intense Countries.
Independent Variables 1 2 3 4 5
lagged DI 0.39*** 0.39*** 0.39*** 0.38*** 0.38***
[12.12] [12.41] [12.31] [12.21] [12.33]
FDI -0.29*** -1.51*** 0.06 -2.93*** -2.82***
[-6.91] [-8.12] [0.64] [-8.73] [-6.78]
Savings 0.07*** 0.07*** 0.07*** 0.08*** 0.08***
[2.76] [3.14] [2.83] [3.43] [3.44]
RGDP -0.006 0.005 -0.008 -0.003 0.005
[-0.26] [0.22] [-0.36] [-0.17] [0.02]
Inflation -0.0001 -0.0001 -0.0001 -0.0001 -0.0001
[-0.44] [-0.44] [-0.42] [-0.43] [-0.43]
Credit 1.8*** 1.89*** 2.65*** 1.56*** 1.71***
[3.08] [3.37] [4.29] [2.82] [2.85]
Debt 0.62 0.29 0.58 0.42 0.32
[1.39] [0.68] [1.32] [1.00] [0.76]
Open 2.43** 2.71*** 2.59** 2.13** 2.34**
[2.30] [2.67] [2.47] [2.13] [2.34]
Free 2.53** 0.75 2.03** 1.67* 1.06
[2.50] [0.75] [2.01] [1.73] [1.07]
FDIFree 0.69*** 0.31
[6.68] [2.34]**
FDICredit -0.20*** -0.01
[-3.97] [-0.24]
FDIOpen 0.52*** 0.39***
[7.90] [4.77]
Constant -7.92* -6.85 -9.77** -4.02 -4.6
[-1.69] [-1.52] [-2.09] [-0.90] [-1.02]
No. of obs. 620 620 620 620 620
No. of groups 20 20 20 20 20
No. of instruments 71 72 72 72 74
Sargan p-value 0.00 0.00 0.00 0.00 0.00
Notes: *, **, and *** indicate statistical significance at 1 percent, 5 percent and 10 percent levels, respectively.
Page 58
46
Table 2.16: Two step System GMM Model Estimation Results (Dependent Variable: Domestic Investment/GDP,
1980-2012) Resource Intense Countries.
Independent Variables 1 2 3 4 5
lagged DI 0.26** 0.20** 0.26** 0.11 0.06
[2.56] [1.42] [2.33] [0.71] [0.30]
FDI -0.45*** -1.58** 0.14 -0.41 -3.63
[-3.63] [-2.02] [0.26] [-0.17] [-0.82]
Savings 0.08*** 0.07** 0.07** 0.04 0.04
[3.49] [2.42] [2.39] [1.17] [0.94]
RGDP -0.002 0.004 -0.007 -0.005 -0.03
[-0.13] [0.23] [-0.41] [-0.29] [-1.00]
Inflation -0.0001* -0.0001 -0.0002 -0.0002 -0.0001
[-1.66] [-1.35] [-1.83] [-1.51] [-1.44]
Credit 5.3 3.42 6.28 2.4 -6.66
[1.07] [0.77] [1.41] [0.35] [-0.77]
Debt 0.78 -0.06 0.22 -2.02 2.29
[0.77] [-0.05] [0.16] [1.16] [1.18]
Open 6.49 2.61 7.25 1.78 -2.54
[1.09] [0.54] [1.40] [0.42] [-0.39]
Free -1.08 -11.08 -1.78 -11.99 1.1
[-0.18] [-1.26] [-0.30] [1.50] [0.10]
FDIFree 0.69* 0.94
[1.74] [0.68]
FDICredit -0.3 0.19
[-1.12] [0.46]
FDIOpen 0.04 0.27
[0.08] [0.43]
Constant -22.59 15.83 -26.5 23.53 49.37
[-0.90] [0.53] [-1.14] [1.02]
No. of obs. 620 620 620 620 620
No. of groups 20 20 20 20 20
No. of instruments 71 72 72 72 74
Sargan p-value 1.00 1.00 1.00 1.00 1.00
AR(1) p-value 0.00 0.00 0.00 0.00 0.00
AR(1) p-value 0.15 0.4 0.22 0.42 0.73
Notes: *, **, and *** indicate statistical significance at 1 percent, 5 percent and 10 percent levels, respectively.
Page 59
47
2.7 Conclusion and Policy Recommendations
We use a panel of 48 African countries for the period 1980 to 2012 to analyse the absorptive
capacity and investigate the impact of FDI on domestic investment using the dynamic OLS,
random effects, fixed effects and the system GMM. Overall, the analysis shows that FDI has a
crowding out effect on domestic investment. However, the fact that the study supports the
crowding out effect of FDI on domestic investment does not necessarily imply that FDI has no
positive spillovers in reality or that FDI is not needed. It may as well be that the positive benefits
from FDI in African economies may be as a result of an increase in productivity growth which
more than compensates for the decline in domestic investment (Ndikumana and Verick, 2008).
Moreover, FDI’s growth-enhancing impact can only be realised when it stimulates the absorptive
capacity of the host country (Carkovic and Levine, 2002; Makki and Somwaru, 2004). The study
also finds that improved institutions and trade openness do mitigate the negative effects of FDI on
domestic investment. This implies that there is a need to develop policies to improve local
conditions by strengthening institutions and enhancing trade openness. The review of the literature
also suggests that African countries will benefit from measures aimed at promoting domestic
investment.
African countries should adopt a targeted approach to FDI. As Alfaro and Charlton (2007) argue,
some types of FDI may be more beneficial and productive than others. Agosin and Mayer (2000)
note that the reason why FDI has been more productive in Asia than in other developing countries
is because of the cautious and targeted approach. In addition, Adams (2009) observes that this
targeted approach should involve careful screening of projects and granting differential incentives
to projects in different sectors. While FDI inflows in African countries have mainly been
concentrated in the extractive sector, in most Asian countries FDI has largely been focused on the
secondary sector, thereby contributing to the diversification of the export base (UNCTAD, 2007).
African policy makers should consider the prioritisation of FDI to other sectors such as
manufacturing so as to diversify growth and the export base.
Policy efforts aimed at attracting FDI should be balanced with the imperative of strengthening
domestic firms, entrepreneurship and local innovation. Keshava (2008) shows that even in those
Page 60
48
countries where FDI has been more productive and beneficial, domestic investment is more
effective than FDI in promoting growth. Investment incentives should not discriminate against
domestic investment. Policymakers should therefore implement policies that strengthen the
linkages between FDI and the local industry. The objectives of multinational corporations should
be synchronised with the development imperatives and goals of African countries. It is also
important to expedite the implementation of regional integration in the region in line with the
recommendations from UNCTAD (2005), which notes that African countries need to think
regionally. Market and competition regulations to dismantle the monopolistic tendencies of some
foreign investors also need to be strengthened in a number of African countries.
Further research however needs to be undertaken to investigate the impact of the different types
of FDI on domestic investment in Africa. FDI comes in two basic forms namely: greenfield
investments which involve the creation of new production processes and mergers and acquisitions
(M&As) which involve the purchase of assets of existing local companies. FDI can also be
classified as, market seeking, resource seeking, efficiency seeking and strategic asset seeking
(Dunning, 1993). It is possible that these different types of investment have different effects on
domestic investment. This therefore calls for empirical analysis that investigates the effects of
these different types of FDI on domestic investment in African economies. In future it will also be
necessary to focus on country-level and micro-level studies to provide more information on the
impact of FDI and also to identify sectors where FDI may complement domestic investment.
Page 61
49
CHAPTER 3: THE IMPACT OF FOREIGN DIRECT INVESTMENT ON
PRODUCTIVITY IN AFRICAN ECONOMIES
3.1 Introduction
This chapter examines the impact of foreign direct investment on productivity growth and the role
of relative backwardness (the technology gap) on a panel of 45 African countries over the period
1980-2012. FDI is often viewed as an important channel for the diffusion of technology in many
developing countries. Endogenous growth theory postulates that FDI raises economic growth by
generating technological diffusion from the developed world to the host country (Borensztein et
al, 1998). This is particularly important for Africa, which has a huge technology gap. Productivity
spillovers from FDI take place when the entry or presence of multinational corporations increases
the productivity of domestic firms in a host country, and the multinational companies do not fully
internalise the value of these benefits (Javorcik, 2004). Consequently, many policymakers in
African countries have placed attracting FDI high on their agenda in the hope of benefitting from
these technology spillovers (Woo, 2009).
A lot of scholars find that differences in total factor productivity account for the huge cross country
variations in growth (Acemoglu, 2009; Caselli, 2005; Easterly and Levine, 2001; Parente and
Prescott 2001). Since FDI is regarded as an important channel for technology transfer, a study of
the impact of FDI on productivity growth and the role of the technology gap is of great significance
to policy makers in Africa as it provides better clarity on one of the key factors that can potentially
help African countries to develop. The objectives of this study therefore include: to analyse the
productivity effects of FDI in Africa and to determine the role of the technology gap on the FDI-
productivity nexus. We test the ‘relative backwardness’ hypothesis of Findlay (1978) and Wang
and Blomstrom (1992) which states that the rate of technology diffusion in a relatively backward
country increases the further the country is from the technological frontier. Growth therefore
becomes a function of the country’s technological gap. Economies far from the technological
frontier are expected to adopt technologies from the advanced economies to drive growth (Aghion
and Howitt, 2009).
Page 62
50
Although it has been shown that a large part of cross-country differences in income per capita can
be explained by productivity growth, most of the existing literature however, only focuses on the
role of FDI on economic growth. There is a paucity of literature that examines the role of FDI on
productivity growth at cross-country level (Roy, 2008). Importantly, the role of the technology
gap is often neglected. Some of the studies that attempt to address this issue are by, Baltabaev
(2014); Roy (2008) and Senbeta (2008). Baltabaev (2014) uses data for 49 countries (including
both developed and developing countries) over the period 1974-2008 with a few developing
countries in the sample. Roy (2008) uses data for a sample of 89 countries in both Latin America
and Africa. Senbeta (2008) examines the FDI-productivity growth nexus for 22 SSA countries for
the period 1970-2000. However, he does not consider the role of the technology gap. This chapter
uses a bigger sample consisting of 45 African countries and we incorporate two measures of
relative backwardness over the period 1980-2012.
This chapter contributes to literature in many ways. Firstly, we narrow our focus to only African
countries (45) to help reduce any bias that may be due to sample selection. This is important
because scholars such as Kumar and Pradhan (2002 and Sylwester (2005) find that FDI has
differential effects in different regions. This chapter builds on the study by Baltabaev (2014) who
uses a panel of 49 countries (both developed and developing) to examine the relationship between
FDI and productivity growth over the period 1974-2008. We update the dataset to 2012 and we
use two measures of relative backwardness namely: the distance to the technology leader and the
income gap. We analyse both the individual and simultaneous interactions of FDI with these
‘relative backwardness’ measures and their impact on productivity growth. We control for
endogeneity, using the system GMM estimation. We also use the fixed effects estimation to check
for the robustness of the results.
The rest of the chapter is organised as follows: section 3.2 reviews and discusses the related
literature. Section 3.3 details the model specification and data description. Section 3.4 presents the
estimation and analysis of the results, section 3.5 is the robustness checks and section 3.6 is the
conclusion and policy recommendations.
Page 63
51
3.2 Literature Review
FDI is considered an important channel for the transmission of technology in many developing
countries (Jyun-Yi and Chih-Chiang, 2008). The endogenous growth theory postulates that FDI
raises economic growth by generating technological diffusion from the developed world to the
host country (Borensztein et al, 1998). Crespo and Fontoura (2007) summarise the five main
channels of technological diffusion linked to FDI flows and these include: demonstration or
imitation; labor mobility; exportation; competition; and backward and forward linkages with local
firms. Hence, FDI does not only help to introduce new technologies into the host economy, but
may also assist in raising the skill level, reducing prices and changing the competition structure.
Studies on the FDI-productivity growth nexus have provided mixed results. Scholars such as Bitzer
and Gorg (2009), Liu et al. (2000) and Woo (2009) conclude that FDI has a positive effect on
productivity growth. In contrast, some researchers find that FDI negatively affects productivity
(Azman-Saini et al., 2010; Ang, 2009; Alfaro et al., 2004; Aitken and Harrison, 1999; Haddad and
Harrison, 1993). Aitken and Harrison (1999) find that FDI negatively affects the productivity of
domestic firms. They postulate a ‘market-stealing’ hypothesis to explain their results. The
hypothesis states that while FDI may promote technology transfer, foreign investors ‘steal’ market
share at the expense of domestic firms and this forces domestic firms to produce smaller output at
higher average costs. As a result, the overall benefit of FDI is negligible at best or even negative.
Interestingly, some studies observe that a positive effect of FDI on productivity is dependent on
the sector (Sjoholm, 2008 and Buckley et al, 2008); the degree of complementarity and substitution
between FDI and domestic investment (De Mello, 1999); and local conditions in the host country.
For instance, Alfaro et al (2009) find that countries with well-developed financial markets gain
significantly from FDI via productivity improvements. Roy (2008) shows that the distance to the
technology frontier is significant in determining the ability of the host country to take advantage
of spillovers from FDI. He also finds that while there is a positive and significant effect of FDI on
productivity, this effect decreases the higher the technological gap.
Page 64
52
Using a panel of seven Mediterranean countries over 1980-2000, Cecchini and Lai-Tong (2008)
examine the links between trade, FDI and total factor productivity. They find that FDI has
beneficial effects on productivity growth but the spillovers are conditional on a number of host
country factors, such as the degree of trade openness and the level of human capital. In contrast,
Woo (2009), in a study of the effect of FDI on productivity in a large sample of countries from
1970-2000 finds that though FDI has a positive effect on productivity there is no evidence that this
effect is dependent on host country factors. Ng (2006) analyses the relationship between FDI and
productivity growth for eight Asian economies and finds no evidence to show that FDI drives
technological progress in the sample countries.
A number of studies differentiate the effect of FDI by country. For instance, Johnson (2006)
examines the effect of FDI on economic growth via two channels namely: technology spillovers
and physical capital accumulation. The study uses a panel dataset compromising 90 developed and
developing countries over the period 1980-2002. The study finds that FDI improves economic
growth in developing economies only and not in developed economies. Lee (2009) examines the
long run productivity convergence for a sample of 25 countries over 1975-2004. The study uses
panel unit root procedures focusing mainly on trade and FDI links and finds that FDI helps to boost
productivity growth in host countries. Holland and Pain (2000) examine the linkages between FDI
and productivity growth in ten Central and East European countries. They find a positive impact
of FDI on productivity in these economies, with the benefits being higher in the more-market
oriented countries.
Other researchers disaggregate TFP growth into different components to determine the impact of
FDI on the various components. Such an approach is adopted by Ng (2007) who examines the
linkage between FDI and productivity in 14 SSA countries using the Granger causality test. The
study disaggregates TFP growth into two components namely: technical change and efficiency
change to identify if FDI has any effect on these two components. They find that FDI has not
contributed to technical change in the countries in the sample. Furthermore, the study provides
evidence that FDI has contributed to higher efficiency change in only three of the countries in the
sample. The findings therefore do seem to suggest that FDI has limited effect on productivity
growth in the countries in the sample.
Page 65
53
Some scholars provide insight on the dynamic differential effects of spillovers from FDI on
productivity growth in terms of the short run and the long run. For instance, in a study of the nexus
between FDI and productivity growth in the Chinese manufacturing sector, Liu (2008) finds that
an increase in FDI in the industry lowers the short run productivity level but raises the long run
rate of productivity growth of manufacturing firms. At a macro level, Senbeta (2008) studies the
nexus between FDI inflow and productivity growth in 22 SSA countries over the period 1970-
2000 using fixed effects and dynamic panel models. The study includes control variables such
trade openness, financial sector development, the indebtedness of the country and the share of
agriculture in GDP which is assumed to indicate the level of development of the country. The
results show that the effect of FDI on productivity is negative in the short run but becomes positive
in the long run.
On the other hand, Girma (2005) examines the relationship between FDI and productivity using
firm level data from the UK. The study demonstrates that the effect of FDI on productivity depends
on the technology gap which is defined as the distance from the technological leader in the
industry. The study also finds that there is a non-linear relationship between the technology gap
and spillovers from FDI. Similarly, Girma and Gorg (2005) examine the role of the absorptive
capacity in determining whether domestic firms benefit from FDI-related productivity spillovers.
The study finds that there is a U-shaped relationship between productivity growth and FDI
interacted with absorptive capacity. This suggests that improvements in absorptive capacity at the
firm level allow the firm to enhance the spillovers from FDI. Blalock and Gertler (2009) in a study
of Indonesian firms find that while FDI on its own generally has no significant effect on a firm’s
productivity, manufacturing firms with larger technological gaps do benefit from FDI. This finding
highlights the importance of the sector and the technology gap.
Some studies use the income gap to measure relative backwardness. For instance, Li and Liu
(2005) investigate the impact of FDI on economic growth using a large sample of 84 countries for
the period 1970-99 conditional on relative backwardness. They define relative backwardness using
the ratio of host country GDP to US GDP. They include FDI interacted with the proxy for relative
backwardness in their growth regression. They find a significantly negative coefficient for this
Page 66
54
interaction term along with a positive coefficient for the FDI term. This implies that the higher the
relative backwardness of the host country, the smaller is the effect of FDI on growth. They
calculate a threshold value for relative backwardness of 12.6, below which FDI is no longer
beneficial for the host country.
Generally, literature on the impact of FDI on productivity growth in African countries is scant and
in particular the role of technology gap is often neglected. Some of the papers that attempt to
address this issue are by, Baltabaev (2014), Roy (2008) and Senbeta (2008). Baltabaev (2014)
studies the link between FDI and TFP for 49 countries (including both developed and developing
countries) over the period 1974-2008. The study however only includes a few developing
countries and hence it is not representative enough of African countries. Roy (2008) uses data for
a sample of 89 countries in both Latin America and Africa. Senbeta (2008) on the other examines
the FDI-productivity growth nexus for 22 sub-Saharan African (SSA) countries for the period
1970-2000 but does not consider the role of the technology gap.
While existing studies provide valuable insights into productivity spillovers to the host economy,
they are not able to fully capture the overall effect of FDI on productivity growth in African
economies. This chapter seeks to remedy this situation by providing clarity on the relationship
between productivity growth and FDI conditional on relative backwardness in a sample of 45
African countries over the period 1980-2012. We use two measures of relative backwardness
namely: the distance to the technology leader and the income gap.
3.3 Model Specification and Data Description
3.3.1 Model Specification
We treat FDI as a factor of production in addition to physical capital, labour and human capital.
To investigate the impact of FDI on TFP the empirical model takes the following form:
𝑌𝑖𝑡 = 𝐴𝐾𝑖𝑡𝛼𝐿𝑖𝑡
𝛽𝐻𝑖𝑡𝛾𝐹𝑖𝑡
𝛿𝑒 (3.1)
Page 67
55
where 𝑌𝑖𝑡 is output of the economy; 𝐴 is the level of productivity (TFP); 𝐾𝑖𝑡 is domestic physical
capital; 𝐿𝑖𝑡 is the labour supply; 𝐻𝑖𝑡 is human capital; 𝐹𝑖𝑡 is Foreign Direct Investment (FDI) and
𝑒 is the error term. 𝛼, 𝛽, 𝛾, 𝛿, and 휀 denote the elasticity of domestic physical capital, labour,
human capital, FDI and the error term. Following Ashraf and Herzer (2014), we model the impact
of FDI on TFP and the role of relative backwardness as follows:
𝑇𝐹𝑃𝑖𝑡 − 𝑇𝐹𝑃𝑖𝑡−1 = (1 − 𝛼)𝑇𝐹𝑃𝑖𝑡−1 + 𝛽1𝐷𝑇𝐹𝑖𝑡 + 𝛽2𝐹𝐷𝐼𝑖𝑡 + 𝛽3𝐹𝐷𝐼𝑖𝑡 ∗ 𝐷𝑇𝐹𝑖𝑡 + 𝛽4𝑋𝑖𝑡 +
𝜂𝑖 + 휀𝑖𝑡 (3.2)
Equivalently, equation (3.2) may be rewritten as follows:
𝑇𝐹𝑃𝑖𝑡 = 𝛼𝑇𝐹𝑃𝑖𝑡−1 + 𝛽1𝐷𝑇𝐹𝑖𝑡 + 𝛽2𝐹𝐷𝐼𝑖𝑡 + 𝛽3𝐹𝐷𝐼𝑖𝑡 ∗ 𝐷𝑇𝐹𝑖𝑡 + 𝛽4𝑋𝑖𝑡 + 𝜂𝑖 + 휀𝑖𝑡
(3.3)
where 𝑖 is the home country index, 𝑡 is the time index, 𝛼 and 𝛽 are the unknown parameters to be
estimated, 𝐴𝐵𝐶𝑖𝑡 is the absorptive capacity (relative backwardness) in home country 𝑖 and time 𝑡.
𝑋𝑖𝑡 is a vector of other conditional variables that affect productivity growth, 𝜂𝑖 is unobserved
country-specific effect term, and 휀𝑖𝑡 is the usual error term. 𝐹𝐷𝐼𝑖𝑡 ∗ 𝐷𝑇𝐹𝑖𝑡 is the interaction term
to capture the effect of relative backwardness.
TFP growth is a function of FDI, distance to the technology frontier (𝐷𝑇𝐹𝑖𝑡) and other control
variables (𝑋𝑖𝑡). Following Griffith et al. (2004) and Madsen et al. (2010), we include the distance
to the technology frontier (DTF) separately to capture independent technological transfer from
advanced countries to the ‘relatively backward’ host countries Higher relative backwardness is
associated with faster catching up to the advanced countries (Findlay, 1978; Wang and Blomstrom,
1992). The distance to the technological frontier (DTF) is the ratio of the technology level in the
‘leader’ country (i.e. the USA) to the technology level of the host country. We also use the income
gap as another proxy for the technology gap to check for robustness of the results. Following Li
and Liu (2005), the income gap is calculated as follows:
𝐺𝐴𝑃𝑖𝑡 = (𝑌𝑚𝑎𝑥𝑖𝑡 − 𝑌𝑖𝑡)/𝑌𝑖𝑡 (3.4)
Page 68
56
where 𝑌𝑚𝑎𝑥𝑖𝑡 is the GDP per capita of the US and 𝑌𝑖𝑡 is the GDP per capita for the host country.
We use the system GMM estimator which controls for the unobserved country-specific factors.
The estimated coefficients are then not subject to bias from any omitted variable. Since there is
likely to be a two-way relationship between FDI and productivity, the system GMM estimator
helps to solve that endogeneity problem by using a series of internal instrumental variables based
on lagged values of the dependent and independent variables. In this case, the instruments for the
regression in differences are lagged levels as in the original estimator, while those for the
regression in levels are the lagged differences of the corresponding variables.
We transform equation (3.3) into first differences to eliminate any country specific effects
(Arellano and Bond, 1991) as follows:
𝑇𝐹𝑃𝑖𝑡 − 𝑇𝐹𝑃𝑖𝑡−1 = 𝛼(𝑇𝐹𝑃𝑖𝑡−1 − 𝑇𝐹𝑃𝑖𝑡−2) + 𝛽1(𝐷𝑇𝐹𝑖𝑡 − 𝐷𝑇𝐹𝑖𝑡−1) + 𝛽2(𝐹𝐷𝐼𝑖𝑡 − 𝐹𝐷𝐼𝑖𝑡−1) +
𝛽3(𝐹𝐷𝐼𝑖𝑡 ∗ 𝐷𝑇𝐹𝑖𝑡 − 𝐹𝐷𝐼𝑖𝑡−1 ∗ 𝐷𝑇𝐹𝑖𝑡−1) + 𝛽4(𝑋𝑖𝑡 − 𝑋𝑖𝑡−1) + (휀𝑖𝑡 − 휀𝑖𝑡−1)
(3.5)
Arellano and Bond (1991) posit that to deal with the possible simultaneity bias of the explanatory
variables the lagged levels of the regressors should be used as instruments. This is however only
valid assuming that the error term is not serially correlated and also that the lag of the explanatory
variables are weakly exogenous. This is known as difference GMM estimation. Following
Arellano and Bond (1991), the following moment conditions are therefore set:
Ε[𝑇𝐹𝑃𝑖𝑡−𝑠 ∙ (휀𝑖𝑡 − 휀𝑖𝑡−1)] = 0 𝑓𝑜𝑟 𝑠 ≥ 2; 𝑡 = 3, … , 𝑇 (3.6)
Ε[𝐷𝑇𝐹𝑖𝑡−𝑠 ∙ (휀𝑖𝑡 − 휀𝑖𝑡−1)] = 0 𝑓𝑜𝑟 𝑠 ≥ 2; 𝑡 = 3, … , 𝑇 (3.7)
Ε[𝐹𝐷𝐼𝑖𝑡−𝑠 ∙ (휀𝑖𝑡 − 휀𝑖𝑡−1)] = 0 𝑓𝑜𝑟 𝑠 ≥ 2; 𝑡 = 3, … , 𝑇 (3.8)
Ε[𝑋𝑖𝑡−𝑠 ∙ (휀𝑖𝑡 − 휀𝑖𝑡−1)] = 0 𝑓𝑜𝑟 𝑠 ≥ 2; 𝑡 = 3, … , 𝑇 (3.9)
Page 69
57
It has been shown that though the difference GMM estimation controls for country-specific effects
and simultaneity bias it has some problems. Alonso-Borrego and Arellano (1999) and Blundell
and Bond (1998) prove that when the explanatory variables are persistent the lagged levels of the
variables become weak instruments. This results in biased parameter estimates for small samples
and larger variance asymptotically. To with this problem Arellano and Bover (1995) propose the
system GMM which combines both the difference equation (3.5) and the level equation (3.3). The
system GMM is able to reduce biases and imprecision associated with difference GMM (Blundell
and Bond, 1998). Following Arellano and Bover (1995), the additional moment conditions for the
second part of the system (the regression in levels) are set as follows:
Ε[(𝑇𝐹𝑃𝑖𝑡−𝑠 − 𝑇𝐹𝑃𝑖𝑡−𝑠−1 ∙ (𝜂𝑖 + 휀𝑖𝑡)] = 0 𝑓𝑜𝑟 𝑠 = 1 (3.10)
Ε[(𝐷𝑇𝐹𝑖𝑡−𝑠 − 𝐷𝑇𝐹𝑖𝑡−𝑠−1 ∙ (𝜂𝑖 + 휀𝑖𝑡)] = 0 𝑓𝑜𝑟 𝑠 = 1 (3.11)
Ε[(𝐹𝐷𝐼𝑖𝑡−𝑠 − 𝐹𝐷𝐼𝑖𝑡−𝑠−1 ∙ (𝜂𝑖 + 휀𝑖𝑡)] = 0 𝑓𝑜𝑟 𝑠 = 1 (3.12)
Ε[(𝑋𝑖𝑡−𝑠 − 𝑋𝑖𝑡−𝑠−1 ∙ (𝜂𝑖 + 휀𝑖𝑡)] = 0 𝑓𝑜𝑟 𝑠 = 1 (3.13)
3.3.2 Data Description
We calculate the TFP growth using the Solow residual. We used the following equation from
Acemoglu (2009):
𝑇𝐹𝑃 𝑔𝑟𝑜𝑤𝑡ℎ = 𝑔 − 𝛼𝐾𝑔𝐾 − 𝛼𝐿𝑔𝐿 (3.14)
where g is growth rate of output, 𝑔𝐾 is the growth rate of capital and 𝑔𝐿 is the growth rate of labour.
𝛼𝐾 and 𝛼𝐿 are value shares. To calculate the TFP growth rate we use data on gross fixed capital
stock, the population growth and the GDP growth drawn from the World Development Indicators
(WDI). Capital growth is calculated using the perpetual inventory method based on gross fixed
capital formation time series data from the World Bank’s World Development Indicators (WDI)
as follows:
Page 70
58
𝐾𝑖𝑡 = 𝐾𝑖𝑡−1 + 𝐼𝑖𝑡 − (𝐾𝑖𝑡−1 ∗ 𝛿) (3.15)
where 𝐾𝑖𝑡 is the fixed capital stock, 𝐼𝑖𝑡 is the gross fixed capital formation and 𝛿 is the depreciation
rate and is assumed to be constant over time. We use the standard values of 𝛼 from existing
literature for all the countries in the sample. The depreciation rate and technological growth rate
in aggregate is assumed to be 0.05 (Roy, 2008).
Control variables (𝑋𝑖𝑡) used in this study are derived from existing literature. Human capital (sch)
is measured by the level of secondary school attainment sourced from the World Development
Indicators (WDI). Higher levels of human capital increase the capacity of host countries to absorb
foreign technology (Kneller, 2005). Trade openness gives the host country better access to foreign
technologies (Keller, 2004). Following Loko and Diouf (2009), we use the ratio of exports plus
imports to GDP as a proxy for trade openness. Abizadeh et al. (2007) conclude that trade openness
has a positive and significant impact on labour productivity. We follow Alfaro et al (2009) who
use private credit as a share of gross domestic product (GDP) as a proxy for financial market
development. The expected sign is positive.
We include population growth (POPG) and this is expected to affect economic growth positively.
Jones (1995) argues, more people increase the potential pool of ideas and innovation. We also
include lagged TFP as one of the explanatory variables. As pointed out by Hsiao (1986) a dynamic
panel model allows dynamic effects to be introduced into the model and feedback from current or
past shocks. Furthermore, as Ashraf et al (2014) notes, the lagged dependent variable also helps to
control for the effect of potentially relevant, but omitted, variables and to control for serial
correlation.
We also include the technology gap. Kokko (1992) demonstrates that the technology gap
constitutes a factor affecting spillovers from FDI. There are however divergent views on the role
of the technological gap (TG). Some scholars (Castellani and Zanfei, 2003 and Sjoholm, 1999)
argue that a larger TG results in positive spillovers while others argue that it is moderate (Findlay,
1978) or small (Liu et al, 2000). In this study we use two measures of technological gap namely,
Page 71
59
the the distance to the technology leader (DTF) and the income gap (GAP). The distance to
technology frontier (DTF) is the ratio of the technology level in the ‘leader’ country (i.e. the USA)
to the technology level of the country under consideration. The income gap (GAP) on the other
hand is defined in equation 4.
We use a dummy variable for the existence of Investment and Export Promotion Agencies (IPA).
IPA equals one if country 𝑐 has an investment promotion agency at time 𝑡 and zero if country 𝑐
does not have an investment promotion agency at time 𝑡. Harding and Javorcik (2011), for
example, show that sector targeting by IPAs leads to more FDI inflows into the particular sector.
Hence, the existence of an IPA (which is a dummy variable) can be a proxy for FDI inflows. We
exploit the panel data from the World Bank Census of Investment Promotion Agencies to build
this variable.
The list of countries included is shown in Table 3.1.
Table 3.1: List of countries.
Algeria Congo Malawi South Africa
Angola Egypt Mali Sudan
Benin Ethiopia Mauritania Swaziland
Botswana Gabon Mauritius Tanzania
Burkina Faso Gambia Morocco Togo
Burundi Ghana Mozambique Tunisia
Cameroon Guinea Niger Uganda
Cape Verde Guinea-Bissau Nigeria Zambia
Central Africa Republic Kenya Rwanda Zimbabwe
Chad Lesotho Senegal
Cote d'Ivore Liberia Seychelles
Comoros Madagascar Sierra Leone
In Table 3.2 we report the summary statistics for the countries in our analysis. The mean value of
TFP growth is 0.25 with a minimum value of 0.01 and 1.52. The average share of the FDI inflows
in GDP is 2.74 percent with a standard deviation of 5.75. The mean value for first FDI-based
absorptive capacity (FDIDTF) is 2.03 and it has a high variance as suggested by the standard
Page 72
60
deviation; almost twice the size of the mean. The average value for the second FDI-based
absorptive capacity (FDIGAP) is 9.83 with a very high standard deviation of 22.31. The average
distance to the technology leader in our sample is 0.74 which implies that the productivity for
countries on average was 0.74 times lower than that of the US.
Table 3.2: Descriptive Statistics.
Variable Obs Mean Std. Dev. Min Max
TFP growth 1485 0.25 0.18 0.01 1.52
FDI 1485 2.74 5.75 -14.68 90.46
Distance to Technology Frontier (DTF) 1485 0.74 0.17 0.02 0.96
Income Gap (GAP) 1485 3.71 1.1 -0.43 6.13
Human Capital (Sch)* 1485 3.22 0.79 0.85 4.83
Trade Openness (Open)* 1485 4.16 0.48 1.84 5.62
Credit* 1485 2.65 0.95 -4.53 5.12
Population Growth (POPG) 1485 2.46 1.08 -7.53 9.77
Investment Promotion Agency (IPA) 1485 0.35 0.48 0 1
FDI*DTF (FDIDTF) 1485 2.03 4.51 -10.03 74.63
FDI*GAP (FDIGAP) 1485 9.83 22.31 -72.11 353.49
*This variable is included as ln (variable). Source: the author’s calculations.
Table 3.3 shows the correlation among the variables. There is a preliminary positive relationship
between TFP growth and FDI though not significant. There is a negative and significant
relationship between TFP growth and both measures of the FDI-based absorptive capacity i.e.
FDIDTF and FDIGAP. On the other hand, sch, open, credit and IPA have a positive and significant
effect on TFP growth, while POPG, FDIDTF and FDIGAP have a negative and significant
relationship on TFP growth.
Page 73
61
Table 3.3: Correlation Matrix: 1980-2012.
TFP growth FDI DTF GAP Sch Open
TFP growth 1
FDI 0.03 1
DTF -0.92*** -0.0003 1
GAP -0.74*** -0.05** 0.79*** 1
Sch 0.61*** 0.17*** -0.62*** -0.6*** 1
Open 0.32*** 0.37*** -0.32*** -0.41*** 0.44*** 1
Credit 0.44*** -0.10*** -0.47*** -0.43*** 0.44*** 0.20***
POPG -0.30*** -0.009 0.28*** 0.22*** -0.33*** -0.15***
IPA 0.08** 0.14*** -0.03 0.04* 0.28*** 0.18***
FDIDTF -0.06*** 0.99*** 0.09*** 0.03 0.11*** 0.33***
FDIGAP -0.07*** 0.94*** 0.1*** 0.11*** 0.07*** 0.3***
Credit POPG IPA FDIDTF FDIGAP
Credit 1
POPG -0.20*** 1
IPA 0.12*** -0.18*** 1
FDIDTF -0.14*** 0.03 0.14*** 1
FDIGAP -0.13*** 0.04* 0.16*** 0.97*** 1
Notes: *, **, and *** indicate statistical significance at 10%, 5% and 1% levels, respectively.
Source: the author’s calculations.
3.4 Estimation and Results
We first carry out panel unit root tests to examine whether the variables are stationary (Li and Liu,
2005). Since panel data methodology uses both time and cross sectional analyses it is imperative
that the variables be stationary in order to avoid possible spurious relationships among the
variables (Bayar, 2014). As shown in Table 3.4 all the variables are stationary.
Page 74
62
Table 3.4: Panel Unit Root tests.
TFP growth FDI DTF GAP Sch
IPS W-stat
Levels -2.88*** -2.89*** -4.01*** -2.11** -4.06
[P-value] [0.00] [0.00] [0.00] [0.02] [1.00]
Differences -27.87*** -27.01*** -18.4*** -15.58*** -11.42***
[P-values] [0.00] [0.00] [0.00] [0.00] [0.00]
LLC t*-stat
Levels -1.16 -2.54*** -5.3*** -2.65*** -1.78**
[P-value] [0.12] [0.00] [0.00] [0.00] [0.03]
Differences -21.36*** -20.85*** -14.47*** -15.14*** -8.36***
[P-value] [0.00] [0.00] [0.00] [0.00] [0.00]
Open Credit POPG FDIDTF FDIGAP
IPS W-stat
Levels -2.5*** 0.62 -2.36*** -2.72*** -3.33***
[P-value] [0.00] [0.73] [0.00] [0.00] [0.00]
Differences -23.27*** -17.18*** -27.53*** -26.87*** -27.20***
[P-values] [0.00] [0.00] [0.00] [0.00] [0.00]
LLC t*-stat
Levels -3.63*** -1.64** -14.25*** -2.51*** -3.2***
[P-value] [0.00] [0.05] [0.00] [0.00] [0.00]
Differences -20.96*** -14.92*** -29.02*** -20.71*** -21.50***
[P-value] [0.00] [0.00] [0.00] [0.00] [0.00]
Notes: *, **, and *** indicate statistical significance at 10%, 5% and 1% levels, respectively. P-values are in square brackets.
Source: the author’s calculations.
The results are summarised and presented in Tables 3.5-3.8. The variables of interest are FDI, the
technology gap (DTF) and FDIDTF (the interaction of the FDI with the distance to the
technological frontier). We first determine whether FDI has any effect on TFP growth without
conditioning on the absorptive capacity. Table 3.5 presents the results from the fixed effects
estimation method. Columns 1 and 2 present the results with no interaction term (FDIDTF). In
columns 5, 6, 9 and 10 we present the results with the interaction term. We find that there is a
positive effect of FDI on TFP growth in all the columns. This relationship is significant in columns
1, 2, 3, 5, 6, 9 and 10. The coefficients are positive but very small which suggests that the effect
of FDI on TFP growth is not very significant. This is consistent with the findings of Li and Liu
Page 75
63
(2005), Woo (2009) and Baltabaev (2014). However, this contrasts with the findings from Durham
(2004) and Azman-Saini et al. (2010).
We also analyse the role of relative backwardness (DTF) and the interaction term of FDI with the
DTF (FDIDTF). As shown in Table 3.5, both the interaction variable (FDIDTF) and relative
backwardness variable (DTF) have a generally negative and significant effect in all columns. This
is inconsistent with the findings of Findlay (1978) and Wang and Blomstrom (1992). The negative
sign shows that both relative backwardness (DTF) and absorptive capacity (FDIDTF) have a
negative effect on TFP growth. This implies that the lower the level of technological development
in the host country the smaller is the impact of FDI on TFP growth (Baltabaev, 2014). There is
therefore no catching up by the relatively backward countries. This finding is consistent with
Sjoholm (1997) who argues that that huge technology gaps may present an impediment to the
absorption of any potential spillovers from FDI. Similarly, Glass and Saggi (1998) posit that
relative backwardness is a deterrent to because it limits the kind of technology that can be
transferred to the host country. Additionally, Falvey et al (2005) show that a huge technology gap
is unlikely to automatically translate to greater knowledge diffusion and catch-up, unless certain
preconditions exist that allow countries to absorb the inflow of foreign ideas and knowledge.
As presented in Table 3.5, human capital (sch) has a positive and significant effect on TFP growth
in columns 7 and 9. IPA has a positive and significant effect as presented in columns 3, 5, 6, 7
and 9. This suggests that the existence of an investment and promotion agency has a positive effect
on TFP growth. Credit has a positive but insignificant effect on TFP growth while open has a
negative but insignificant effect on TFP growth. Population growth has a positive effect on TFP
growth but this is only significant in column 9. Higher rates of population growth increase the
growth rates of TFP. This is consistent with (Jones, 1995). Kremer (1993) argues that long-run
historical observation provides evidence on the positive relationship between population growth
and technological progress.
The results remain robust to alternative estimation methods. Table 3.6 present the results from the
random effects estimation method. Columns 1 and 2 present the results with no interaction term
(FDIDTF). In columns 5, 6, 9 and 10 we present the results with the interaction term. We find a
Page 76
64
positive effect of FDI on TFP growth. This effect is however only significant in columns 5 and 9.
The interaction term (FDIDTF) has a negative but insignificant effect. The relative backwardness
term (DTF) has a negative and significant effect in all the columns. This confirms that a huge
technology gap presents an impediment to the absorption of any potential spillovers from FDI in
African countries.
Table 3.7 and Table 3.8 report the results of the estimation using both the one step and two step
system GMM methods respectively. FDI has a positive and significant effect on TFP growth as
shown in most of the columns. This result is consistent with the results from the fixed and random
effects estimation. As shown in both Table 3.7 and Table 3.8 the coefficient on FDI is positive but
very small and therefore not significant. The interaction term (FDIDTF) and relative backwardness
(DTF) term have a generally negative and significant effect in all columns included. This is also
consistent with the results from the fixed and random effects estimation. This is not consistent with
the convergence hypothesis of Findlay (1978). This suggests that the lower the level of
technological development in the host country the smaller the capacity of the host country to
absorb any potential spillovers from FDI. This implies that there is no catching up effect for
African economies. As Findlay (1978) observes, the technological gap should not be huge
otherwise the negative effect of the transfer of technology outweighs the benefit to the developing
countries. Our results are consistent with Baltabaev (2014); Falvey et al (2005), and Sjoholm
(1997) who show that that huge technology gaps presents an impediment to absorption of any
potential spillovers from FDI.
Page 77
65
Table 3.5: Fixed Effects Model Estimation Results (Dependent Variable: TFP growth, 1980-2012).
Independent Variables 1 2 3 4 5 6
lagged TFP growth 0.53*** 0.52*** 0.52*** 0.52*** 0.51*** 0.52***
[34.07] [33.63] [33.68] [33.56] [33.30] [33.15]
FDI 0.001*** 0.0003*** 0.0004* 0.0003 0.01*** 0.01***
[2.73] [1.12] [1.72] [1.17] [3.98] [3.88]
DTF -0.26*** -0.28*** -0.27*** -0.28*** -0.25*** -0.26***
[-10.74] [-11.32] [-11.20] [-11.26] [-10.15] [-10.18]
IPA 0.01*** 0.01 0.01*** 0.01*
[4.71] [1.78] [4.53] [1.76]
FDIDTF -0.01*** -0.01***
[-3.39] [-3.75]
Constant 0.31*** 0.30*** 0.32** 0.30*** 0.30*** 0.28***
[15.85] [14.08] [16.21] [14.04] [15.25] [13.14]
Time dummies No Yes No Yes No Yes
No. of obs. 1484 1484 1484 1484 1484 1484
No. of groups 45 45 45 45 45 45
F test (p-value) 0.00 0.00 0.00 0.00 0.00 0.00
R-squared 93.04 93.30 93.11 93.29 93.01 93.18
Notes: *, **, and *** indicate statistical significance at 1 percent, 5 percent and 10 percent levels, respectively. 1, 2, 3 and 4 stands for Foreign Direct Investment, Distance to Technological Frontier, Investment Promotion Agency and interaction term between Foreign Direct Investment and
Distance to Technological Frontier.
Source: the author’s calculations.
Page 78
66
Table 3.5: Fixed Effects Model Estimation Results (Dependent Variable: TFP growth,
1980-2012).
Independent Variables 7 8 9 10
lagged TFP growth 052*** 0.52*** 0.51*** 0.52***
[33.61] [33.30] [33.22] [32.96]
FDI 0.0004 0.0003 0.01*** 0.01***
[1.55] [1.31] [4.18] [4.01]
DTF -0.27*** -0.28*** -0.25*** -0.25***
[-10.96] [-11.02] [-9.84] [-9.83]
Sch 0.01*** -0.0001 0.01*** 0.01
[1.99] [-0.06] [12.28] [0.39]
Open -0.003 -0.003 -0.004 -0.004
[-0.69] [-0.63] [-0.85] [-0.72]
Credit 0.001 0.002 0.001 0.001
[0.49] [0.82] [0.33] [0.67]
POPG 0.002 0.002 0.002* 0.002
[1.15] [1.19] [1.44] [1.46]
IPA 0.01*** 0.003 0.01* 0.01
[3.02] [0.79] [2.81] [1.77]
FDIDTF -0.01*** -0.01***
[-4.00] [-3.86]
Constant 0.30*** 0.30*** 0.44*** 0.28***
[9.97] [8.93] [16.69] [8.24]
Time dummies No Yes No Yes
No. of obs. 1484 1484 1484 1484
No. of groups 45 45 45 45
F test (p-value) 0.00 0.00 0.00 0.00
R-squared 93.14 93.23 93.02 93.13
Notes: *, **, and *** indicate statistical significance at 1 percent, 5 percent and 10 percent levels, respectively.
1, 2, 3, 4, 5, 6, 7, 8 and 9 stands for Total Factor Productivity (TFP), Foreign Direct Investment, Distance to Technological
Frontier, School enrolment, Trade openness as a % of GDP, private sector credit as a % of GDP, population growth
rate as a %, Investment Promotion Agency and the interaction term between FDI and DTF respectively.
Source: the author’s calculations.
Page 79
67
Table 3.6: Random Effects Model Estimation Results (Dependent Variable: TFP growth, 1980-2012).
Independent Variables 1 2 3 4 5 6
lagged TFP growth 0.61*** 0.60*** 0.60*** 0.60*** 0.60*** 0.60***
[40.89] [40.01] [40.44] [39.95] [40.28] [39.82]
FDI 0.0001 0.0002 0.0003 0.0002 0.002* 0.002
[2.27] [0.73] [1.64] [0.79] [1.34] [1.11]
DTF -0.41*** -0.42*** -0.42*** -0.42*** -0.41*** -0.42***
[-24.78] [-25.10] [-25.15] [-25.07] [-24.06] [-23.97]
IPA 0.01*** 0.004 0.01*** 0.04
[4.33] [1.21] [4.35] [1.25]
FDIDTF -0.002 -0.002
[-1.12] [-1.00]
Constant 0.40*** 0.38*** 0.40*** 0.38*** 0.40*** 0.37***
[25.53] [21.45] [25.79] [21.44] [25.07] [20.88]
Time dummies No Yes No Yes No Yes
No. of obs. 45 45 45 45 45 45
No. of groups 1484 1484 1484 1484 1484 1484
F test (p-value) 0.00 0.00 0.00 0.00 0.00 0.00
R-squared 93.13 93.37 93.21 93.38 93.21 93.38
Notes: *, **, and *** indicate statistical significance at 1 percent, 5 percent and 10 percent levels, respectively. 1, 2, 3, 4 and 5 stands for Total Factor
Productivity, Foreign Direct Investment, Distance to Technological Frontier, Investment Promotion Agency and interaction term between Foreign
Direct Investment and Distance to Technological Frontier respectively. Source: the author’s calculations.
Page 80
68
Table 3.6: Random Effects Model Estimation Results (Dependent Variable: TFP growth,
1980-2012).
Independent Variables 7 8 9 10
lagged TFP growth 0.60*** 0.60*** 0.59*** 0.60***
[39.87] [39.53] [39.71] [39.39]
FDI 0.0002 0.0001 0.002* 0.002
[0.68] [0.31] [1.34] [1.24]
DTF -0.40*** -0.41*** -0.39*** -0.40***
[-22.44] [-21.96] [-21.44] [-20.94]
Sch 0.01*** 0.004 0.01*** 0.004
[3.19] [1.51] [3.24] [1.57]
Open 0.002 0.003 0.002 0.003
[0.71] [1.01] [0.71] [1.01]
Credit -0.001 -0.001 -0.001 -0.0004
[-0.63] [-0.31] [-0.56] [-0.25]
POPG -0.0004 -0.0002 -0.0003 -0.0001
[-0.31] [-0.21] [-0.21] [-0.10]
IPA 0.01*** 0.004 0.01*** 0.004
[2.79] [1.51] [2.75] [1.21]
FDIDTF -0.002 -0.002
[-1.25] [-1.20]
Constant 0.36*** 0.35*** 0.36*** 0.34***
[15.37] [13.54] [14.90] [13.10]
Time dummies No Yes No Yes
No. of obs. 1484 1484 1484 1484
No. of groups 45 45 45 45
F test (p-value) 0.00 0.00 0.00 0.00
R-squared 93.26 95.53 93.26 93.39
Notes: *, **, and *** indicate statistical significance at 1 percent, 5 percent and 10 percent levels, respectively. 1, 2, 3, 4, 5, 6, 7, 8 and 9 stands for Total Factor Productivity (TFP), Foreign Direct Investment, Distance to Technological
Frontier, School enrolment, Trade openness as a % of GDP, private sector credit as a % of GDP, population growth
rate as a %, Investment Promotion Agency and the interaction term between FDI and DTF respectively.
Source: the author’s calculations.
Page 81
69
Table 3.7: One step System GMM Model Estimation Results.
Independent Variables 1 2 3 4 5
lagged TFP growth 0.43*** 0.44*** 0.44*** 0.43*** 0.43***
[22.55] [22.40] [22.26] [21.68] [21.55]
FDI 0.001*** 0.0003 0.002 0.003 0.002**
[-2.86] [-1.29] [1.24] [-1.39] [1.37]
DTF -0.38*** -0.35*** -0.34*** -0.37*** -0.36***
[-18.78] [-16.13] [-15.85] [-16.43] [-16.20]
Sch -0.03** -0.03
[-5.49] [-5.60]
Open 0.03*** 0.03***
[4.50] [4.44]
Credit 0.001 0.001
[0.40] [0.36]
POPG 0.003** 0.003*
[1.94] [1.90]
IPA -0.02*** -0.02*** -0.01 -0.01*
[-6.16] [-6.31] [-1.60] [-1.72]
FDIDTF -0.003 -0.003***
[-1.45] [-1.59]
Constant 0.33*** 0.30*** 0.30*** 0.28*** 0.29***
[18.87] [16.10] [15.93] [8.03] [8.09]
No. of obs. 1395 1395 1395 1395 1395
No. of groups 45 45 45 45 45
No. of instruments 65 66 67 70 71
Sargan p-value 0.00 0.00 0.00 0.00 0.00
Notes: *, **, and *** indicate statistical significance at 1 percent, 5 percent and 10 percent levels, respectively. . 1, 2, 3, 4, 5, 6, 7, 8 and 9
stands for Total Factor Productivity (TFP), Foreign Direct Investment, Distance to Technological Frontier, School enrolment, Trade openness as a % of GDP, private sector credit as a % of GDP, population growth rate as a %, Investment Promotion Agency and the
interaction term between FDI and DTF respectively.
Source: the author’s calculations.
Page 82
70
Table 3.8: Two step System GMM Model Estimation Results.
Independent Variables 1 2 3 4 5
lagged TFP growth 0.43*** 0.44*** 0.43*** 0.43*** 0.43***
[132.52] [107.88] [125.36] [65.04] [40.47]
FDI 0.001*** 0.0003*** 0.002*** 0.004*** 0.002***
[-34.81] [-15.04] [6.62] [-7.10] [6.61]
DTF -0.38*** -0.34*** -0.34*** -0.35*** -0.36***
[-99.70] [-86.50] [-61.73] [-36.58] [-47.25]
Sch -0.03** -0.03
[-14.68] [-10.38]
Open 0.02*** 0.02***
[10.69] [10.10]
Credit 0.001 0.001
[0.70] [1.12]
POPG 0.003** 0.002**
[5.03] [2.69]
IPA -0.02*** -0.02*** -0.01*** -0.01***
[-18.60] [-18.65] [8.75] [-7.46]
FDIDTF -0.003*** -0.003***
[-7.42] [-7.71]
Constant 0.33*** 0.30*** 0.30*** 0.27*** 0.29***
[90.16] [108.08] [79.81] [16.33] [17.14]
No. of obs. 1395 1395 1395 1395 1395
No. of groups 45 45 45 45 45
No. of instruments 65 66 67 70 71
Sargan p-value 0.95 0.97 0.97 0.98 0.97
AR(1) p-value 0.04 0.03 0.03 0.04 0.04
AR(1) p-value 0.00 0.00 0.00 0.00 0.00
Notes: *, **, and *** indicate statistical significance at 1 percent, 5 percent and 10 percent levels, respectively. 1, 2, 3, 4, 5, 6, 7, 8
and 9 stands for Total Factor Productivity (TFP), Foreign Direct Investment, Distance to Technological Frontier, School enrolment,
Trade openness as a % of GDP, private sector credit as a % of GDP, population growth rate as a %, Investment Promotion Agency and the interaction term between FDI and DTF respectively.
Source: the author’s calculations.
Page 83
71
3.5 Robustness Checks
To check the robustness of the results we use a different measure of relative backwardness. We
follow Li and Liu (2005) in using the income gap (GAP) as a proxy for technology gap. This is
defined in equation (4). The results are presented in Tables 3.9-3.12. In Table 3.9 we present our
results using the fixed effects method. FDI has a positive and significant effect on TFP growth
only in columns 1 and 9. The relative backwardness term (GAP) generally has a negative and
statistically significant effect. This result is consistent with the results that were presented in Tables
3.5-3.8. This result confirms that there is no catching up effect for African economies. The
interaction tem FDIGAP has a negative and significant effect only in column 9. The existence of
an investment promotion agency has a positive and significant effect in all the columns. Population
growth (POPG) has a positive and significant effect while credit only has a positive and significant
effect in column 9.
Table 3.10 shows the results from the random effects estimation method. FDI is shown to have a
positive and significant effect on TFP growth in columns 5 and 6 which is consistent with the
results from the fixed effects method. The relative backwardness term (GAP) is negative and
statistically significant in all the columns which confirms that there is no catching up. However,
the interaction tem FDIGAP has no significant effect on TFP growth. Meanwhile, IPA and sch
have a generally positive and significant effect on TFP growth as expected.
In Table 3.11 and Table 3.12 we report the results of the estimation using both the one step and
two step system GMM methods respectively. In Table 3.11 FDI is shown to have a positive and
significant effect on TFP growth in columns 1, 2, 3 and 4 whereas in Table 3.12 FDI is shown to
have a positive and significant effect in all the columns. The interaction variable (FDIGAP) is only
positive and significant in Table 3.12. However, the relative backward variable (GAP) has a
negative and significant effect in both Table 3.11 and Table 3.12. This is consistent with the results
from the other estimation methods. This means that the lower the level of technological
development of the host country, the smaller is the impact of FDI on total factor productivity. The
results confirm that there is no evidence of any catching up in African economies.
Page 84
72
Table 3.9: Fixed Effects Model Estimation Results (Dependent Variable: TFP growth, 1980-2012).
Independent Variables 1 2 3 4 5 6
lagged TFP growth 0.58*** 0.58*** 0.57*** 0.58*** 0.57*** 0.58***
[38.10] [38.02] [37.85] [37.89] [37.76] [37.79]
FDI 0.01** 0.002 0.0003 0.0003 0.001 0.001
[2.09] [1.05] [1.31] [1.15] [1.63] [1.20]
GAP -0.004 -0.01** -0.01*** -0.01*** -0.003 -0.01***
[-1.54] [-2.48] [-1.90] [-2.61] [-1.15] [-1.92]
IPA 0.01*** 0.01*** 0.01*** 0.01***
[3.72] [2.20] [3.64] [2.25]
FDIGAP -0.0003 -0.0002
[-1.31] [-0.92]
Constant 0.12*** 0.10*** 0.12*** 0.10*** 0.11*** 0.10***
[11.57] [7.90] [11.72] [8.01] [10.29] [7.15]
Time dummies No Yes No Yes No Yes
No. of obs. 1484 1484 1484 1484 1484 1484
No. of groups 45 45 45 45 45 45
F test (p-value) 0.00 0.00 0.00 0.00 0.00 0.00
R-squared 90.60 91.04 90.66 91.06 90.56 90.98
Notes: *, **, and *** indicate statistical significance at 1 percent, 5 percent and 10 percent levels, respectively. 1, 2, 3, 4 and 5 stands for Total Factor
Productivity, Foreign Direct Investment, the relative backward variable, Investment Promotion Agency and the interaction term between FDI and
the relative backward term respectively. Source: the author’s calculations.
Page 85
73
Table 3.9: Fixed Effects Model Estimation Results (Dependent Variable: TFP growth,
1980-2012).
Independent Variables 7 8 9 10
lagged TFP growth 0.57*** 0.58*** 0.57*** 0.58***
[37.75] [37.71] [37.65] [37.62]
FDI 0.0003 0.0003 0.002** 0.001
[1.19] [1.16] [2.02] [1.60]
GAP -0.004*** -0.01*** -0.002 -0.01*
[-1.70] [-2.59] [-0.76] [-1.68]
Sch 0.01 0.004 0.01** 0.01
[1.93] [0.84] [2.27] [1.08]
Open -0.003 -0.0001 -0.004 -0.001
[-0.62] [-0.17] [-0.71] [-0.22]
Credit 0.002 0.003* 0.002 0.003
[1.00] [1.22] [1.06] [1.20]
POPG 0.003** 0.003** 0.004** 0.003**
[2.18] [2.07] [2.37] [2.17]
IPA 0.01** 0.01** 0.01** 0.01**
[2.36] [2.09] [2.03] [2.15]
FDIGAP -0.0003** -0.0003
[-1.75] [-1.32]
Constant 0.10*** 0.08*** 0.09*** 0.07***
[3.88] [2.87] [3.49] [2.47]
Time dummies No Yes No Yes
No. of obs. 1484 1484 1484 1484
No. of groups 45 45 45 45
F test (p-value) 0.00 0.00 0.00 0.00
R-squared 90.87 91.17 90.73 91.09
Notes: *, **, and *** indicate statistical significance at 1 percent, 5 percent and 10 percent levels, respectively. 1, 2, 3, 4, 5, 6, 7, 8 and 9 stands for Total Factor Productivity, Foreign Direct Investment, relative backwardness
variable, school enrolment, trade openness as a % of GDP, private sector credit as a % of GDP, population growth, Investment Promotion Agency and the interaction term between FDI and relative backwardness.
Source: the author’s calculations.
Page 86
74
Table 3.10: Random Effects Model Estimation Results (Dependent Variable: TFP growth, 1980-2012).
Independent Variables 1 2 3 4 5 6
lagged TFP growth 0.85*** 0.83*** 0.84*** 0.83*** 0.84*** 0.82***
[73.92] [70.51] [72.49] [73.52] [71.67] [68.74]
FDI 0.0001 -0.0001 0.0001 0.0001 0.001* 0.002**
[0.56] [-0.54] [0.03] [-0.41] [-1.66] [-2.19]
GAP -0.02*** -0.02*** -0.02*** -0.03*** -0.02*** -0.03***
[-11.00] [-12.31] [-11.40] [-12.54] [-11.18] [-12.34]
IPA 0.01*** 0.01** 0.01*** 0.01***
[3.73] [2.57] [3.67] [2.30]
FDIGAP 0.0004 0.001
[1.76] [2.17]
Constant 0.11*** 0.08*** 0.11*** 0.08*** 0.12*** 0.09***
[12.12] [6.77] [12.40] [7.01] [12.25] [7.42]
Time dummies No Yes No Yes No Yes
No. of obs. 1484 1484 1484 1484 1484 1484
No. of groups 45 45 45 45 45 45
F test (p-value) 0.00 0.00 0.00 0.00 0.00 0.00
R-squared 90.98 91.33 91.06 91.37 91.08 91.40
Notes: *, **, and *** indicate statistical significance at 1 percent, 5 percent and 10 percent levels, respectively. 1, 2, 3, 4 and 5 stands for Total Factor Productivity, Foreign Direct Investment, the relative backward variable, Investment Promotion Agency and the interaction term between FDI and
the relative backward term respectively. Source: the author’s calculations.
Page 87
75
Table 3.10: Random Effects Model Estimation Results (Dependent Variable: TFP growth,
1980-2012).
Independent Variables 7 8 9 10
lagged TFP growth 0.82*** 0.80*** 0.81*** 0.81***
[67.18] [64.81] [66.62] [64.30]
FDI -0.0001 -0.0001 -0.001 -0.001
[-0.51] [-0.27] [-1.51] [-1.47]
GAP -0.02*** -0.02*** -0.02*** -0.02***
[-8.14] [-8.75] [-7.99] [-8.54]
Sch 0.01*** 0.01** 0.01*** 0.01***
[5.37] [4.37] [5.35] [4.21]
Open 0.001 0.0001 0.001 0.001
[0.22] [0.20] [0.18] [0.15]
Credit 0.003 0.003 0.002 0.002
[1.41] [1.49] [1.25] [1.36]
POPG 0.0001 0.001 0.001 0.001
[-0.45] [-0.55] [-0.59] [-0.60]
IPA 0.0007 0.01** 0.003 0.01***
[0.23] [2.09] [1.04] [1.94]
FDIGAP -0.0003 -0.0003
[1.43] [1.46]
Constant 0.05** 0.03** 0.06*** 0.07***
[2.51] [1.40] [2.79] [2.98]
Time dummies No Yes No Yes
No. of obs. 1484 1484 1484 1484
No. of groups 45 45 45 45
F test (p-value) 0.00 0.00 0.00 0.00
R-squared 91.26 91.50 91.27 91.52
Notes: *, **, and *** indicate statistical significance at 1 percent, 5 percent and 10 percent levels, respectively.
1, 2, 3, 4, 5, 6, 7, 8 and 9 stands for Total Factor Productivity, Foreign Direct Investment, relative backwardness
variable, school enrolment, trade openness as a % of GDP, private sector credit as a % of GDP, population growth, Investment Promotion Agency and the interaction term between FDI and relative backwardness.
Source: the author’s calculations.
Page 88
76
Table 3.11: One step System GMM Model Estimation Results.
Independent Variables 1 2 3 4 5
lagged TFP growth 0.55*** 0.55*** 0.55*** 0.54*** 0.54***
[28.54] [27.73] [27.66] [27.07] [27.02]
FDI 0.001*** 0.004* 0.002* 0.0001** 0.001
[-4.13] [-1.82] [-1.68] [-1.98] [-1.56]
GAP -0.03*** -0.02*** -0.02*** -0.02*** -0.02***
[-7.72] [-5.39] [-5.52] [-5.39] [-5.48]
Sch -0.02 -0.02
[-3.50] [-3.49]
Open 0.02*** 0.02***
[3.40] [3.40]
Credit 0.005 0.005
[1.38] [1.36]
POPG 0.005** 0.005**
[3.02] [3.00]
IPA 0.04*** 0.03*** 0.02*** 0.02**
[-9.04] [-8.78] [-4.61] [-4.49]
FDIGAP -0.0003 -0.0002
[1.20] [1.02]
Constant 0.12*** 0.09*** 0.09*** 0.04*** 0.04
[8.05] [5.58] [5.70] [1.09] [1.17]
No. of obs. 1395 1395 1395 1395 1395
No. of groups 45 45 45 45 45
No. of instruments 65 66 67 70 71
Sargan p-value 0.00 0.00 0.00 0.00 0.00
Notes: *, **, and *** indicate statistical significance at 1 percent, 5 percent and 10 percent levels, respectively. 1, 2, 3, 4, 5, 6, 7, 8
and 9 stands for Total Factor Productivity, Foreign Direct Investment, relative backwardness variable, school enrolment, trade openness as a % of GDP, private sector credit as a % of GDP, population growth, Investment Promotion Agency and the interaction
term between FDI and relative backwardness.
Source: the author’s calculations.
Page 89
77
Table 3.12: Two step System GMM Model Estimation Results.
Independent Variables 1 2 3 4 5
lagged TFP growth 0.55*** 0.54*** 0.54*** 0.54*** 0.54***
[178.44] [86.40] [108.53] [76.45] [45.28]
FDI 0.001*** 0.004*** 0.001*** 0.001*** 0.001***
[-27.77] [-20.23] [-8.98] [-15.77] [-7.56]
GAP -0.03*** -0.02*** -0.02*** -0.02*** -0.02***
[-46.22] [-17.48] [-17.49] [-12.53] [-11.55]
Sch -0.02 -0.02
[-10.12] [-10.55]
Open 0.02*** 0.02***
[9.78] [8.21]
Credit 0.004** 0.004
[2.34] [2.19]
POPG 0.005** 0.01***
[3.93] [3.36]
IPA 0.03*** 0.03*** 0.02*** 0.02***
[-23.59] [-19.58] [-13.77] [-10.92]
FDIGAP -0.003** -0.0002***
[5.91] [4.51]
Constant 0.12*** 0.09*** 0.09*** 0.04*** 0.04***
[49.17] [21.03] [20.79] [2.95] [3.32]
No. of obs. 1395 1395 1395 1395 1395
No. of groups 45 45 45 45 45
No. of instruments 65 66 67 70 71
Sargan p-value 0.97 0.95 0.96 0.97 0.97
AR(1) p-value 0.02 0.02 0.02 0.02 0.02
AR(1) p-value 0.00 0.00 0.00 0.00 0.00
Notes: *, **, and *** indicate statistical significance at 1 percent, 5 percent and 10 percent levels, respectively. 1, 2, 3, 4, 5, 6, 7, 8
and 9 stands for Total Factor Productivity, Foreign Direct Investment, relative backwardness variable, school enrolment, trade
openness as a % of GDP, private sector credit as a % of GDP, population growth, Investment Promotion Agency and the interaction term between FDI and relative backwardness.
Source: the author’s calculations
Page 90
78
3.6 Conclusion and Policy Recommendations
Empirical literature on the relationship between FDI and productivity growth has produced mixed
results. In this chapter we examine the impact of FDI on productivity growth and the role of relative
backwardness (the technology gap) on a panel of 45 African countries over the period 1980-2012.
We use two measures of relative backwardness namely: the distance from technological frontier
(DTF) and the income gap (GAP). We apply the fixed effects, random effects and the system
GMM method to account for the issues of endogeneity. The different estimation methods used
help to check for the robustness of the results.
Our results show a general positive but insignificant effect of FDI on productivity growth in
African countries under the sample. This suggests that FDI has a limited effect on productivity in
African countries. The chapter supports previous studies that have questioned the widespread
enthusiasm associated with FDI (e.g. Carkovic and Levine, 2005; Aitken and Harrison, 1999). The
failure by many African countries to fully adopt foreign technologies may be because of the limited
absorptive capacity. Blomstorm and Kokko (2003) observe that spillovers from FDI are not
automatic and that they depend on local conditions. In particular, Borensztein et. al. (1998) and
Xu (2000) show that FDI is more productive than domestic investment only when the host
economy has sufficient human capital development.
African governments should focus more on improving the education and skills level of the labour
force through human capital investments. Nelson and Phelps (1966) argue that human capital
investments play a major role in growth via two channels namely: increasing a country’s ability to
undertake innovation and through enhancing the absorption and adoption of foreign technologies.
Hence, as argued by (Ashraf et al, 2014), finite domestic government resources could probably be
better utilised in human capital investments as opposed to offering generous tax incentives and
non-tax incentives to multinational companies.
Our analysis of the advantage of relative backwardness does not support the convergence theory
of Findlay (1978) and Wang and Blomstrom (1992). This is seen from the negative and significant
sign of the relative backwardness variables DTF and GAP. Also, the interaction term variables
Page 91
79
FDIDTF and FDIGAP are negative and significant. This suggests that the lower the technological
development in the host country the smaller the spillovers from FDI. This observation is also
shared by Glass and Saggi (1998) who show that relative backwardness is a deterrent to the
absorption of spillovers from FDI as it limits the kind of technology that can be transferred.
Falvey et al (2005) emphasise that having a huge technological gap is unlikely to lead to greater
knowledge diffusion and catch-up, unless certain preconditions exist that allow countries to absorb
the inflow of foreign ideas and knowledge. Empirical evidence shows that institutions help in the
diffusion of technology and that countries with better institutions tend to experience better
technology diffusion than those countries lacking basic institutions (Manca, 2009). African
governments therefore need to strengthen their institutions so as to improve their absorptive
capacity and thereby close the technology gap.
Some scholars find that the potential of FDI to generate productivity effects differs across sectors
and even across different countries. Nunnenkamp and Spatz (2003) find that aggregate growth in
developing countries is higher if a country has a high FDI share in the machinery and electrical
equipment industry rather than in the food, chemical or metal industries. Similarly, Aykut and
Sayek (2005) find that a high share of agriculture in total FDI is negative for growth, whereas a
high share of manufacturing FDI is significantly positive. Baltabaev (2014) argues that analysing
FDI at the macro level may hide the dynamics and effects that may occur within and across sectors
at the micro level. In future therefore it may be necessary to investigate the sectoral and country-
level effects of FDI on productivity growth so as to provide a more holistic and comprehensive
picture.
Page 92
80
CHAPTER 4: THE IMPACT OF FOREIGN DIRECT INVESTMENT ON EXPORTS,
IMPORTS AND PROFIT OUTFLOWS IN AFRICAN COUNTRIES
4.1 Introduction
This Chapter investigates the impact of FDI on exports, imports, and profit outflows in 47 African
countries over the period 1980-2012. While the relationship between FDI, exports and imports
has received a lot of coverage in literature, one aspect that has not received as much attention is
the role of profit outflows (Yalta, 2012). Hence, FDI does not only affect the current account
through trade (exports and imports) but also through profit and income repatriations from the host
country. Many African governments have been offering generous incentives to foreign investors
in the hope of attracting FDI inflows to finance the high current account deficits. Jansen (1995)
argues that investment income payments arising from FDI complicate the relationship between
FDI and the current account.
While FDI is often regarded as a driver of growth, its potential deleterious impact on the current
account through profit remittances is often neglected. These profit remittances may actually cause
external imbalances which may foster macroeconomic instability. As Bhinda and Martin (2009)
observe, FDI inflows in SSA are often surpassed by profits repatriated raising questions about
whether FDI is sustainable. Turner (1991) explains that capital flows magnify current account
disequilibria, with deficit countries confronted by capital outflows and surplus countries by capital
inflows. Similarly, Calvo et al. (1996) observe that the widening current account deficit is one of
major problems associated with capital inflows. UNCTAD (2002) observes that the rising FDI
inflows can affect the balance of payments because of profit outflows by the multinational
enterprises. Guerin (2012) argues that the unsustainable current account deficit is one of the
undesirable effects of capital flows in developing countries.
This chapter fills the gap in the literature by providing empirical evidence on the dynamic
relationship between FDI, exports, imports and profit repatriations in Africa. This is an area that
has remained largely unexplored in literature. Strauss (2015) observes that the notion of how profit
repatriations associated with FDI are driving developing economies’ current account deficits
‘remains heavily under researched.’ Most of the studies only examine the relationship between
Page 93
81
FDI and the current account through exports and imports separately while neglecting the potential
role of profit repatriations. Hence, most of the studies do not consider the overall effect of FDI on
the current account deficit through other channels (Kaur et al, 2012). Some of the studies that
consider the relationship between FDI and profit remittances include: Seabra and Flach (2005),
Yalta (2012) and Strauss (2015). These studies are based on time series data and do not consider
African economies. Seabra and Flach (2005) examine the relationship between FDI and profit
remittances in Brazil while Yalta (2012) analyses the various channels through which FDI affects
the current account in Turkey. Strauss (2015) studies the contribution of income repatriations from
FDI to South Africa’s current account deficit post-1994. It is therefore necessary to investigate the
relationship between FDI flows and the current account in African economies using panel data
analysis. Hence, this chapter is based on the panel cointegration and causality tests.
This chapter contributes to literature in a number of ways. By focusing on Africa the study captures
the unique characteristics of the region and provides regional-specific policy recommendations.
We build on the work by Yalta (2012) who examines the different channels through which FDI
affects the current account in Turkey. We use panel cointegration techniques that are robust to
omitted variables to estimate the long run relationship between FDI, exports, imports and profit
remittances. Given that we include 47 countries over the period 1980-2012 our sample includes
more countries over a longer time period than the samples used in previous studies in this area.
Moreover, by including lagged explanatory variables panel procedures allow control for potential
endogeneity problems.
The rest of the chapter is organised as follows: Section 4.2 is an overview of the trends in the
current account and other selected macroeconomic indicators. Section 4.3 reviews and discusses
the related literature. Section 4.4 details the data description and model specification. Section 4.5
presents the estimation and analysis of the results and section 4.6 is the conclusion and policy
recommendations.
Page 94
82
4.2 Trends in the Current Account and Selected Macroeconomic Indicators FDI in Africa
Widening current account deficits are a common and persistent feature in many African
economies. To finance these deficits many African countries have resorted to external borrowing
and capital inflows. Against the background of low savings and investments, questions have now
been raised over the sustainability of the current account deficits (Osakwe and Verick, 2007).
Edwards (2002) argues that high current account deficits increase the probability of a currency
crisis. Table 4.1 shows trends in selected key macroeconomic indicators.
Table 4.1: Selected Macroeconomic Indicators for SSA.
Current
Account Fiscal Balance Gvt. Debt Exports Imports FDI
Year (% of GDP) (% of GDP) (% of GDP) (% of GDP) (% of GDP) (% of GDP)
2004 -1.6 -0.9 53.2 33.6 32.5 2.2
2005 -0.3 1.5 44.6 36.1 33.1 2.9
2006 3.8 2 33.3 37.5 34.1 1.2
2007 1.1 0 30 38.6 36.5 2.7
2008 -0.4 -0.3 29.1 41.1 40.1 4.1
2009 -3.1 -6.9 32.2 32.7 36.1 3.5
2010 -1.4 -5.1 31.8 34.8 35.5 2.1
2011 -1.4 -2.3 33 38.7 38.4 2.9
2012 -3 -3.7 33 36.6 38.1 2.4
2013 -4 -4.1 33.9 36.1 39.1 3.1
2014 -4 -4 34.8 35.2 38.3 2.9
Source: IMF World Economic Outlook (WEO) Database October 2013.
As presented in Table 4.1, the overall current account balance has steadily risen from -1.6 percent
in 2004 to -4 percent in 2014. Not only have African countries been running current account
deficits, they have also been running fiscal deficits (the twin deficit). The fiscal balance worsened
from -0.9 percent in 2004 to -4 percent in 2014. Government debt has also risen in the same period
from -0.9 percent to -4 percent. This suggests that a number of African countries have incurred
debt to finance the high current and fiscal account deficits. In terms of the specific components of
the current account, imports exceeded exports in the period 2009-2014 except for 2011. The trade
deficit is a major driver of the current account imbalance as shown in Table 4.1. On the other hand,
the UNDP (2011), reports that total remitted profits and dividends from FDI in the developing
Page 95
83
world increased by about 736 percent from $33 billion in 1995 to $276 billion in 2008. The report
also observes that profit remittances are increasing at a faster pace than FDI inflows, for instance,
while profit remittances constituted about 29 percent of FDI inflows in 1995, by 2008 the figure
had risen to 36 percent.
The current account deficit can also often viewed in terms of the gap between savings and
investment. If savings are less than investment (a savings gap), this indicates that an economy
needs to import financial resources to finance investment beyond the level of capital accumulation
in the domestic economy. As shown in Table 4.2, investment (gross capital formation) in SSA
countries has exceeded the level of domestic savings for the greater part of the period 1980-2012.
This has resulted in a huge financing gap that has to be filled with foreign capital inflows such as
FDI and external borrowings.
Table 4.2: Savings and Investments (% of GDP) for SSA.
Year Savings Investment Year Savings Investment
1980 23.61 25.47 1997 14.96 17.75
1981 19.96 27.60 1998 14.77 18.83
1982 16.55 22.69 1999 14.34 17.69
1983 18.58 21.35 2000 16.15 17.38
1984 17.97 20.85 2001 15.14 17.50
1985 19.25 18.85 2002 16.74 17.60
1986 18.41 18.23 2003 16.35 18.41
1987 17.26 16.53 2004 16.87 19.31
1988 17.71 18.50 2005 16.38 19.15
1989 17.22 18.51 2006 16.38 19.98
1990 15.90 17.77 2007 16.43 21.10
1991 14.45 17.30 2008 16.23 22.12
1992 12.27 15.57 2009 14.07 20.96
1993 13.71 16.01 2010 17.03 20.92
1994 15.66 18.25 2011 16.96 21.22
1995 15.87 18.33 2012 17.04 21.46
1996 18.23 18.37
Source: World Development Indicators (WDI) database.
Page 96
84
4.3 Literature Review
Most of the previous studies only examine the relationship between FDI and the current account
through exports and imports separately while neglecting the potential role of profit repatriations.
Yalta (2012) observes that FDI can have a negative effect on the current account through
repatriations of profit and dividends by the foreign investors. The UNCTAD (1999) estimates that
for every $1 transferred to developing countries though FDI, around $0.30 leaves in the form of
repatriated income. Doraisami (2007) notes that foreign investors tend to repatriate income to the
home country even during times of crisis and thereby exacerbate the external imbalances. Once
these profit remittances are taken as an indicator for the ‘price’ of FDI then FDI becomes an
unsustainable form of financing current account deficits (Mold, 2008).
FDI inflows into Africa have been concentrated mostly in the extractive sectors. This has a
negative effect on the balance of payments because the resultant profit remittances have surpassed
any new FDI inflows (Nunnenkamp, 2004; UNCTAD, 2005). UNCTAD (2007) observes that in
Chile while the boom in commodity prices led to a rise in the share of FDI through reinvested
earnings, it unfortunately also resulted in an increase in profit remittances. Kumar (2007) argues
that FDI inflows are a risky form of financing in many developing countries. This is because they
are often associated with increasing incidence of capital flight during the times of financial crisis.
Moreover, the income earned through the investment is repatriated to the home country or some
other tax havens.
Campbell (2001) investigates the impact of FDI on the current account in Barbados from 1970-
1999. The study applies cointegration regression analysis and finds that FDI inflows leads to
deterioration in the current account balance both in the short run and in the long run. Lehman
(2002) argues that FDI inflows result in a structural change in the external account of a country.
The study uses data covering the period 1996-2000 for Brazil and Argentina and finds that FDI
was responsible for causing huge income and profit repatriations that caused current account
deficits in both countries. Furthermore, Woodward (2003) finds that FDI is one of the main factors
driving current account deficits in the six countries in his sample. The study equates profit
repatriations from FDI to loan repayments on external debt.
Page 97
85
Similarly, Seabra and Flach (2005) investigate the causal relationship between FDI and profit
remittances for Brazil using the Granger causality test procedure. Their findings indicate that FDI
causes profit remittances. They emphasise the significant adverse long run effects of FDI attraction
policies for the Brazilian economy. Yalta (2012) studies the effect of FDI on the current account
in Turkey using a vector autoregressive (VAR) model. The results provide evidence that FDI
negatively affects the current account because it is associated with a decrease in exports and an
increase in both imports and profit remittances. The magnitude of the change in profit remittances
in response to a change in FDI flows is greater than that of exports and imports. Likewise, Hossain
(2007) examines the impact of FDI on Bangladesh’s balance of payments over the period 1998 to
2007. The results show that FDI has an initial positive impact on the balance of payments.
However, the medium term effect is negative because the foreign investors increase their imports
of intermediate goods and services, and begin to repatriate profit and income. Liuyong and
Yanping (2007) analyse the dynamic relationship between FDI and the balance of payments for
China from 1983 to 2005 using the Granger causality test and impulse response function. The
results confirm that FDI has a negative effect on the current account.
Meanwhile, Salman and Feng (2009) estimate the long run relationship between Pakistan’s FDI
and the current account balance using co-integration and error correction techniques. They find
that Pakistan’s FDI has long been the main factor in creating the current account deficit in the
country. A one percent increase in the foreign direct investment is associated with a two percent
increase in the current account deficit. Jaffri et al (2012) in an analysis of the impact of FDI inflows
on the current account in Pakistan find that an increase in FDI is associated with an increase in
income outflows and the worsening of the current account in the long run. Siddiqui et al (2013)
examine the relationship between FDI and the current account in Pakistan. They use the Johansen-
Juselius cointegration technique and the Granger causality test and their results show that FDI
inflows lead to a deterioration of the balance of payments in the long run. There are however few
papers that deal with panel data analysis of the relationship between FDI and the current account.
One such study is Mencinger (2008), who analyses the relationship between FDI and the current
account balance using panel data of eight EU new member states over the period 1996-2006. The
study finds that FDI worsens the current account balance in all the EU new member states.
Page 98
86
Interestingly, Athukorala and Menon (1996) in their study of the Malaysian economy find that
export oriented FDI brought significant returns to Malaysia due to its favourable economic climate
for internationalisation of production. Fry et al (1995) observe that if a country has a liberal foreign
exchange rate regime more FDI is likely to be independent of the current account and other capital
flows. Similarly, a study by Mucchielli and Soubaya (2000) on the determinants of the volume of
trade of the French multinational corporations shows that inward FDI has a positive influence on
foreign trade (including exports and imports), and this positive impact is stronger for exports as
compared to imports.
Most of the literature on the relationship between FDI and the different components of the current
account is time series and does not cover African economies. Strauss (2015) highlights that net
income payments made to foreign investors accounted for about 37 percent of South Africa’s
current account deficit over the period 2004-2013. In addition, the study also finds that net
investment income in South Africa has overtaken the trade balance in driving current account
deficits. These findings however cannot be generalised for other African countries. Hence, there
is need for a study to determine the impact of FDI on exports, imports and profit repatriations in
Africa as a whole. This is very important because the current account deficit is an issue of great
concern to policymakers in Africa.
4.4 Empirical Methodology
We use panel cointegration analysis in this study. Firstly, we test for a panel unit root. We employ
three statistics proposed by Levine et al (2002), Im et al. (2003), and Breitung (2000). Secondly,
we test for cointegration using the heterogeneous panel cointegration test developed by Pedroni
(1999). This test allows different individual effects’ cross-sectional interdependency. We also use
the Kao panel co-integration test, which was developed by Kao (1999). We then estimate the long
run relationship using both the dynamic ordinary least square (DOLS) and the fully modified
ordinary least square (FMOLS) techniques for heterogeneous cointegrated panels (Pedroni, 2000).
We establish a panel error correction model to examine short run and long run causalities between
FDI, exports, imports and profit outflows. We also test the long relationship between FDI, exports,
Page 99
87
imports and profit outflows using the autoregressive distributed lag (ARDL) for robustness checks.
The bounds test for cointegration involves the comparison of the F-statistics against the critical
values which are extracted from Pesaran and Pesaran (1997).
Panel cointegration tests enable us to determine the long-run structure of FDI, exports, imports
and profit outflows in a dynamic setting. This helps to avoid some of the problems that are
associated with using static cointegration tests. They also help to mitigate the problems relating to
the sensitivity of cointegration tests to low-powered stationarity tests often associated with time
series analysis (Eregha, 2012). Apergis et al, (2006) highlight that the use of these innovative panel
data techniques allows for heterogeneity in coefficients and dynamics across countries, and also
allows a researcher to test directly for the existence of long-run equilibrium relations among the
variables. The basic model to be estimated can be specified as follows:
𝑙𝑜𝑔𝐹𝐷𝐼𝑖𝑡 = 𝛼 + 𝛽1𝑙𝑜𝑔𝐸𝑥𝑝𝑜𝑟𝑡𝑠𝑖𝑡 + 𝛽2𝑙𝑜𝑔𝐼𝑚𝑝𝑜𝑟𝑡𝑠𝑖𝑡 + 𝛽3𝑙𝑜𝑔𝑃𝑟𝑜𝑓𝑖𝑡𝑖𝑡 + 휀𝑖𝑡 (4.1)
where (α) denotes the intercept term, 𝛽1, 𝛽2, 𝑎𝑛𝑑 𝛽3 are the coefficients to be estimated. And (휀𝑖𝑡)
is the error term, and the subscripts (t) are for the dating of variables in time periods. To conduct
the cointegration test the following model is estimated:
𝑋𝑖𝑡 = 𝛼0 + ∑ 𝛽𝑖𝑌𝑖𝑡−𝑗ρ𝑗=1 + 휀𝑖𝑡 (4.2)
where 𝑋𝑖𝑡 = (FDI, Exports, Imports, Profit) is a 4 X 1 vector of the variables. 𝛼0 is a 4 X 1 vector
of the constants, ρ is the number of lags, 𝛽𝑖 is a 3 X 3 matrix of parameters to be estimated and 휀𝑖𝑡
is a 3 X 1 vector of independent and identically distributed innovations. If the variables are
cointegrated, we estimate the following Vector Error Correction Model (VECM):
∆𝑋𝑖𝑡 = 𝛼0 + ∑ Γ𝑗ρ−1𝑗=1 ∆𝑋𝑖𝑡−𝑗 + Π𝑋𝑖𝑡−1 + 휀𝑖𝑡 (4.3)
where 𝚪𝒋 = ∑ 𝜶𝒊𝛒𝒊=𝒋+𝟏 and Π = ∑ 𝛼𝑗 − 𝐼ρ
𝑗=1 . ∆ is the difference operator and 𝐼 is an n X n identity
matrix.
Page 100
88
4.4.1 Data Description
We use annual data for the period 1980-2012 for 47 African economies chosen according to
availability of data. The data on FDI, exports, imports and profit remittances is derived from World
Development Indicators (WDI) database. Logarithms of the variables are used so that the estimated
coefficients can be interpreted as percentages or elasticities (Narayan and Narayan, 2004). The
variables, variable symbols and source of data are presented in Table 4.3.
Table 4.3: Variables used in the econometric analysis.
Variables Symbols Variables Source
FDI Foreign Direct Investment inflows (% of GDP) UNCTAD
Exports Exports of goods and services (% of GDP) World Bank
Imports Imports of goods and services (% of GDP) World Bank
Profit Profit remittances (% of GDP) World Bank
The list of the 47 countries included in the analysis is shown in Table 4.4.
Table 4.4: List of Countries.
Algeria Congo Liberia Seychelles
Angola Djibouti Madagascar Sierra Leone
Benin DRC Malawi South Africa
Botswana Egypt Mali Sudan
Burkina Faso Ethiopia Mauritania Swaziland
Burundi Gabon Mauritius Tanzania
Cameroon Gambia Morocco Togo
Cape Verde Ghana Mozambique Tunisia
Central Africa Republic Guinea Niger Uganda
Chad Guinea-Bissau Nigeria Zambia
Cote d'Ivore Kenya Rwanda Zimbabwe
Comoros Lesotho Senegal
Page 101
89
4.5 Estimation and Results
4.5.1 Panel Unit Root Test
Panel data methodology uses both time and cross sectional data. It is therefore important that the
variables be stationary in order to avoid possible spurious relationships among the variables
(Bayar, 2014). We therefore investigate common unit root processes with panel unit root tests by
Breitung (2000), Levin et al. (2002) and the individual unit root process by Im et al. (2003). The
results of the stationarity tests are presented Table 4.5 in both levels and in first differences. FDI
and exports are stationary at levels while imports and profit have a unit root. However, after first
differencing all the variables become integrated of order 1.
Granger (1981) shows that when the series becomes stationary only after being differenced once
(integrated of order one), they might have linear combinations that are stationary without
differencing. In the literature, such series are called ‘cointegrated’. Since all the variables are
integrated of order one, then the next step is to apply panel cointegration test to determine whether
a long run relationship exists (Mahadevan and Asafu-Adjaye, 2006).
Page 102
90
Table 4.5: Panel Unit Root Test Results.
Variable Panel Specifications Unit Root Tests Levels First Differences
FDI Individual Effects LLC -16.36*** -34.37***
IPS -10.14*** -41.18***
Individual Effects and Trends LLC -12.78*** -26.33***
IPS -15.52*** -37.08***
Breitung -7.61*** -24.20***
Exports Individual Effects LLC -1.98** -34.00***
IPS -1.85** -33.80***
Individual Effects and Trends LLC -4.63*** -30.29***
IPS -4.55*** -31.12***
Breitung -4.06*** -22.07***
Imports Individual Effects LLC -5.07*** -34.50***
IPS -4.64*** -34.65***
Individual Effects and Trends LLC -4.92*** -31.81***
IPS -4.13*** -33.71***
Breitung -0.49 -23.08***
Profit Individual Effects LLC -1.31 -29.18***
IPS -0.36 -35.79***
Individual Effects and Trends LLC -3.27*** -25.28***
IPS -8.07*** -33.10***
Breitung -2.34*** -4.71***
Selection of lags based on Modified Akaike Information Criterion; Newey-West bandwidth selection using Bartlett kernel; Probabilities for Fisher
tests are computed using an asymptotic Chi-square distribution. All other tests assume asymptotic normality; H0: Unit root (assumes individual unit root process). * Significant at 10% level. ** Significant at 5% level. *** Significant at 1% level.
4.5.2 Panel Cointegration Analysis
The selection of the correct lag length is very crucial in carrying out any further tests as this has
implications for cointegration, VECM and Granger causality tests. We use the VAR lag order
selection criteria to obtain the ideal lag for the model used in our study. According to the lag length
selection criteria, the optimal lag length which minimises both the Akaike information criterion
(AIC) and the Schwarz Bayesian Criterion (SBC) is 1.
We use the Pedroni (1999) and Kao (1999) cointegration tests to determine whether there is a long
run relationship between FDI, exports, imports and profit outflows. The Pedroni (1999) approach
is robust to potential endogeneity problems and allows for both heterogeneous cointegrating
Page 103
91
vectors and short run dynamics across countries. The first of the panel cointegration statistics is a
non-parametric variance ration test. The second and the third are panel versions of the Phillips and
Perron (PP) rho and t-statistic, respectively. The fourth statistic is a panel ADF statistic similar to
the Levin et al. (2002) panel unit root test. The first two of the group mean panel cointegration
statistics are panel versions of the Phillips and Perron rho and t-statistic respectively. The third is
a group mean ADF test similar to the Im et al (2003) panel unit root test.
The panel cointegration statistics and the group mean panel cointegration statistics test the null
hypothesis H0: ‘all the individual variables are not cointegrated.’ For the panel statistics, the
alternative hypothesis is H1: ‘all of the individual variables are cointegrated,’ while for the group
mean panel statistics, the alternative is H1: ‘a significant portion of the panel members are
cointegrated’ (Pedroni, 2004). The results of the panel cointegration tests are presented in Table
4.6(a) and Table 4.6(b). Seven co-integration tests are presented to cover ‘within’ and ‘between’
effects in the panel and these tests were separated as two different categories (Asteriou and Hall,
2007). The first category includes 4 tests which are pooled at ‘within’ dimension. The second
category includes the remaining 3 tests pooled at ‘between’ dimension. We conducted three
models of the Pedroni cointegration tests namely: no deterministic trend; deterministic intercept
and trend; and no deterministic intercept and trend. We also applied the Kao test. The results from
both the Pedroni and Kao cointegration tests show that there is a long run equilibrium relationship
among the variables (FDI, exports, imports and profit outflows) except under the panel v-Statistic
(Weighted t-Statistic). This suggests that there is cointegration and hence we reject the null
hypothesis of ‘no cointegration.’
Page 104
92
Table 4.6(a): Results of Panel Cointegration Tests.
Pedroni Panel Cointegration Test (No Deterministic Trend)
(Within-Dimension)
t-Statistic Prob. Weighted t-Statistic Prob.
Panel v-Statistic 2.58 0.00 -2.39 0.99
Panel rho-Statistic -6.90 0.00 -7.30 0.00
Panel PP-Statistic -14.08 0.00 -14.36 0.00
Panel ADF-Statistic -10.73 0.00 -13.78 0.00
(Between-Dimension)
t-Statistic Prob.
Group rho-Statistic -5.44 0.00
Group PP-Statistic -16.49 0.00
Group ADF-Statistic -15.53 0.00
Pedroni Panel Cointegration Test (Deterministic Intercept and Trend)
(Within-Dimension)
t-Statistic Prob. Weighted t-Statistic Prob.
Panel v-Statistic 0.14 0.44 -5.86 1.00
Panel rho-Statistic -6.13 0.00 -5.22 0.00
Panel PP-Statistic -19.72 0.00 -17.25 0.00
Panel ADF-Statistic -17.24 0.00 -16.06 0.00
(Between-Dimension)
t-Statistic Prob.
Group rho-Statistic -3.37 0.00
Group PP-Statistic -19.98 0.00
Group ADF-Statistic -16.80 0.00
* Significant at 10% level. ** Significant at 5% level. *** Significant at 1% level.
Page 105
93
Table 4.6(b): Results of Panel Cointegration Tests.
Pedroni Panel Cointegration Test (No Deterministic Intercept or Trend)
(Within-Dimension)
t-Statistic Prob. Weighted t-Statistic Prob.
Panel v-Statistic 3.02 0.00 -1.31 0.90
Panel rho-Statistic -6.52 0.00 -6.32 0.00
Panel PP-Statistic -10.55 0.00 -10.59 0.00
Panel ADF-Statistic -8.75 0.00 -9.97 0.00
(Between-Dimension)
t-Statistic Prob.
Group rho-Statistic -6.03 0.00
Group PP-Statistic -14.85 0.00
Group ADF-Statistic -13.35 0.00
Kao Panel Cointegration Test
t-Statistic Prob.
ADF -3.50 0.00***
Residual Variance 3.13
HAC Variance 0.89
* Significant at 10% level. ** Significant at 5% level. *** Significant at 1% level.
To confirm our results, the Johansen trace test for cointegration is regressed to find out whether
there is a long run association amongst the variables of the study. Table 4.7 shows results from the
Johansen Trace test for cointegration and they confirm the presence of cointegration for the
variables used in this study. This implies that there is a long run relationship amongst the variables.
Accordingly, the variables involved in the regression equation will move together (Engle and
Granger, 1987).
Page 106
94
Table 4.7: Johansen Test Result for Cointegration.
Hypothesised Trace Statistic Prob. Max-Eigen Statistic Prob.
No of CE(s)
None 483.9*** 0.00 368.7*** 0.00
At most 1 212.8*** 0.00 176*** 0.00
At most 2 107.7 0.16 99.99 0.32
At most 3 100.5 0.30 100.5 0.30
* Significant at 10% level. ** Significant at 5% level. *** Significant at 1% level.
4.5.3 Estimating the long run relationship
Having established that there is a long run relationship between FDI, exports, imports and profit
outflows, the next step in our analysis is to estimate the long run coefficients (𝛽). To achieve this
objective we use the fully modified ordinary least squares (FMOLS) method developed by Pedroni
(2000) and the dynamic ordinary least squares (DOLS) method developed by Kao and Chiang
(2000). The DOLS method uses the parametric approach which adjusts for autocorrelation by
including the lagged first differences into the model while the FMOLS method adopts a
nonparametric approach dealing with autocorrelation and yields biased results in small estimators
(Breitung, 2005). The DOLS method allows for greater flexibility in the presence of heterogeneous
cointegrating vectors whereas under the FMOLS the cointegrating vectors are constrained to be
the same for each country. We used both FMOLS and DOLS methods in estimation of final
unbiased coefficients of the cointegration relationship (Bayar, 2014).
The results of DOLS and FMOLS estimation methods are presented in Table 4.8. The results show
that an increase in FDI inflows results in an increase in both imports and profit outflows and in a
decrease in exports. According to the DOLS there is a negative relationship between FDI and
exports. A one percent increase in FDI reduces exports by 1.11 percent. There is however a positive
relationship between FDI and both imports and profits. An increase in FDI is associated with an
increase in both imports and profit outflows of 2.32 percent and 0.35 percent respectively.
Results from the FMOLS show that the relationship between FDI and exports is not significant.
However, there is a positive and significant relationship between FDI and both imports and profit.
Page 107
95
This means an increase in FDI results in an increase in both imports and profit outflows. In
particular, as presented in Table 4.8, an increase in FDI of one percent is associated with an
increase in imports by 1.10 percent and a rise in profits outflows of 0.35 percent.
Table 4.8: Estimation Results of DOLS and FMOLS.
DOLS FMOLS
Coefficient t-Statistics Coefficient t-statistic
Panel Exports -1.11** -2.13 0.22 0.93
Imports 2.32*** 4.18 1.10*** 3.90
Profit 0.35*** 3.53 0.35*** 7.59
* Significant at 10% level. ** Significant at 5% level. *** Significant at 1% level.
We also test the long relationship among FDI, exports, imports and profit using the ARDL
approach to check the robustness of our cointegration test results. The bounds test for cointegration
involves the comparison of the F-statistics against the critical values which are extracted from
Pesaran and Pesaran (1997). The calculated F-statistic is presented in Table 4.9. The calculated F-
statistic when FDI is the dependent variable is = 32.58 which is higher than the upper bound critical
value of 3.63 at the 5 percent level of significance (see Table 4.10). This means that we can reject
the null hypothesis of no cointegration confirming that indeed there is a long run association among
the variables.
Table 4.9: Wald Test.
Test Statistic Value d.f. Probability
F-Statistic 32.58 -41,397 0.00
Chi-Square 130.32 4 0.00
Table 4.10: Critical Value Bounds of the F-statistic.
Critical Value Bounds of the F-statistic
90% 95% 97% 99%
k I(0) I(1) I(0) I(1) I(0) I(1) I(0) I(1)
3 2.01 3.1 2.45 3.63 2.87 4.16 3.42 4.84
Source: The critical value bounds are from Pesaran et al (1999). Note: k is the number of regressors.
The main advantage for using the bounds test approach is that it is applicable irrespective of
whether the underlying regressors are purely I (0), purely I (1), or mutually cointegrated. Thus,
Page 108
96
because the bounds test does not depend on pretesting the order of integration of the variables, it
eliminates the uncertainty associated with pretesting the order of integration (Narayan and
Narayan, 2004). Table 4.11 shows the long run coefficients (𝛽) from the ARDL test. The results
show that FDI inflows are associated with a decrease in exports and in an increase both imports
and profit outflows. This confirms the results from DOLS and FMOLS reported in Table 4.8.
Table 4.11: ARDL Test Results.
Variable Coefficient Std. Error t-Statistic Prob.
C -17.83*** 1.88 -9.46 0.00
Exports -0.84*** 0.40 -2.08 0.04
Imports 5.07*** 0.48 10.55 0.00
Profit 0.31*** 0.08 3.74 0.00
R-squared 0.60
Adj. R-squared 0.60
F-statistic 57.12
Prob. (F-statistic) 0.00
Durbin-Watson Sta. 0.93
* Significant at 10% level. ** Significant at 5% level. *** Significant at 1% level.
4.5.4 Testing for long run causality
The fact that there is a long run relationship among the variables implies that there is at least a
unidirectional causality among the variables. Therefore, we test long-run causality among the
variables by searching the significance of test statistics of error correction coefficient. Table 4.12
shows the results from the long run panel causality analysis. The results confirm that there is uni-
directional running from FDI to exports, imports and profit remittances. The error correction term
(ECT) is statistically significant at the 1 percent level of significance suggesting a moderate speed
of convergence to equilibrium.
Page 109
97
Table 4.12: Results of Long Run Panel Causality Analysis.
∆FDI f(∆Exports, ∆ Imports, ∆Profit)
ECT -0.34
t-statistics 15.56***
∆Exports f (∆FDI, ∆Imports, ∆Profit)
ECT 0.01
t-statistics 3.49
∆Imports f(∆FDI, ∆Exports, ∆Profit)
ECT 0.01
t-statistics 2.59
∆Profit f(∆FDI, ∆Exports, ∆ Imports)
ECT 0.03
t-statistics 2.18
* Significant at 10% level. ** Significant at 5% level. *** Significant at 1% level.
The results from the short run causality analysis though not reported show that there is no short
run causality among the variables.
4.5.5 Impulse Response
The impulse response function traces out the responsiveness of the dependent variables to shocks
to each of the other variables (Pesaran and Shin, 1998). Impulse response functions are an
additional check of the findings from our panel cointegration tests. They show how an anticipated
change in one variable affects the other variables over time. The results of the impulse response
functions are presented in Tables 4.13-4.16. Ten years horizon is employed in order to allow the
dynamic of the system to work out. We use all the 47 African economies as one regional bloc. A
shock to FDI has a positive effect on imports and profit. The effect on exports is only significant
in a few periods as shown in Table 4.13. As presented in Table 4.13 in response to a one standard
deviation disturbance in current FDI future FDI increases by 147 percent in the first period, 46
percent in the fifth period and down to 26 percent in the 10th period. A one standard deviation
originating from FDI results in a 13 percent increase in exports and a 10 percent increase in imports
and a 4 percent increase in profit repatriations in the 2nd period. The increase in exports however
becomes insignificant in subsequent periods. This confirms the results from the FMOLS presented
Page 110
98
in Table 4.8. The increase in imports continually increases reaching 19 percent in the 10th period.
This probably explains the problem of persistent current account deficits in Africa.
As shown in Table 4.14 a one standard deviation disturbance originating from exports results in
an increase in FDI by only 1 percent in the first period with exports in the first period increasing
by 19 percent with however no corresponding increase in both imports and profit. Over time
however, the changes in both imports and profit become negative though not very significant.
Table 4.15 shows that the impact of profit is not very significant. The impact of imports on FDI
rises by 2 percent in the 1st period to 5 percent in the 10th period and exports rises by 7 percent in
the 1st period before declining slightly to 6 percent in the 10th period. A one standard deviation
originating from imports results in imports rising by 16 percent in the first period and before
declining to 12 percent in the 10th period. As shown in Table 4.16 the impact of profit on FDI
increases by 4 percent in the 1st period and rises to 12 percent in the 10th period. While on the other
hand a one standard deviation disturbance originating from profit causes profit to increase by 83
percent in the first period. The increase though still very large declines to 55 percent in the 10th
period.
Table 4.13: Response of FDI.
Period FDI Exports Imports Profit
1 1.47** 0.00*** 0.00*** 0.00***
2 0.67** 0.13** 0.10** 0.04**
3 0.46** 0.11 0.19** 0.00**
4 0.57** 0.09 0.13 0.04**
5 0.46** 0.12 0.15 0.05**
6 0.38** 0.13 0.17 0.05**
7 0.35** 0.19* 0.17 0.06**
8 0.32** 0.14 0.17** 0.06**
9 0.28** 0.14* 0.18** 0.07**
10 0.26** 0.14* 0.19** 0.07**
* Significant at 10% level. ** Significant at 5% level. *** Significant at 1% level.
Page 111
99
Table 4.14: Response of Exports.
Period FDI Exports Imports Profit
1 0.01*** 0.19*** 0.00*** 0.00***
2 0.02** 0.16*** -0.01*** -0.0004***
3 0.02*** 0.14*** 0.01*** -0.00005**
4 0.03*** 0.14*** 0.00*** -0.002**
5 0.03*** 0.15*** -0.003*** -0.003***
6 0.04*** 0.14*** -0.002*** -0.003***
7 0.04*** 0.14*** -0.002*** -0.003***
8 0.04*** 0.14*** -0.003*** -0.004***
9 0.05*** 0.14*** -0.004*** -0.004**
10 0.05** 0.14*** -0.004*** -0.004***
* Significant at 10% level. ** Significant at 5% level. *** Significant at 1% level.
Table 4.15: Response of Imports.
Period FDI Exports Imports Profit
1 0.02*** 0.07*** 0.16*** 0.00***
2 0.02*** 0.07*** 0.12*** -0.003***
3 0.02*** 0.06*** 0.12*** -0.006***
4 0.03*** 0.06*** 0.12*** -0.005***
5 0.04*** 0.06*** 0.12*** -0.005***
6 0.04*** 0.06*** 0.12*** -0.006***
7 0.04*** 0.06*** 0.12*** -0.006***
8 0.05*** 0.06*** 0.12*** -0.007***
9 0.05*** 0.06*** 0.12*** -0.007***
10 0.05*** 0.06*** 0.12*** -0.007***
* Significant at 10% level. ** Significant at 5% level. *** Significant at 1% level.
Page 112
100
Table 4.16: Response of Profit.
Period FDI Exports Imports Profit
1 0.04** 0.02** -0.02** 0.83**
2 0.04** 0.05** -0.002** 0.56**
3 0.06** 0.05** -0.02** 0.53**
4 0.08** 0.03 -0.02** 0.57**
5 0.09** 0.03 -0.02** 0.56**
6 0.10** 0.03** -0.02** 0.55**
7 0.11** 0.03** -0.02** 0.57**
8 0.11** 0.03** -0.02** 0.56**
9 0.12** 0.03** -0.03** 0.55**
10 0.12** 0.03** -0.03** 0.55**
* Significant at 10% level. ** Significant at 5% level. *** Significant at 1% level.
4.5.6 Variance Decomposition
Variance decomposition is regressed to measure the contribution of each type of shocks to the
forecast error variance (Campbell, 1991). With respect of FDI inflows, the result obtained are
shown in Table 4.17. Table 4.17 shows that 100 percent of FDI inflows variance is accounted for
by current FDI in the first period, and the percentages are still significant over the forecasted 10
year period. Profit has the least contribution and show a slight gradual increase in its contribution
compared to imports. Export variance increased from 0.59 percent in the second period reaching
4.59 percent in the tenth year. Profit variance increased from 0.18 percent in the second period to
1.73 in the tenth period.
In Table 4.18, 99.52 percent of the exports variance is accounted for by exports in the first period
with FDI contributing only 0.48 percent. This implies that the shock to exports is largely related
to its own shock in the first period. The shocks from FDI however increase from 0.48 percent in
the first period to 4.48 percent in the tenth period. As shown in Table 4.19, 80.25 percent of imports
variance can be explained by the current imports in the first period and the percentage remains
significant at the end of the tenth period reaching 74.91 percent. At the end of the 10 years period
exports contribute 20.82 percent and profits a negligible 0.01. According to Table 4.20 the forecast
error variance of profits is significantly linked to its own shock. The contribution of FDI increases
Page 113
101
from 0.31 in the first period to 2.28 in the tenth period. Exports’ contribution rises from 0.02 in
the first period to 0.17 in the tenth period while imports’ contribution declines from 0.06 in the
first period to 0.04 in the tenth period.
Table 4.17: Variance Decomposition of FDI.
Period SE FDI Exports Imports Profit
1 1.50 100.00 0.00 0.00 0.00
2 1.67 99.00 0.59 0.22 0.18
3 1.80 98.39 0.89 0.47 0.28
4 1.87 97.40 1.34 0.81 0.45
5 1.91 96.30 1.83 1.23 0.63
6 1.95 95.08 2.36 1.72 0.84
7 1.98 93.80 2.91 2.24 1.06
8 2.00 92.47 3.47 2.78 1.28
9 2.03 91.12 4.03 3.34 1.51
10 2.05 89.78 4.59 3.90 1.73
Table 4.18: Variance Decomposition of Exports.
Period SE FDI Exports Imports Profit
1 0.19 0.48 99.52 0.00 0.00
2 0.26 1.17 98.63 0.20 0.00
3 0.31 1.75 98.02 0.23 0.00
4 0.35 2.31 97.42 0.27 0.01
5 0.40 2.80 96.90 0.29 0.01
6 0.43 3.24 96.44 0.32 0.01
7 0.46 3.62 96.04 0.34 0.01
8 0.49 3.95 95.69 0.35 0.01
9 0.52 4.23 95.39 0.37 0.01
10 0.55 4.48 95.13 0.38 0.01
Page 114
102
Table 4.19: Variance Decomposition of Imports
Period SE FDI Exports Imports Profit
1 0.18 0.87 18.88 80.25 0.00
2 0.23 1.42 20.49 78.08 0.00
3 0.27 1.94 20.71 77.34 0.00
4 0.31 2.42 20.84 76.74 0.00
5 0.35 2.84 20.87 76.28 0.01
6 0.38 3.21 20.88 75.90 0.01
7 0.41 3.53 20.87 75.59 0.01
8 0.43 3.80 20.86 75.33 0.01
9 0.46 4.04 20.84 75.10 0.01
10 0.48 4.25 20.82 74.91 0.01
Table 4.20: Variance Decomposition of Profit
Period SE FDI Exports Imports Profit
1 0.83 0.31 0.02 0.06 99.61
2 1.03 0.46 0.18 0.04 99.33
3 1.22 0.78 0.17 0.04 99.01
4 1.38 1.06 0.18 0.04 98.73
5 1.53 1.33 0.18 0.04 98.46
6 1.67 1.57 0.17 0.04 98.22
7 1.79 1.78 0.17 0.04 98.01
8 1.91 1.97 0.17 0.04 97.82
9 2.02 2.13 0.17 0.04 97.66
10 2.12 2.28 0.17 0.04 97.51
4.6 Conclusion and Policy Recommendations
This chapter investigates the long run dynamic relationship between FDI inflows, exports, imports
and profit outflows for a panel of 47 selected African countries by means of panel cointegration
techniques. We use both the vector error correction model (VECM) and the ARDL model. This
chapter fills a gap in the literature by providing empirical evidence on the long run dynamic
relationship between FDI, exports, imports and profit repatriations in Africa. Given that we include
47 countries over the period 1980-2012 our sample includes more countries over a longer time
Page 115
103
period than the samples used in previous studies in this area. Moreover, by including lagged
explanatory variables panel procedures we control for potential endogeneity problems.
The results from the cointegration tests show that a long run relationship exists between our
variables. Our findings provide evidence that FDI has a negative effect on the current account. In
particular, an increase in FDI inflows is associated with an increase in both imports and profit
remittances while an increase in FDI results in a decrease in exports. Our results are in line with
the findings from: Lehman (2002); Seabra and Flach (2005); Yalta (2012); Hossain (2007). The
findings confirm that profit outflows by multinational companies are one of the major factors
driving current account deficits in African countries. Our findings have several policy
implications. Firstly, African governments should diversify their economies away from the
traditional agricultural and extractives sector to manufacturing. This may entail providing
incentives for investors (both local and foreign) in the agricultural and extractives sectors to move
up the value chain. Habiyaremye and Ziesemer (2006) find that FDI has not significantly enhanced
growth in SSA because most of the investment has been concentrated in the primary sector. African
governments should therefore provide incentives for FDI into diversified and higher value-added
activities.
African governments need to improve their host country factors and overall policy environment in
order to enhance the absorptive capacity and to maximise the possible spillovers from FDI. This
involves scaling up investment in human capital, infrastructure and strengthening institutions. It
has been shown that spillovers from FDI can be fully maximised when the FDI improves the
capacity of local businesses and citizens (Carkovic and Levine, 2005; De Mello, 1999; Ndikumana
and Verick, 2008). Moreover, as noted by Ali and Walters (2011), a poor local investment
environment alters the relative risk and returns profile of locally held assets in a way that generates
incentives for capital flight. This implies that African governments need to implement policies that
promote domestic investment and also to adopt a targeted approach to attracting FDI inflows.
Keshava (2008) has shown that the effectiveness of FDI is enhanced when the host economy has
a strong local investment environment. In particular, incentives should be provided to foreign
investment with greater scope and potential for linkages with domestic investment.
Page 116
104
CHAPTER 5: CONCLUSION AND POLICY IMPLICATIONS
5.1 Key Issues
The thesis focuses on the impact of FDI on economic performance in selected African countries
over the period 1980-2012. Firstly, we examine the link between FDI and domestic investment
and the role of host country factors such as financial development, institutional development and
trade openness. We use the dynamic ordinary least squares, random effects, fixed effects and the
system GMM methodologies on a panel of 48 African countries for the period 1980 to 2012.
Secondly, we investigate the impact of FDI on total factor productivity (TFP) and the role of
relative backwardness (the technology gap) on a panel of 45 African countries over the period
1980-2012. We use two measures of relative backwardness namely: the distance from
technological frontier and the income gap. We apply the fixed effects, random effects and the
system GMM method to account for the issues of endogeneity. Thirdly, we analyse the long run
dynamic relationship between FDI, exports, imports and profit outflows in 47 African countries
over the period 1980-2012 by means of panel cointegration techniques.
Overall, the analysis in Chapter 2 shows that there is a negative relationship between FDI and
domestic investment. While the negative correlation may suggest that FDI has a crowding-out
effect it could also equally imply that countries with lower private investment attract FDI because
there are more domestically unsatisfied opportunities for foreign investors (e.g. because of
resource endowments requiring foreign expertise). More importantly this negative relationship
between FDI and domestic investment does not necessarily imply that FDI has no positive effects
on growth or that FDI is not needed. It may as well be that the positive benefits from FDI in African
economies may be as a result of an increase in total factor productivity (TFP) which more than
compensates for the decline in domestic investment (Ndikumana and Verick, 2008).
Moreover, FDI’s growth-enhancing impact can only be realised when it stimulates the absorptive
capacity of the host country (Carkovic and Levine, 2002; Makki and Somwaru, 2004). The study
also finds that improved institutions do mitigate the negative effects of FDI while financial market
development exacerbates the negative effects of FDI on private domestic investment. This implies
Page 117
105
that there is a need to develop policies to strengthen institutions. The review of the literature also
suggests that African countries will benefit from measures aimed at promoting private domestic
investment.
Our results in Chapter 3 show a general positive but insignificant effect of FDI on productivity
growth in African countries under the sample. This suggests that FDI has a limited effect on
productivity in African countries. The chapter supports previous studies that have questioned the
widespread enthusiasm associated with FDI (e.g. Carkovic and Levine, 2005; Aitken and Harrison,
1999). The failure by many African countries to fully adopt foreign technologies may be because
of the limited absorptive capacity. Blomstorm and Kokko (2003) observe that spillovers from FDI
are not automatic and that they depend on local conditions. In particular, Borensztein et. al. (1998)
and Xu (2000) show that FDI is more productive than domestic investment only when the host
economy has sufficient human capital development.
The analyses in Chapter 4 on the impact of FDI on exports, imports and profit outflows in 47
African countries over the period 1980-2012 show that a long run relationship exists between the
variables. Our findings provide evidence on the adverse long run effects of FDI on the current
account in African economies. In particular, the results show that, FDI inflows lead to a decrease
in exports and an increase in both imports and profit remittances. These findings confirm that
indeed profit outflows by multinational companies are one of the main factors driving current
account deficits in African countries.
5.2 Policy Recommendations
The results do confirm that FDI’s growth-enhancing impact can only be realised when it stimulates
the absorptive capacity of the host country (Carkovic and Levine, 2002; Makki and Somwaru,
2004). African countries should therefore develop policies to improve local conditions, strengthen
institutional quality and enhance trade openness. African governments should focus more on
improving the education and skills level of the labor force through human capital investments.
Nelson and Phelps (1966) argue that human capital investments play a major role in growth via
two channels namely: increasing a country’s ability to undertake innovation and through
Page 118
106
enhancing the absorption and adoption of technology. Hence, as argued by (Ashraf et al, 2014),
finite domestic government resources could probably be better utilised in human capital
investments as opposed to offering tax and other non-tax incentives to multinational companies.
Empirical evidence shows that institutions help in the diffusion of technology and countries with
better institutions tend to experience better technology diffusion and that those countries lacking
basic institutions experience difficulties in absorbing foreign technology (Manca, 2009). African
governments should strengthen their institutions so as to improve their absorptive capacity and
thereby close the technology gap.
Policy efforts aimed at attracting FDI should be balanced with the imperative of strengthening
domestic firms, entrepreneurship and local innovation. Keshava (2008) has demonstrated that even
in those countries where FDI has been more productive and beneficial, domestic investment is
more effective than FDI in promoting growth. Investment incentives should not discriminate
against domestic investment. Policymakers should therefore implement policies that strengthen
the linkages between FDI and the local industry. Importantly, the objectives of multinational
corporations need to be synchronised with the development imperatives and goals of African
countries. Regional integration in the region needs to be expedited in line with the
recommendations from UNCTAD (2005), which notes that African countries need to think
regionally. Market and competition regulations to dismantle the monopolistic tendencies of some
foreign investors should be strengthened in many African countries.
The continent should also adopt a targeted approach to FDI. As Alfaro and Charlton (2007) argue,
some types of FDI may be more beneficial and productive than others. Agosin and Mayer (2000)
note that the reason why FDI has been more productive in Asia than in other developing countries
is because of the cautious and targeted approach. In addition, Adams (2009) observes that this
approach should involve careful screening of investment projects and granting differential
incentives to investments in different sectors. While FDI inflows in African countries have mainly
been concentrated in the extractive sector, in most Asian countries FDI has largely been focused
towards the secondary sector, thereby contributing to the diversification of the export base
(UNCTAD, 2007). African policy makers should therefore seriously consider the prioritisation of
FDI to sectors such as manufacturing so as to diversify growth and the export base.
Page 119
107
5.3 Suggested Areas for Further Research
Future research however needs to be undertaken to investigate the impact of the different forms of
FDI on domestic investment and productivity growth. FDI comes in two basic forms namely:
greenfield investments which involve the creation of new production processes and mergers and
acquisitions (M&As) which involve the purchase of assets of existing local companies. FDI can
also be classified according to its purpose namely: natural resource seeking, market seeking,
efficiency seeking and strategic asset seeking (Dunning, 1993). It is possible that these two forms
of investment have different effects on domestic investment. This therefore calls for empirical
analysis that investigates the different effects of the different forms of FDI on domestic investment
and productivity growth in African economies.
Page 120
108
6. References
Abizadeh, S., Pandey, M. and M.S. Tosun (2007). Impact of Trade on Productivity of skilled and
Unskilled Intensive Industries: A Cross-Country Investigation.” American Economic
Review 89: 379-399.
Acemoglu, D. (2009). Introduction to Modern Economic Growth. Princeton University Press, p.
77-80.
Adams, S. (2009). Foreign Direct Investment, Domestic Investment and Economic Growth in Sub-
Saharan Africa. Journal of Policy Modelling 31: 939-949.
Adeleke, A. I. (2014). FDI-Growth Nexus In Africa: Does Governance Matter? Journal of
Economic Development 39(1): 111-135.
Adhikary, B. (2011). FDI, Trade Openness, Capital Formation, and Economic Growth in
Bangladesh: A Linkage Analysis. International Journal of Business and Management 6(16-
28).
African Development Bank (AfDB), (2014). African Economic Outlook 2014, OECD Publishing,
Paris, http://dx.doi.org/10.1787/aeo-2014-en.
Agénor, P. R. (2004). The Economics of Adjustment and Growth (2nd edition). Cambridge, Ma.,
Harvard University Press.
Aghion, P. and P. Howitt (2009). The Economics of Growth, MIT Press.
Agosin, M. R. and R. Mayer (2000). Foreign Investment in Developing Countries: Does it Crowd
in Domestic Investment? United Nations Conference on Trade and Development.
Discussion Papers No. 146: 1-16.
Agosin, M.R. and R. Machado (2005). FDI in Developing Countries: Does it Crowd In Domestic
Investment? Oxford Development Studies, 33(2), pp.149-162.
Aitken, B. J. and A.E. Harrison (1999). Do Domestic Firms Benefit from Direct Foreign
Investment? Evidence from Venezuela. The American Economic Review 89: 605-618.
Alfaro, L. (2003). Foreign Direct Investment and Growth: Does the sector matter? Harvard
Business School.
Alfaro, L. and A. Charlton (2007). Growth and the Quality of FDI. Harvard Business School
Finance Working Paper No. 07-072. Harvard University.
Page 121
109
Alfaro, L., Chanda, A., Kalemli-Ozcan, S. and S. Sayek (2004). FDI and Economic Growth: the
Role of local Financial Markets. Journal of International Economics 64 89–112.
Alfaro, L., Kalemli-Ozcan, S. and S. Sayek (2009). FDI, Productivity and Financial
Development. The World Economy 32 (1): 111-135.
Ali, A. and B. Walters (2011). On the Causes of Capital Flight from Sub-Saharan Africa.
University of Manchester Working Papers.
Al-Sadig, A. (2013). Outward Foreign Direct Investment and Domestic Investment: The case of
Developing Countries. International Monetary Fund Working Paper WP/13/52. February.
Amendolagine, V., Boly A., Coniglio N. D., Prota F. and A. Seric (2013). (2013). FDI and Local
Linkages: Evidence from Selected African Countries (October 2013). World Development,
50, p. 41-56. DOI: 10.1016/j.worlddev.2013.05.001. Available at SSRN:
http://ssrn.com/abstract=2466870
Amighini, A.A., McMillan, M. and M. Sanfilippo (2015). FDI as a Catalyst for Domestic
Investment in Developing Countries: New Evidence from Firm-level Data, Working Paper.
Ang, J. B. (2009). Foreign Direct Investment and Its Impact on the Thai Economy: The Role of
Financial Development. Journal of Economics and Finance, 33(3), 316-323.
Apergis, N., Katrakilidis C. P., and N.M. Tabakis (2006). Dynamic Linkages between FDI Inflows
and Domestic Investment: A Panel Cointegration Approach. Atlantic Economic Journal
34(4): 385-394.
Arellano, M. and S. Bond (1991). Some tests of specification for panel data: Monte carlo evidence
and an application to employment equations. Review of Economic Studies 58, 277–297.
Arellano, M. and O. Bover (1995). Another Look at the Instrumental Variable Estimation of Error-
Components Models. Journal of Econometrics 68: pp. 29–52.
Alonso-Borrego, C. and M. Arellano. (1999). Symmetrically normalised instrumental-variable
estimation using panel data. Journal of Business and Economic Statistics 17(1): 36-49.
Ashraf, A. and D. Herzer (2014). The Effects of Greenfield Investment and M&As on Domestic
Investment in Developing Countries. Applied Economics Letters 21(14): 997–1000.
Ashraf, A., Herzer D., and P. Nunnenkamp (2014). The Effects of Greenfield and Cross-border
M&As on Total Factor Productivity. Kiel Working Papers No. 1941 July 2014.
Asiedu, E. (2002). On the Determinants of Foreign Direct Investment to Developing Countries: Is
Africa Different? World Development 30(1): 107-119.
Page 122
110
Asiedu, E. and D. Lien (2010). Democracy, Foreign Direct Investment and Natural Resources.
University of Kansas Working Paper.
Asteriou, D. and S.G. Hall (2007). Applied econometrics: A modern approach using Eviews and
Microfit. Revisited Edn., New York: Palgrave Macmillan.
Athukorala, P. and J. Menon (1996). Foreign investment and industrialisation in Malaysia:
Exports, employment and spillovers. Asian Economic Journal 10 (1): 29-44.
Ayal, E. and Karras, G. (1998). Components of Economic Freedom and Growth: An Empirical
Study. Journal of developing Areas 32(3): 327-338.
Aykut, D. and S. Sayek (2005). The Role of the Sectoral Composition of Foreign Direct
Investment on Growth. In Do Multinationals Feed Local Development and Growth? edited
by Lucia Piscitello and Grazia D. Santangelo, Elsevier.
Azman-Saini, W. N. W., Baharumshah, A. Z. and S.H. Law (2010). Foreign Direct Investment,
Economic Freedom and Economic Growth: International evidence. Economic Modelling,
27(5): 1079-1089.
Baharumshah, A. and M. Thanoon (2006). Foreign Capital Flows and Economic Growth in East
Asian countries. China Economic Review 17: 70-83.
Balasubramanyam, V., Salisu, M. and D. Sapsford (1999). Foreign Direct Investment and Growth
in EP and IS Countries. The Economic Journal 106(434): 92-105.
Baltabaev, B. (2014). FDI and Total Factor Productivity Growth: New Macro Evidence. World
Economy 37(2): 311–334.
Barro, R. and X. Sala-i-Martin (2004). Economic Growth. 2nd Edition McGraw-Hill, Cambridge,
MA.
Bayar, Y. (2014). Savings, Foreign Direct Investment Inflows and Economic Growth in Emerging
Asian Economies. Asian Economic and Financial Review Vol. 4 No. 8, pp. 1106-1122.
Bhinda, N. and M. Martin (2009). Private Capital Flows to Low Income Countries: Dealing with
Boom and Bust. Debt Relief International, London.
Bitzer, J. and H. Gorg (2009). Foreign Direct Investment, Competition and Industry Performance.
World Economy 32(2): 221-233.
Blalock, G. and P.J. Gertler (2009). How firm capabilities affect who benefits from foreign
technology. Journal of Development Economics 90(2): 192-199.
Page 123
111
Blomstrom, M. and A. Kokko. (2003). The Economics of Foreign Direct Investment Incentives.
NBER Working Paper 9489.
Blomstrom, M., Lipsey, R. E., and M. Zejan (1994). What explains developing country growth?
In W. J. Baumol (Ed.), Convergence of Productivity: Cross-National Studies and Historical
Evidence (9th ed.). New York: Oxford University Press, Incorporated
Blundell, R. and S. Bond (1998). Initial conditions and moment restrictions in dynamic panel data
models. Journal of Econometrics 87(1): 115-43.
Borensztein, E., De Gregorio, J. and J.W. Lee (1998). How does Foreign Direct Investment affect
Economic Growth? Journal of International Economics 45: 115-135.
Bosworth, B. and S. Collins (1999). Capital Flows to Developing Economies: Implications for
Saving and Investment. Brookings Papers on Economic Activity 1999(1): 143–180
(Washington: Brookings Institution).
Braunstein, E. and G. Epstein (2002). Bargaining Power and Foreign Direct Investment in China:
Can 1.3 billion Consumers Tame the Multinationals? Center for Economic Policy Analysis
Working Paper 2002/13, New York.
Breitung, J. (2000). The Local Power of Some Unit Root Tests for Panel Data. in: B. Baltagi (ed.),
Nonstationary Panels, Panel Cointegration, and Dynamic Panels, Advances in
Econometrics Vol. 15, JAI: Amsterdam, 161-178.
Breitung, J. (2005). Estimation and inference in dynamic factor models. University of Bonn,
mimeo.
Buckley, P. J., Cross A. R., Tan H., Xin L., and H. Voss (2008). Historic and emergent trends in
Chinese outward direct investment. Management International Review 48(6): 715–747.
Calvo, G. A., L. Leiderman, and C. M. Reinhart (1996). Inflows of capital to developing countries
in the 1990s. Journal of Economic Perspectives 10 (2): 123-139.
Campbell, J. Y. (1991). A variance decomposition for stock returns. National Bureau of Economic
Research
Cardoso, E. and R. Dornbusch (1989). Foreign Private Capital Flows. In H. Chenery and T.
Srinivasan (eds.), Handbook of Development Economics, Vol. II, Amsterdam, North
Holland
Page 124
112
Carkovic, M and R. Levine (2002). Does Foreign Direct Investment Accelerate Economic
Growth? In H. T. Moran, E. Graham and M. Blomstrom (eds.). Does FDI Promote
Development? Washington, DC: Institute for International Economics.
Caselli, F. (2005). Accounting for cross-country income differences. in Phillipe Aghion and
Steven N. Durlauf (eds.) Handbook of Economic Growth, Volume 1A, Elsevier:
679-741.
Castellani, D. and A. Zanfei (2003). Technology gaps, absorptive capacity and the impact of
inward investments on productivity of European firms. Economics of Innovation and New
Technology.
Cecchini, L. and C. Lai-Tong (2008). The Links between Openness and Productivity in
Mediterranean Countries. Applied Economics, Vo. 40 No.6, pp. 685-697.
Chowdhary, R., and V. Kushwaha (2013). Domestic Investment, Foreign Direct Investment and
Economic Growth in India since Economic Reforms. Journal of Transformative
Entrepreneurship 1(2): 74–82. http://dx.doi.org/10.14239/JTE.2013.01201
Chuang, Y.C. and C.M. Lin (1999). Foreign Direct Investment, R&D and Spillover Efficiency:
Evidence from Taiwan's Manufacturing Firms. Journal of Development Studies Vol. 35,
117-137.
Colen, L., Maertens M., and J.F.M. Swinnen, (2008). Foreign Direct Investment as an Engine for
Economic Growth and Human Development: A Review of the Arguments and Empirical
Evidence. Working Paper IAP VI/06.
Collier, P., and S. O’Connell (2008). Opportunities and Choices. In B. Ndulu, S. O’Connell, R.
Bates, P. Collier, and C. Soludo (eds), The Political Economy of Economic Growth in
Africa 1960–2000. Cambridge: Cambridge University Press 76–136.
Crespo, N. and M. Fontoura (2007). Determinant Factors of FDI Spillovers What Do We Really
Know? World Development, 35(3), pp. 410-425.
De Mello, J. (1999). Foreign direct investment- led growth: evidence from time series and panel
data. Oxford Economic Papers 51(1): 133-151.
Doraisami, A. G. G. (2007). Financial Crisis in Malaysia: Did FDI Flows Contribute to
Vulnerability? Journal of International Development 19: 949-962.
Dunning, J. (1993). Multinational Enterprises and the Global Economy. Wokingham, England and
Reading, Addison-Wesley.
Page 125
113
Durham, J. (2004). Absorptive Capacity and the Effects of Foreign Direct Investment and Equity
Foreign Portfolio Investment on Economic Growth. European Economic Review 48(2):
285-306.
Easterly, W. (1993). How much do distortions affect growth? Journal of Monetary Economics
32:2, pp. 187-212.
Easterly, W. and R. Levine. (2001). It’s Not Factor Accumulation: Stylised Facts and Growth
Models. World Bank Economic Review 2001.
Edwards, S. (2002). Debt relief and the current account: an analysis of the HIPC initiative.
Working Paper.
Edwards, S. (1998). Openness, Productivity and Growth: What do we really know? Economic
Journal 108: 383-398.
Elboiashi, H., Noorbakhsh F., Paloni A., and C. Azemar (2009). The casual relationships between
Foreign Direct Investment, Domestic Investment and Economic Growth in North African
non-oil producing countries: Empirical evidence from Cointegration Analysis. Advances
in Management, 2, 19–25.
Engle, R.F. and C.W.J. Granger (1987). Cointegration and Error Correction: Representation,
Estimation and Testing. Econometrica 55, No. 2: 251-76.
Eregha, P.B. (2012). The Dynamic Linkages between Foreign Direct Investment and Domestic
Investment in ECOWAS Countries: A Panel Cointegration Analysis. African Development
Review, African Development Bank, vol. 24(3), pages 208-220, 09.
Ernst & Young, (2013). Africa 2013: Getting Down to Business, Ernst & Young’s Attractiveness
Survey,
www.ey.com/Publication/vwLUAssets/The_Africa_Attractiveness_Survey_2013/$FILE/
Africa_Attractiveness_Survey_2013_AU1582.pdf.
Falvey, R., Foster, N. and D. Greenaway (2005). Relative Backwardness or Absorptive Capacity:
How Does Knowledge Spill Over Across Borders? GEP Research Paper 05/07, The
Leverhulme Centre for Globalisation and Economic Policy.
Farla, K., D. de Combruggher and B. Vertspagen (2014). Institutions, Foreign Direct Investment,
and Domestic Investment: Crowding Out or Crowding In? World Development.
Fedderke, J. and A. Romm (2006). Growth Impact and Determinants of Foreign Direct Investment
into South Africa 1956–2003. Economic Modelling 23(5): 738-760.
Page 126
114
Feldstein, M. (1995). The Effects of Outbound Foreign Direct Investment on the Domestic Capital
Stock, In: Feldstein, M., J.R. Hines Jr., and R.G. Hubbard (eds.). The Effects of Taxation
on Multinational Corporations. (Chicago: University of Chicago Press), pp. 43–63.
Findlay, R. (1978). Relative Backwardness, Direct Foreign Investment, and the Transfer of
Technology: A Simple Dynamic Model. The Quarterly Journal of Economics 92:1-16.
Fosu, A.K. (2001). Economic Fluctuations and Growth in Sub-Saharan Africa: The Importance of
Import Instability. Journal of Development Studies 37(3): 71-84.
Fosu, A.K., Getachewb Y.Y. and T. Ziesemer (2012). Optimal public investment, growth, and
consumption: Evidence from African countries. Centre for the Study of African Economies
Working Paper WPS/2011-22. University of Oxford. Oxford.
Frankel, J. and Romer, D. (1999). Does Trade Cause Growth? The American Economic Review
89(3): 379-399.
Fry, M., S. Claessens, P. Burridge, and M. Blanchet. (1995). Foreign direct investment, other
capital flows and current account deficits: What causes what? World Bank Policy Research
Working Paper No. 1527.
Funke, N. and S.M. Nsouli (2003). The New Partnership for Africa’s Development (NEPAD):
Opportunities and Challenges. IMF, Washington, DC. IMF Working Paper No. 03/69
Gardiner, R. (2000). Foreign Direct Investment: A Lead Driver for Sustainable Development?
Towards Earth Summit 2002, Economic Briefing Series No. 1.
Girma, S. (2005). Absorptive Capacity and Productivity Spillovers from FDI: A Threshold
Regression Analysis. Oxford Bulletin of Economics and Statistics 67(3): 281-306.
Girma, S. and H. Gorg (2005). Foreign Direct Investment, Spillovers and Absorptive Capacity:
Evidence from Quantile Regressions. Discussion Paper Series 1, Economic Studies No.
13/2005.
Glass, A. and K. Saggi (1998). International Technology Transfer and the Technology Gap.
Journal of Development Economics 55: 369-398.
Granger, C. W. J. (1981). Some properties of time series data and their use in econometric model
specification. Journal of Econometrics 16: 121—130.
Griffith, R., Redding, S., and J. Van Reenen (2004). Mapping the Two Faces of R&D: Productivity
Growth in a Panel of OECD Industries. Review of Economics and Statistics 86(4): 883-
895.
Page 127
115
Grossman, G. and Helpman, E. (1990). Product Development and International Trade. NBER,
Working Paper Series. w2540.
Guerin, S. S. (2012). The relationship between Capital Flows and Current Account: Volatility and
Causality. Working Paper No. 36, LUISS, Rome.
Habiyaremye, A, and T. Ziesemer (2006). Absorptive Capacity and Export Diversificationin SSA
countries. United Nations University MESR WP No. 2006-030
Haddad, M. and A. Harrison (1993). Are there positive spillovers from direct foreign investment?
: Evidence from panel data for Morocco. Journal of Development Economics 42(1): 51-
74.
Hall, R. E. and C. I. Jones (1999). Why Do Some Countries Produce So Much More Output Per
Worker Than Others? Quarterly Journal of Economics 114(1): 83-116.
Harding T. and B. Javorcik (2011). Roll out the Red Carpet and They Will Come: Investment
Promotion and FDI Inflows. Economic Journal 121(557): 1445–1476.
Hermes, N. and R. Lensink. (2003). Foreign Direct Investment, Financial Development and
Economic Growth. Journal of Development Studies 40:1, pp. 142-63.
Herzer, D. (2012). How does foreign direct investment really affect developing countries' growth?
Review of International Economics 20(2): 396-414.
Herzer, D., Klasen, S. and D.F. Nowak-Lehmann (2008). In search of FDI-led growth in
developing countries: The way forward. Economic Modelling 25(5): 793-810.
Holland, D. and N. Pain (2000). On the Road to the Market: The Prospects for Growth in Central
Europe. London: National Institute for Economic Research, mimeo.
Hsiao, C. (1986). Analysis of Panel Data, Cambridge University Press.
Hsiao, F. and M. Hsiao (2006). FDI, Exports, and GDP in East and Southeast Asia – Panel data
versus Time‐series causality analyses. Journal of Asian Economics 17(6): 1082‐1106.
Hossain, M. A. (2007). Impact of foreign direct investment on Bangladesh’s balance of payments:
Some policy implications.
Im, K.S., M.H. Peseran and Y. Shin (2003). Testing for Unit Roots in Heterogeneous Panels.
Journal of Econometrics 115: 53–74.
International Monetary Fund (IMF), (1993). Balance of Payments Manual. 5th Edition,
Washington DC, United States.
Page 128
116
Jaffri, N. A., Mahnaz M. A. and A. Rooma (2012). Foreign Direct Investment and Current Account
Balance of Pakistan. Pakistan Economic and Social Review Volume 50, No. 2, pp. 207-
222.
Jansen, K. (1995). The macroeconomic effects of direct foreign investment: The case of Thailand.
World Development 23 (2): 193-210.
Javorcik, B.S. (2004). Does Foreign Direct Investment Increase the Productivity of Domestic
Firms? In Search of Spillovers through Backward Linkages. American Economic Review.
Johnson, A. (2006). The Effects of FDI Inflows on Host Country Economic Growth. CESIS
Working Paper Series. Sweden: Royal Institute of Technology.
Jones, C. I. (1995). R&D-based models of economic growth. Journal of Political Economy 103(4):
759.
Jyun-Yi, W. and H. Chih-Chiang (2008). Does Foreign Direct Investment Promote Economic
Growth? Evidence from a Threshold Regression Analysis. Economics Bulletin Vol. 15,
No. 12 July 23, 2008.
Kao, C. (1999). Spurious regression and residual-based tests for cointegration in panel data.
Journal of Econometrics 90: 1-44.
Kao, C. and M.H. Chiang (2000). On the estimation and inference of a cointegrated regression in
panel data. Advances in Econometrics 15: 179-222.
Kaur, M., Surendra S. and V. Gautam (2012). Foreign Direct Investment and Current Account
Deficit - a Causality Analysis in Context of India. Journal of International Business and
Economy pp. 85-106.
Keller, W. (2004). International Technology Diffusion. Journal of Economic Literature 42: 752-
782.
Keshava, S. (2008). The effect of FDI on India and Chinese Economy; A comparative analysis.
Second Singapore International Conference on Finance.
Klenow, P. and A. Rodriguez-Clare (1997), "The Neoclassical Revival in Growth Economics:
Has it Gone Too Far?" NBER Macroeconomics Annual, Vol. 12, pp. 73-102.
Kneller, R. (2005). Frontier Technology, Absorptive Capacity and Distance. Oxford Bulletin of
Economics and Statistics 67(1): 1-23.
Kobrin, S. (2005). The Determinants of Liberalisation of FDI Policy in Developing Countries: A
Cross Sectional Analysis, 1992-2001. Transnational Corporations Vol. 14, No. 1
Page 129
117
Kokko, A. (1992). Foreign direct investment, host country characteristics, and spillovers. Doctoral
Dissertation, Stockholm School of Economics.
Kosova, R. (2010). Do foreign firms crowd out domestic firms? Evidence from the Czech
Republic. The Review of Economics and Statistics, 92(4): 861-881.
http://dx.doi.org/10.1162/REST_a_00035.
Kremer, M. (1993). Population growth and technological change: One million B.C. to 1990.
Quarterly Journal of Economics 108(3): 681.
Krogstrup, S. and L. Matar (2005). Foreign Direct Investment, Absorptive Capacity and Growth
in the Arab World. Geneva, Switzerland: Graduate Institute of International Studies.
Kumar, A. (2007). Does foreign direct investment help emerging economies? Economic Letter
(Federal Reserve Bank of Dallas), Volume 2(1) pp. 1-8.
Kumar, N. and J.P. Pradhan (2002). FDI, Externalities, and Economic Growth in Developing
Countries: Some empirical explorations and implications for WTO negotiations on
investment. RIS Discussion Paper No. 27/2002. New Delhi, India.
Lai, M., Peng S. and Q. Bao (2006). Technology Spillovers, Absorptive Capacity and Economic
Growth. China Economic Review 17 (2006) 300-320.
Lee, J. (2009). Trade, FDI, and Productivity Convergence: A Dynamic Panel Data Approach in 25
Countries. Japan and the World Economy Vol. 21, pp. 226-238.
Lehman, A. (2002). Foreign direct investment in emerging markets: Income, repatriations and
financial vulnerabilities. IMF Working Paper No. 02/47.
Levin, A., Lin C., and C.J. Chu (2002). Unit Root Tests in Panel Data: Asymptotic and Finite-
sample Properties. Journal of Econometrics 108: 1–24.
Li, X. and X. Liu (2005). Foreign Direct Investment and Economic Growth: An Increasingly
Endogenous Relationship. World Development 33(3): 393-407.
Lim, E. (2001). Determinants of, and the Relation Between, Foreign Direct Investment and
Growth: A Summary of the Recent Literature. IMF Working Paper 01/175 (Washington:
International Monetary Fund).
Lipsey, R. E. (2000). Interpreting Developed Countries' Foreign Direct Investment. NBER
Working Papers 7810, National Bureau of Economic Research, Inc.
Lipsey, R.E. and F. Sjöholm (2001). Foreign Direct Investment and Wages in Indonesian
Manufacturing. NBER Working Paper no. 8299.
Page 130
118
Liu, Z. (2008). Foreign direct investment and technology spillovers: Theory and evidence. Journal
of Development Economics 85(1-2): 176–193.
Liu X., Siler, P., Wang, C., and Y. Wei (2000). Productivity Spillovers from Foreign Direct
Investment: Evidence From UK Industry Level Panel Data. Journal of International
Business Studies 31(3): 407.
Liuyong, Y. and Z. Yanping (2007). Empirical analysis of the impact of FDI on China’s Balance
of Payments. International Conference on Wireless Communications, Networking and
Mobile Computing (Sept. 25-27). Shanghai, China.
Loko, B. and M.A. Diouf (2009). Revisiting the determinants of productivity growth: What’s new?
IMP Working Paper No.225.
Madsen, J., Islam, M., and J. Ang (2010). Catching up to the Technology Frontier: The Dichotomy
between Innovation and Imitation. Canadian Journal of Economics 43(4): 1389-1411.
Mahadevan, R., and J. Asafu-Adjaye (2006). Energy consumption, economic growth and prices:
a reassessment using panel VECM for developed and developing countries. Energy Policy,
35, 2481-2490. http://dx.doi.org/10.1016/j.enpol.2006.08.019.
Makki, S.S and A. Somwaru (2004). Impact of Foreign Direct Investment and Trade on Economic
Growth: Evidence from Developing Countries. American Journal of Agriculture
Economics, 86(3) (August 2004):795-801.
Manca, F. (2009). Technology Catching-up and the Role of Institutions. Working Papers 2009/12,
Research Institute of Applied Economics 2009.
Markusen, J. R. and A.J. Venables (1999). Foreign Direct Investment as a Catalyst for Industrial
Development. European Economic Review, 1999, 43(2), pp. 335-56.
Massoud, N. (2008). Assessing the Employment Effect of FDI Inflows to Egypt: Does the Mode
of Entry Matter? International Conference on The Unemployment Crisis in the Arab
Countries. Cairo-Egypt.
Mencinger, J. (2008). The Addiction with FDI and current account balance. Working Paper
No.16/2008.
Mold, A. (2008). The Fallout from the Financial Crisis (4): Implications of FDI to Developing
Countries. Policy Insights No.86, OECD Development Centre.
Morrissey, O. (2012). FDI in Sub-Saharan-Africa: Few Linkages, Fewer Spillovers. European
Journal of Development Research 24: 26–31.
Page 131
119
Morrissey, O. and M. Udomkerdmongkol (2012). Governance, Private Investment and Foreign
Direct Investment in Developing Countries. World Development, 40(3):437.
Mucchielli, J. L. and I. Soubaya (2000). Trade and foreign direct investment: An analysis of intra-
firm and arm’s length trade of French multinational firms. Paper presented at the Pacific
Rim Conference (Jan. 11-16, 2000). Sydney, Australia.
Mutenyo, J., Asmah, E. and A. Kalio (2010). Does Foreign Direct Investment Crowd-out Domestic
private Investment in Sub-Saharan Africa. The African Finance Journal 12 (1).
Narayan, S. and P.K. Narayan (2004). Determinants of Demand for Fiji’s Exports: An empirical
Investigation. The Developing Economies, XLII 95-112.
Nath, H. (2005). Trade, foreign direct investment, and growth: Evidence from transition
economies. SHSU Economics and International Business Working Paper No. SHSU Eco
WP05 04. Huntsville, TX: Sam Houston State University.
Ndikumana, L. (2000). Financial Determinants of Domestic Investment in Sub-Saharan Africa:
Evidence from Panel Data. World Development 28(2): pp. 381–400.
Ndikumana, L. and S. Verick (2008). The Linkages between FDI and Domestic Investment:
Unravelling the Developmental Impact of Foreign Investment in Sub-Saharan Africa.
Development Policy Review 26(6): 713-726.
Nelson, R. and E. S. Phelps. (1966). Investments in Humans, Technological Diffusion and
Economic Growth, American Economic Review: Papers and Proceedings, Vol. 56: 69-75.
Ng, T. H. (2007). Foreign Direct Investment and Productivity: Evidence from Sub Saharan Africa.
Unpublished paper (Vienna: UNIDO).
Ng, T.H. (2006. Foreign direct investment and productivity: Evidence from the East Asian
economies. Staff Working Paper 03/2006, UNIDO.
Noorbakhsh, F., Paloni, A. and A. Youssef (2001). Human Capital and FDI inflows to Developing
Countries: New Empirical Evidence. World Development 29(9) pp.1593-1610.
Nunnenkamp, P. and J. Spatz (2003). Foreign Direct Investment and Economic Growth in
Developing Countries: How Relevant are Host-country and Industry Characteristics. Kiel
Working Paper No. 1176, Kiel Institute for World Economy.
OECD (2014), International direct investment database, http://stats.oecd.org/ (accessed 25 January
2014), http://dx.doi.org/10.1787/data-00285-en.
Page 132
120
Ogunleye, E.K. (2009). Exchange Rate Volitility and Foreign Direct Investment in Sub Saharan
Africa: Evidence from Nigeria and South Africa. PhD Dissertation Extract: African Centre
for Economic Transformation.
Olofsdotter, K. (1998). "Foreign direct investment, country capabilities and economic growth."
Review of World Economics 134(3): 534-547.
Osakwe, P, and S. Verick (2007). Current Account Deficits in Sub-Saharan Africa: Do they
Matter? United Nations Economic Commission for Africa.
Parente, S.L. and E.C. Prescott (2001). Barriers to Technology Adoption and Development. The
Journal of Political Economy, Volume 102, Issue 2 (Apr., 1994), 298-321.
Pedroni, P., (2000). Fully modified OLS for heterogeneous cointegrated panels. In Baltagi, B.H.
(Ed.) Nonstationary panels, Panel Cointegration, and Dynamic Panels. Amsterdam:
Elsevier.
Pesaran, H. H. and Y. Shin (1998). Generalised impulse response analysis in linear multivariate
models. Economics Letters, 58(1) 17-29.
Pesaran, M. H. and B. Pesaran (1997). Microfit 4.0 (Window Version). New York: Oxford University Press.
Pesaran, M. H., Shin, Y. and R. J. Smith (2001). Bounds testing approaches to the analysis of
level relationships. Journal of Applied Econometrics Volume 16(3), pp. 289-326.
http://dx.doi.org/10.1002/jae.616
Pesaran, M. H., Shin, Y. and Smith, R. (1999). Pooled mean group estimator of dynamic
heterogeneous panels. Journal of the American Statistical Association Vol 94 pp.621- 634.
Pigato, M. (2000). Foreign Direct Investment in Africa. Old Tales and New Evidence
Ramirez, M. (2011). Is foreign direct investment productive in the Latin America case? A panel
co-integration analysis, 1980–2002. The International Trade Journal 25(1): 35–73.
Roubini, N. and X. Sala-i-Martin (1992). Financial Repression and Economic Growth. Journal of
Development Economics 39, p. 5 – 30.
Roy, S. (2008). Foreign Direct Investment and Total Factor Productivity Growth: Does Distance
from Technology Frontier Matter? Louisiana State University
Sadik, A.T. and A.A. Bolbol. (2003). Mobilising Capital for Arab Economic Development, with
Special Reference to the Role of FDI. Non-symbol paper 2000/4, Economic and Social
Commission for Western Asia.
Page 133
121
Sağlam, B. B., and A.Y. Yalta (2011). Dynamic linkages among foreign direct investment, public
investment and private investment: Evidence from Turkey. Applied Econometrics and
International Development, 11(2): 71–82.
Salman, A., and H.X. Feng (2009). Foreign Direct Investment: Impact on Sectoral Growth in
Pakistan.
Seabra, F. and L. Flach. (2005). Foreign direct investment and profit outflows: a causality analysis
for the Brazilian economy. Economics Bulletin 6 (1): 1−15.
Senbeta, S. (2008). The Nexus between FDI and Total Factor Productivity Growth in Sub Saharan
Africa. University of Antwerp (mimeo), MPRA Paper No. 31067, Munich.
Sjöholm, F. (2008). The Effect of FDI on Employment and Technology in China. Research
Institute of Industrial Economics and Örebro University.
Sjöholm, F. (1997). Technology gap, competition and spillovers from direct foreign investment:
evidence from establishment data. Working Paper Series in Economics and Finance 211,
Stockholm School of Economics.
Siddiqui, D.A., Ahmad M.H. and M. Asim (2013). The causal relationship between Foreign Direct
Investment and Current Account: an empirical investigation for Pakistan economy.
Theoretical and Applied Economics Volume XX (2013), No. 8(585), pp. 93-106
Solomon, E. (2011). Foreign Direct Investment, Host Country Factors and Economic Growth.
Ensayos Revista de Economía, Vol. 30 No. 1 pp. 4-70.
Strauss, I. (2015). Understanding South Africa’s current account deficit: The role of foreign direct
investment income. Africa Economic Brief (AEB) Volume 6, Issue 4, 2015 AfDB.
Sylwester, K. (2005). Foreign Direct Investment, Growth, and Income Inequality in Less
Developed Countries. Inter. Rev. Appl. Econ. 19(3): 289–300.
Titarenko, D. (2006). The Influence of Foreign Direct investment on Domestic Investment
Processes in Latvia. Transport and Telecommunication Vol. 7 No. 1 pp. 76–83.
Todaro, M. P. and S.C. Smith (2003). Economic Development. Pearson Education Limited.
Turner, P. (1991). Capital flows in the 1980s: A survey of major trends A Survey of Major Trends.
BIS Economic Papers No. 30. Basle: Bank for International Settlements, Monetary and
Economic Department.
Page 134
122
Udomkerdmongkol, M., Görg H., and O. Morrissey (2006). Foreign Direct Investment and
Exchange Rates: A Case Study of US FDI in Emerging Market Countries. Discussion
Paper, 06/05, Nottingham, University of Nottingham.
Udomkerdmongkol, M and O. Morrissey (2008). Political Regime, Private Investment and Foreign
Direct Investment in Developing Countries. UNU-WIDER Research Paper 2008/109.
UNCTAD (2013). World Investment Report, (Geneva: UNCTAD).
UNCTAD (2012). World Investment Report, (Geneva: UNCTAD).
UNCTAD (2009). World investment report 2009. New York: United Nations.
UNCTAD (2007). Economic Development in Africa: Reclaiming Policy Space Domestic
Resource Mobilisation and Developmental States (Geneva: UNCTAD).
UNCTAD (2005). Economic Development in Africa: Rethinking the Role of Foreign Direct
Investment (Geneva: UNCTAD).
UNCTAD (2003). Investment and technology policies for competitiveness: review of successful
country experiences (Geneva: UNCTAD).
UNCTAD (2002). World Investment Report 2002: Transnational Corporations and Export
Competitiveness, Geneva.
UNCTAD (2000). World Investment Report (Geneva: UNCTAD).
UNCTAD (1999). Comprehensive Study of the Interrelationship between Foreign Direct
Investment (FDI) and Foreign Portfolio Investment (FPI), United Nations, New York.
UNDP (2011). “Towards Human Resilience: Sustaining MDG Progress in an Age of Economic
Uncertainty. UNDP Bureau for Development Policy, New York.
UNECA (2007). Economic Report on Africa 2007: Accelerating Africa’s Development through
Diversification (Addis Ababa: UNECA).
UNECA (2006). Economic Report on Africa 2006: Capital Flows and Development Financing in
Africa (Addis Ababa: UNECA).
Wang, M. (2010). Foreign direct investment and domestic investment in the host country:
Evidence from panel study. Applied Economics 42(29): 3711–3721.
http://dx.doi.org/10.1080/00036840802314580
Wang, Y.and M. Blomstrom (1992). Foreign investment and technology transfer. European
Economic Review 36(1): 137-155.
Page 135
123
Woo, J. (2009). Productivity Growth and Technological Diffusion through Foreign Direct
Investment. Economic Inquiry 47(2): 226-248.
Woodward, D. (2003). Financial effect of foreign direct investment in the context of a possible
WTO agreement on investment. Presentation to NGO workshop on WTO negotiation on
investment and new issues. Geneva, 18-19.
Xu, B. (2000). Multinational enterprises, technology diffusion, and host country productivity
growth. Journal of Development Economics 62: 477-493.
Yalta, A.Y. (2012). Uncovering the channels through which FDI affects current account: the case
of Turkey. International Journal of Economic Policy in Emerging Economies, Interscience
Enterprises Ltd, vol. 5(2), pages 158-167.77