22
The Leading Solution for WORKPLACE ESSENTIALS
| Date post: | 02-Aug-2015 |
| Category: |
Documents |
| Upload: | irresponse |
| View: | 469 times |
| Download: | 2 times |
The Leading Solution for
WORKPLACE ESSENTIALS
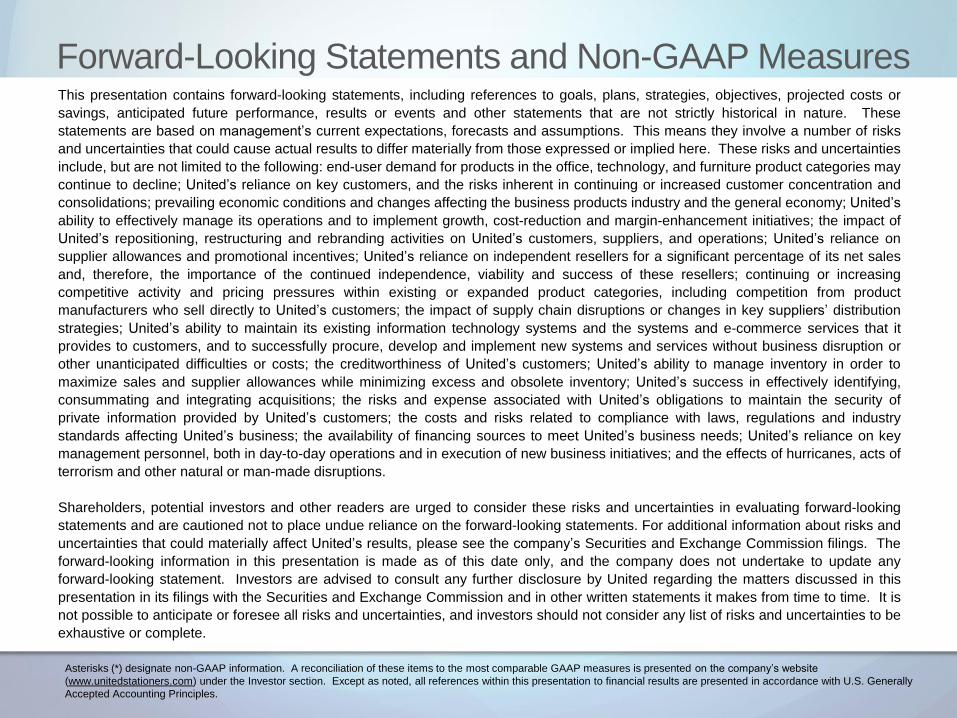
Forward-Looking Statements and Non-GAAP Measures This presentation contains forward-looking statements, including references to goals, plans, strategies, objectives, projected costs or
savings, anticipated future performance, results or events and other statements that are not strictly historical in nature. These
statements are based on management’s current expectations, forecasts and assumptions. This means they involve a number of risks
and uncertainties that could cause actual results to differ materially from those expressed or implied here. These risks and uncertainties
include, but are not limited to the following: end-user demand for products in the office, technology, and furniture product categories may
continue to decline; United’s reliance on key customers, and the risks inherent in continuing or increased customer concentration and
consolidations; prevailing economic conditions and changes affecting the business products industry and the general economy; United’s
ability to effectively manage its operations and to implement growth, cost-reduction and margin-enhancement initiatives; the impact of
United’s repositioning, restructuring and rebranding activities on United’s customers, suppliers, and operations; United’s reliance on
supplier allowances and promotional incentives; United’s reliance on independent resellers for a significant percentage of its net sales
and, therefore, the importance of the continued independence, viability and success of these resellers; continuing or increasing
competitive activity and pricing pressures within existing or expanded product categories, including competition from product
manufacturers who sell directly to United’s customers; the impact of supply chain disruptions or changes in key suppliers’ distribution
strategies; United’s ability to maintain its existing information technology systems and the systems and e-commerce services that it
provides to customers, and to successfully procure, develop and implement new systems and services without business disruption or
other unanticipated difficulties or costs; the creditworthiness of United’s customers; United’s ability to manage inventory in order to
maximize sales and supplier allowances while minimizing excess and obsolete inventory; United’s success in effectively identifying,
consummating and integrating acquisitions; the risks and expense associated with United’s obligations to maintain the security of
private information provided by United’s customers; the costs and risks related to compliance with laws, regulations and industry
standards affecting United’s business; the availability of financing sources to meet United’s business needs; United’s reliance on key
management personnel, both in day-to-day operations and in execution of new business initiatives; and the effects of hurricanes, acts of
terrorism and other natural or man-made disruptions.
Shareholders, potential investors and other readers are urged to consider these risks and uncertainties in evaluating forward-looking
statements and are cautioned not to place undue reliance on the forward-looking statements. For additional information about risks and
uncertainties that could materially affect United’s results, please see the company’s Securities and Exchange Commission filings. The
forward-looking information in this presentation is made as of this date only, and the company does not undertake to update any
forward-looking statement. Investors are advised to consult any further disclosure by United regarding the matters discussed in this
presentation in its filings with the Securities and Exchange Commission and in other written statements it makes from time to time. It is
not possible to anticipate or foresee all risks and uncertainties, and investors should not consider any list of risks and uncertainties to be
exhaustive or complete.
Asterisks (*) designate non-GAAP information. A reconciliation of these items to the most comparable GAAP measures is presented on the company’s website
(www.unitedstationers.com) under the Investor section. Except as noted, all references within this presentation to financial results are presented in accordance with U.S. Generally
Accepted Accounting Principles.
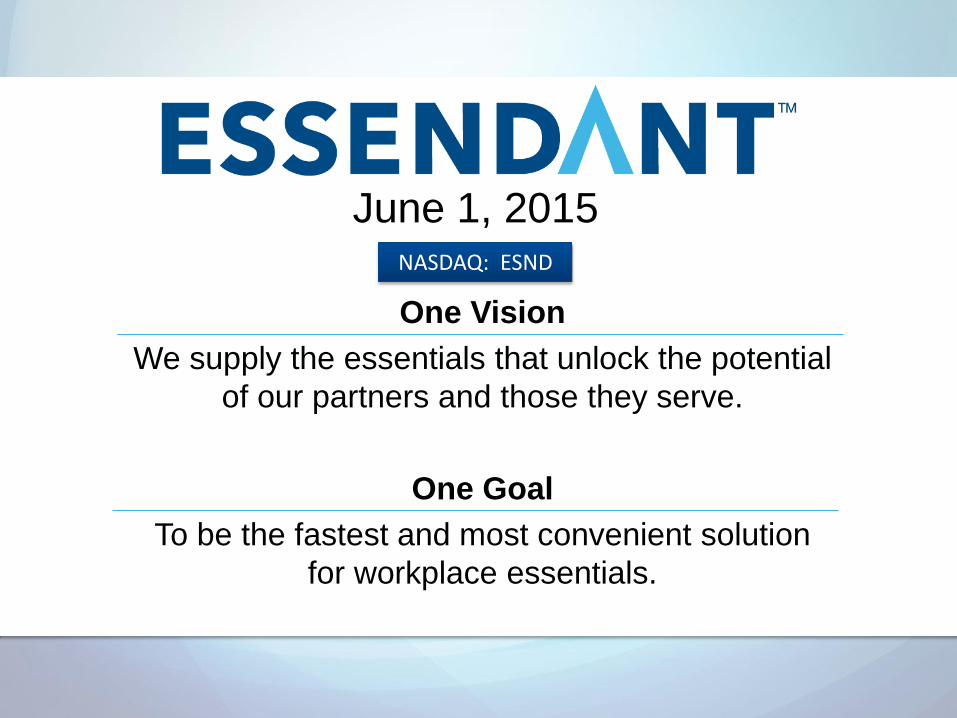
June 1, 2015
One Vision
We supply the essentials that unlock the potential
of our partners and those they serve.
One Goal
To be the fastest and most convenient solution
for workplace essentials.
NASDAQ: ESND
NASDAQ: ESND
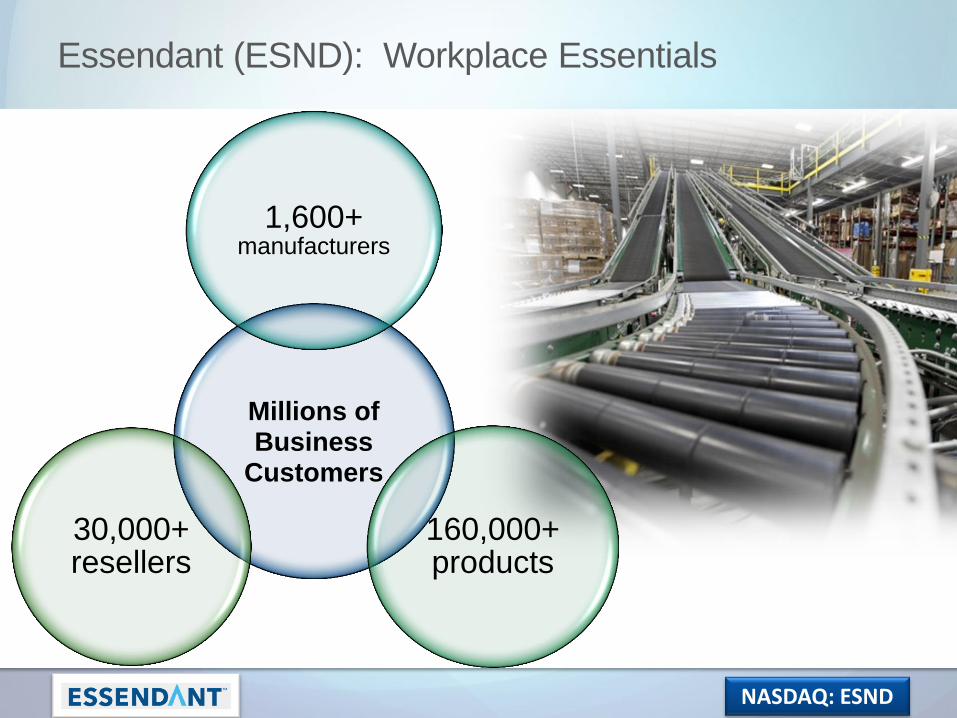
Essendant (ESND): Workplace Essentials
Millions of Business
Customers
1,600+ manufacturers
160,000+ products
30,000+ resellers

NASDAQ: ESND
Industrial
Everyday Consumables = Workplace Essentials
Business
Essentials
Facility
Automotive
Breakroom
NASDAQ: ESND
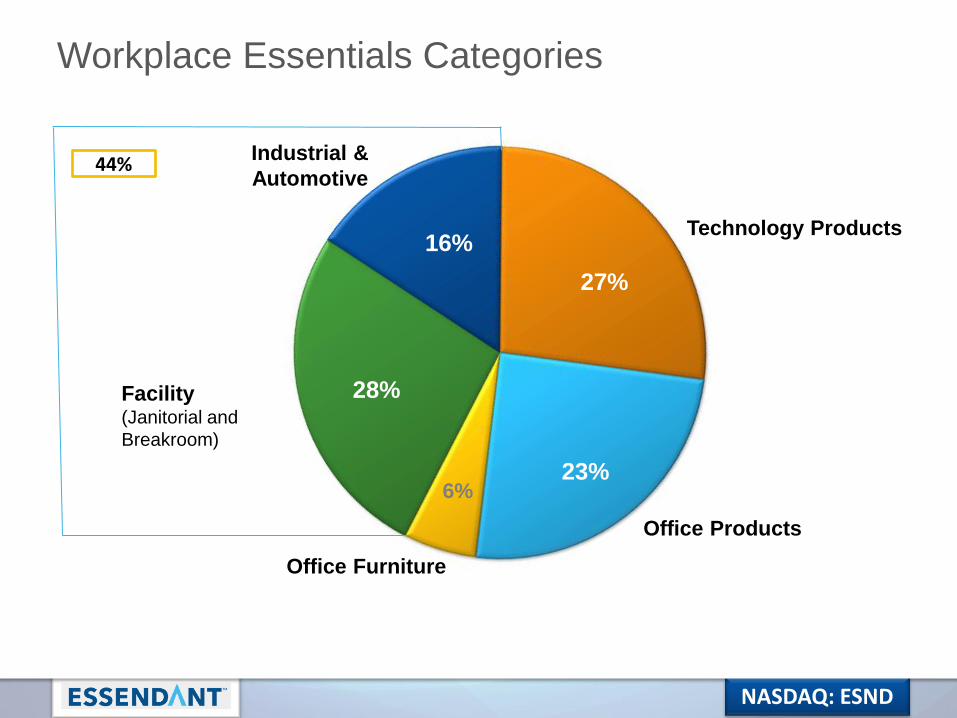
Office Products
Industrial &
Automotive
Facility (Janitorial and
Breakroom)
44%
Workplace Essentials Categories
Technology Products
Office Furniture
6% 23%
28%
27%
16%
NASDAQ: ESND
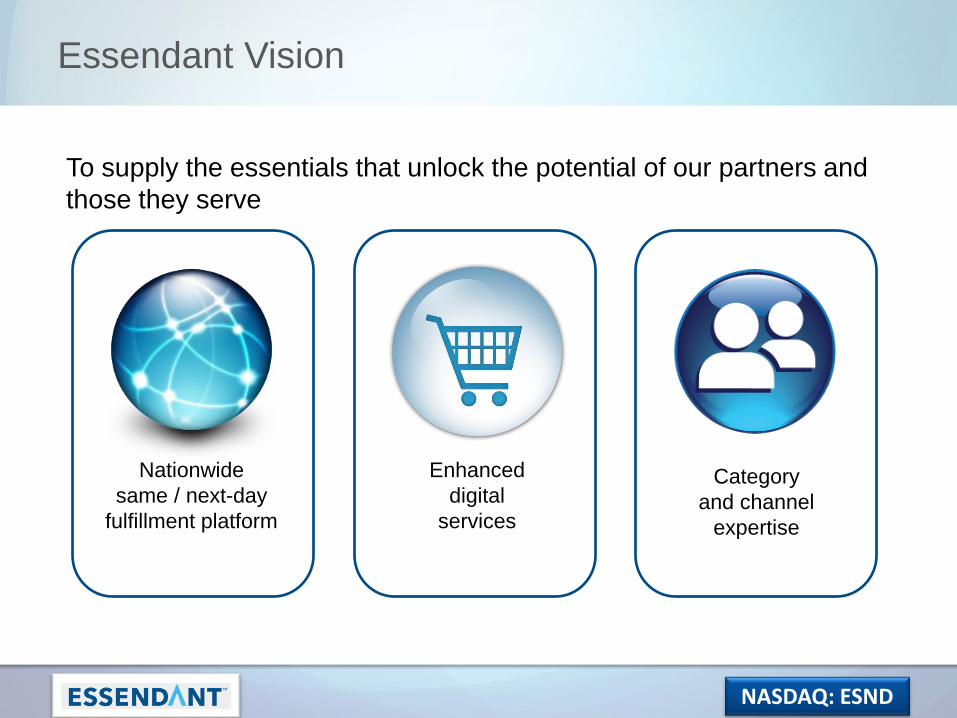
Essendant Vision
Enhanced
digital
services
To supply the essentials that unlock the potential of our partners and
those they serve
Nationwide
same / next-day
fulfillment platform
Category
and channel
expertise
NASDAQ: ESND
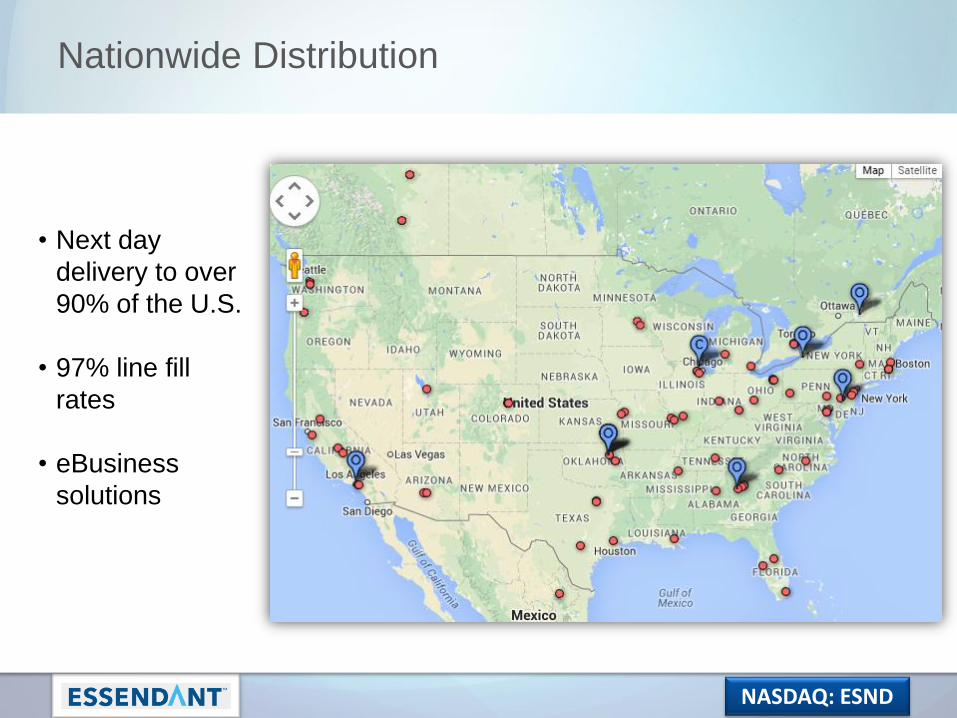
• Next day
delivery to over
90% of the U.S.
• 97% line fill
rates
• eBusiness
solutions
Nationwide Distribution
NASDAQ: ESND
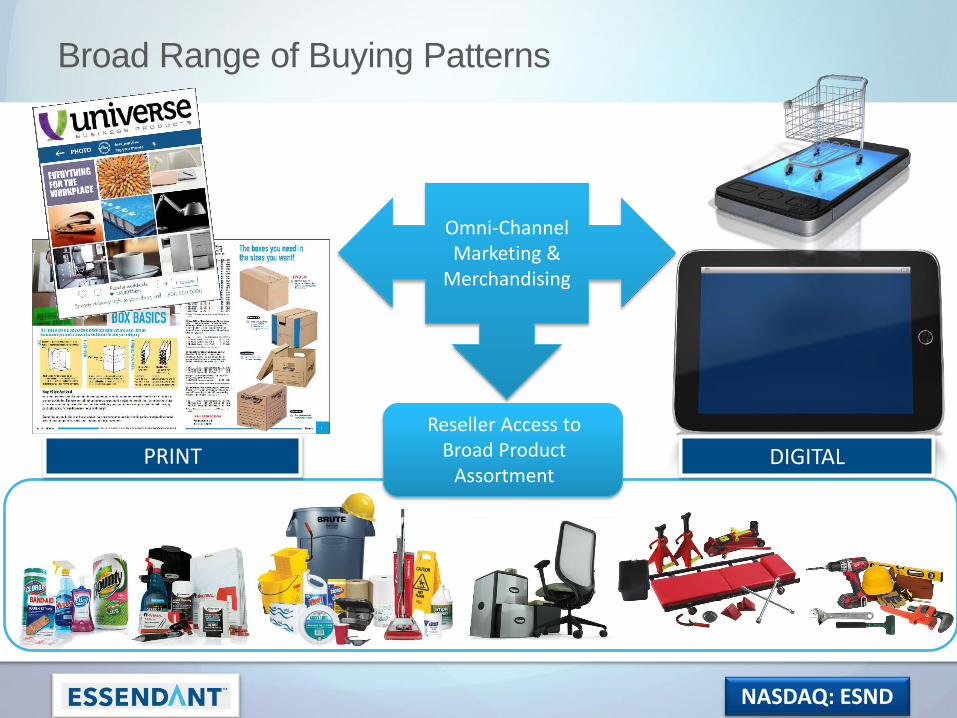
Broad Range of Buying Patterns
PRINT DIGITAL
Omni-Channel Marketing &
Merchandising
Reseller Access to Broad Product
Assortment
NASDAQ: ESND
Our Goal and Strategy
To become the fastest and most convenient solution for
WORKPLACE ESSENTIALS
• Strengthen our core business
• Win Shift to Online
• Diversify
NASDAQ: ESND
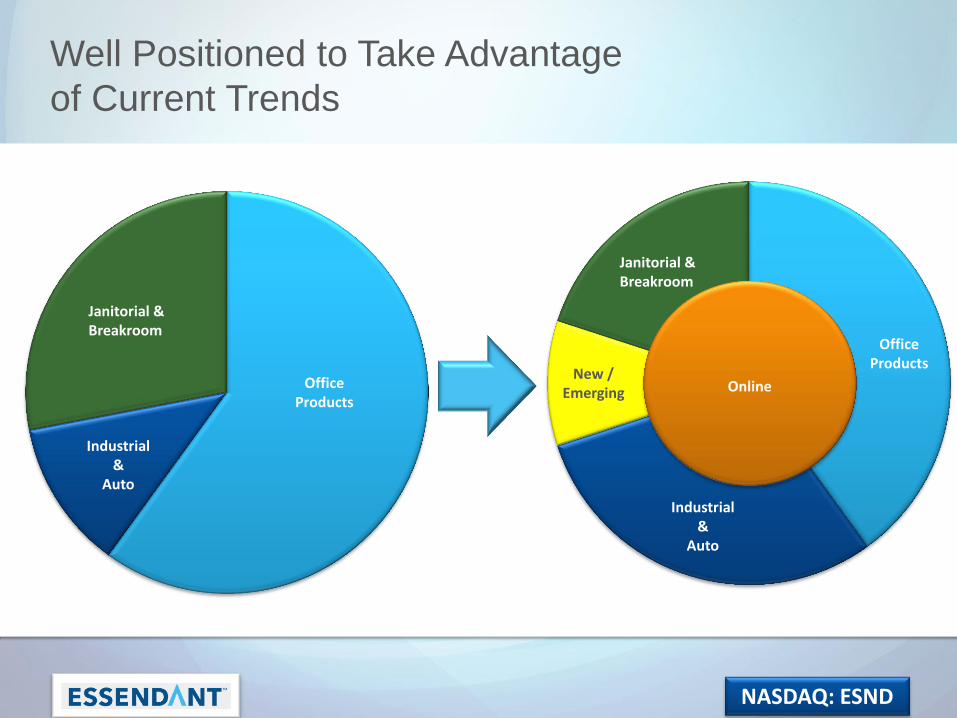
Well Positioned to Take Advantage
of Current Trends
Office Products
Janitorial & Breakroom
Industrial & Auto
Industrial &
Auto
Janitorial & Breakroom
Industrial &
Auto
Office Products
New / Emerging Online
NASDAQ: ESND
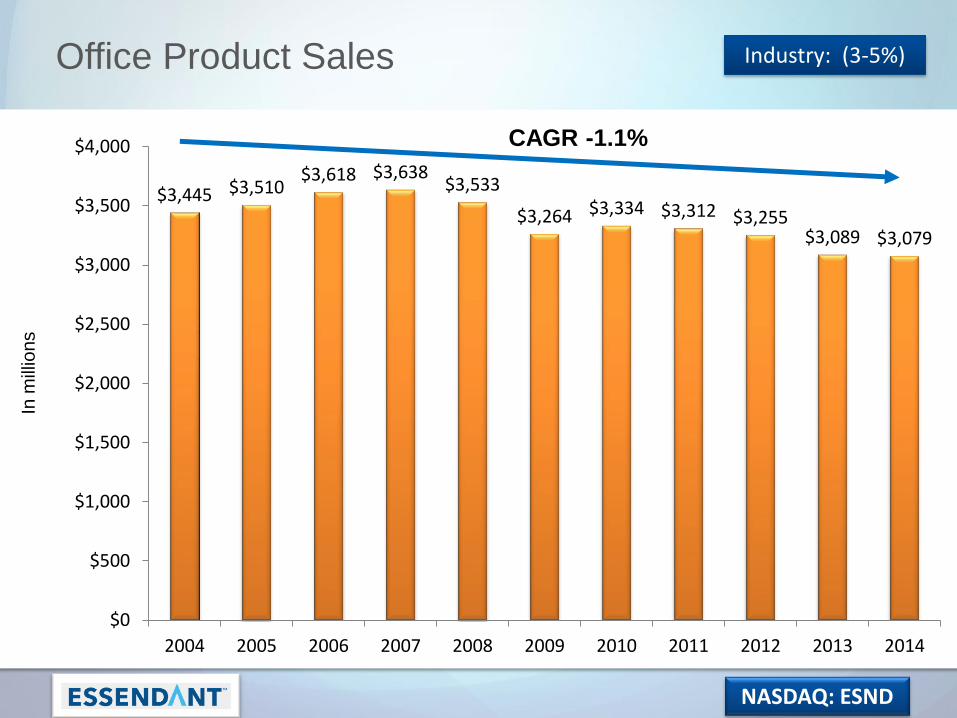
Office Product Sales
$3,445 $3,510 $3,618 $3,638
$3,533
$3,264 $3,334 $3,312 $3,255 $3,089 $3,079
$0
$500
$1,000
$1,500
$2,000
$2,500
$3,000
$3,500
$4,000
2004 2005 2006 2007 2008 2009 2010 2011 2012 2013 2014
CAGR -1.1%
Industry: (3-5%) In
mill
ion
s
NASDAQ: ESND
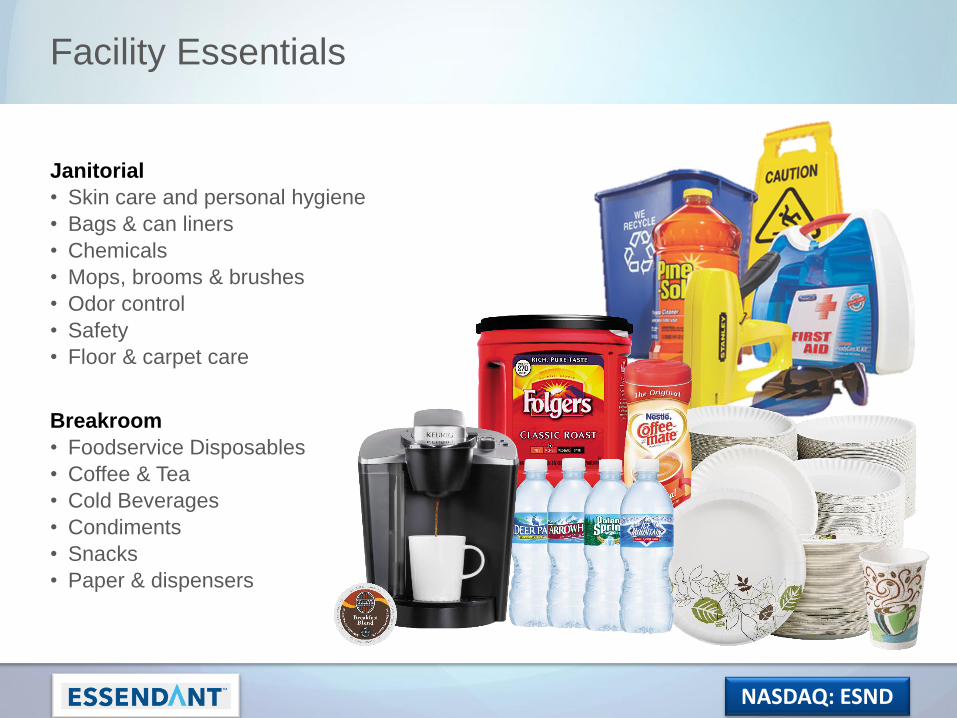
Facility Essentials
Janitorial
• Skin care and personal hygiene
• Bags & can liners
• Chemicals
• Mops, brooms & brushes
• Odor control
• Safety
• Floor & carpet care
Breakroom
• Foodservice Disposables
• Coffee & Tea
• Cold Beverages
• Condiments
• Snacks
• Paper & dispensers
NASDAQ: ESND
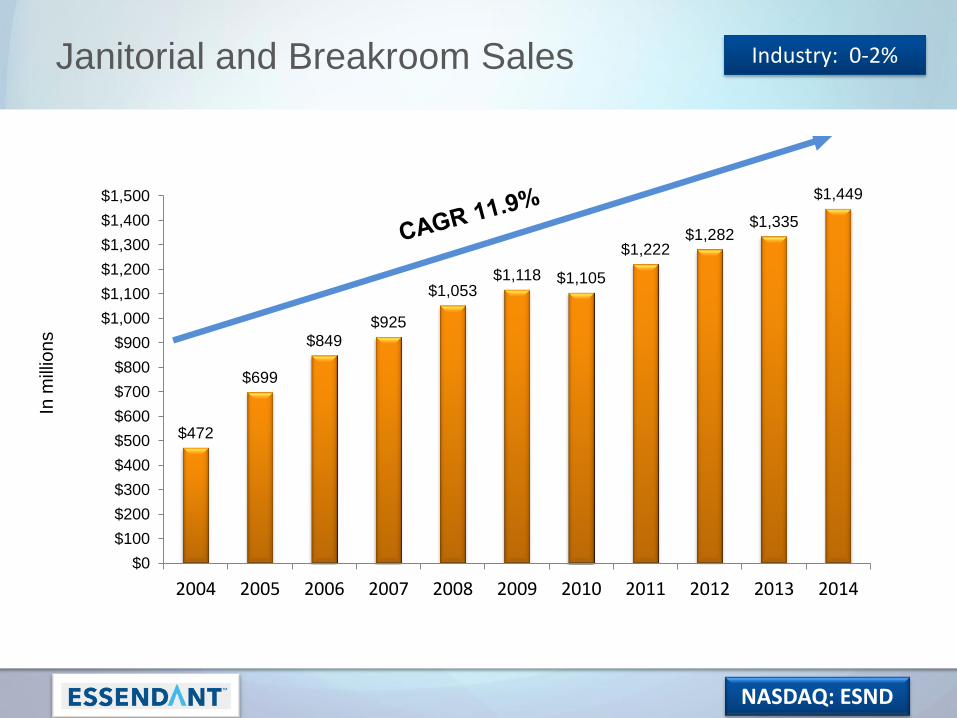
$472
$699
$849 $925
$1,053 $1,118 $1,105
$1,222 $1,282
$1,335
$1,449
$0
$100
$200
$300
$400
$500
$600
$700
$800
$900
$1,000
$1,100
$1,200
$1,300
$1,400
$1,500
2004 2005 2006 2007 2008 2009 2010 2011 2012 2013 2014
Janitorial and Breakroom Sales Industry: 0-2% In
mill
ion
s
NASDAQ: ESND
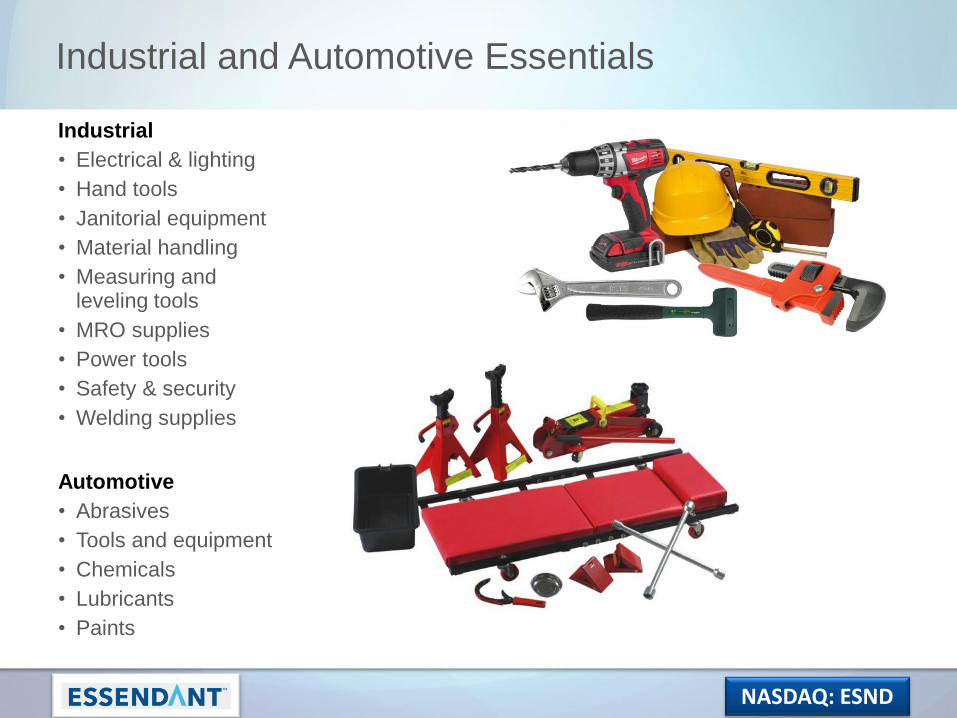
Industrial and Automotive Essentials
Industrial
• Electrical & lighting
• Hand tools
• Janitorial equipment
• Material handling
• Measuring and leveling tools
• MRO supplies
• Power tools
• Safety & security
• Welding supplies
Automotive
• Abrasives
• Tools and equipment
• Chemicals
• Lubricants
• Paints
NASDAQ: ESND
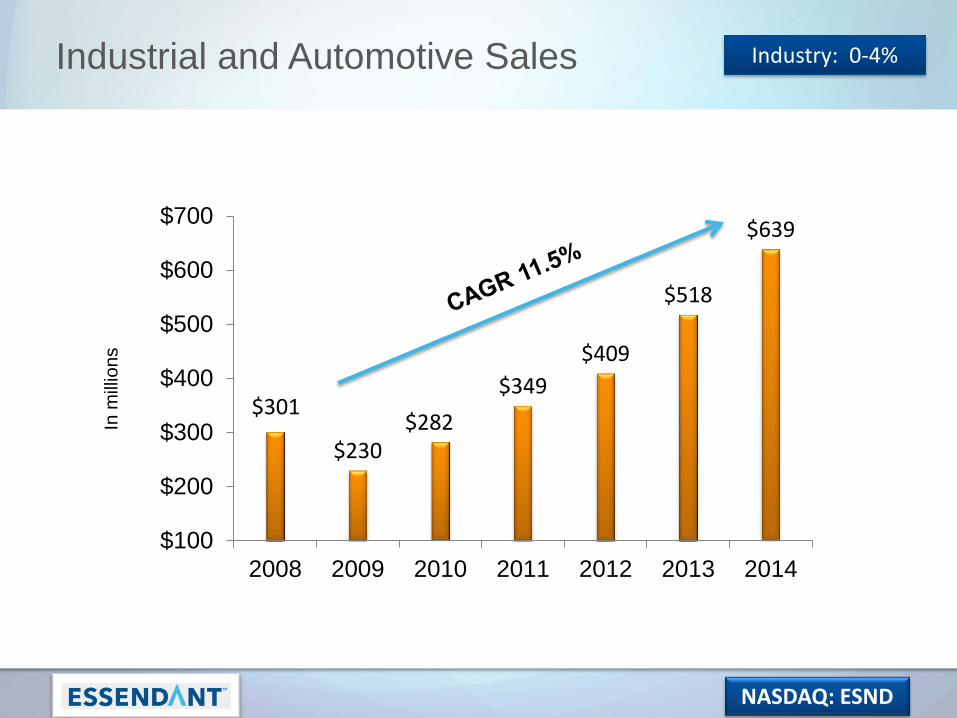
$301
$230 $282
$349
$409
$518
$639
$100
$200
$300
$400
$500
$600
$700
2008 2009 2010 2011 2012 2013 2014
Industrial and Automotive Sales Industry: 0-4%
In m
illio
ns
NASDAQ: ESND
Financial Highlights
NASDAQ: ESND
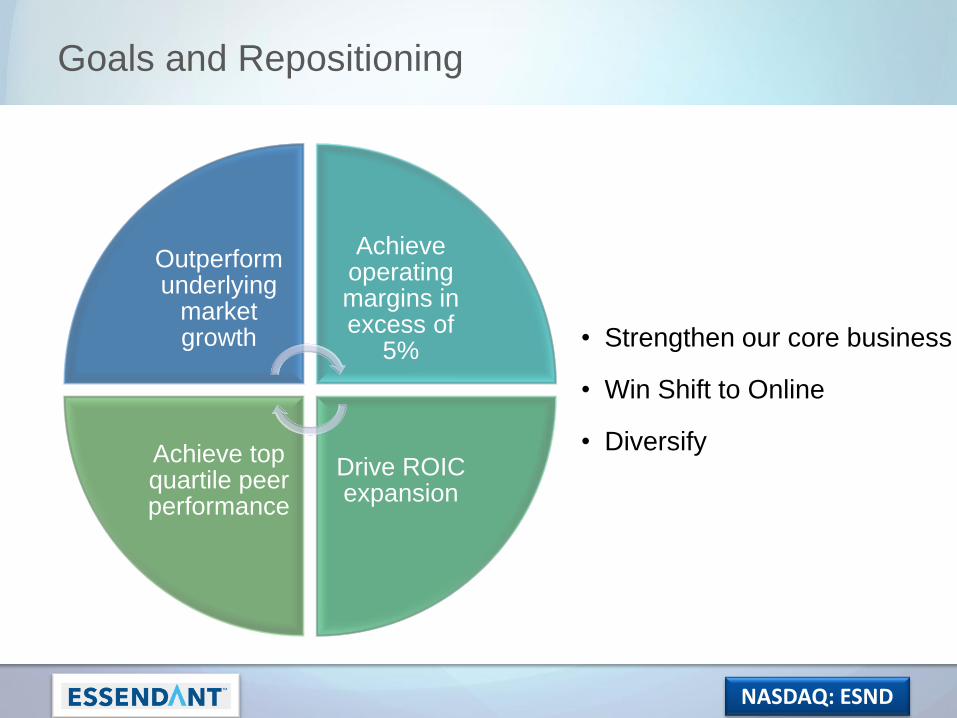
Goals and Repositioning
Outperform underlying
market growth
Achieve operating margins in excess of
5%
Drive ROIC expansion
Achieve top quartile peer performance
• Strengthen our core business
• Win Shift to Online
• Diversify
NASDAQ: ESND
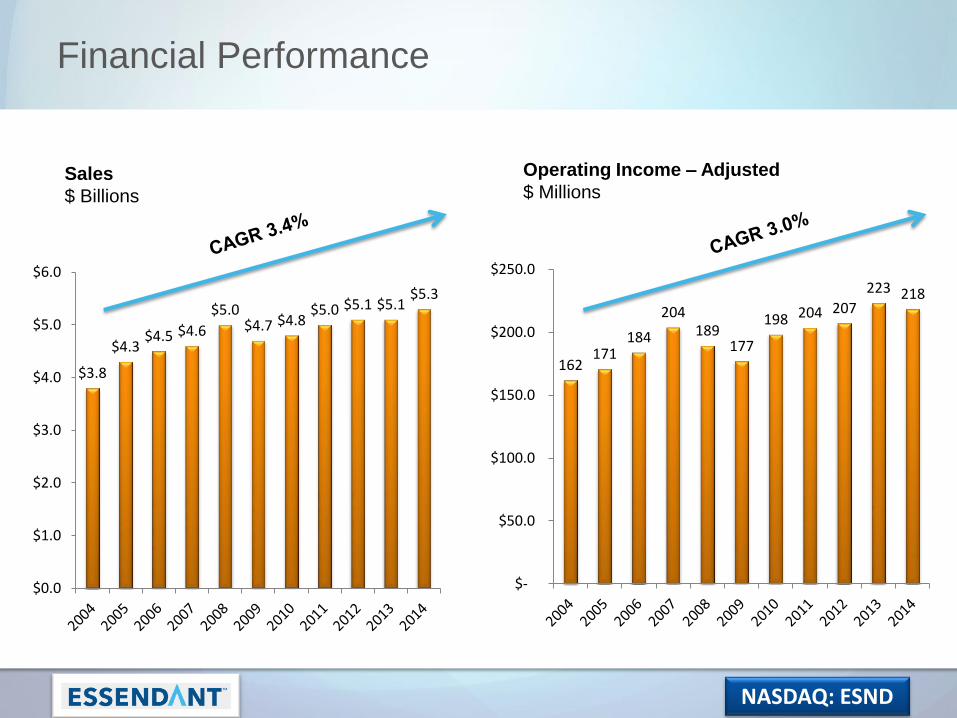
$3.8
$4.3 $4.5 $4.6
$5.0 $4.7 $4.8
$5.0 $5.1 $5.1 $5.3
$0.0
$1.0
$2.0
$3.0
$4.0
$5.0
$6.0
Sales
$ Billions
Operating Income – Adjusted
$ Millions
162 171
184
204 189
177
198 204 207
223 218
$-
$50.0
$100.0
$150.0
$200.0
$250.0
Financial Performance
NASDAQ: ESND
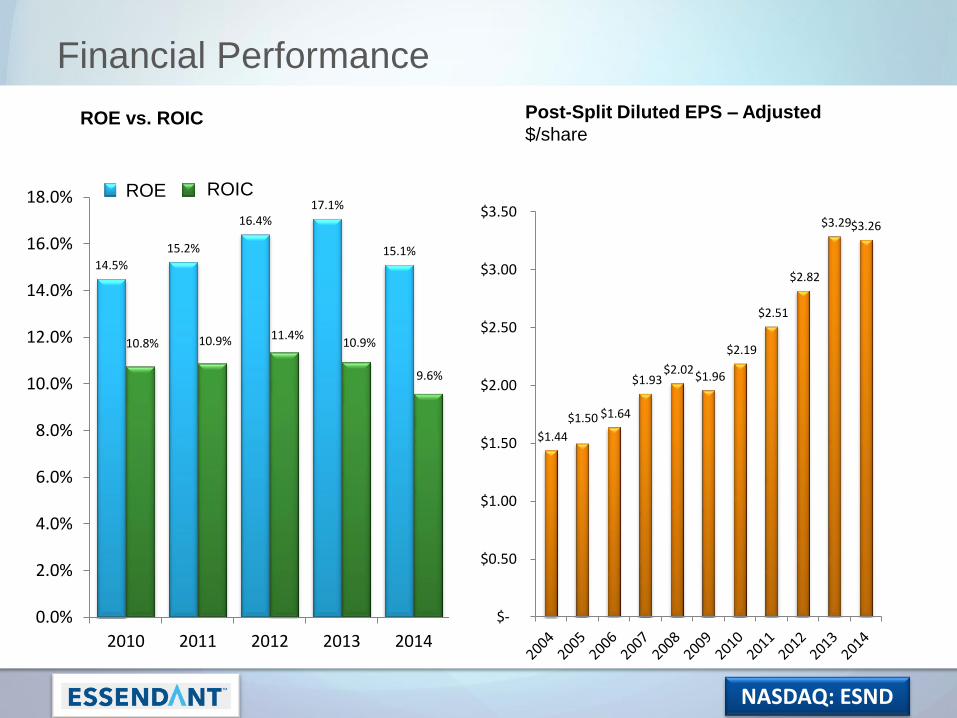
ROE vs. ROIC
Post-Split Diluted EPS – Adjusted
$/share
14.5%
15.2%
16.4% 17.1%
15.1%
10.8% 10.9% 11.4% 10.9%
9.6%
0.0%
2.0%
4.0%
6.0%
8.0%
10.0%
12.0%
14.0%
16.0%
18.0%
2010 2011 2012 2013 2014
ROIC ROE
$1.44
$1.50 $1.64
$1.93 $2.02
$1.96
$2.19
$2.51
$2.82
$3.29 $3.26
$-
$0.50
$1.00
$1.50
$2.00
$2.50
$3.00
$3.50ROE ROIC
Financial Performance
NASDAQ: ESND
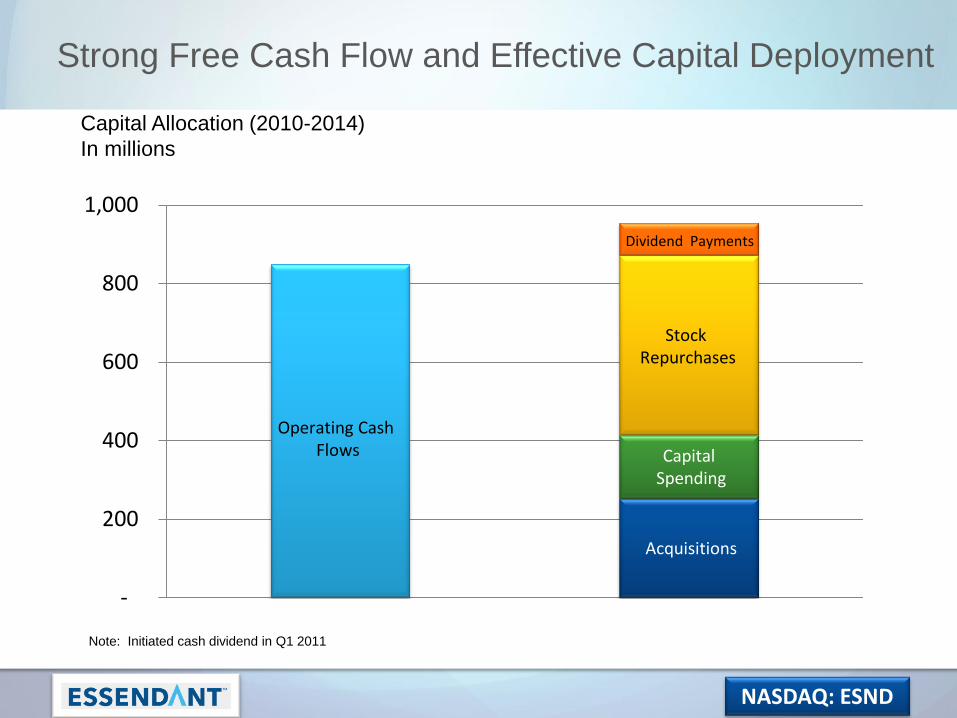
Note: Initiated cash dividend in Q1 2011
Capital Allocation (2010-2014)
In millions
Strong Free Cash Flow and Effective Capital Deployment
-
200
400
600
800
1,000
Operating Cash Flows
Stock Repurchases
Capital Spending
Acquisitions
Dividend Payments
NASDAQ: ESND
• Leveraging core operating
platform
• Attractive growth
opportunities
• Expanding set of digital
solutions
• Attracting talent with a
purpose-driven culture
• Generating strong free
cash flow and returning
cash to investors
Summary


![ITI IR Deck Sep2019 v03[1] - Overview | Iteris Inc](https://static.documents.pub/doc/80x56/6242414c0b925847b86e5380/iti-ir-deck-sep2019-v031-overview-iteris-inc.jpg)


