Page 1
1- 1 Malhotra Hall Shaw Oppenheim Essentials of Marketing Research © Copyright 2004 Pearson Education Australia
Essentials of
Marketing Research
MALHOTRA
HALL
SHAW
OPPENHEIM
AN
APPLIED
ORIENTATION
PowerPoint to accompany
1- 1
Page 2
1- 2 Malhotra Hall Shaw Oppenheim Essentials of Marketing Research © Copyright 2004 Pearson Education Australia
PART FOUR
Chapter 10
Basic Data Analysing
Page 3
10-3 Malhotra Hall Shaw Oppenheim Essentials of Marketing Research © Copyright 2004 Pearson Education Australia
Chapter Objectives
After reading this chapter, you should be able to:
Understand the importance of preliminary data analysis.
Explain data analysis associated with frequencies.
Explain data analysis associated with cross-tabulations.
Understand, discuss and apply data analysis associated with parametric hypothesis testing.
Understand, discuss and apply data analysis associated with non-parametric hypothesis testing.
Conduct a preliminary data analysis using SPSS.
Page 4
10-4 Malhotra Hall Shaw Oppenheim Essentials of Marketing Research © Copyright 2004 Pearson Education Australia
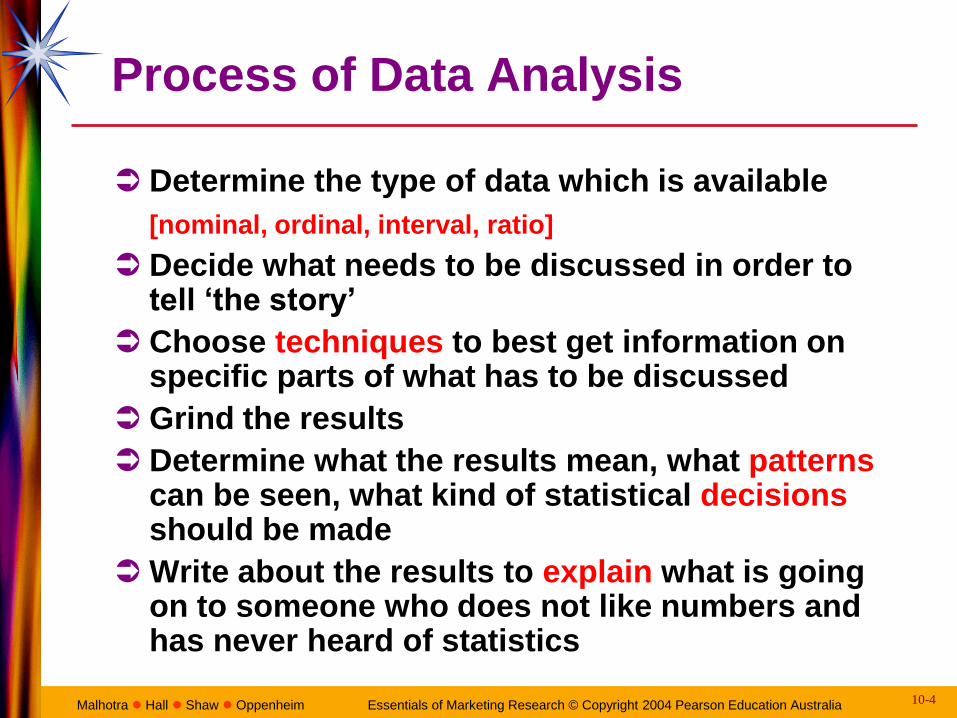
Process of Data Analysis
Determine the type of data which is available
[nominal, ordinal, interval, ratio]
Decide what needs to be discussed in order to tell ‘the story’
Choose techniques to best get information on specific parts of what has to be discussed
Grind the results
Determine what the results mean, what patterns can be seen, what kind of statistical decisions should be made
Write about the results to explain what is going on to someone who does not like numbers and has never heard of statistics
Page 5
10-5 Malhotra Hall Shaw Oppenheim Essentials of Marketing Research © Copyright 2004 Pearson Education Australia
Nature of Survey Data
Examine the data set using a simple spreadsheet
Examine the frequency distributions of the relevant variables
Page 6
10-6 Malhotra Hall Shaw Oppenheim Essentials of Marketing Research © Copyright 2004 Pearson Education Australia
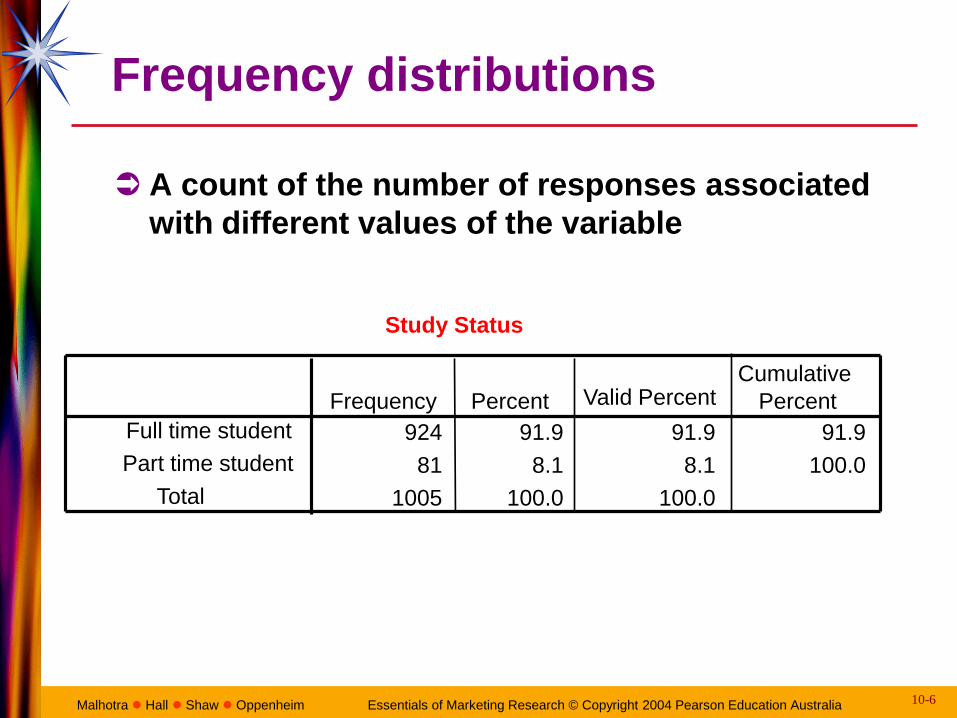
Frequency distributions
A count of the number of responses associated
with different values of the variable
Study Status
924 91.9 91.9 91.9
81 8.1 8.1 100.0
1005 100.0 100.0
Full time student
Part time student
Total
Frequency Percent Valid Percent Cumulative
Percent
Page 7
10-7 Malhotra Hall Shaw Oppenheim Essentials of Marketing Research © Copyright 2004 Pearson Education Australia
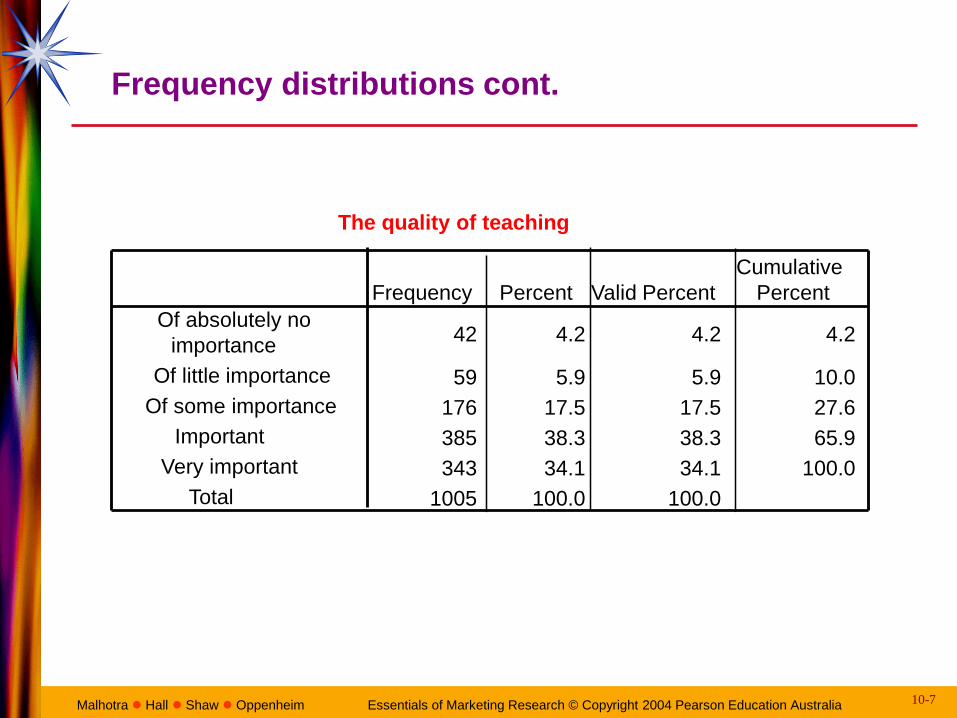
Frequency distributions cont.
The quality of teaching
42 4.2 4.2 4.2
59 5.9 5.9 10.0
176 17.5 17.5 27.6
385 38.3 38.3 65.9
343 34.1 34.1 100.0
1005 100.0 100.0
Of absolutely no
importance
Of little importance
Of some importance
Important
Very important
Total
Frequency Percent Valid Percent
Cumulative
Percent
Page 8
10-8 Malhotra Hall Shaw Oppenheim Essentials of Marketing Research © Copyright 2004 Pearson Education Australia
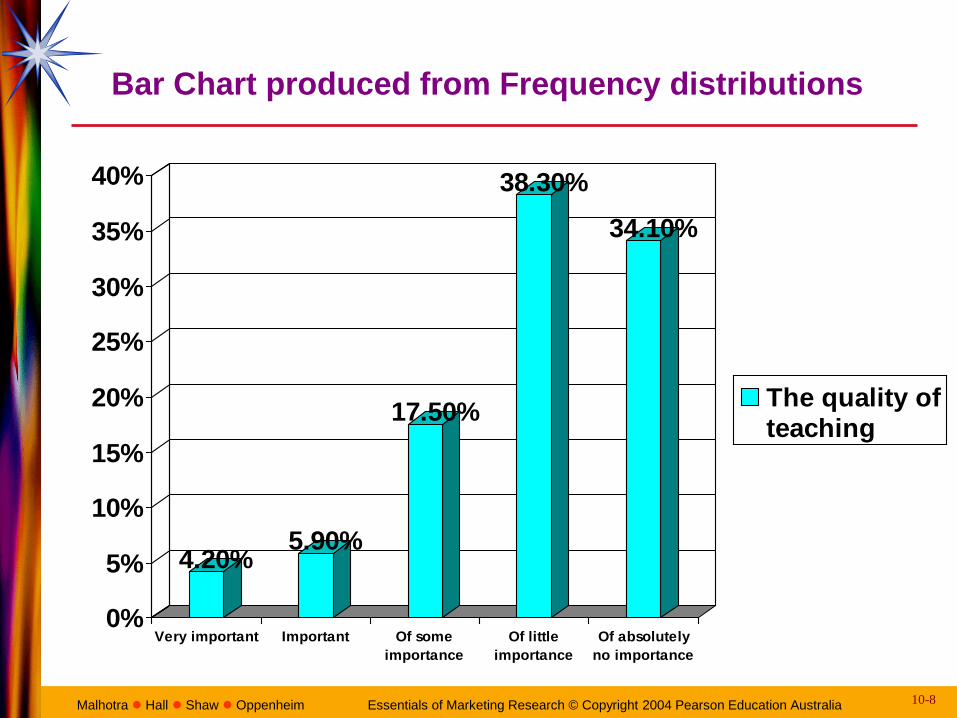
Bar Chart produced from Frequency distributions
4.20%5.90%
17.50%
38.30%
34.10%
0%
5%
10%
15%
20%
25%
30%
35%
40%
Very important Important Of some
importance
Of little
importance
Of absolutely
no importance
The quality ofteaching
Page 9
10-9 Malhotra Hall Shaw Oppenheim Essentials of Marketing Research © Copyright 2004 Pearson Education Australia
Frequencies for
Multiple Response Questions
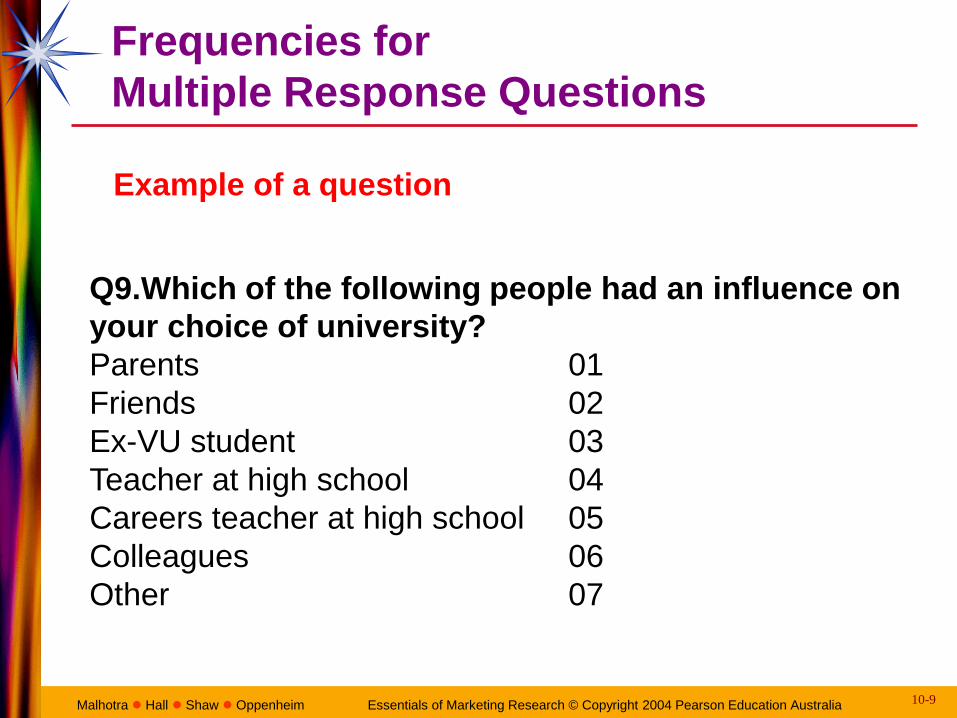
Example of a question
Q9.Which of the following people had an influence on
your choice of university?
Parents 01
Friends 02
Ex-VU student 03
Teacher at high school 04
Careers teacher at high school 05
Colleagues 06
Other 07
Page 10
10-10 Malhotra Hall Shaw Oppenheim Essentials of Marketing Research © Copyright 2004 Pearson Education Australia
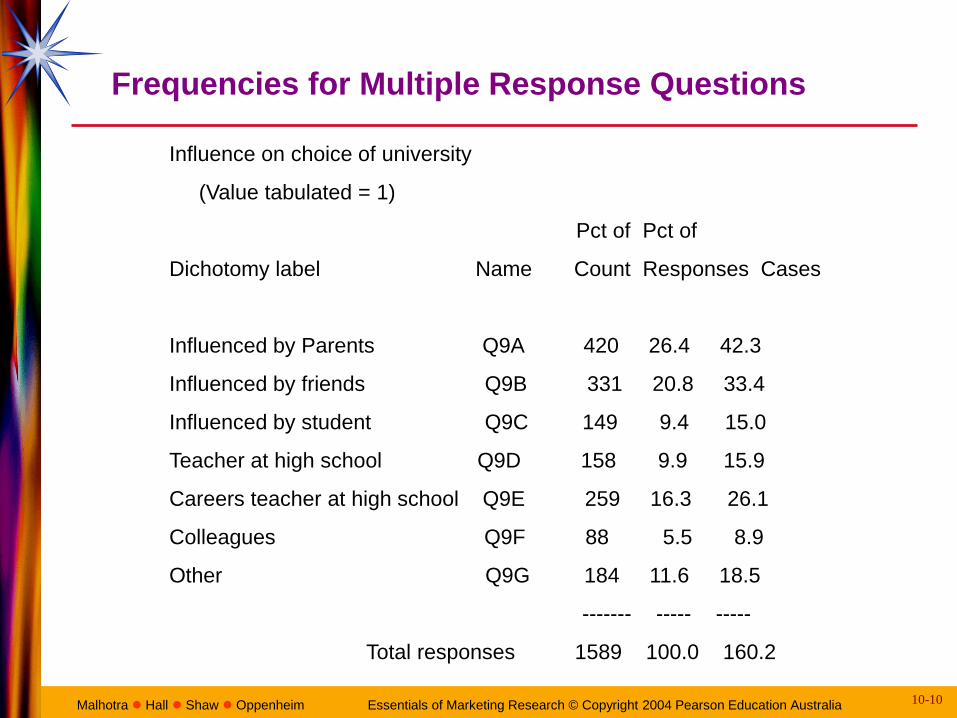
Frequencies for Multiple Response Questions
Influence on choice of university
(Value tabulated = 1)
Pct of Pct of
Dichotomy label Name Count Responses Cases
Influenced by Parents Q9A 420 26.4 42.3
Influenced by friends Q9B 331 20.8 33.4
Influenced by student Q9C 149 9.4 15.0
Teacher at high school Q9D 158 9.9 15.9
Careers teacher at high school Q9E 259 16.3 26.1
Colleagues Q9F 88 5.5 8.9
Other Q9G 184 11.6 18.5
------- ----- -----
Total responses 1589 100.0 160.2
Page 11
10-11 Malhotra Hall Shaw Oppenheim Essentials of Marketing Research © Copyright 2004 Pearson Education Australia
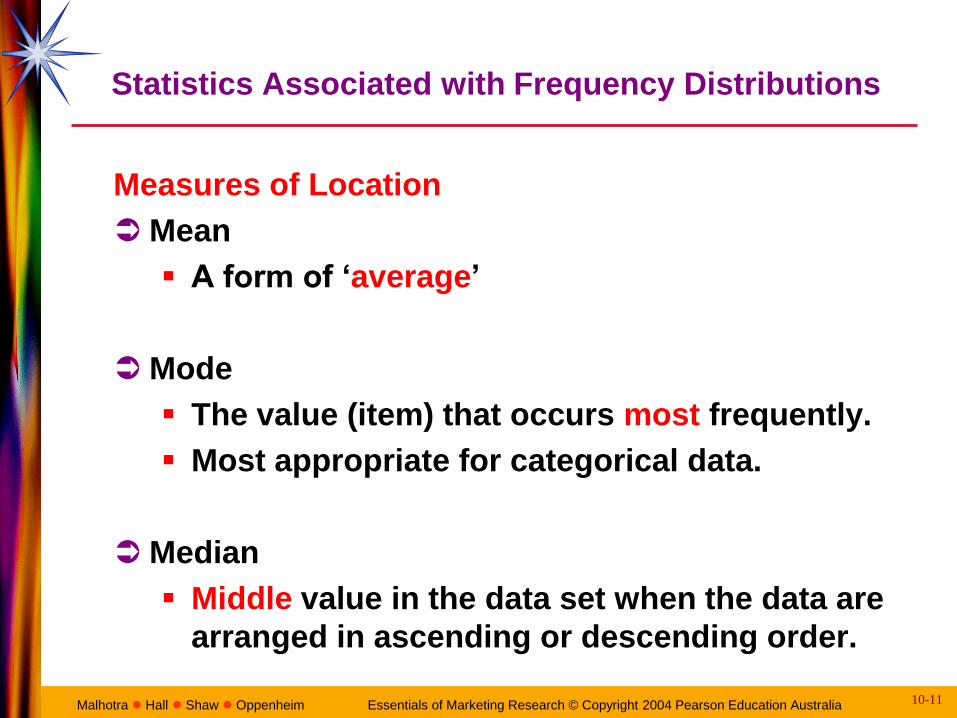
Statistics Associated with Frequency Distributions
Measures of Location
Mean
A form of ‘average’
Mode
The value (item) that occurs most frequently.
Most appropriate for categorical data.
Median
Middle value in the data set when the data are
arranged in ascending or descending order.
Page 12
10-12 Malhotra Hall Shaw Oppenheim Essentials of Marketing Research © Copyright 2004 Pearson Education Australia
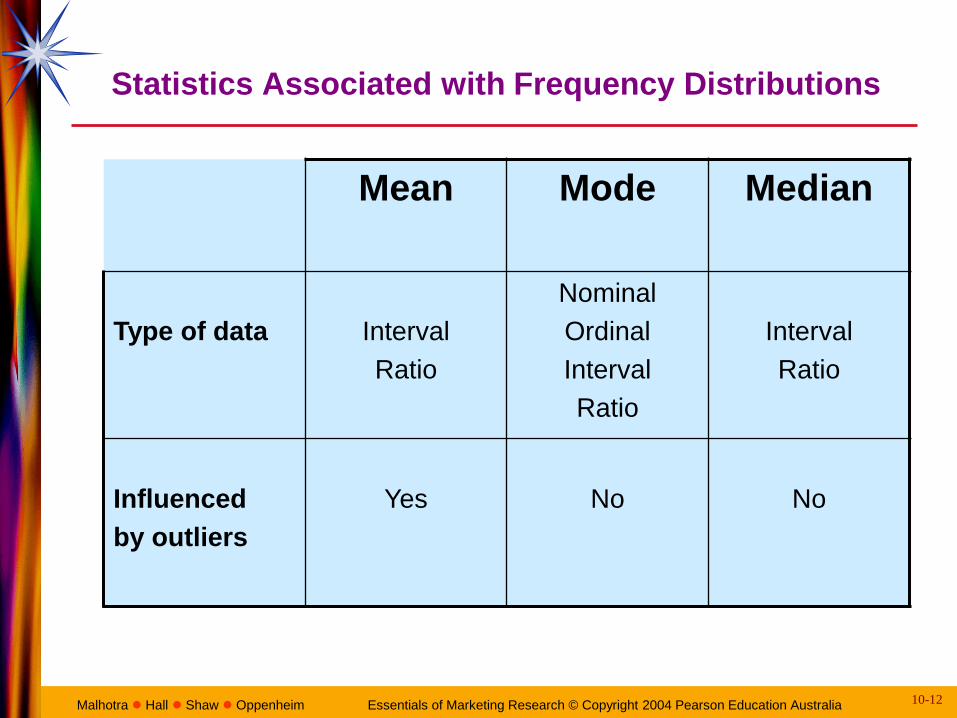
Statistics Associated with Frequency Distributions
Mean Mode Median
Type of data
Interval
Ratio
Nominal
Ordinal
Interval
Ratio
Interval
Ratio
Influenced
by outliers
Yes
No
No
Page 13
10-13 Malhotra Hall Shaw Oppenheim Essentials of Marketing Research © Copyright 2004 Pearson Education Australia
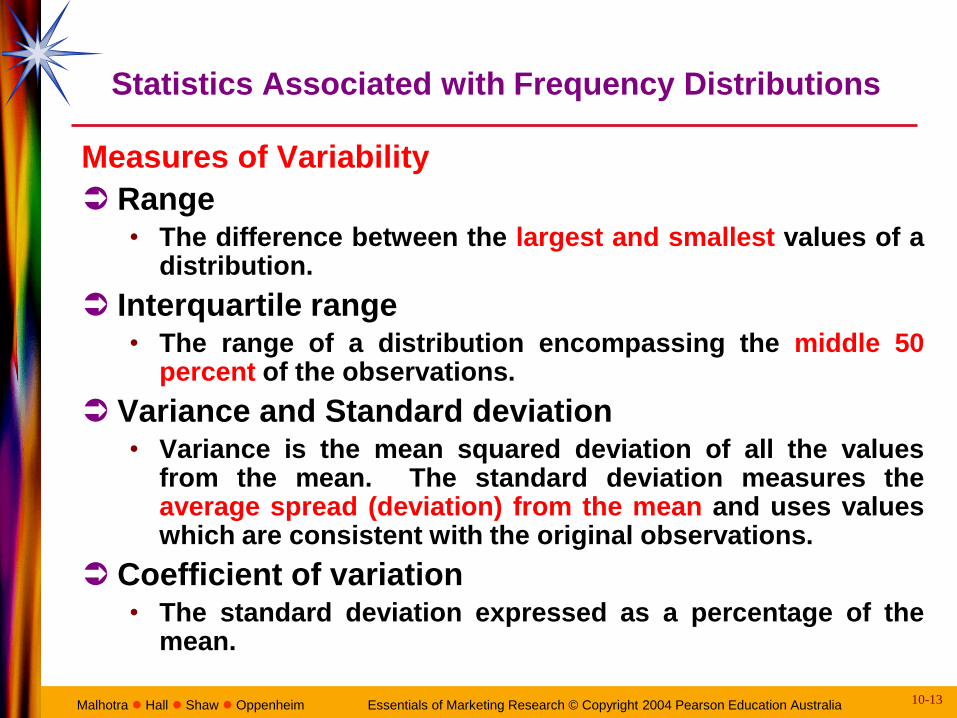
Statistics Associated with Frequency Distributions
Measures of Variability
Range • The difference between the largest and smallest values of a
distribution.
Interquartile range • The range of a distribution encompassing the middle 50
percent of the observations.
Variance and Standard deviation • Variance is the mean squared deviation of all the values
from the mean. The standard deviation measures the average spread (deviation) from the mean and uses values which are consistent with the original observations.
Coefficient of variation • The standard deviation expressed as a percentage of the
mean.
Page 14
10-14 Malhotra Hall Shaw Oppenheim Essentials of Marketing Research © Copyright 2004 Pearson Education Australia
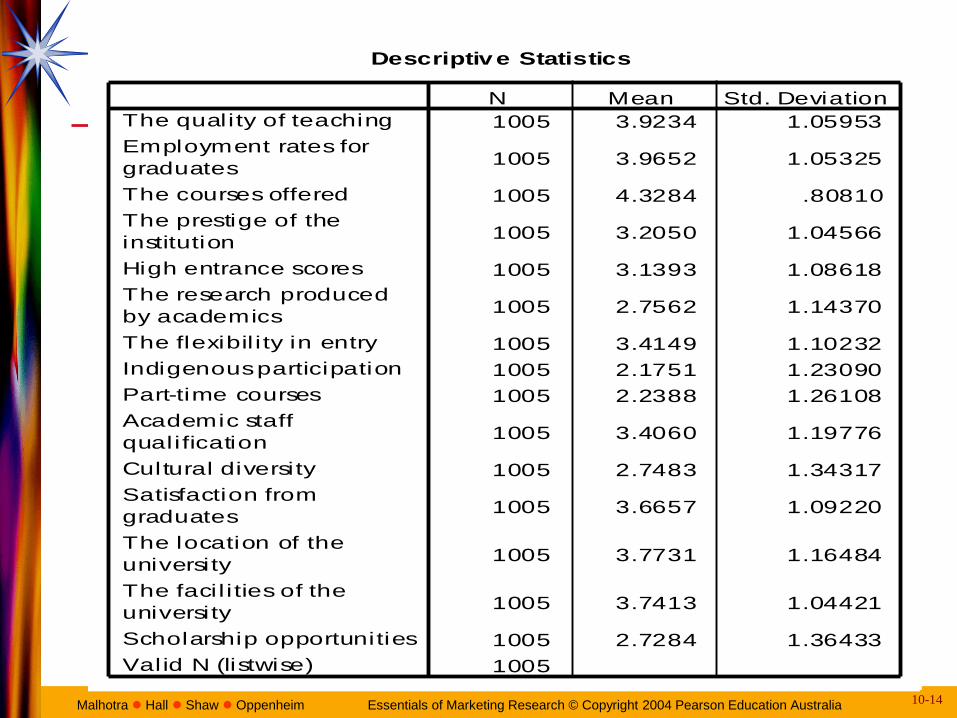
Descriptive Statistics
1005 3.9234 1.05953
1005 3.9652 1.05325
1005 4.3284 .80810
1005 3.2050 1.04566
1005 3.1393 1.08618
1005 2.7562 1.14370
1005 3.4149 1.10232
1005 2.1751 1.23090
1005 2.2388 1.26108
1005 3.4060 1.19776
1005 2.7483 1.34317
1005 3.6657 1.09220
1005 3.7731 1.16484
1005 3.7413 1.04421
1005 2.7284 1.36433
1005
The quality of teaching
Employment rates for
graduates
The courses offered
The prestige of the
institution
High entrance scores
The research produced
by academics
The flexibil i ty in entry
Indigenous participation
Part-time courses
Academic staff
qualification
Cultural diversity
Satisfaction from
graduates
The location of the
university
The facil i ties of the
university
Scholarship opportunities
Valid N (listwise)
N Mean Std. Deviation
Page 15
10-15 Malhotra Hall Shaw Oppenheim Essentials of Marketing Research © Copyright 2004 Pearson Education Australia
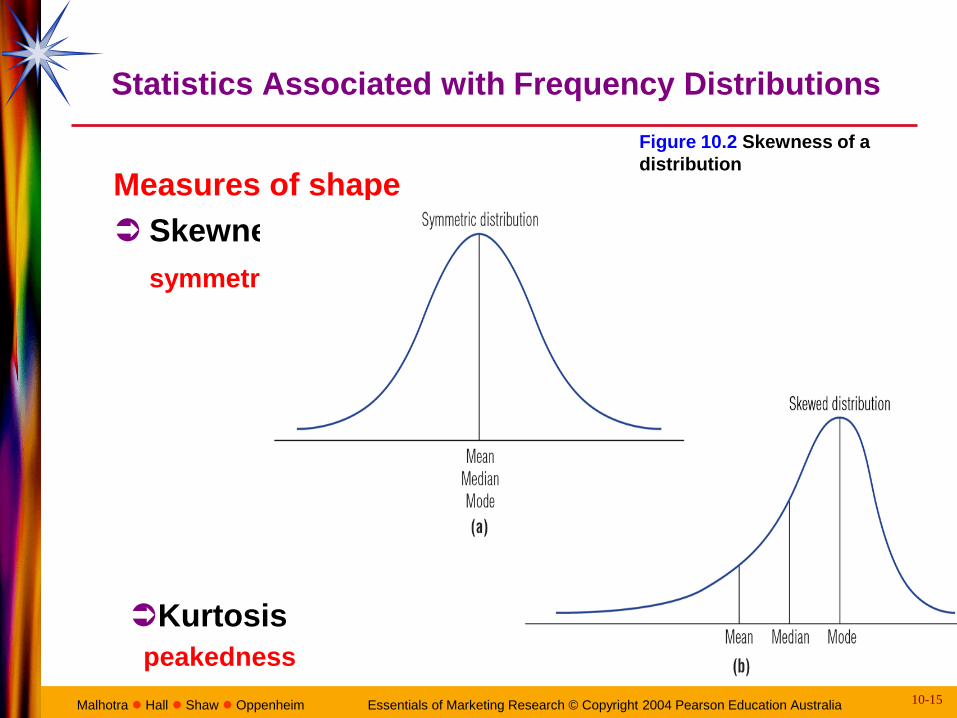
Statistics Associated with Frequency Distributions
Measures of shape
Skewness
symmetry
Kurtosis
peakedness
Figure 10.2 Skewness of a
distribution
Page 16
10-16 Malhotra Hall Shaw Oppenheim Essentials of Marketing Research © Copyright 2004 Pearson Education Australia
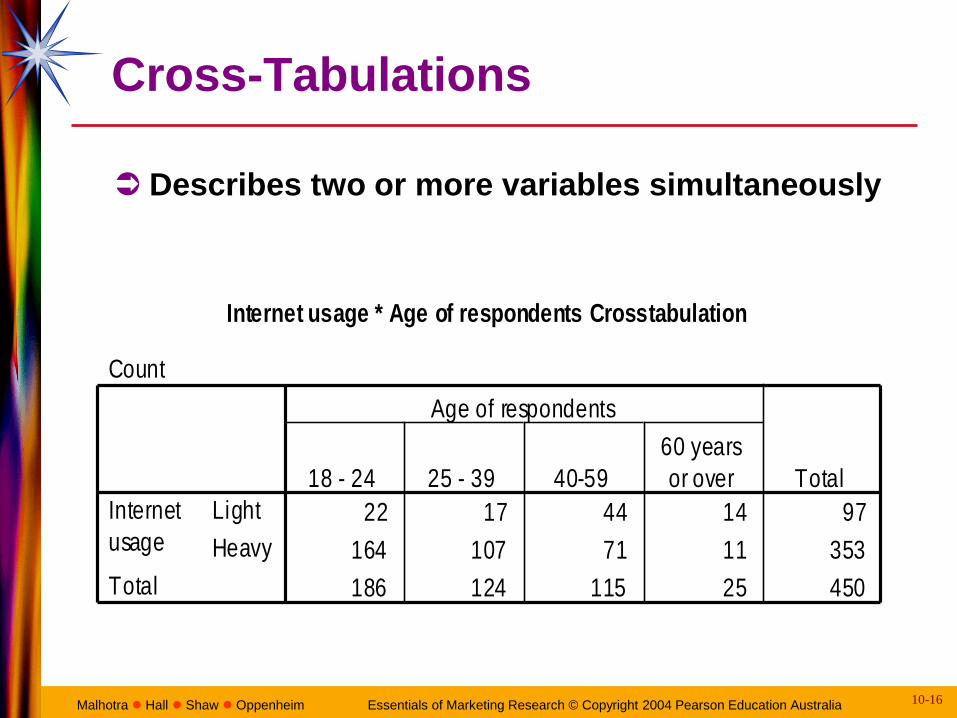
Cross-Tabulations
Describes two or more variables simultaneously
Internet usage * Age of respondents Crosstabulation
Count
22 17 44 14 97
164 107 71 11 353
186 124 115 25 450
Light
Heavy
Internet
usage
Total
18 - 24 25 - 39 40-59
60 years
or over
Age of respondents
Total
Page 17
10-17 Malhotra Hall Shaw Oppenheim Essentials of Marketing Research © Copyright 2004 Pearson Education Australia
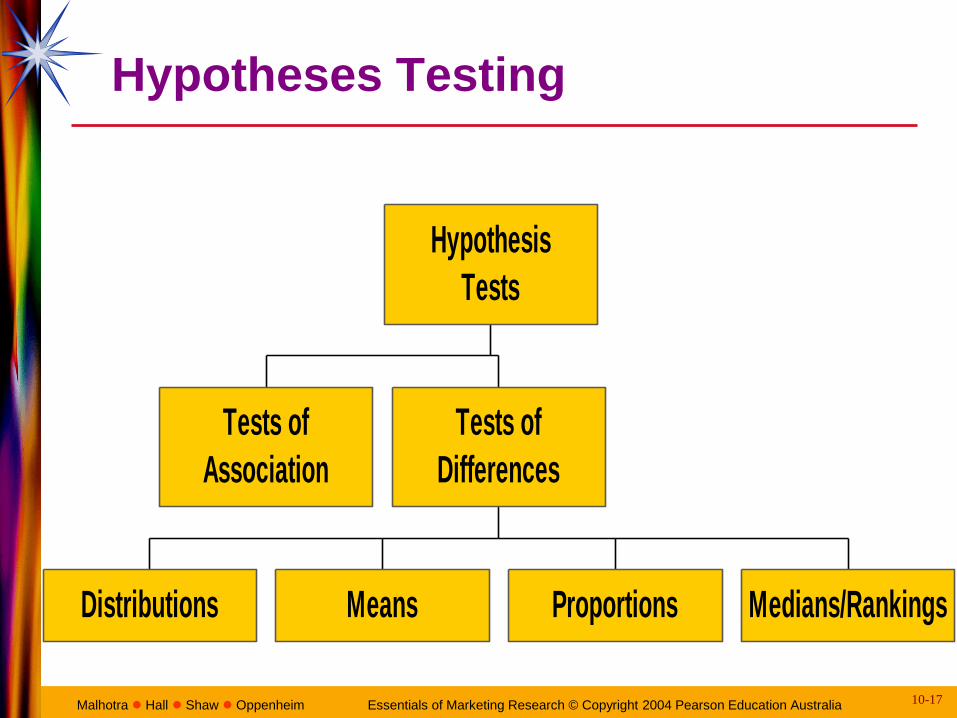
Hypotheses Testing
Tests of
Association
Distributions Means Proportions Medians/Rankings
Tests of
Differences
Hypothesis
Tests
Page 18
10-18 Malhotra Hall Shaw Oppenheim Essentials of Marketing Research © Copyright 2004 Pearson Education Australia
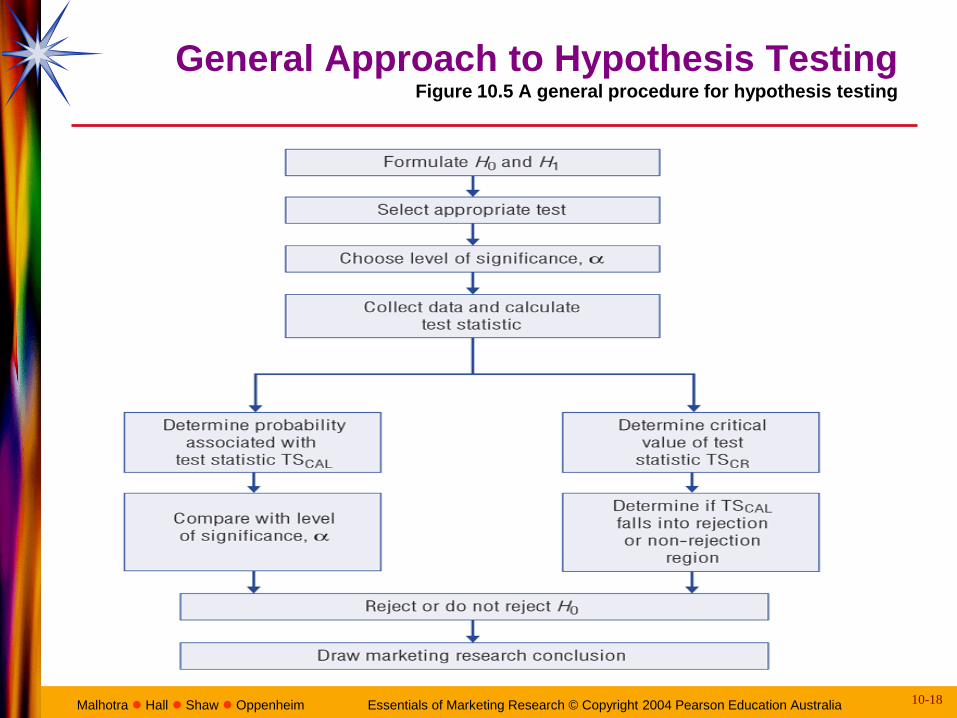
General Approach to Hypothesis Testing Figure 10.5 A general procedure for hypothesis testing
Page 19
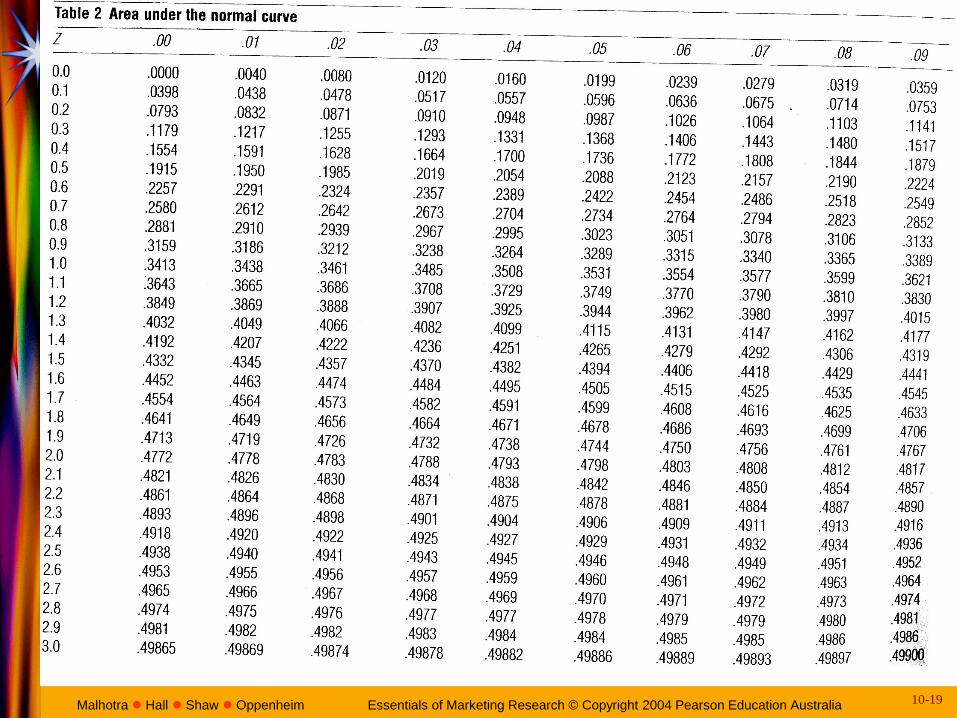
10-19 Malhotra Hall Shaw Oppenheim Essentials of Marketing Research © Copyright 2004 Pearson Education Australia
Page 20
10-20 Malhotra Hall Shaw Oppenheim Essentials of Marketing Research © Copyright 2004 Pearson Education Australia
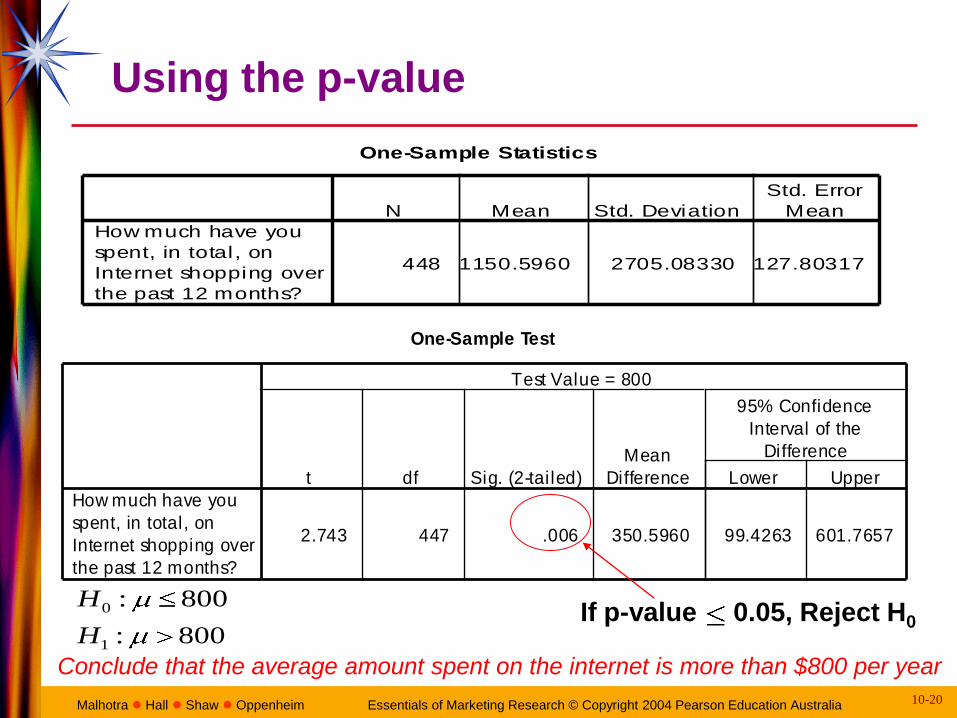
Using the p-value
One-Sample Statistics
448 1150.5960 2705.08330 127.80317
How much have you
spent, in total, on
Internet shopping over
the past 12 months?
N Mean Std. Deviation
Std. Error
Mean
One-Sample Test
2.743 447 .006 350.5960 99.4263 601.7657
How much have you
spent, in total, on
Internet shopping over
the past 12 months?
t df Sig. (2-tai led)
Mean
Difference Lower Upper
95% Confidence
Interval of the
Difference
Test Value = 800
If p-value 0.05, Reject H0
Conclude that the average amount spent on the internet is more than $800 per year
800:
800:
1
0
H
H
Page 21
10-21 Malhotra Hall Shaw Oppenheim Essentials of Marketing Research © Copyright 2004 Pearson Education Australia
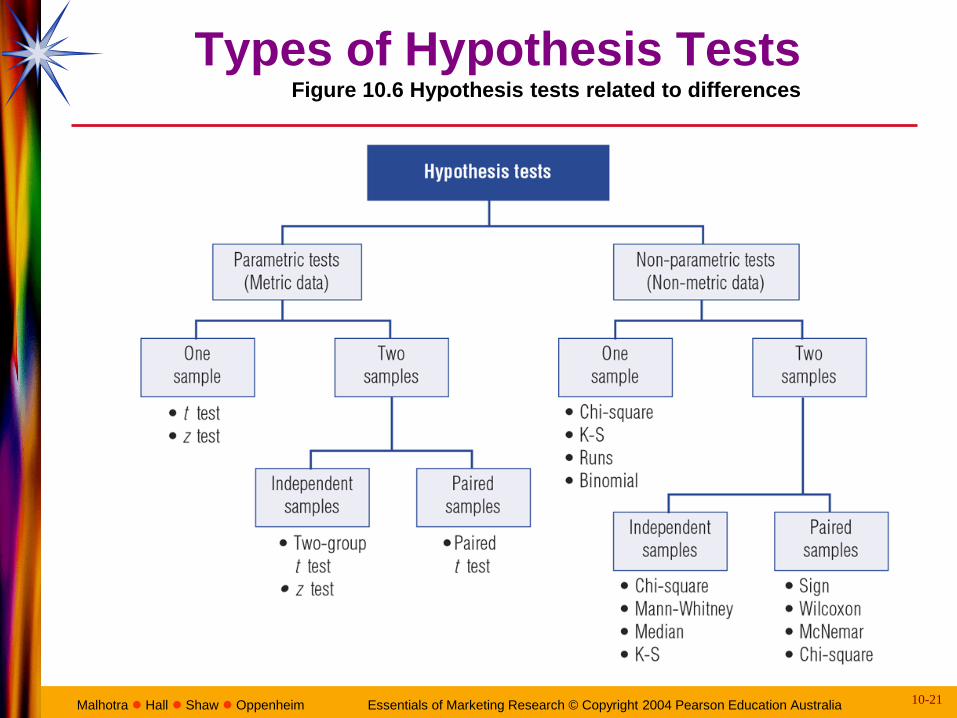
Types of Hypothesis Tests Figure 10.6 Hypothesis tests related to differences
Page 22
10-22 Malhotra Hall Shaw Oppenheim Essentials of Marketing Research © Copyright 2004 Pearson Education Australia
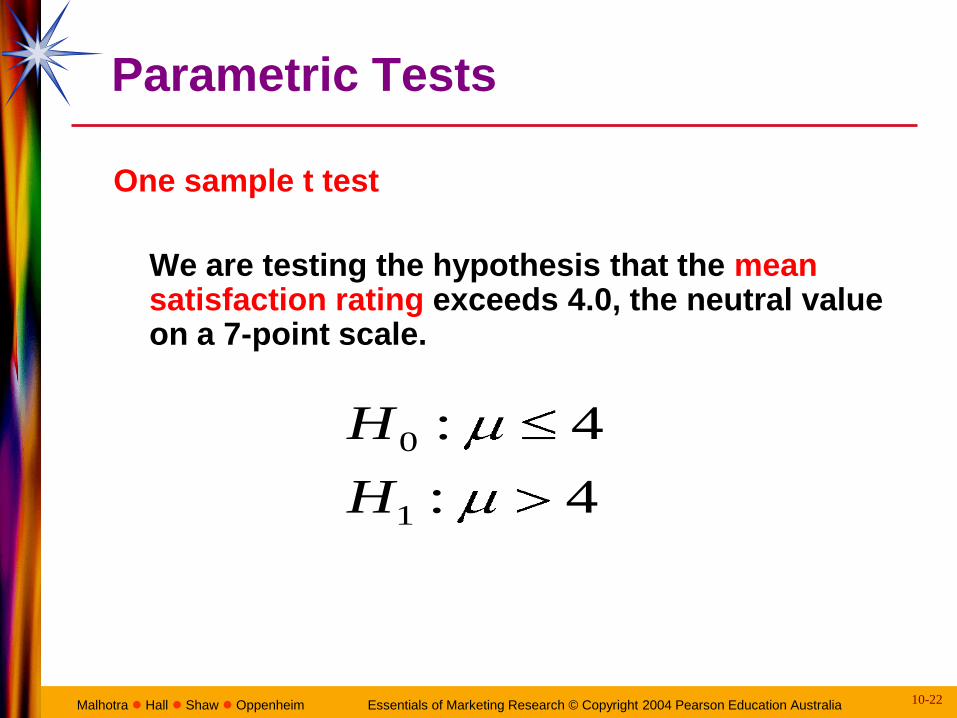
Parametric Tests
One sample t test
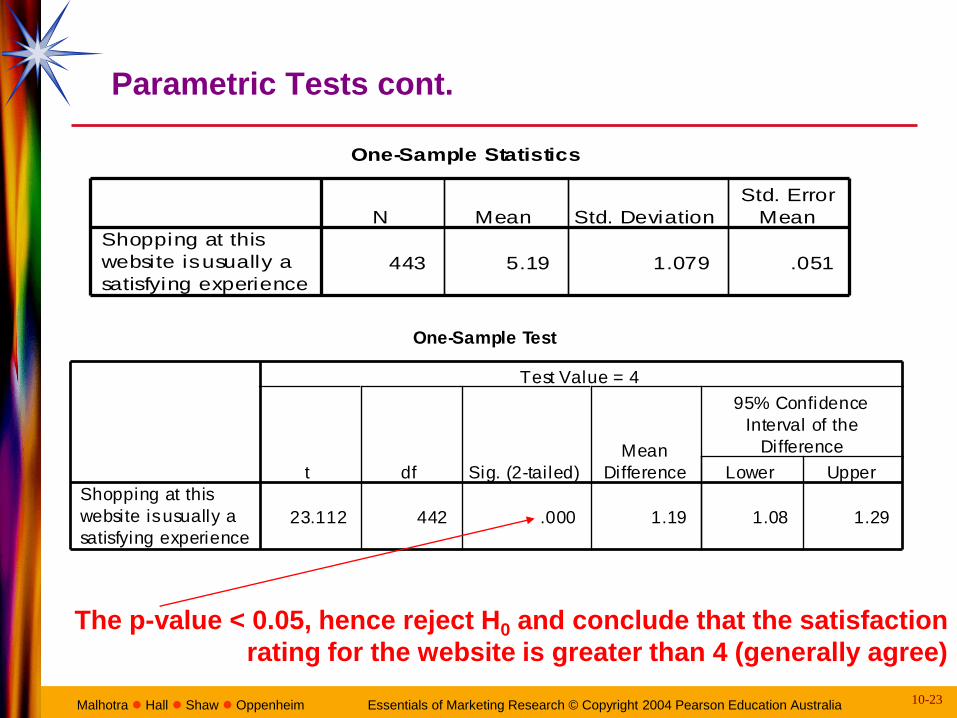
We are testing the hypothesis that the mean satisfaction rating exceeds 4.0, the neutral value on a 7-point scale.
4:
4:
1
0
H
H
Page 23
10-23 Malhotra Hall Shaw Oppenheim Essentials of Marketing Research © Copyright 2004 Pearson Education Australia
Parametric Tests cont.
One-Sample Statistics
443 5.19 1.079 .051
Shopping at this
website is usually a
satisfying experience
N Mean Std. Deviation
Std. Error
Mean
One-Sample Test
23.112 442 .000 1.19 1.08 1.29
Shopping at this
website is usually a
satisfying experience
t df Sig. (2-tailed)
Mean
Difference Lower Upper
95% Confidence
Interval of the
Difference
Test Value = 4
The p-value < 0.05, hence reject H0 and conclude that the satisfaction
rating for the website is greater than 4 (generally agree)
Page 24
10-24 Malhotra Hall Shaw Oppenheim Essentials of Marketing Research © Copyright 2004 Pearson Education Australia
Parametric Tests cont.
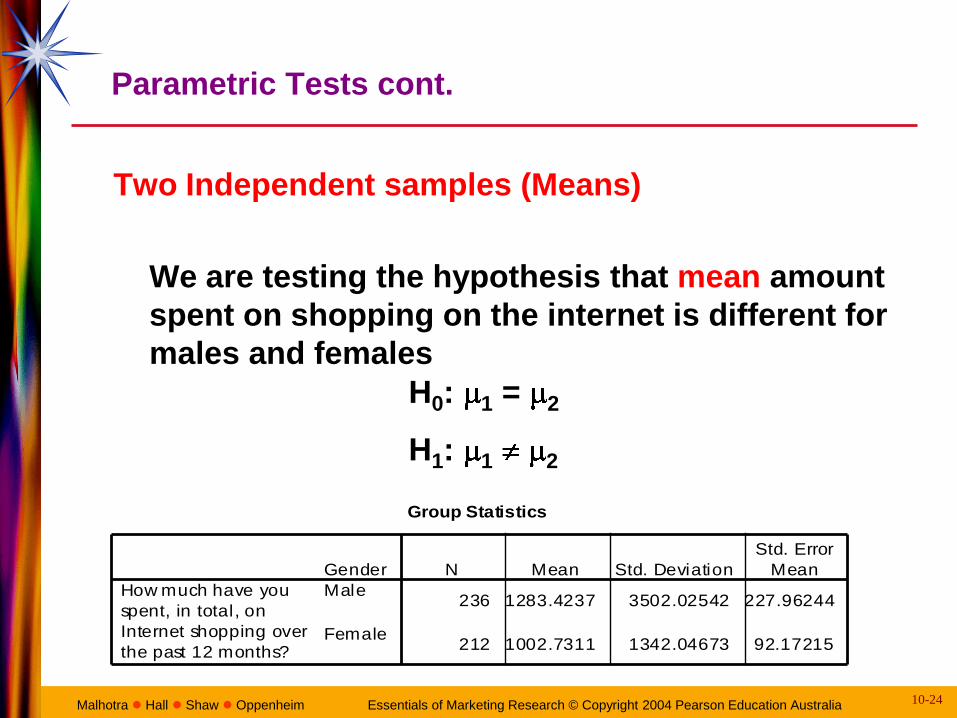
Two Independent samples (Means)
We are testing the hypothesis that mean amount
spent on shopping on the internet is different for
males and females
H0: 1 = 2
H1: 1 2
Group Statistics
236 1283.4237 3502.02542 227.96244
212 1002.7311 1342.04673 92.17215
Gender
Male
Female
How much have you
spent, in total, on
Internet shopping over
the past 12 months?
N Mean Std. Deviation
Std. Error
Mean
Page 25
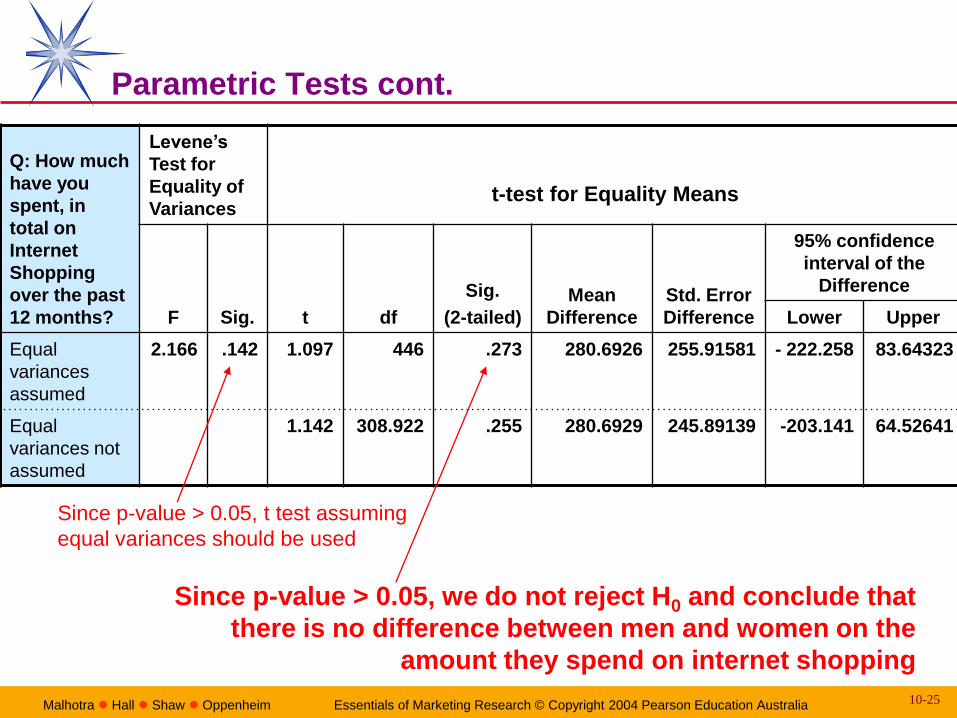
Q: How much
have you
spent, in
total on
Internet
Shopping
over the past
12 months?
Levene’s
Test for
Equality of
Variances
t-test for Equality Means
F Sig. t df
Sig.
(2-tailed)
Mean
Difference
Std. Error
Difference
95% confidence
interval of the
Difference
Lower Upper
Equal
variances
assumed
2.166 .142 1.097 446 .273 280.6926 255.91581 - 222.258 83.64323
Equal
variances not
assumed
1.142 308.922 .255 280.6929 245.89139 -203.141 64.52641
Parametric Tests cont.
Since p-value > 0.05, t test assuming
equal variances should be used
Since p-value > 0.05, we do not reject H0 and conclude that
there is no difference between men and women on the
amount they spend on internet shopping
10-25 Malhotra Hall Shaw Oppenheim Essentials of Marketing Research © Copyright 2004 Pearson Education Australia
Page 26
10-26 Malhotra Hall Shaw Oppenheim Essentials of Marketing Research © Copyright 2004 Pearson Education Australia
Parametric Tests cont.
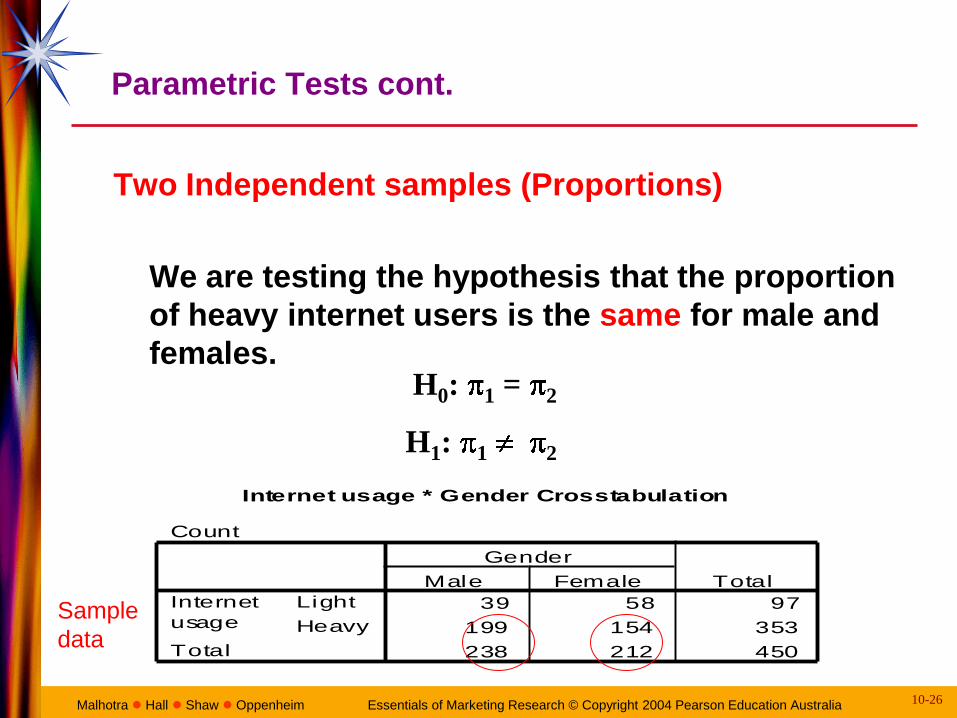
Two Independent samples (Proportions)
We are testing the hypothesis that the proportion
of heavy internet users is the same for male and
females.
H0: 1 = 2
H1: 1 2
Internet usage * Gender Crosstabulation
Count
39 58 97
199 154 353
238 212 450
Light
Heavy
Internet
usage
Total
Male Female
Gender
Total
Sample
data
Page 27
10-27 Malhotra Hall Shaw Oppenheim Essentials of Marketing Research © Copyright 2004 Pearson Education Australia
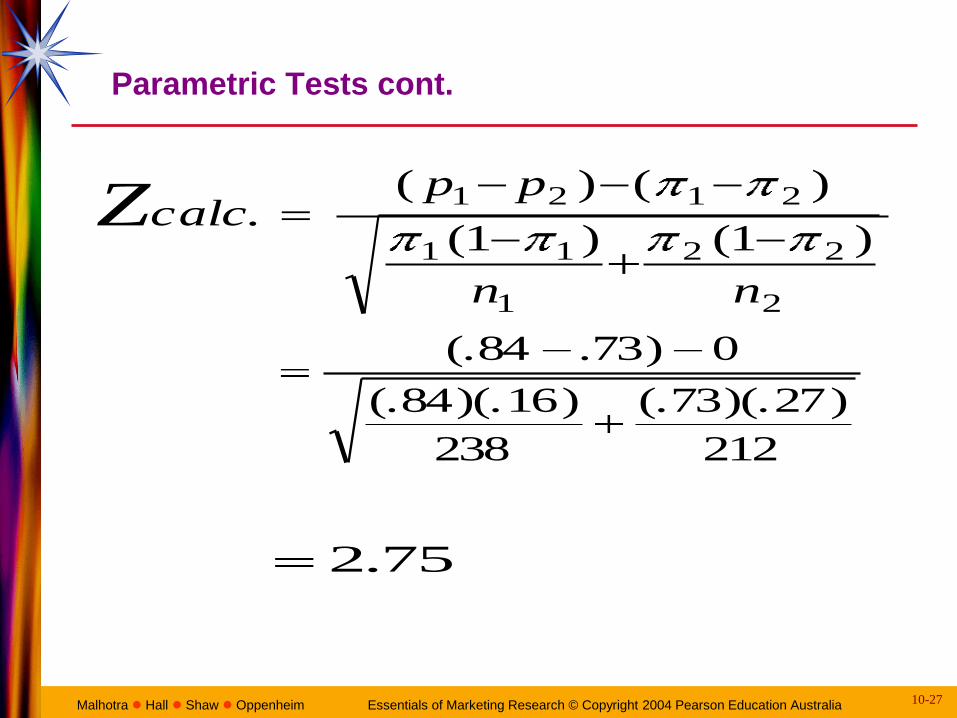
Parametric Tests cont.
2
22
1
11
2121
)1()1(
)()(.
nn
ppcalcZ
212
)27)(.73(.
238
)16)(.84(.
0)73.84(.
75.2
Page 28
10-28 Malhotra Hall Shaw Oppenheim Essentials of Marketing Research © Copyright 2004 Pearson Education Australia
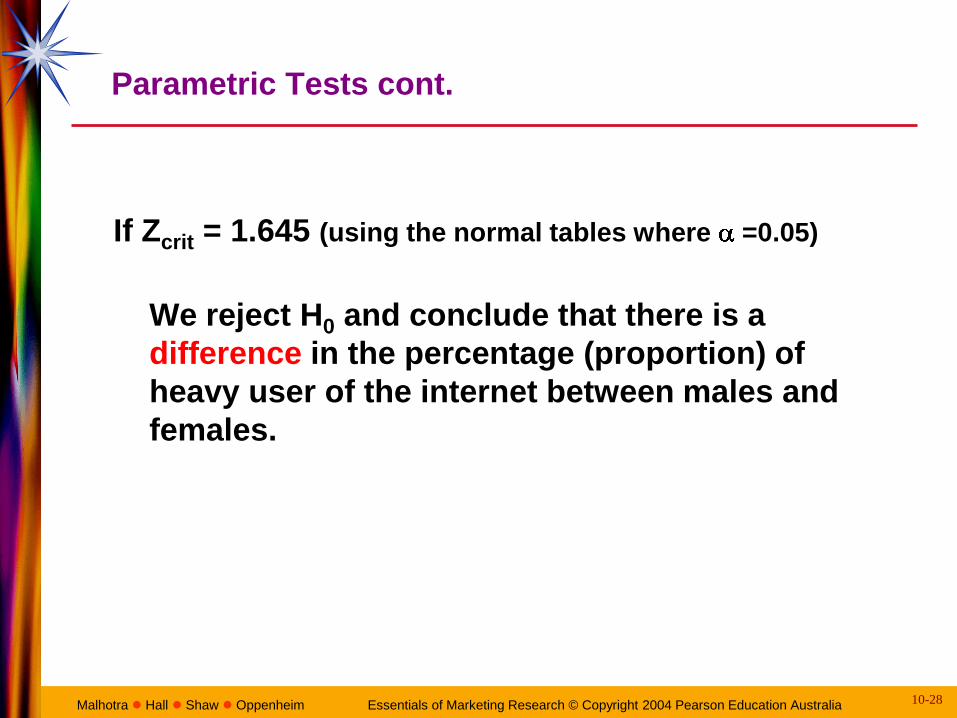
Parametric Tests cont.
If Zcrit = 1.645 (using the normal tables where =0.05)
We reject H0 and conclude that there is a
difference in the percentage (proportion) of
heavy user of the internet between males and
females.
Page 29
10-29 Malhotra Hall Shaw Oppenheim Essentials of Marketing Research © Copyright 2004 Pearson Education Australia
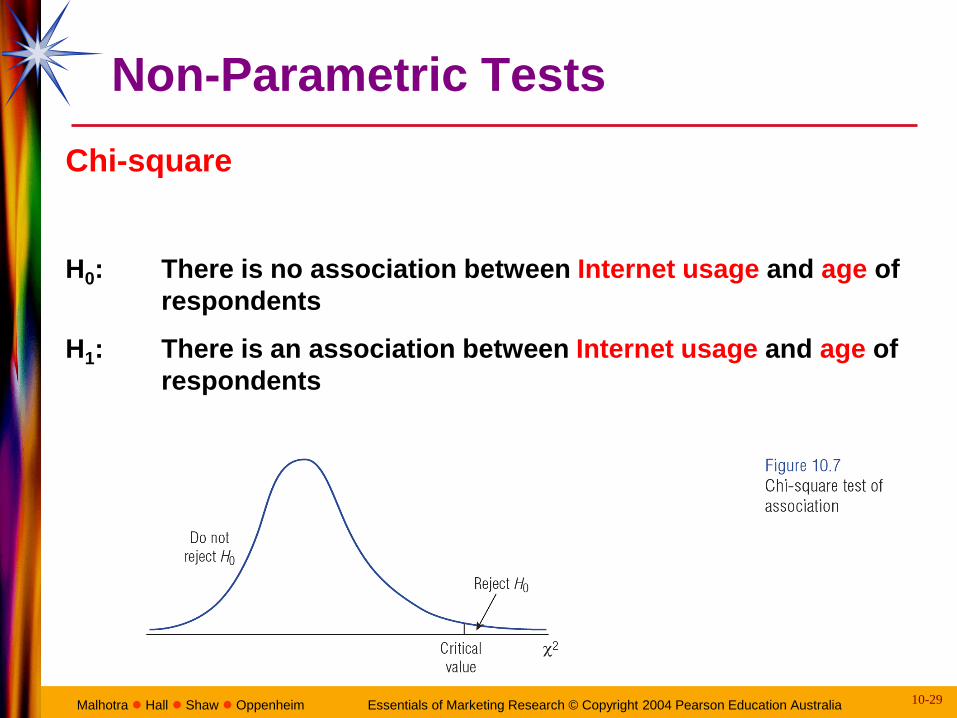
Non-Parametric Tests
Chi-square
H0: There is no association between Internet usage and age of
respondents
H1: There is an association between Internet usage and age of
respondents
Page 30
10-30 Malhotra Hall Shaw Oppenheim Essentials of Marketing Research © Copyright 2004 Pearson Education Australia
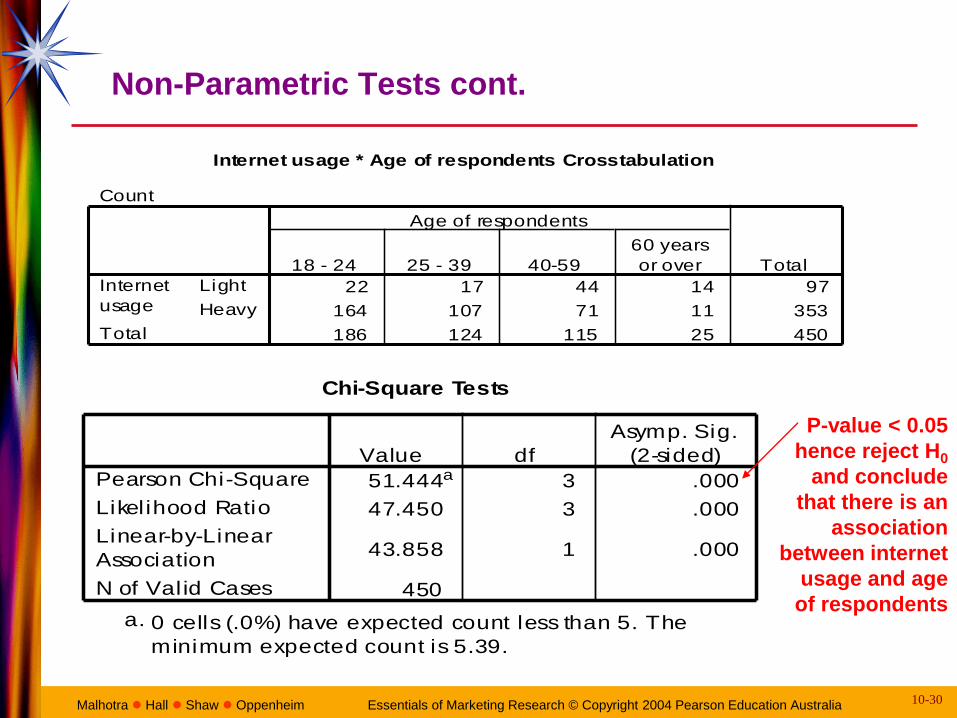
Non-Parametric Tests cont.
Internet usage * Age of respondents Crosstabulation
Count
22 17 44 14 97
164 107 71 11 353
186 124 115 25 450
Light
Heavy
Internet
usage
Total
18 - 24 25 - 39 40-59
60 years
or over
Age of respondents
Total
Chi-Square Tests
51.444a 3 .000
47.450 3 .000
43.858 1 .000
450
Pearson Chi-Square
Likelihood Ratio
Linear-by-Linear
Association
N of Valid Cases
Value df
Asymp. Sig.
(2-sided)
0 cells (.0%) have expected count less than 5. The
minimum expected count is 5.39.
a.
P-value < 0.05
hence reject H0
and conclude
that there is an
association
between internet
usage and age
of respondents