1
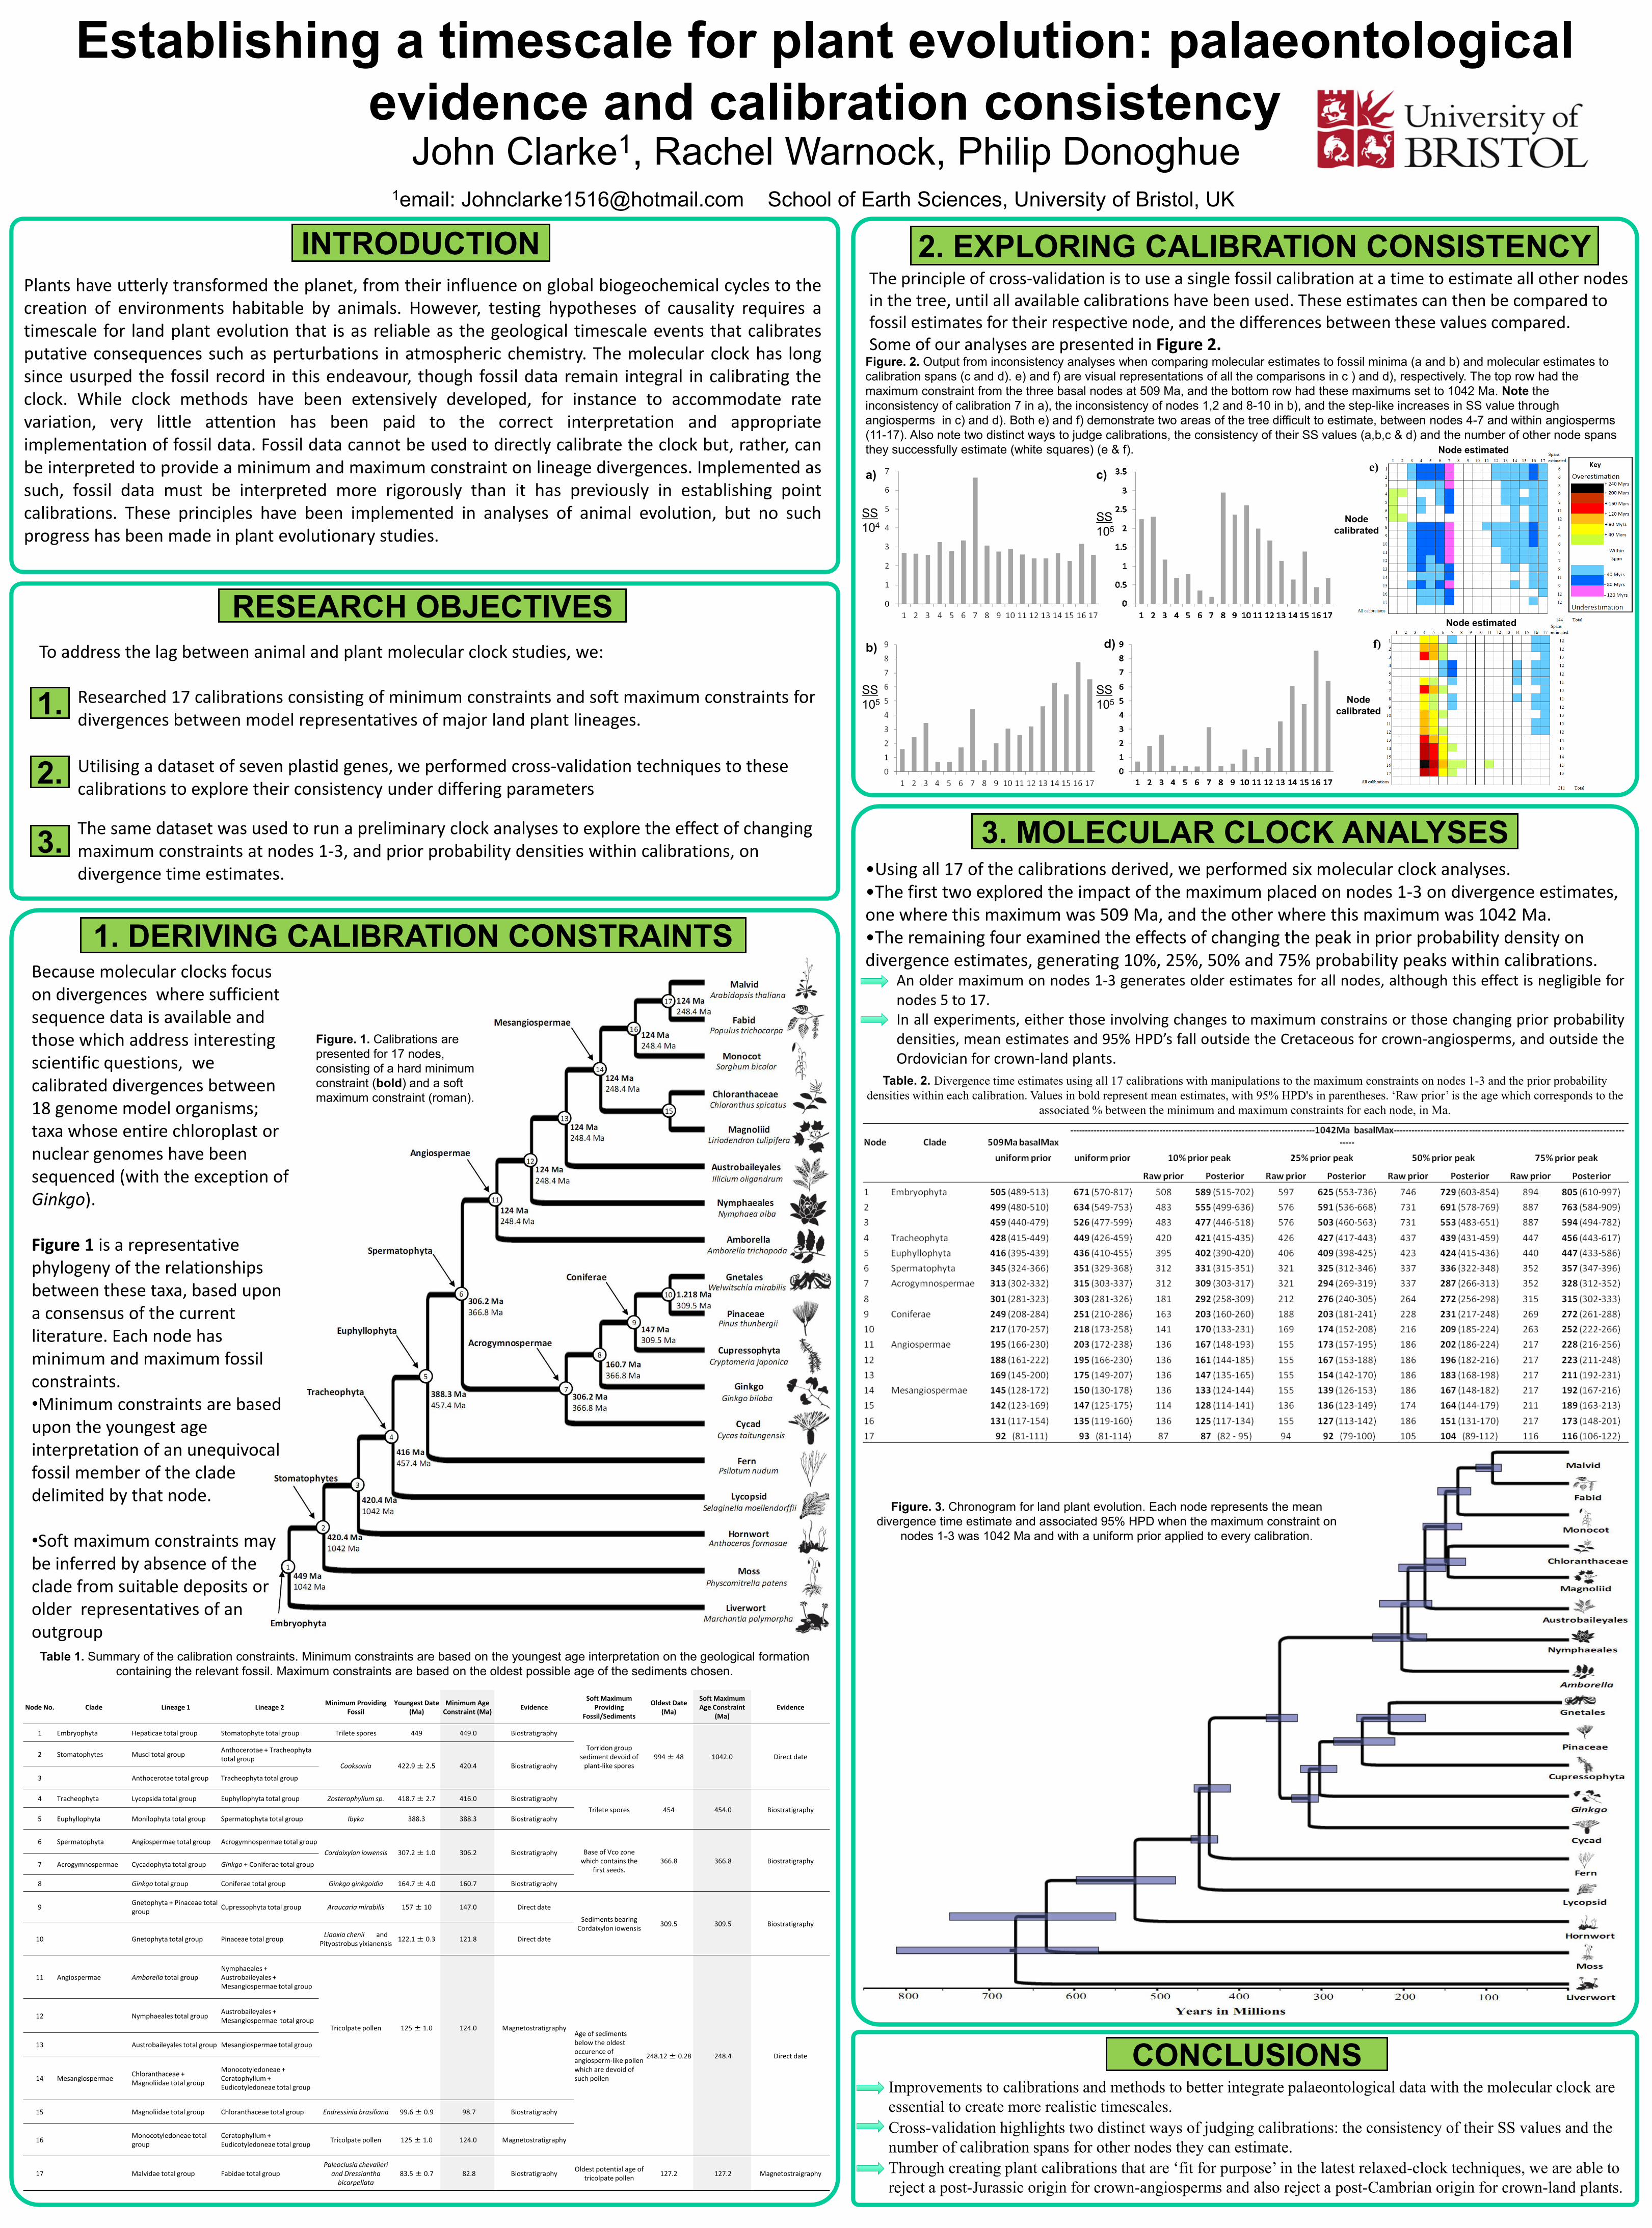
Establishing a timescale for plant evolution: palaeontological evidence and calibration consistency John Clarke 1 , Rachel Warnock, Philip Donoghue 1 email: [email protected] School of Earth Sciences, University of Bristol, UK, K 3. MOLECULAR CLOCK ANALYSES CONCLUSIONS CONCLUSIONS 2. EXPLORING CALIBRATION CONSISTENCY Table 1. Summary of the calibration constraints. Minimum constraints are based on the youngest age interpretation on the geological formation containing the relevant fossil. Maximum constraints are based on the oldest possible age of the sediments chosen. INTRODUCTION Figure. 2. Output from inconsistency analyses when comparing molecular estimates to fossil minima (a and b) and molecular estimates to calibration spans (c and d). e) and f) are visual representations of all the comparisons in c ) and d), respectively. The top row had the maximum constraint from the three basal nodes at 509 Ma, and the bottom row had these maximums set to 1042 Ma. Note the inconsistency of calibration 7 in a), the inconsistency of nodes 1,2 and 8-10 in b), and the step-like increases in SS value through angiosperms in c) and d). Both e) and f) demonstrate two areas of the tree difficult to estimate, between nodes 4-7 and within angiosperms (11-17). Also note two distinct ways to judge calibrations, the consistency of their SS values (a,b,c & d) and the number of other node spans they successfully estimate (white squares) (e & f). RESEARCH OBJECTIVES RESEARCH OBJECTIVES Plants have utterly transformed the planet, from their influence on global biogeochemical cycles to the creation of environments habitable by animals. However, testing hypotheses of causality requires a timescale for land plant evolution that is as reliable as the geological timescale events that calibrates putative consequences such as perturbations in atmospheric chemistry. The molecular clock has long since usurped the fossil record in this endeavour, though fossil data remain integral in calibrating the clock. While clock methods have been extensively developed, for instance to accommodate rate variation, very little attention has been paid to the correct interpretation and appropriate implementation of fossil data. Fossil data cannot be used to directly calibrate the clock but, rather, can be interpreted to provide a minimum and maximum constraint on lineage divergences. Implemented as such, fossil data must be interpreted more rigorously than it has previously in establishing point calibrations. These principles have been implemented in analyses of animal evolution, but no such progress has been made in plant evolutionary studies. To address the lag between animal and plant molecular clock studies, we: 1. 1. Improvements to calibrations and methods to better integrate palaeontological data with the molecular clock are essential to create more realistic timescales. Node calibrated Node estimated Node calibrated SS 10 5 Node calibrated Node estimated •Using all 17 of the calibrations derived, we performed six molecular clock analyses. •The first two explored the impact of the maximum placed on nodes 1-3 on divergence estimates, one where this maximum was 509 Ma, and the other where this maximum was 1042 Ma. •The remaining four examined the effects of changing the peak in prior probability density on divergence estimates, generating 10%, 25%, 50% and 75% probability peaks within calibrations. 2. 2. 3. 3. The same dataset was used to run a preliminary clock analyses to explore the effect of changing maximum constraints at nodes 1-3, and prior probability densities within calibrations, on divergence time estimates. Utilising a dataset of seven plastid genes, we performed cross-validation techniques to these calibrations to explore their consistency under differing parameters Researched 17 calibrations consisting of minimum constraints and soft maximum constraints for divergences between model representatives of major land plant lineages. 1. DERIVING CALIBRATION CONSTRAINTS Because molecular clocks focus on divergences where sufficient sequence data is available and those which address interesting scientific questions, we calibrated divergences between 18 genome model organisms; taxa whose entire chloroplast or nuclear genomes have been sequenced (with the exception of Ginkgo). Figure 1 is a representative phylogeny of the relationships between these taxa, based upon a consensus of the current literature. Each node has minimum and maximum fossil constraints. •Minimum constraints are based upon the youngest age interpretation of an unequivocal fossil member of the clade delimited by that node. •Soft maximum constraints may be inferred by absence of the clade from suitable deposits or older representatives of an outgroup The principle of cross-validation is to use a single fossil calibration at a time to estimate all other nodes in the tree, until all available calibrations have been used. These estimates can then be compared to fossil estimates for their respective node, and the differences between these values compared. Some of our analyses are presented in Figure 2. a) b) d) c) f) e) Cross-validation highlights two distinct ways of judging calibrations: the consistency of their SS values and the number of calibration spans for other nodes they can estimate. Through creating plant calibrations that are ‘fit for purpose’ in the latest relaxed-clock techniques, we are able to reject a post-Jurassic origin for crown-angiosperms and also reject a post-Cambrian origin for crown-land plants. Node No. Clade Lineage 1 Lineage 2 Minimum Providing Fossil Youngest Date (Ma) Minimum Age Constraint (Ma) Evidence Soft Maximum Providing Fossil/Sediments Oldest Date (Ma) Soft Maximum Age Constraint (Ma) Evidence 1 Embryophyta Hepaticae total group Stomatophyte total group Trilete spores 449 449.0 Biostratigraphy Torridon group sediment devoid of plant-like spores 994 ± 48 1042.0 Direct date 2 Stomatophytes Musci total group Anthocerotae + Tracheophyta total group Cooksonia 422.9 ± 2.5 420.4 Biostratigraphy 3 Anthocerotae total group Tracheophyta total group 4 Tracheophyta Lycopsida total group Euphyllophyta total group Zosterophyllum sp. 418.7 ± 2.7 416.0 Biostratigraphy Trilete spores 454 454.0 Biostratigraphy 5 Euphyllophyta Monilophyta total group Spermatophyta total group Ibyka 388.3 388.3 Biostratigraphy 6 Spermatophyta Angiospermae total group Acrogymnospermae total group Cordaixylon iowensis 307.2 ± 1.0 306.2 Biostratigraphy Base of Vco zone which contains the first seeds. 366.8 366.8 Biostratigraphy 7 Acrogymnospermae Cycadophyta total group Ginkgo + Coniferae total group 8 Ginkgo total group Coniferae total group Ginkgo ginkgoidia 164.7 ± 4.0 160.7 Biostratigraphy 9 Gnetophyta + Pinaceae total group Cupressophyta total group Araucaria mirabilis 157 ± 10 147.0 Direct date Sediments bearing Cordaixylon iowensis 309.5 309.5 Biostratigraphy 10 Gnetophyta total group Pinaceae total group Liaoxia chenii and Pityostrobus yixianensis 122.1 ± 0.3 121.8 Direct date 11 Angiospermae Amborella total group Nymphaeales + Austrobaileyales + Mesangiospermae total group Tricolpate pollen 125 ± 1.0 124.0 Magnetostratigraphy Age of sediments below the oldest occurence of angiosperm-like pollen which are devoid of such pollen 248.12 ± 0.28 248.4 Direct date 12 Nymphaeales total group Austrobaileyales + Mesangiospermae total group 13 Austrobaileyales total group Mesangiospermae total group 14 Mesangiospermae Chloranthaceae + Magnoliidae total group Monocotyledoneae + Ceratophyllum + Eudicotyledoneae total group 15 Magnoliidae total group Chloranthaceae total group Endressinia brasiliana 99.6 ± 0.9 98.7 Biostratigraphy 16 Monocotyledoneae total group Ceratophyllum + Eudicotyledoneae total group Tricolpate pollen 125 ± 1.0 124.0 Magnetostratigraphy 17 Malvidae total group Fabidae total group Paleoclusia chevalieri and Dressiantha bicarpellata 83.5 ± 0.7 82.8 Biostratigraphy Oldest potential age of tricolpate pollen 127.2 127.2 Magnetostraigraphy Table. 2. Divergence time estimates using all 17 calibrations with manipulations to the maximum constraints on nodes 1-3 and the prior probability densities within each calibration. Values in bold represent mean estimates, with 95% HPD's in parentheses. ‘Raw prior’ is the age which corresponds to the associated % between the minimum and maximum constraints for each node, in Ma. SS 10 4 SS 10 5 SS 10 5 Figure. 3. Chronogram for land plant evolution. Each node represents the mean divergence time estimate and associated 95% HPD when the maximum constraint on nodes 1-3 was 1042 Ma and with a uniform prior applied to every calibration. Figure. 1. Calibrations are presented for 17 nodes, consisting of a hard minimum constraint (bold) and a soft maximum constraint (roman). An older maximum on nodes 1-3 generates older estimates for all nodes, although this effect is negligible for nodes 5 to 17. In all experiments, either those involving changes to maximum constrains or those changing prior probability densities, mean estimates and 95% HPD’s fall outside the Cretaceous for crown-angiosperms, and outside the Ordovician for crown-land plants.