Fall 2012 The Fluid Journal 14 Study includes major vegetable and fruit crops grown on calcareous soils in Texas. Establishing Realistic Nutrient Removal Values For Major Crops The Fluid Journal • Official Journal of the Fluid Fertilizer Foundation • Fall 2012 • Vol. 20, No. 4, Issue# 78 T he impacts of fertilizer use on crop productivity and basic nutritional quality parameters (proteins, minerals, vitamins, and essential oils) are well documented. Relatively high levels of fertilizer applications are required to ensure adequate yields and quality of many high-value crops. During the course of the growing season, crops take up and accumulate various nutrients in biomass, some of which are eventually removed from the site with harvested products. Nutrients in crop residues that are left in the field can partially add to soil nutrient reserves as the residues decompose. Information regarding crop nutrient removal amounts is essential in determining the amounts that must be reapplied to sustain yields and quality while maintaining soil fertility. Nutrient uptake is influenced by soil, climate, and plant factors. Low soil moisture, poor aeration due to compaction or excessive moisture, low soil temperatures, unfavorable pH conditions in the root zone, nutrient imbalances, and other factors may restrict uptake of plant nutrients. Plant factors such as rooting density and growth rate as well as soil nutrient imbalances can also limit nutrient uptake rates and eventually result in poor crop yields and quality even though soils contain adequate nutrient levels. This is often the case in the predominantly calcareous soils in South Texas and other major production regions where excessive levels of soil calcium (Ca) and magnesium (Mg) can interfere with the availability and uptake of potassium (K), leading to an apparent K deficiency. Information regarding nutrient removal amounts is essential in establishing accurate crop requirements (amounts) as well as the appropriate placement, application methods, and times. Summary: Selected for this study were major fruit and vegetable crops grown on calcareous soils in South Texas. Nutrient removal amounts were estimated for spring-grown muskmelons (2011) and onions planted in the fall (October) and harvested in the spring (April, 2009). Removal rates by grapefruits from commercial orchards were also estimated. Preplant soil N, P 2 O 5 and K 2 O test levels were slightly lower in 2011 than in previous years. Melon yields ranged from 11 to 19 t.A -1 and were generally greater than those recorded in 2009. Estimated nutrient removal amounts in 2011 ranged from N at 45 to 84 lbs/A, P at 7 to 17 lbs/A and K at 60 to 128 lbs/A compared to N at 18 to 37 lbs/A, P at 7 to 11 lbs/A and K at 44 to 90 lbs/A in 2009. Nutrient removal estimates for sweet onion were also higher in 2011 than in 2009, consistent with higher yields in 2011. Grapefruit yields averaged 311 eighty-pound boxes per acre (12.4 tons/A of fresh fruit) and nutrient removal estimates ranged from 24 to 31 lbs/A of N, 6 to 9 lbs/A of P, and 60 to 71 lbs/A of K. Dr. John Jifon
Transcript
Fall 2012 The Fluid Journal 14
Study includes major vegetable and fruit crops grown on calcareous soils in Texas.
Establishing Realistic Nutrient Removal Values For Major Crops
The Fluid Journal • Offi cial Journal of the Fluid Fertilizer Foundation • Fall 2012 • Vol. 20, No. 4, Issue# 78
The impacts of fertilizer use on crop productivity and basic nutritional
quality parameters (proteins, minerals, vitamins, and essential oils) are well documented. Relatively high levels of fertilizer applications are required to ensure adequate yields and quality of many high-value crops. During the course of the growing season, crops take up and accumulate various nutrients in biomass, some of which are eventually removed from the site with harvested products. Nutrients in crop residues that are left in the fi eld can partially add to soil nutrient reserves as the residues decompose. Information
regarding crop nutrient removal amounts is essential in determining the amounts that must be reapplied to sustain yields and quality while maintaining soil fertility. Nutrient uptake is infl uenced by soil, climate, and plant factors. Low soil moisture, poor aeration due to compaction or excessive moisture, low soil temperatures, unfavorable pH conditions in the root zone, nutrient imbalances, and other factors may restrict uptake of plant nutrients. Plant factors such as rooting density and growth rate as well as soil nutrient imbalances can also limit nutrient uptake
rates and eventually result in poor crop yields and quality even though soils contain adequate nutrient levels. This is often the case in the predominantly calcareous soils in South Texas and other major production regions where excessive levels of soil calcium (Ca) and magnesium (Mg) can interfere with the availability and uptake of potassium (K), leading to an apparent K defi ciency. Information regarding nutrient removal amounts is essential in establishing accurate crop requirements (amounts) as well as the appropriate placement, application methods, and times.
Summary: Selected for this study were major fruit and vegetable crops grown on calcareous soils in South Texas. Nutrient removal amounts were estimated for spring-grown muskmelons (2011) and onions planted in the fall (October) and harvested in the spring (April, 2009). Removal rates by grapefruits from commercial orchards were also estimated. Preplant soil N, P2O5 and K2O test levels were slightly lower in 2011 than in previous years. Melon yields ranged from 11 to 19 t.A-1 and were generally greater than those recorded in 2009. Estimated nutrient removal amounts in 2011 ranged from N at 45 to 84 lbs/A, P at 7 to 17 lbs/A and K at 60 to 128 lbs/A compared to N at 18 to 37 lbs/A, P at 7 to 11 lbs/A and K at 44 to 90 lbs/A in 2009. Nutrient removal estimates for sweet onion were also higher in 2011 than in 2009, consistent with higher yields in 2011. Grapefruit yields averaged 311 eighty-pound boxes per acre (12.4 tons/A of fresh fruit) and nutrient removal estimates ranged from 24 to 31 lbs/A of N, 6 to 9 lbs/A of P, and 60 to 71 lbs/A of K.
Dr. John Jifon
15 The Fluid Journal Fall 2012
Nutrient removal estimates for most fruits and vegetable crops are limited and where available, they are region specific.
Project objective The objectives of this long-term project are to:• Obtain nutrient removal values for
major fruit and vegetable crops grown on calcareous soils in South Texas
• Use this information in developing guidelines for nutrient management to assure yield and quality
• Make variety recommendations for specific sites based on their nutrient accumulation/removal capacities.
Methodology Sampling. Commercial melons (cantaloupe) and sweet onions grown on a calcareous soil (heavy-textured Harlingen clay, average pH 7.6) were sampled in 2009 and 2011. Grapefruits grown on a similar soil type were also sampled in the 2010-2011 harvest season. Soil samples were collected from each site from the top 30 cm soil layers for residual nutrient analysis prior to planting (melons and onions) or at the beginning of the season (grapefruit). Vegetative tissues (leaves/petioles and stems) were sampled before and after fruit set/bulb initiation for mineral analysis. Samples were rinsed with distilled water, dried (70o C for 48 h), ground in a Wiley mill to pass a 40-µm screen and ashed (500o C, 5 h), before tissue analysis. At harvest, vegetative tissues and marketable fruits and onion
Table 1. Average values of preplant soil mineral concentrations for each crop (from the 0-30 cm soil depth).
Crop Soil Organic Matter % pH NO3-N P K Ca Mg
(mg·kg-1)
2009
Melon 2.3 8.2 71 57.4 524 16300 646
Onions 1.7 7.1 49.2 48.3 788 12802 502
2011
Melon 1.1 7.7 44.2 75.2 719.4 17864.9 699.2
Onions 1.2 8.6 36.1 67.3 801.6 12602.7 584.2
Grapefruit 1.9 7.8 104.6 40.2 416.2 3628 417
Table 2: Average whole leaf macro- and micronutrient concentrations at late, pre-harvest growth stages of melon, onions and grape-fruits grown on calcareous soils in south Texas.
bulbs were sampled, weighed and analyzed for mineral contents. Soils in the commercial melon and sweet onion field were predominantly calcareous (average pH 7.9) and heavy-textured (Harlingen clay) as shown in Table 1. Soil type for the grapefruit orchard was also Harlingen clay (average pH 7.8). Timing. In all the study years, onions were planted in mid-October and harvested in late April. Melons were planted in early spring (February-March) and harvested in late May. Management. All fields were managed following standard commercial practices, including raised beds and subsurface drip fertigation of onions and melons. Raised beds for melon production wee also covered with plastic mulch. Grapefruit orchards sampled had mature trees (8.5 years old) that were flood irrigated. Standard nutrient management and pest control
procedures for each crop were followed. Tissues. Total N concentration of tissues was analyzed by the Kjeldahl method. Mineral nutrient concentrations (phosphorus (P), K, Ca, Mg) were analyzed by inductively coupled plasma (ICP) emission spectroscopy, following tissue digestion with nitric acid and hydrogen peroxide. Nutrient removal amounts were estimated from fruit/bulb yields, dry matter, and mineral nutrient concentrations.
Overview Concentrations. Soil mineral concentrations determined prior to planting in 2011 were generally lower than those found in 2009 (Table 1). However, these levels, except for nitrogen (N), were substantially higher than sufficiency ranges. Mineral nutrient concentrations in vegetative tissues measured just prior to harvest were significantly lower than sufficiency levels for each of the three
Fall 2012 The Fluid Journal 16
Table 1. Average values of preplant soil mineral concentrations for each crop (from the 0-30 cm soil depth).
Crop Soil Organic Matter % pH NO3-N P K Ca Mg
(mg·kg-1)
2009
Melon 2.3 8.2 71 57.4 524 16300 646
Onions 1.7 7.1 49.2 48.3 788 12802 502
2011
Melon 1.1 7.7 44.2 75.2 719.4 17864.9 699.2
Onions 1.2 8.6 36.1 67.3 801.6 12602.7 584.2
Grapefruit 1.9 7.8 104.6 40.2 416.2 3628 417
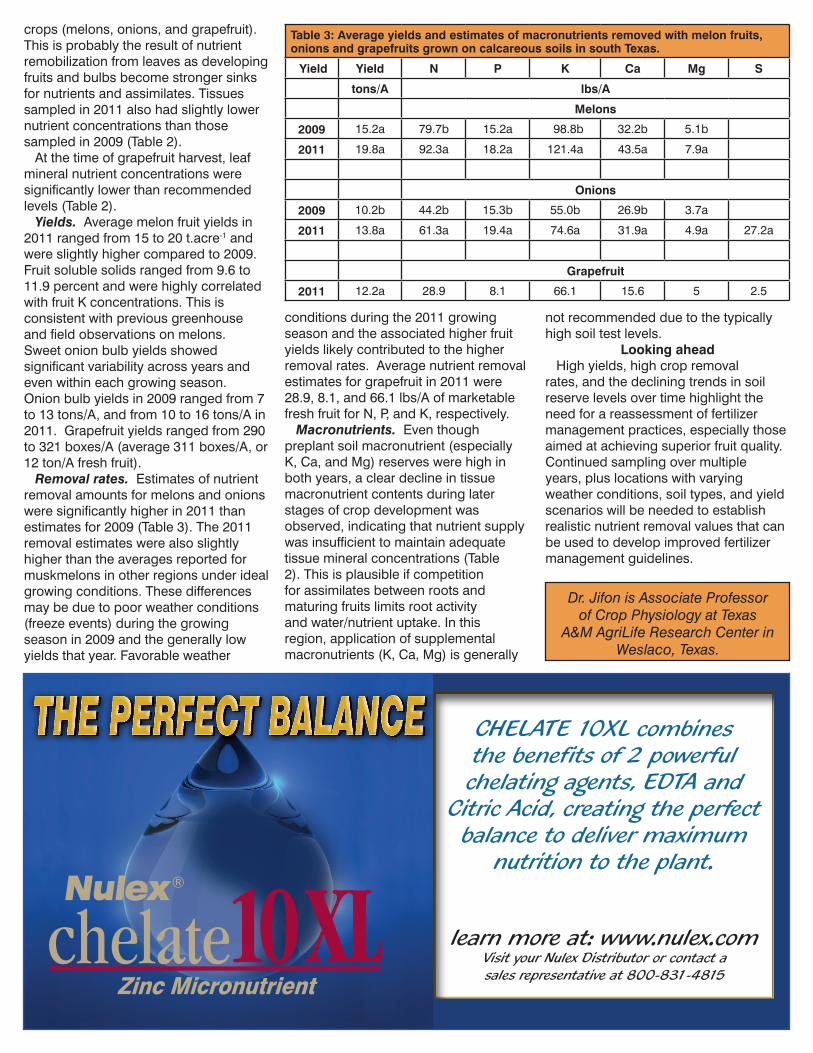
Table 3: Average yields and estimates of macronutrients removed with melon fruits, onions and grapefruits grown on calcareous soils in south Texas.
Yield Yield N P K Ca Mg S
tons/A lbs/A
Melons
2009 15.2a 79.7b 15.2a 98.8b 32.2b 5.1b
2011 19.8a 92.3a 18.2a 121.4a 43.5a 7.9a
Onions
2009 10.2b 44.2b 15.3b 55.0b 26.9b 3.7a
2011 13.8a 61.3a 19.4a 74.6a 31.9a 4.9a 27.2a
Grapefruit
2011 12.2a 28.9 8.1 66.1 15.6 5 2.5
crops (melons, onions, and grapefruit). This is probably the result of nutrient remobilization from leaves as developing fruits and bulbs become stronger sinks for nutrients and assimilates. Tissues sampled in 2011 also had slightly lower nutrient concentrations than those sampled in 2009 (Table 2). At the time of grapefruit harvest, leaf mineral nutrient concentrations were signifi cantly lower than recommended levels (Table 2). Yields. Average melon fruit yields in 2011 ranged from 15 to 20 t.acre-1 and were slightly higher compared to 2009. Fruit soluble solids ranged from 9.6 to 11.9 percent and were highly correlated with fruit K concentrations. This is consistent with previous greenhouse and fi eld observations on melons. Sweet onion bulb yields showed signifi cant variability across years and even within each growing season. Onion bulb yields in 2009 ranged from 7 to 13 tons/A, and from 10 to 16 tons/A in 2011. Grapefruit yields ranged from 290 to 321 boxes/A (average 311 boxes/A, or 12 ton/A fresh fruit). Removal rates. Estimates of nutrient removal amounts for melons and onions were signifi cantly higher in 2011 than estimates for 2009 (Table 3). The 2011 removal estimates were also slightly higher than the averages reported for muskmelons in other regions under ideal growing conditions. These differences may be due to poor weather conditions (freeze events) during the growing season in 2009 and the generally low yields that year. Favorable weather
conditions during the 2011 growing season and the associated higher fruit yields likely contributed to the higher removal rates. Average nutrient removal estimates for grapefruit in 2011 were 28.9, 8.1, and 66.1 lbs/A of marketable fresh fruit for N, P, and K, respectively. Macronutrients. Even though preplant soil macronutrient (especially K, Ca, and Mg) reserves were high in both years, a clear decline in tissue macronutrient contents during later stages of crop development was observed, indicating that nutrient supply was insuffi cient to maintain adequate tissue mineral concentrations (Table 2). This is plausible if competition for assimilates between roots and maturing fruits limits root activity and water/nutrient uptake. In this region, application of supplemental macronutrients (K, Ca, Mg) is generally
not recommended due to the typically high soil test levels.
Looking ahead High yields, high crop removal rates, and the declining trends in soil reserve levels over time highlight the need for a reassessment of fertilizer management practices, especially those aimed at achieving superior fruit quality. Continued sampling over multiple years, plus locations with varying weather conditions, soil types, and yield scenarios will be needed to establish realistic nutrient removal values that can be used to develop improved fertilizer management guidelines.
CHELATE 10XL combines the benefi ts of 2 powerful chelating agents, EDTA and
Citric Acid, creating the perfect balance to deliver maximum
nutrition to the plant.
learn more at: www.nulex.comVisit your Nulex Distributor or contact a sales representative at 800-831-4815
Dr. Jifon is Associate Professor of Crop Physiology at Texas