70
N on n h F 1,000 D S f W d’s M s 2012
| Date post: | 05-Apr-2018 |
| Category: |
Documents |
| Upload: | jose-carbonell-sanchez |
| View: | 219 times |
| Download: | 0 times |

7/31/2019 Estado Mundial de las Madres
http://slidepdf.com/reader/full/estado-mundial-de-las-madres 1/70
Non n h F 1,000 DS f Wd’s Ms 2012
7/31/2019 Estado Mundial de las Madres
http://slidepdf.com/reader/full/estado-mundial-de-las-madres 2/70
2 chapter title goeS here
Cs
Fwd by D. rjv S . . . . . . . . . . . . . . . . . . . . . . . . . . . . . . . . . . . . . . . . . . . . . . . . . . . 2
indun by cyn Ms . . . . . . . . . . . . . . . . . . . . . . . . . . . . . . . . . . . . . . . . . . . . . . . . . 3
exuv Summy: Ky Fndns nd rmmndns . . . . . . . . . . . . . . . . . . . . . . . 5
Wy Fus n Fs 1,000 Dys? . . . . . . . . . . . . . . . . . . . . . . . . . . . . . . . . . . . . . . . . . . 11
t gb Mnun css . . . . . . . . . . . . . . . . . . . . . . . . . . . . . . . . . . . . . . . . . . . . . . . 15Svn lvs nd Budn B Fuu: lw-cs Suns t Wk . . . . . 23
• t lfsvn Sx . . . . . . . . . . . . . . . . . . . . . . . . . . . . . . . . . . . . . . . . . . . . . . . . . . . . . . . . . 23
• infn nd tdd Fdn Sd . . . . . . . . . . . . . . . . . . . . . . . . . . . . . . . . . . . . . 26
• h Wks a Ky Suss . . . . . . . . . . . . . . . . . . . . . . . . . . . . . . . . . . . . . . 32
Bsfdn n induszd Wd . . . . . . . . . . . . . . . . . . . . . . . . . . . . . . . . . . . . . 39
tk an Nw . . . . . . . . . . . . . . . . . . . . . . . . . . . . . . . . . . . . . . . . . . . . . . . . . . . . . . . . . . . . 45
andx: 13 annu Ms’ indx nd cuny rnkns . . . . . . . . . . . . . . . . . 47
Mdy nd rs Ns . . . . . . . . . . . . . . . . . . . . . . . . . . . . . . . . . . . . . . . . . . . . 53
endns . . . . . . . . . . . . . . . . . . . . . . . . . . . . . . . . . . . . . . . . . . . . . . . . . . . . . . . . . . . . . . . . . . . . 59
Front cover
hmn, n 18-y-d m n N,s bsfd 28-dy-d bbyw ws bn undw. t bby s ny bn nmd.
Photo by Michael Bisceglie
Sv cdn, My 2012.a s svd.
iSBN 1-888393-24-6
State of the World’s Mothers 2012 wsubsd w nus su fm
Jnsn & Jnsn, M, in. ndBksn.

7/31/2019 Estado Mundial de las Madres
http://slidepdf.com/reader/full/estado-mundial-de-las-madres 3/70
MoZaMBiQUe
NUtritioN iN the FirSt 1,000 DaSIn commemoration of Mother’s Day, Save the Children is publishingits thirteenth annual State of the World’s Mothers report. Te focus ison the 171 million children globally who do not have the opportunity to reach their full potential due to the physical and mental eects of
poor nutrition in the earliest months of life. Tis report shows whichcountries are doing the best – and which are doing the worst – atproviding nutrition during the critical window of development thatstarts during a mother’s pregnancy and goes through her child’s secondbirthday. It looks at six key nutrition solutions, including breastfeeding,that have the greatest potential to save lives, and shows that thesesolutions are aordable, even in the world’s poorest countries.
Te Infant and Toddler Feeding Scorecard ranks 73 developingcountries on measures of early child nutrition. Te Breastfeeding Policy Scorecard examines maternity leave laws, the right to nursing breaks
at work and other indicators to rank 36 developed countries on thedegree to which their policies support women who want to breastfeed. And the annual Mothers’ Index evaluates the status of women’s health,nutrition, education, economic well-being and political participation torank 165 countries – both in the industrialized and developing world –to show where mothers and children fare best and where they face thegreatest hardships.

7/31/2019 Estado Mundial de las Madres
http://slidepdf.com/reader/full/estado-mundial-de-las-madres 4/70
2
ForeWorD
It’s hard to believe, but a child’s future
can be determined years before they even reach their fth birthday. As afather of three, I see unlimited poten-tial when I look at my kids. But formany children, this is not the case.
In some countries, half of all chil-dren are chronically undernourishedor “stunted.” Despite signicant prog-ress against hunger and poverty inthe last decade, undernutrition is anunderlying killer of more than 2.6 mil-lion children and more than 100,000
mothers every year. Sustained poornutrition weakens immune systems, making children andadults more likely to die of diarrhea or pneumonia. And itimpairs the eectiveness of lifesaving medications, includ-ing those needed by people living with HIV and AIDS.
Te devastating impact of undernutrition spans genera-tions, as poorly nourished women are more likely to suerdicult pregnancies and give birth to undernourished chil-dren themselves. Lost productivity in the 36 countries withthe highest levels of undernutrition can cost those econo-mies between 2 and 3 percent of gross domestic product.Tat’s billions of dollars each year that could go towardseducating more children, treating more patients at healthclinics and fueling the global economy.
We know that investments in nutrition are some of themost powerful and cost-eective in global development.Good nutrition during the critical 1,000-day window frompregnancy to a child’s second birthday is crucial to devel-oping a child’s cognitive capacity and physical growth.Ensuring a child receives adequate nutrition during this window can yield dividends for a lifetime, as a well-nour-ished child will perform better in school, more eectively ght o disease and even earn more as an adult.
Te United States continues to be a leader in ghtingundernutrition. Trough Feed the Future and the GlobalHealth Initiative we’re responding to the varying causes andconsequences of, and solutions to, undernutrition. Ournutrition programs are integrated in both initiatives, as weseek to ensure mothers and young children have access tonutritious food and quality health services.
In both initiatives, the focus for change is on women. Women comprise nearly half of the agricultural workforcein Africa, they are often responsible for bringing home
water and food and preparing family meals, they are theprimary family caregivers and they often eat last and least.
Given any small amount of resources, they often spendthem on the health and well-being of their families, and it
has been proven that their own health
and practices determine the healthand prospects of the next generation.
o help address this challenge,our programs support country-ledefforts to ensure the availability of aordable, quality foods, the promo-tion of breastfeeding and improvedfeeding practices, micronutrient sup-plementation and community-basedmanagement of acute malnutrition.Since we know rising incomes do notnecessarily translate into a reduction
in undernutrition, we are support-ing specic eorts geared towards better child nutritionoutcomes including broader nutrition education target-ing not only mothers, but fathers, grandmothers andother caregivers.
Te United States is not acting alone; many develop-ing countries are taking the lead on tackling this issue.In 2009, G8 leaders met in L’Aquila, Italy and pledgedto increase funding and coordination for investment inagriculture and food security, reversing years of decliningpublic investment. And since 2010, some 27 developingcountries have joined the Scaling Up Nutrition (SUN)Movement, pledging to focus on reducing undernutrition.
Tat same year, the United States and several inter-national partners launched the 1,000 Days Partnership. TePartnership was designed to raise awareness of and focuspolitical will on nutrition during the critical 1,000 daysfrom pregnancy to a child’s second birthday. 1,000 Daysalso supports the SUN Movement, and I am proud to bea member of the SUN Lead Group until the end of 2013.
Preventing undernutrition means more than just pro-viding food to the hungry. It is a long-term investment inour future, with generational payos. Tis report docu-
ments the extent of the problem and the ways we can solveit. All we must do is act.
D. R S Administrator of the United States Agency forInternational Development (USAID)
7/31/2019 Estado Mundial de las Madres
http://slidepdf.com/reader/full/estado-mundial-de-las-madres 5/70
S ae th e c h ilD re N · S tate oF th e W orlD ’S Moth e rS 2 0 1 2 3
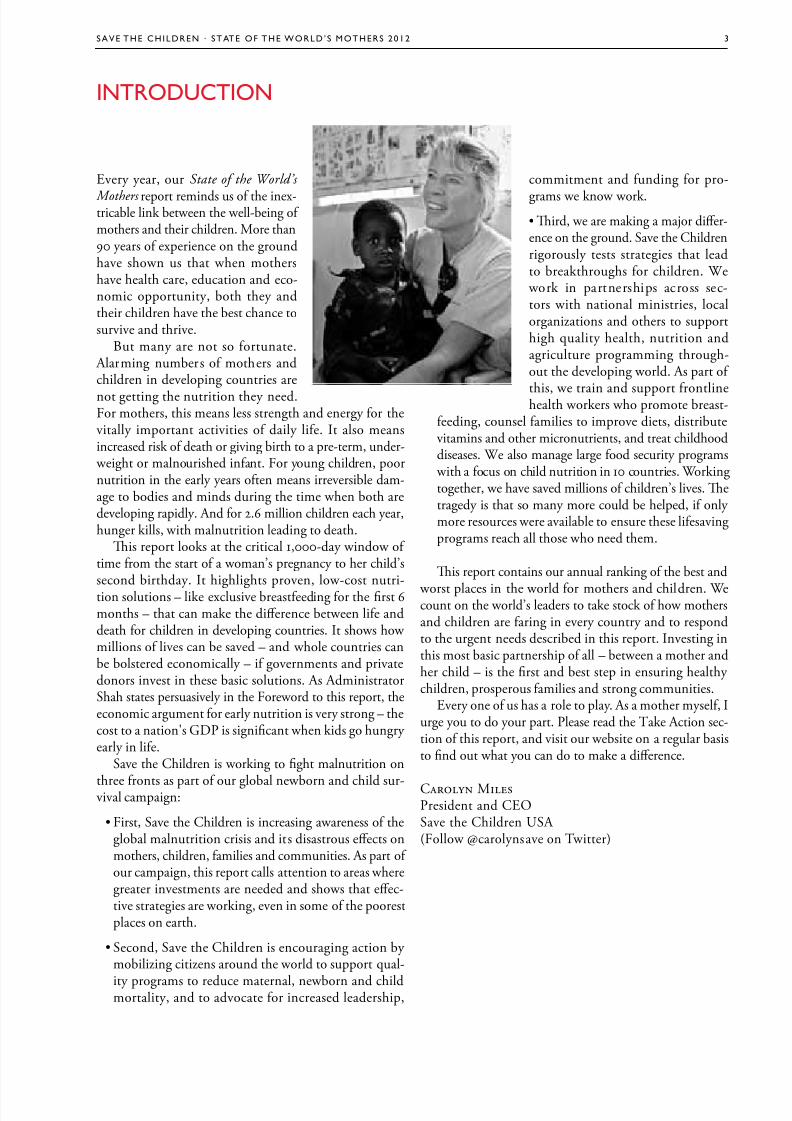
Every year, our State of the World’s
Mothers report reminds us of the inex-tricable link between the well-being of mothers and their children. More than90 years of experience on the groundhave shown us that when mothershave health care, education and eco-nomic opportunity, both they andtheir children have the best chance tosurvive and thrive.
But many are not so fortunate. Alarming numbers of mothers andchildren in developing countries are
not getting the nutrition they need.For mothers, this means less strength and energy for thevitally important activities of daily life. It also meansincreased risk of death or giving birth to a pre-term, under- weight or malnourished infant. For young children, poornutrition in the early years often means irreversible dam-age to bodies and minds during the time when both aredeveloping rapidly. And for 2.6 million children each year,hunger kills, with malnutrition leading to death.
Tis report looks at the critical 1,000-day window of time from the start of a woman’s pregnancy to her child’ssecond birthday. It highlights proven, low-cost nutri-tion solutions – like exclusive breastfeeding for the rst 6months – that can make the dierence between life anddeath for children in developing countries. It shows how millions of lives can be saved – and whole countries canbe bolstered economically – if governments and privatedonors invest in these basic solutions. As AdministratorShah states persuasively in the Foreword to this report, theeconomic argument for early nutrition is very strong – thecost to a nation's GDP is signicant when kids go hungry early in life.
Save the Children is working to ght malnutrition on
three fronts as part of our global newborn and child sur-vival campaign:
• First, Save the Children is increasing awareness of theglobal malnutrition crisis and its disastrous eects onmothers, children, families and communities. As part of our campaign, this report calls attention to areas wheregreater investments are needed and shows that eec-tive strategies are working, even in some of the poorestplaces on earth.
• Second, Save the Children is encouraging action by mobilizing citizens around the world to support qual-
ity programs to reduce maternal, newborn and childmortality, and to advocate for increased leadership,
commitment and funding for pro-
grams we know work.
• Tird, we are making a major dier-ence on the ground. Save the Childrenrigorously tests strategies that leadto breakthroughs for children. We
work in partnerships across sec-tors with national ministries, localorganizations and others to supporthigh quality health, nutrition andagriculture programming through-out the developing world. As part of
this, we train and support frontlinehealth workers who promote breast-feeding, counsel families to improve diets, distributevitamins and other micronutrients, and treat childhooddiseases. We also manage large food security programs with a focus on child nutrition in 10 countries. Workingtogether, we have saved millions of children’s lives. Tetragedy is that so many more could be helped, if only more resources were available to ensure these lifesavingprograms reach all those who need them.
Tis report contains our annual ranking of the best and
worst places in the world for mothers and children. Wecount on the world’s leaders to take stock of how mothersand children are faring in every country and to respondto the urgent needs described in this report. Investing inthis most basic partnership of all – between a mother andher child – is the rst and best step in ensuring healthy children, prosperous families and strong communities.
Every one of us has a role to play. As a mother myself, Iurge you to do your part. Please read the ake Action sec-tion of this report, and visit our website on a regular basisto nd out what you can do to make a dierence.
C MPresident and CEOSave the Children USA (Follow @carolynsave on witter)
iNtroDUctioN
7/31/2019 Estado Mundial de las Madres
http://slidepdf.com/reader/full/estado-mundial-de-las-madres 6/70
4 chapter title goeS here
Sm

7/31/2019 Estado Mundial de las Madres
http://slidepdf.com/reader/full/estado-mundial-de-las-madres 7/70
S ae th e c h ilD re N · S tate oF th e W orlD ’S Moth e rS 2 0 1 2 5
eecUtie SUMMar:Ke FiNDiNgS aND recoMMeNDatioNS
Malnutrition is an underlying cause of death for 2.6 million children each year,
and it leaves millions more with lifelong physical and mental impairments. Worldwide, more than 170 million children do not have the opportunity toreach their full potential because of poor nutrition in the earliest months of life.
Much of a child’s future – and in fact much of a nation’s future – is deter-mined by the quality of nutrition in the rst 1,000 days. Te period from thestart of a mother’s pregnancy through her child’s second birthday is a critical window when a child’s brain and body are developing rapidly and good nutri-tion is essential to lay the foundation for a healthy and productive future. If children do not get the right nutrients during this period, the damage is oftenirreversible.
Tis year’s State of the World’s Mothers report shows which countries are suc-ceeding – and which are failing – to provide good nutrition during the critical
1,000-day window. It examines how investments in nutrition solutions makea dierence for mothers, children, communities, and society as a whole. It alsopoints to proven, low-cost solutions that could save millions of lives and helplift millions more out of ill-health and poverty.
Ky Fdgs
1. Children in an alarming number o countries are not getting adequatenutrition during their frst 1,000 days. Out of developing countries – which together account for percent of child deaths – only four score “very good” on measures of young child nutrition. Our Infant and Toddler Feeding Scorecard identies Malawi, Madagascar, Peru and Solomon Islands as the top
four countries where the majority of children under age are being fed accord-ing to recommended standards. More than two thirds of the countries on theScorecard receive grades of “fair” or “poor” on these measures overall, indicatingvast numbers of children are not getting a healthy start in life. Te bottom fourcountries on the Scorecard – Somalia, Côte d'Ivoire, Botswana and EquatorialGuinea – have staggeringly poor performance on indicators of early child feed-ing and have made little to no progress since in saving children’s lives. (Toread more, turn to pages 26-3.)
2. Child malnutrition is widespread and it is limiting the uture success o millions o children and their countries. Stunting, or stunted growth, occurs when children do not receive the right type of nutrients, especially in utero or
during the rst two years of life. Children whose bodies and minds are limitedby stunting are at greater risk for disease and death, poor performance in school,and a lifetime of poverty. More than 80 countries in the developing world havechild stunting rates of 20 percent or more. Tirty of these countries have whatis considered to be “very high” stunting rates of 40 percent or more. Whilemany countries are making progress in reducing child malnutrition, stuntingprevalence is on the rise in at least 14 countries, most of them in sub-Saharan Africa. If current trends continue, Africa may overtake Asia as the region mostheavily burdened by child malnutrition. (To read more, turn to pages -2.)
3. Economic growth is not enough to fght malnutrition. Political will andeective strategies are needed to reduce malnutrition and prevent stunting.
A number of relatively poor countries are doing an admirable job of tacklingthis problem, while other countries with greater resources are not doing so
Vital statiticVital statitic
Malnutrition is the underlying causeMalnutrition is the underlying causeo more than .6 million child deathso more than .6 million child deathseach year.each year.
171 million children – 7 percent o all chil171 million children – 7 percent o all chil--dren globally – are stunted, meaning theirdren globally – are stunted, meaning theirbodies and minds have suered permanent,bodies and minds have suered permanent,irreversible damage due to malnutrition.irreversible damage due to malnutrition.
In developing countries, breasted childrenIn developing countries, breasted childrenare at least 6 times more likely to survive inare at least 6 times more likely to survive inthe early months o lie than non-breastedthe early months o lie than non-breastedchildren.children.
I all children in the developing worldI all children in the developing worldreceived adequate nutrition and eedingreceived adequate nutrition and eedingo solid oods with breasteeding,o solid oods with breasteeding,stunting rates at 1 months could be cutstunting rates at 1 months could be cutby 0 percent.by 0 percent.
Breasteeding is the single most eectiveBreasteeding is the single most eectivenutrition intervention or saving lives.nutrition intervention or saving lives. I practiced optimally, it could preventI practiced optimally, it could prevent1 million child deaths each year.1 million child deaths each year.
Adults who were malnourished as children Adults who were malnourished as children
can earn an estimated 0 percent less oncan earn an estimated 0 percent less onaverage than those who weren’t.average than those who weren’t.
Te eects o malnutrition in developingTe eects o malnutrition in developingcountries can translate into losses in GDPcountries can translate into losses in GDPo up to -3 percent annually.o up to -3 percent annually.
Globally, the direct cost o malnutrition isGlobally, the direct cost o malnutrition isestimated at $0 to $30 billion per year.estimated at $0 to $30 billion per year.

7/31/2019 Estado Mundial de las Madres
http://slidepdf.com/reader/full/estado-mundial-de-las-madres 8/70
6 executive summary
well. For example: India has a GDP per capita of $1,500 and 48 percent of its children are stunted. Compare this to Vietnam where the GDP per capitais $1,200 and the child stunting rate is 23 percent. Others countries that areperforming better on child nutrition than their national wealth might suggestinclude: Brazil, Chile, Costa Rica, Kyrgyzstan, Mongolia, Senegal and unisia.Countries that are underperforming relative to their national wealth include:Botswana, Equatorial Guinea, Guatemala, Indonesia, Mexico, Panama, Peru,South Africa and Venezuela. (To read more, turn to pages 19-0.)
4. We know how to save millions o children. Save the Children has high-lighted six low-cost nutrition interventions with the greatest potential to savelives in children’s rst 1,000 days and beyond. Universal coverage of these“lifesaving six” solutions globally could prevent more than 2 million motherand child deaths each year. Te lifesaving six are: iron folate, breastfeeding,complementary feeding, vitamin A, zinc and hygiene. Nearly 1 million livescould be saved by breastfeeding alone. Tis entire lifesaving package can bedelivered at a cost of less than $20 per child for the rst 1,000 days. ragically,more than half of the world’s children do not have access to the lifesaving six.(To read more, turn to pages 23-26.)
5. Health workers are key to success. Frontline health workers have a vital roleto play in promoting good nutrition in the rst 1,000 days. In impoverishedcommunities in the developing world where malnutrition is most common,doctors and hospitals are often unavailable, too far away, or too expensive.
nm
7/31/2019 Estado Mundial de las Madres
http://slidepdf.com/reader/full/estado-mundial-de-las-madres 9/70
S ae th e c h ilD re N · S tate oF th e W orlD ’S Moth e rS 2 0 1 2 7
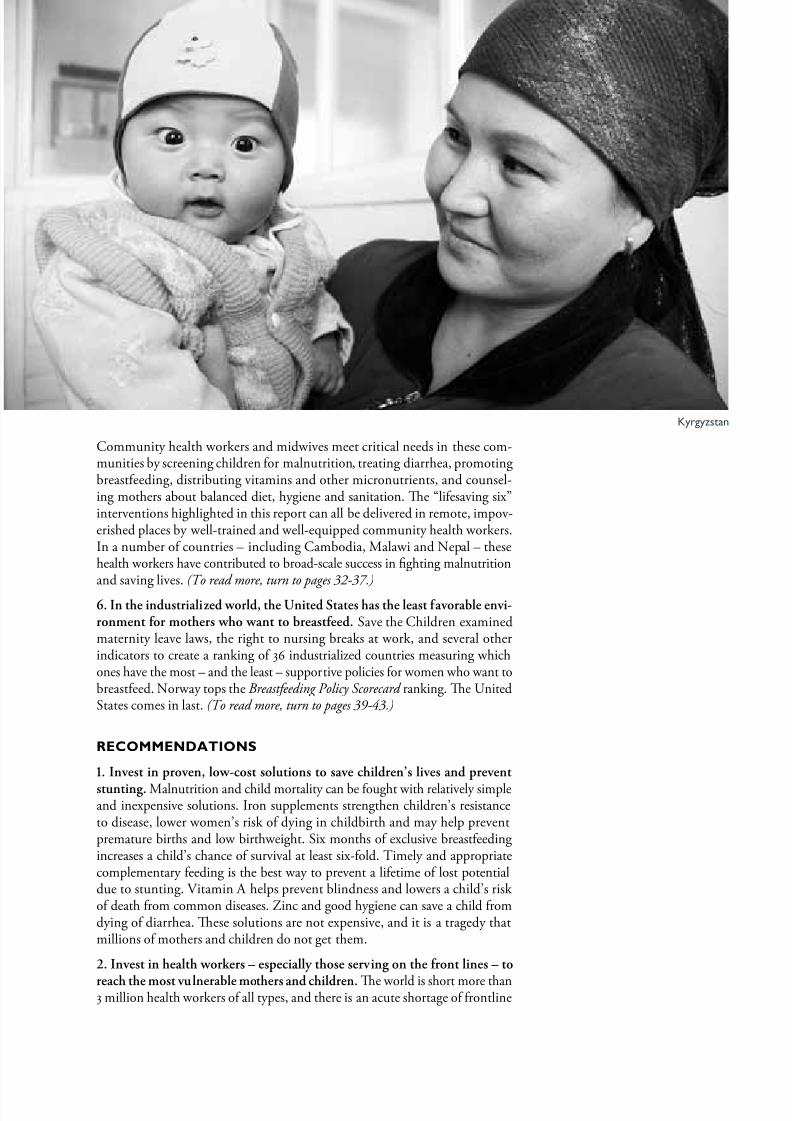
Community health workers and midwives meet critical needs in these com-munities by screening children for malnutrition, treating diarrhea, promotingbreastfeeding, distributing vitamins and other micronutrients, and counsel-ing mothers about balanced diet, hygiene and sanitation. Te “lifesaving six”interventions highlighted in this report can all be delivered in remote, impov-erished places by well-trained and well-equipped community health workers.In a number of countries – including Cambodia, Malawi and Nepal – thesehealth workers have contributed to broad-scale success in ghting malnutritionand saving lives. (To read more, turn to pages 32-37.)
6. In the industrialized world, the United States has the least favorable envi-ronment or mothers who want to breasteed. Save the Children examinedmaternity leave laws, the right to nursing breaks at work, and several otherindicators to create a ranking of 36 industrialized countries measuring whichones have the most – and the least – supportive policies for women who want tobreastfeed. Norway tops the Breastfeeding Policy Scorecard ranking. Te UnitedStates comes in last. (To read more, turn to pages 3-43.)
RCds
1. Invest in proven, low-cost solutions to save children’s lives and prevent
stunting. Malnutrition and child mortality can be fought with relatively simpleand inexpensive solutions. Iron supplements strengthen children’s resistanceto disease, lower women’s risk of dying in childbirth and may help preventpremature births and low birthweight. Six months of exclusive breastfeedingincreases a child’s chance of survival at least six-fold. imely and appropriatecomplementary feeding is the best way to prevent a lifetime of lost potentialdue to stunting. Vitamin A helps prevent blindness and lowers a child’s risk of death from common diseases. Zinc and good hygiene can save a child fromdying of diarrhea. Tese solutions are not expensive, and it is a tragedy thatmillions of mothers and children do not get them.
2. Invest in health workers – especially those serving on the ront lines – to
reach the most vulnerable mothers and children. Te world is short more than3 million health workers of all types, and there is an acute shortage of frontline
Kyyzsn

7/31/2019 Estado Mundial de las Madres
http://slidepdf.com/reader/full/estado-mundial-de-las-madres 10/70
8 executive summary
workers, including community health workers, who are critical to deliveringthe nutrition solutions that can save lives and prevent stunting. Governmentsand donors should work together to ll this health worker gap by recruiting,training and supporting new and existing health workers, and deploying them where they are needed most.
3. Help more girls go to school and stay in school. One of the most eective
ways to ght child malnutrition is to focus on girls’ education. Educated womentend to have fewer, healthier and better-nourished children. Increased investmentsare needed to help more girls go to school and stay in school, and to encouragefamilies and communities to value the education of girls. Both formal educationand non-formal training give girls knowledge, self-condence, practical skills andhope for a bright future. Tese are powerful tools that can help delay marriageand child-bearing to a time that is healthier for them and their babies.
4. Increase government support or proven solutions to fght malnutritionand save lives. In order to meet internationally agreed upon development goalsto reduce child deaths and improve mothers’ health, lifesaving services mustbe increased for the women and children who need help most. All countries
must make ghting malnutrition and stunting a priority. Developing countriesshould commit to and fund national nutrition plans that are integrated withplans for maternal and child health. Donor countries should support thesegoals by keeping their funding commitments to achieving the MillenniumDevelopment Goals and countries should endorse and support the Scaling UpNutrition (SUN) movement. Resources for malnutrition programs should notcome at the expense of other programs critical to the survival and well-beingof children.(To read more, turn to page 5.)
5. Increase private sector partnerships to improve nutrition or mothers andchildren. Many local diets fail to meet the nutritional requirements of children 6-24months old. Te private sector can help by producing and marketing aordablefortied products. Partnerships should be established with multiple manufactur-ers, distributors and government ministries to increase product choice, access andaordability, improve compliance with codes and standards, and promote publiceducation on good feeding practices and use of local foods and commercial prod-ucts. Te food industry can also invest more in nutrition programs and research,contribute social marketing expertise to promote healthy behaviors such as breast-feeding, and advocate for greater government investments in nutrition.
. Improve laws, policies and actions that support amilies and encouragebreasteeding. Governments in all countries can do more to help parents andcreate a supportive environment for breastfeeding. Governments and part-ners should adopt policies that are child-friendly and support breastfeedingmothers. Such policies would give families access to maternal and paternal
leave, ensure that workplaces and public facilities oer women a suitableplace to feed their babies outside of the home, and ensure working womenare guaranteed breastfeeding breaks while on the job. In an increasingly urban
world, a further example is that public transportation can oer special seatsfor breastfeeding mothers.
afnsn

7/31/2019 Estado Mundial de las Madres
http://slidepdf.com/reader/full/estado-mundial-de-las-madres 11/70
S ae th e c h ilD re N · S tate oF th e W orlD ’S Moth e rS 2 0 1 2 9
Save the Children’s thirteenth annualSave the Children’s thirteenth annual Mothers’ Index Mothers’ Index
compares the well-being o mothers and children in 165compares the well-being o mothers and children in 165countries – more than in any previous year. Tecountries – more than in any previous year. Te Mothers’ Index Mothers’ Index also provides inormation on an addialso provides inormation on an addi--tional 8 countries, 7 o which report sucient data tional 8 countries, 7 o which report sucient data to present fndings on women’s or children’s indica to present fndings on women’s or children’s indica --tors. When these are included, the total comes totors. When these are included, the total comes to173 countries.173 countries.
Norway, Iceland and Sweden top the rankings thisNorway, Iceland and Sweden top the rankings this year. Te top 10 countries, in general, attain very high year. Te top 10 countries, in general, attain very highscores or mothers’ and children’s health, educationalscores or mothers’ and children’s health, educationaland economic status. Niger ranks last among the 165and economic status. Niger ranks last among the 165countries surveyed. Te 10 bottom-ranked countriescountries surveyed. Te 10 bottom-ranked countries– eight rom sub-Saharan Arica – are a reverse image– eight rom sub-Saharan Arica – are a reverse image
o the top 10, perorming poorly on all indicators. Teo the top 10, perorming poorly on all indicators. TeUnited States places 5th this year – up six spots romUnited States places 5th this year – up six spots romlast year.last year.
Conditions or mothers and their children in theConditions or mothers and their children in thebottom countries are grim. On average, 1 in 30 womenbottom countries are grim. On average, 1 in 30 women will die rom pregnancy-related causes. One child in will die rom pregnancy-related causes. One child in7 dies beore his or her fth birthday, and more than7 dies beore his or her fth birthday, and more than1 child in 3 suers rom malnutrition. Nearly hal the1 child in 3 suers rom malnutrition. Nearly hal thepopulation lacks access to sae water and ewer than 4population lacks access to sae water and ewer than 4girls or every 5 boys are enrolled in primary school.girls or every 5 boys are enrolled in primary school.
Te gap in availability o maternal and child healthTe gap in availability o maternal and child healthservices is especially dramatic when comparing Norway services is especially dramatic when comparing Norway and Niger. Skilled health personnel are present at virtuand Niger. Skilled health personnel are present at virtu--ally every birth in Norway, while only a third o birthsally every birth in Norway, while only a third o births
are attended in Niger. A typical Norwegian girl canare attended in Niger. A typical Norwegian girl can
Nee 2012 Mothers’ Index 2012 Mothers’ Index : orwa op Lit, ier Rank Lat,: orwa op Lit, ier Rank Lat,Unite state Rank 25tUnite state Rank 25t
expect to receive 18 years o ormal education and to liveexpect to receive 18 years o ormal education and to liveto be over 83 years old. Eighty-two percent o womento be over 83 years old. Eighty-two percent o womenare using some modern method o contraception, andare using some modern method o contraception, andonly 1 in 175 is likely to lose a child beore his or heronly 1 in 175 is likely to lose a child beore his or herfth birthday. At the opposite end o the spectrum, infth birthday. At the opposite end o the spectrum, inNiger, a typical girl receives only 4 years o educationNiger, a typical girl receives only 4 years o educationand lives to be only 56. Only 5 percent o women areand lives to be only 56. Only 5 percent o women areusing modern contraception, and 1 child in 7 dies beoreusing modern contraception, and 1 child in 7 dies beorehis or her fth birthday. At this rate, every mother inhis or her fth birthday. At this rate, every mother inNiger is likely to suer the loss o a child.Niger is likely to suer the loss o a child.
Zeroing in on the children’s well-being portion o Zeroing in on the children’s well-being portion o thethe Mothers’ Index Mothers’ Index , Iceland fnishes frst and Somalia is, Iceland fnishes frst and Somalia islast out o 171 countries. While nearly every Icelandiclast out o 171 countries. While nearly every Icelandicchild – girl and boy alike – enjoys good health and educhild – girl and boy alike – enjoys good health and edu--
cation, children in Somalia ace the highest risk o deathcation, children in Somalia ace the highest risk o deathin the world. More than 1 child in 6 dies beore age 5.in the world. More than 1 child in 6 dies beore age 5.Nearly one-third o Somali children are malnourishedNearly one-third o Somali children are malnourishedand 70 percent lack access to sae water. Fewer than 1 inand 70 percent lack access to sae water. Fewer than 1 in3 children in Somalia are enrolled in school, and within3 children in Somalia are enrolled in school, and withinthat meager enrollment, boys outnumber girls almostthat meager enrollment, boys outnumber girls almost to 1. to 1.
Tese statistics go ar beyond mere numbers. TeTese statistics go ar beyond mere numbers. Tehuman despair and lost opportunities represented inhuman despair and lost opportunities represented inthese numbers demand mothers everywhere be giventhese numbers demand mothers everywhere be giventhe basic tools they need to break the cycle o poverty the basic tools they need to break the cycle o poverty and improve the quality o lie or themselves, theirand improve the quality o lie or themselves, theirchildren, and or generations to come.children, and or generations to come.
See the Appendix for the Complete Mothers’ Index See the Appendix for the Complete Mothers’ Index and Country Rankings.and Country Rankings.
7/31/2019 Estado Mundial de las Madres
http://slidepdf.com/reader/full/estado-mundial-de-las-madres 12/70
10 chapter title goeS here
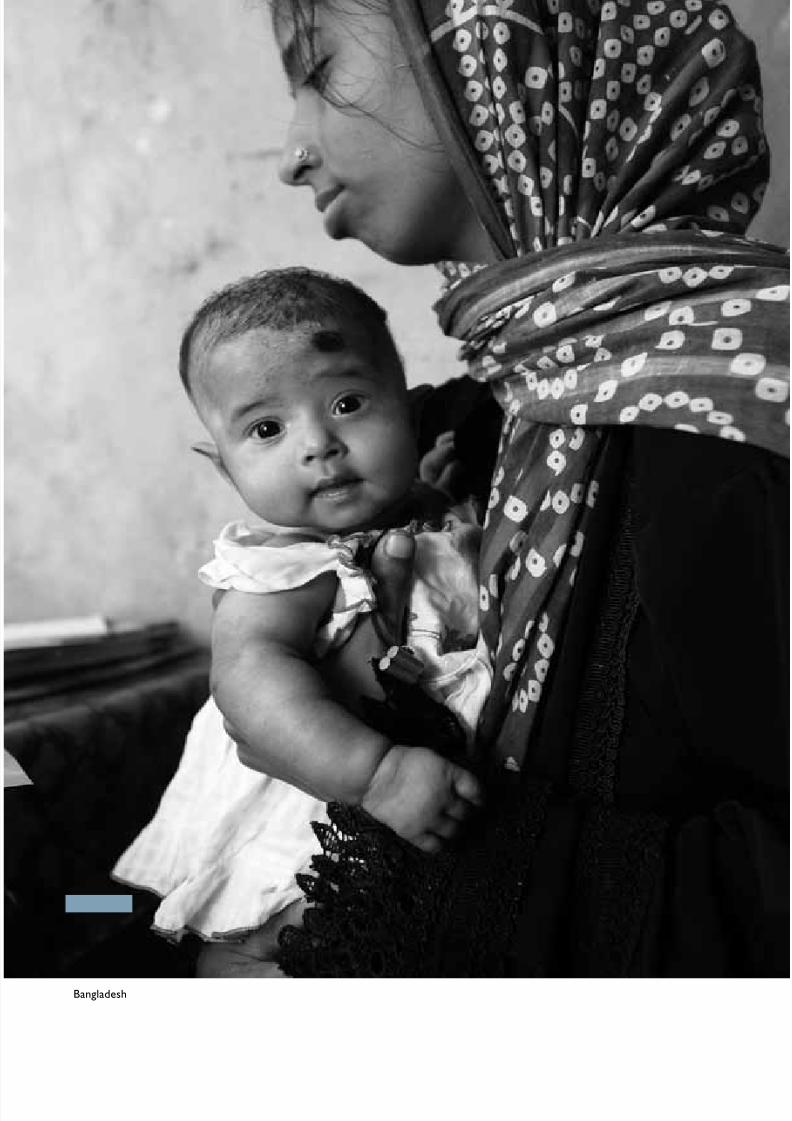
Bnds
7/31/2019 Estado Mundial de las Madres
http://slidepdf.com/reader/full/estado-mundial-de-las-madres 13/70
Sae the chilDre N · State oF the WorlD’S MotherS 2012 11
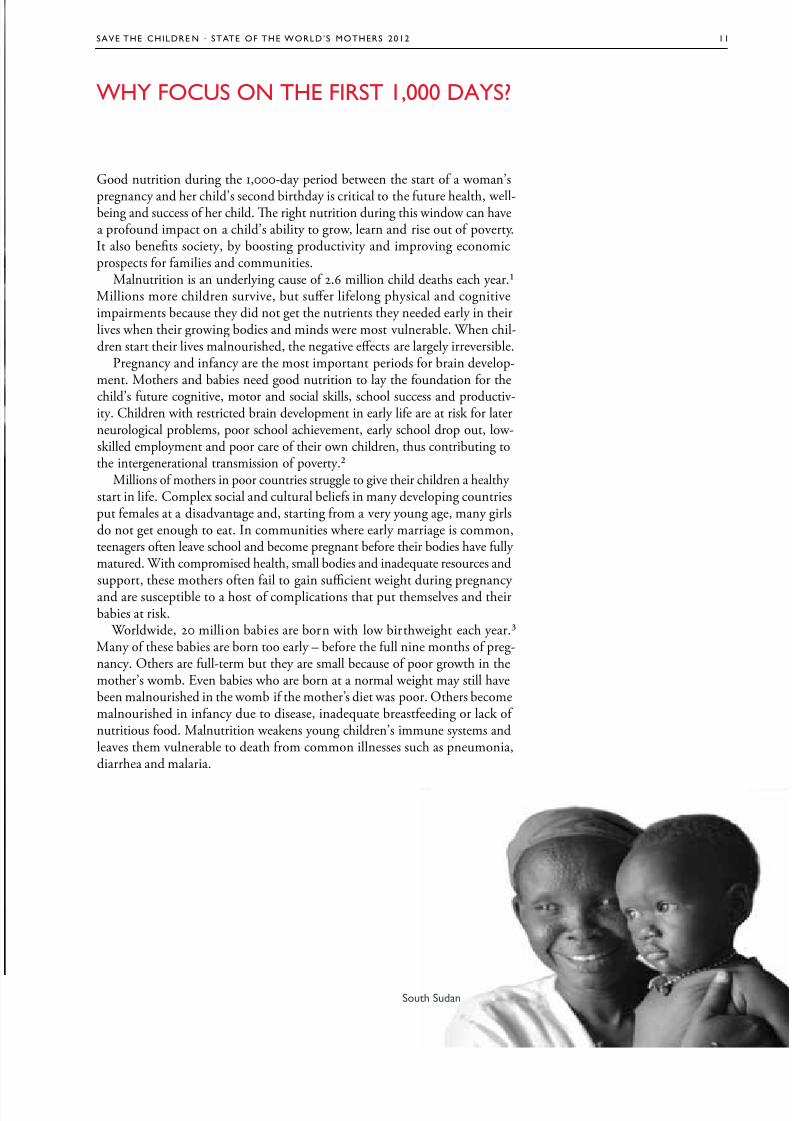
Good nutrition during the 1,000-day period between the start of a woman’s
pregnancy and her child’s second birthday is critical to the future health, well-being and success of her child. Te right nutrition during this window can havea profound impact on a child’s ability to grow, learn and rise out of poverty.It also benets society, by boosting productivity and improving economicprospects for families and communities.
Malnutrition is an underlying cause of 2.6 million child deaths each year.Millions more children survive, but suer lifelong physical and cognitiveimpairments because they did not get the nutrients they needed early in theirlives when their growing bodies and minds were most vulnerable. When chil-dren start their lives malnourished, the negative eects are largely irreversible.
Pregnancy and infancy are the most important periods for brain develop-ment. Mothers and babies need good nutrition to lay the foundation for the
child’s future cognitive, motor and social skills, school success and productiv-ity. Children with restricted brain development in early life are at risk for laterneurological problems, poor school achievement, early school drop out, low-skilled employment and poor care of their own children, thus contributing tothe intergenerational transmission of poverty.
Millions of mothers in poor countries struggle to give their children a healthy start in life. Complex social and cultural beliefs in many developing countriesput females at a disadvantage and, starting from a very young age, many girlsdo not get enough to eat. In communities where early marriage is common,teenagers often leave school and become pregnant before their bodies have fully matured. With compromised health, small bodies and inadequate resources andsupport, these mothers often fail to gain sucient weight during pregnancy and are susceptible to a host of complications that put themselves and theirbabies at risk.
Worldwide, 20 million babies are born with low birthweight each year.Many of these babies are born too early – before the full nine months of preg-nancy. Others are full-term but they are small because of poor growth in themother’s womb. Even babies who are born at a normal weight may still havebeen malnourished in the womb if the mother’s diet was poor. Others becomemalnourished in infancy due to disease, inadequate breastfeeding or lack of nutritious food. Malnutrition weakens young children’s immune systems andleaves them vulnerable to death from common illnesses such as pneumonia,diarrhea and malaria.
Wh FocUS oN the FirSt 1,000 DaS?
Su Sudn
7/31/2019 Estado Mundial de las Madres
http://slidepdf.com/reader/full/estado-mundial-de-las-madres 14/70
12 W y F cu s N t e Fi rs t 1, 00 0 Days?
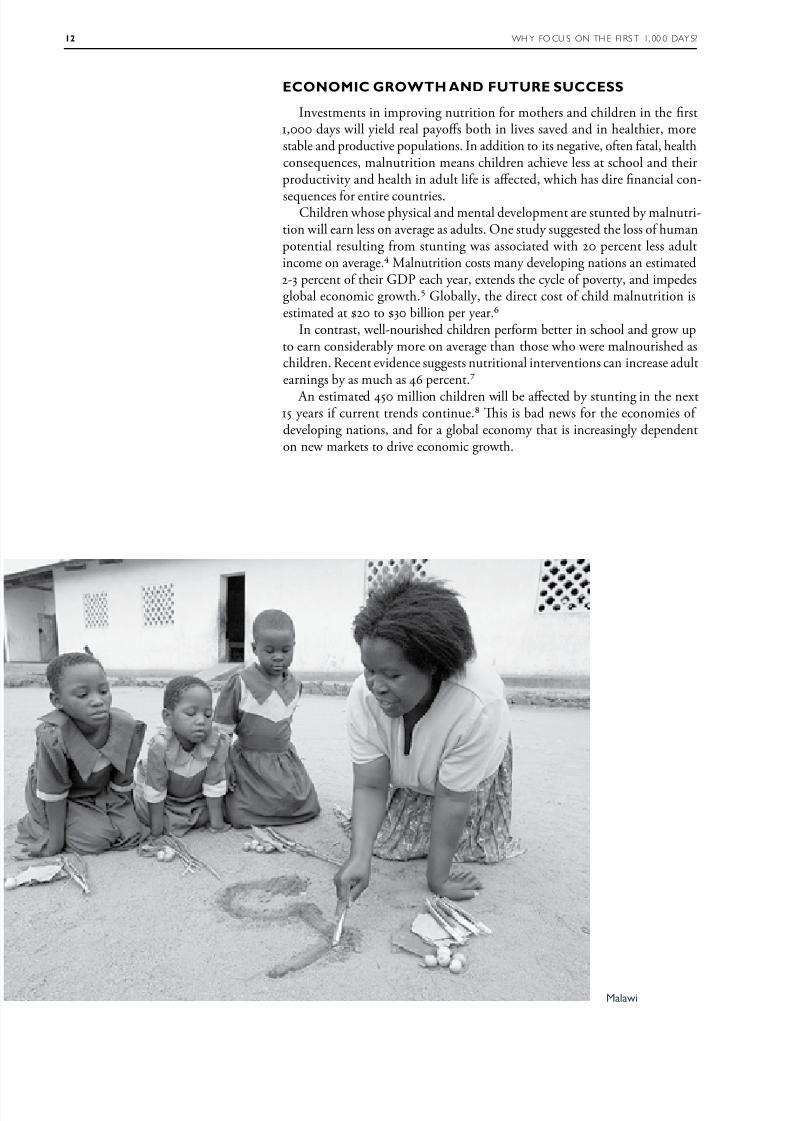
CC gRh d FUUR sUCCss
Investments in improving nutrition for mothers and children in the rst1,000 days will yield real payos both in lives saved and in healthier, morestable and productive populations. In addition to its negative, often fatal, healthconsequences, malnutrition means children achieve less at school and theirproductivity and health in adult life is aected, which has dire nancial con-
sequences for entire countries.Children whose physical and mental development are stunted by malnutri-
tion will earn less on average as adults. One study suggested the loss of humanpotential resulting from stunting was associated with 20 percent less adultincome on average. Malnutrition costs many developing nations an estimated2-3 percent of their GDP each year, extends the cycle of poverty, and impedesglobal economic growth. Globally, the direct cost of child malnutrition isestimated at $20 to $30 billion per year.
In contrast, well-nourished children perform better in school and grow upto earn considerably more on average than those who were malnourished aschildren. Recent evidence suggests nutritional interventions can increase adultearnings by as much as 46 percent.
An estimated 450 million children will be aected by stunting in the next15 years if current trends continue. Tis is bad news for the economies of developing nations, and for a global economy that is increasingly dependenton new markets to drive economic growth.
Mw
7/31/2019 Estado Mundial de las Madres
http://slidepdf.com/reader/full/estado-mundial-de-las-madres 15/70
Sae the chilDre N · State oF the WorlD’S MotherS 2012 13
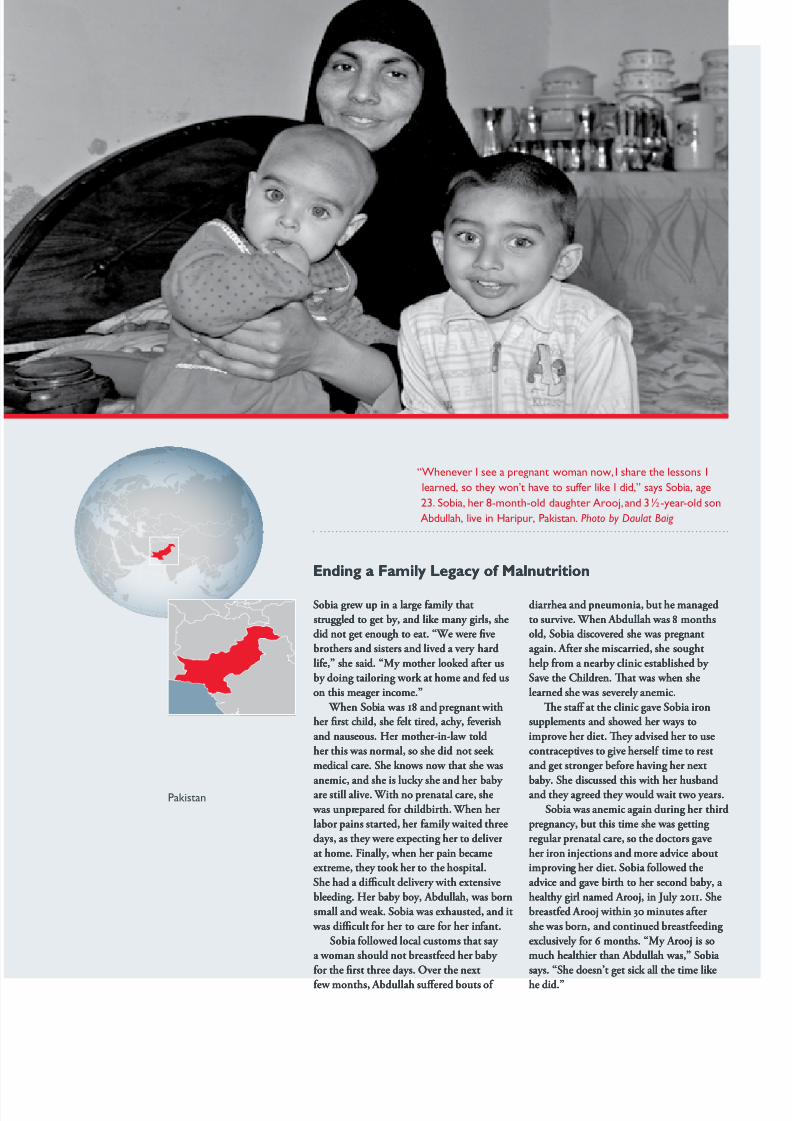
Sobia grew up in a large amily thatSobia grew up in a large amily thatstruggled to get by, and like many girls, shestruggled to get by, and like many girls, shedid not get enough to eat. “We were fvedid not get enough to eat. “We were fvebrothers and sisters and lived a very hardbrothers and sisters and lived a very hardlie,” she said. “My mother looked ater uslie,” she said. “My mother looked ater usby doing tailoring work at home and ed usby doing tailoring work at home and ed uson this meager income.”on this meager income.”
When Sobia was 18 and pregnant with When Sobia was 18 and pregnant withher frst child, she elt tired, achy, everishher frst child, she elt tired, achy, everishand nauseous. Her mother-in-law toldand nauseous. Her mother-in-law toldher this was normal, so she did not seek her this was normal, so she did not seek medical care. She knows now that she wasmedical care. She knows now that she was
anemic, and she is lucky she and her baby anemic, and she is lucky she and her baby are still alive. With no prenatal care, sheare still alive. With no prenatal care, she was unprepared or childbirth. When her was unprepared or childbirth. When herlabor pains started, her amily waited threelabor pains started, her amily waited threedays, as they were expecting her to deliverdays, as they were expecting her to deliverat home. Finally, when her pain becameat home. Finally, when her pain becameextreme, they took her to the hospital.extreme, they took her to the hospital.She had a dicult delivery with extensiveShe had a dicult delivery with extensivebleeding. Her baby boy, Abdullah, was bornbleeding. Her baby boy, Abdullah, was bornsmall and weak. Sobia was exhausted, and itsmall and weak. Sobia was exhausted, and it
was dicult or her to care or her inant. was dicult or her to care or her inant.Sobia ollowed local customs that say Sobia ollowed local customs that say
a woman should not breasteed her baby a woman should not breasteed her baby or the frst three days. Over the nextor the frst three days. Over the next
ew months, Abdullah suered bouts o ew months, Abdullah suered bouts o
diarrhea and pneumonia, but he manageddiarrhea and pneumonia, but he managedto survive. When Abdullah was 8 monthsto survive. When Abdullah was 8 monthsold, Sobia discovered she was pregnantold, Sobia discovered she was pregnantagain. Ater she miscarried, she soughtagain. Ater she miscarried, she soughthelp rom a nearby clinic established by help rom a nearby clinic established by Save the Children. Tat was when sheSave the Children. Tat was when shelearned she was severely anemic.learned she was severely anemic.
Te sta at the clinic gave Sobia ironTe sta at the clinic gave Sobia ironsupplements and showed her ways tosupplements and showed her ways toimprove her diet. Tey advised her to useimprove her diet. Tey advised her to usecontraceptives to give hersel time to restcontraceptives to give hersel time to restand get stronger beore having her nextand get stronger beore having her next
baby. She discussed this with her husbandbaby. She discussed this with her husbandand they agreed they would wait two years.and they agreed they would wait two years.Sobia was anemic again during her thirdSobia was anemic again during her third
pregnancy, but this time she was gettingpregnancy, but this time she was gettingregular prenatal care, so the doctors gaveregular prenatal care, so the doctors gaveher iron injections and more advice abouther iron injections and more advice aboutimproving her diet. Sobia ollowed theimproving her diet. Sobia ollowed theadvice and gave birth to her second baby, a advice and gave birth to her second baby, a healthy girl named Arooj, in July 011. Shehealthy girl named Arooj, in July 011. Shebreasted Arooj within 30 minutes aterbreasted Arooj within 30 minutes atershe was born, and continued breasteedingshe was born, and continued breasteedingexclusively or 6 months. “My Arooj is soexclusively or 6 months. “My Arooj is somuch healthier than Abdullah was,” Sobia much healthier than Abdullah was,” Sobia says. “She doesn’t get sick all the time likesays. “She doesn’t get sick all the time like
he did.”he did.”
nin a Famil Leac of alnutritionnin a Famil Leac of alnutrition
“Wnv i s nn wmn nw, i s ssns ind, s y wn’ v suff k i dd,” sys Sb, 23. Sb, 8-mn-d du aj, nd 3½-y-d snabdu, v n hu, pksn. Photo by Daulat Baig
pksn

7/31/2019 Estado Mundial de las Madres
http://slidepdf.com/reader/full/estado-mundial-de-las-madres 16/70
14 chapter title goeS here
Mzmbqu
7/31/2019 Estado Mundial de las Madres
http://slidepdf.com/reader/full/estado-mundial-de-las-madres 17/70
Sae the chilDre N · State oF the WorlD’S MotherS 2012 15
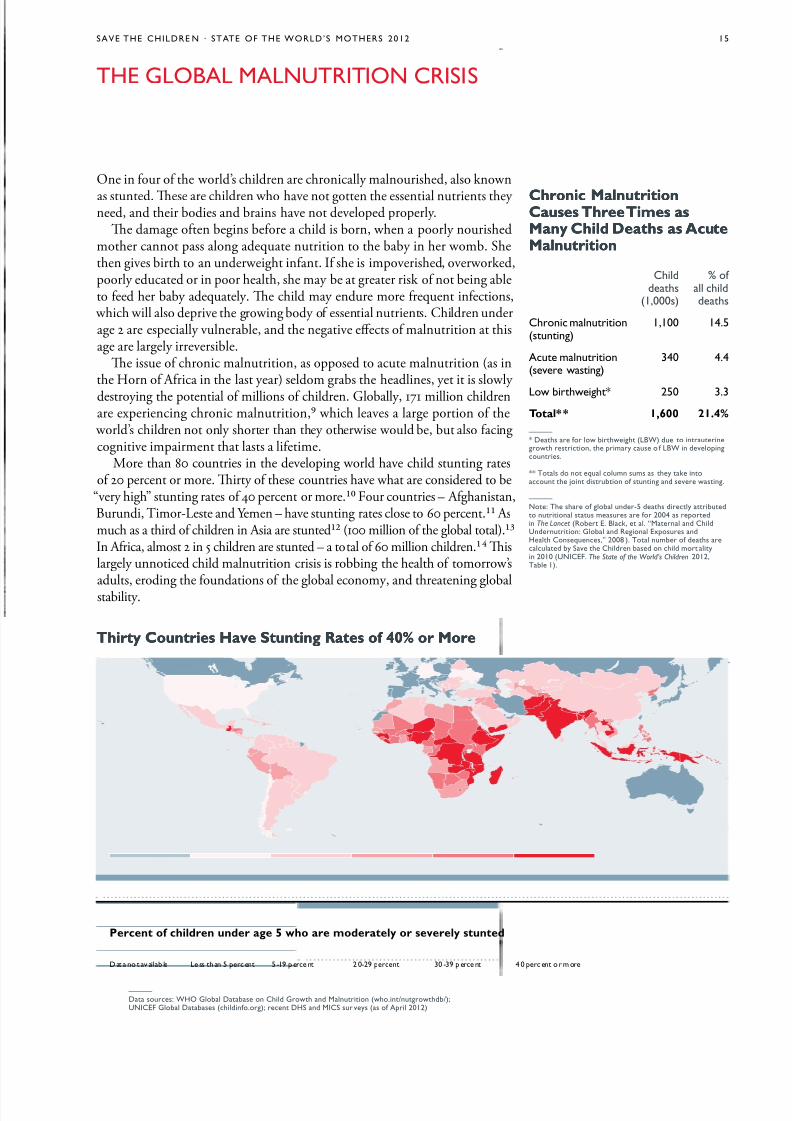
One in four of the world’s children are chronically malnourished, also known
as stunted. Tese are children who have not gotten the essential nutrients they need, and their bodies and brains have not developed properly.
Te damage often begins before a child is born, when a poorly nourishedmother cannot pass along adequate nutrition to the baby in her womb. Shethen gives birth to an underweight infant. If she is impoverished, overworked,poorly educated or in poor health, she may be at greater risk of not being ableto feed her baby adequately. Te child may endure more frequent infections,
which will also deprive the growing body of essential nutrients. Children underage 2 are especially vulnerable, and the negative eects of malnutrition at thisage are largely irreversible.
Te issue of chronic malnutrition, as opposed to acute malnutrition (as inthe Horn of Africa in the last year) seldom grabs the headlines, yet it is slowly
destroying the potential of millions of children. Globally, 171 million childrenare experiencing chronic malnutrition, which leaves a large portion of the
world’s children not only shorter than they otherwise would be, but also facingcognitive impairment that lasts a lifetime.
More than 80 countries in the developing world have child stunting ratesof 20 percent or more. Tirty of these countries have what are considered to be
“very high” stunting rates of 40 percent or more. Four countries – Afghanistan,Burundi, imor-Leste and Yemen – have stunting rates close to 60 percent. Asmuch as a third of children in Asia are stunted (100 million of the global total).In Africa, almost 2 in 5 children are stunted – a total of 60 million children. Tislargely unnoticed child malnutrition crisis is robbing the health of tomorrow’sadults, eroding the foundations of the global economy, and threatening globalstability.
the gloBal MalNUtritioN criSiS
irt Countrie have stuntin Rate of 40% or oreirt Countrie have stuntin Rate of 40% or ore
Cronic alnutritionCronic alnutritionCaue ree ime aCaue ree ime aan Cil deat a cutean Cil deat a cutealnutritionalnutrition
—
* Ds f w bw (lBW) du nunw sn, my us f lBW n dvnuns.
** ts d n qu umn sums s y k nun jn dsubn f sunn nd sv wsn.
—
N: t s f b und-5 ds dy bud nun sus msus f 2004 s dn The Lancet (rb e. Bk, . “Mn nd cdUndnun: gb nd rn exsus ndh cnsquns,” 2008 ). t numb f ds ud by Sv cdn bsd n d m yn 2010 (UNiceF. The State of the World’s Children 2012,tb 1).
—
D sus: Who gb Dbs n cd gw nd Mnun (w.n/nuwdb/);UNiceF gb Dbss (dnf.); n DhS nd MicS su vys (s f a 2012)
cdds
(1,000s)
% f dds
cn mnun(sunn)
1,100 14.5
au mnun(sv wsn)
340 4.4
lw bw* 250 3.3otal** 1,600 21.4%
D n v b l ss n 5 n 5 -19 n 2 0-29 n 30 -39 n 4 0 n m
Percent of cilren uner ae 5 wo are moeratel or everel tunte

7/31/2019 Estado Mundial de las Madres
http://slidepdf.com/reader/full/estado-mundial-de-las-madres 18/70
16 the gloBal MalNUtritioN criS iS
LUR d ChLd RLy
Every year, 7.6 million children die before they reach the age of 5, mostfrom preventable or treatable illnesses and almost all in developing countries.Malnutrition is an underlying cause of more than a third (35 percent) of thesedeaths.
A malnourished child is up to 10 times as likely to die from an easily pre-
ventable or treatable disease as a well-nourished child. And a chronically malnourished child is more vulnerable to acute malnutrition during food short-ages, economic crises and other emergencies.
Unfortunately, many countries have not made addressing malnutrition andchild survival a high-level priority. For instance, a recent analysis by the WorldHealth Organization found that only 67 percent of 121 mostly low- and mid-dle-income countries had policies to promote breastfeeding. Complementary feeding and iron and folic acid supplements were included in little over half of all national policy documents (55 and 51 percent, respectively). And vitamin A and zinc supplementation for children (for the treatment of diarrhea) were partof national policies in only 37 percent and 22 percent of countries respectively.
While nutrition is getting more high-level commitment than ever before, there
is still a lot of progress to be made.Persistent and worsening malnutrition in developing countries is perhaps
the single biggest obstacle to achieving many of the Millennium DevelopmentGoals (MDGs). Tese goals – agreed to by all United Nations member states in2000 – set specic targets for ending poverty and improving human rights andsecurity. MDG includes halving the proportion of people living in hunger.MDG is to ensure all children complete primary school. MDG aims toreduce the world’s 1990 under-5 mortality rate by two thirds. MDG aims toreduce the 1990 maternal mortality ratio by three quarters. And MDG is tohalt and begin to reverse the spread of HIV/AIDS and the incidence of malariaand other major diseases. Improving nutrition helps fuel progress toward allof these MDGs.
With just a few years left until the 2015 deadline, less than a third (22)of 75 priority countries are on track to achieve the poverty and hunger goal(MDG ). Only half of developing countries are on target to achieve univer-sal primary education (MDG ). Just 23 of the 75 countries are on track toachieve the child survival goal (MDG ). And just 13 of the 75 countries areon target to achieve the maternal mortality goal (MDG ). While new HIV infections are declining in some regions, trends are worrisome in others. Also,treatment for HIV and AIDS has expanded quickly, but not fast enough tomeet the 2010 target for universal access (MDG 6).
RL LUR
Many children are born undernourished because their mothers are under-nourished. As much as half of all child stunting occurs in utero, underscoringthe critical importance of better nutrition for women and girls.
In most developing countries, the nutritional status of women and girls iscompromised by the cumulative and synergistic eects of many risk factors.Tese include: limited access to food, lack of power at the household level, tra-ditions and customs that limit women’s consumption of certain nutrient-richfoods, the energy demands of heavy physical labor, the nutritional demandsof frequent pregnancies and breastfeeding, and the toll of frequent infections
with limited access to health care. Anemia is the most widespread nutritional problem aecting girls and wom-
en in developing countries. It is a signicant cause of maternal mortality andcan cause premature birth and low birthweight. In the developing world, 40
Four pe of alnutritionFour pe of alnutrition
Stunting – A child is too short or their age.– A child is too short or their age.Tis is caused by poor diet and requentTis is caused by poor diet and requentinections. Stunting generally occurs beoreinections. Stunting generally occurs beoreage , and the eects are largely irreversible.age , and the eects are largely irreversible.Tese include delayed motor development,Tese include delayed motor development,impaired cognitive unction and poorimpaired cognitive unction and poorschool perormance. In total, 171 millionschool perormance. In total, 171 millionchildren – 7 percent o all children globally children – 7 percent o all children globally – are stunted.– are stunted.
Wasting – A child’s weight is too low – A child’s weight is too low or their height. Tis is caused by acuteor their height. Tis is caused by acutemalnutrition. Wasting is a strong predicmalnutrition. Wasting is a strong predic--
tor o mortality among children under 5.tor o mortality among children under 5.It is usually caused by severe ood shortIt is usually caused by severe ood short--age or disease. In total, over 60 millionage or disease. In total, over 60 millionchildren – 10 percent o all children globally children – 10 percent o all children globally – are wasted.– are wasted.
Underweight – A child’s weight is too low – A child’s weight is too low or their age. A child can be underweightor their age. A child can be underweightbecause she is stunted, wasted or both.because she is stunted, wasted or both. Weight is a sensitive indicator o short-term Weight is a sensitive indicator o short-term(i.e., acute) undernutrition. Whereas a (i.e., acute) undernutrition. Whereas a defcit in height (stunting) is dicult todefcit in height (stunting) is dicult tocorrect, a defcit in weight (underweight)correct, a defcit in weight (underweight)can be recouped i nutrition and healthcan be recouped i nutrition and healthimprove later in childhood. Worldwide,improve later in childhood. Worldwide,more than 100 million children are undermore than 100 million children are under-- weight. weight. Being underweight is associatedBeing underweight is associated with 19 percent o child deaths. with 19 percent o child deaths.
Micronutrient deciency – A child– A childlacks essential vitamins or minerals.lacks essential vitamins or minerals.Tese include vitamin A, iron and zinc.Tese include vitamin A, iron and zinc.Micronutrient defciencies are caused by Micronutrient defciencies are caused by a long-term lack o nutritious ood or by a long-term lack o nutritious ood or by inections such as worms. Micronutrientinections such as worms. Micronutrientdefciencies are associated with 10 percentdefciencies are associated with 10 percento all children’s deaths, or about one-thirdo all children’s deaths, or about one-third
o all child deaths due to malnutrition.o all child deaths due to malnutrition.
7/31/2019 Estado Mundial de las Madres
http://slidepdf.com/reader/full/estado-mundial-de-las-madres 19/70
Sae the chilDre N · State oF the WorlD’S MotherS 2012 17
percent of non-pregnant women and half (49 percent) of pregnant women areanemic. Anemia is caused by poor diet and can be exacerbated by infectiousdiseases, particularly malaria and intestinal parasites. Pregnant adolescents aremore prone to anemia than older women, and are at additional risk becausethey are often less likely to receive health care. Anemia prevalence is especially high in Asia and Africa, but even in Latin America and the Caribbean, onequarter of women are anemic.
Many women in the developing world are short in stature and/or under- weight. Tese conditions are usually caused by malnutrition during childhoodand adolescence. A woman who is less than 145 cm or 4'7" is considered to bestunted. Stunting among women is particularly severe in South Asia, wherein some countries – for example, Bangladesh, India and Nepal – more than 10percent of women aged 15-49 are stunted. Rates are similarly high in Boliviaand Peru. And in Guatemala, an alarming 29 percent of women are stunted.Tese women face higher risks of complications during childbirth and of hav-
ing small babies. Maternal underweight means a body-mass index of less than18.5 kg/m and indicates chronic energy deciency. en to 20 percent of the women in sub-Saharan Africa and 25-35 percent of the women in South Asiaare classied as excessively thin. Te risk of having a small baby is even greaterfor mothers who are underweight (as compared to stunted).
In many developing countries, it is common for girls to marry and beginhaving babies while still in their teens – before their bodies have fully matured.
Younger mothers tend to have fewer economic resources, less education, lesshealth care, and they are more likely to be malnourished when they becomepregnant, multiplying the risks to themselves and their children. eenagers
who give birth when their own bodies have yet to nish growing are at greaterrisk of having undernourished babies. Te younger a girl is when she becomes
pregnant, the greater the risks to her health and the more likely she is to havea low-birthweight baby.
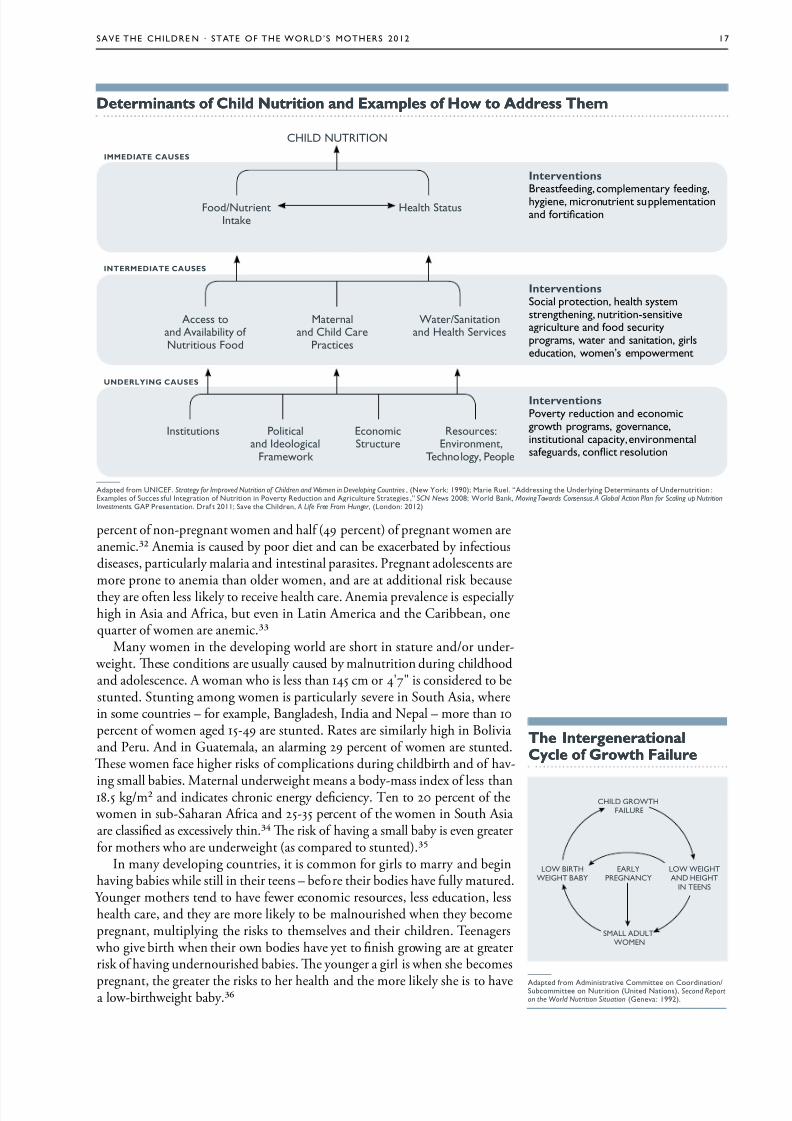
determinant of Cil utrition an xample of how to re emdeterminant of Cil utrition an xample of how to re em
chilD NUtritioN
UdRLyg CUss
Rd CUss
nterventionBsfdn, mmny fdn,yn, mnun sumnnnd fn
nterventionS n, sysmsnnn, nun-snsvuu nd fd suyms, w nd snn, sdun, wmn’s mwmn
nterventionpvy dun nd nmw ms, vnn,nsun y, nvnmnsfuds, n sun
insuns pnd id
Fmwk
enmSuu
rsus:envnmn,
tny, p
ass nd avby f Nuus Fd
Mnnd cd c
ps
W/Snnnd h Svs
Fd/Nunink
h Sus
—
add fm UNiceF. Strategy for Improved Nutrition of Children and Women in Developing Countries , (Nw k: 1990); M ru. “addssn Undyn Dmnns f Undnun :exms f Sus sfu inn f Nun n pvy rdun nd auu Ss ,” SCN News 2008; Wd Bnk, Moving Towards Consensus. A Global Action Plan for Scaling up NutritionInvestments. gap psnn. Df 2011; Sv cdn, A Life Free From Hunger , (lndn: 2012)
d CUss
e nterenerationale nterenerationalCcle of growt FailureCcle of growt Failure
CHILD GROWTH
FAILURE
LOW BIRTH
WEIGHT BABY
EARLY
PREGNANCY
LOW WEIGHT
AND HEIGHT
IN TEENS
SMALL ADULT
WOMEN
—
add fm admnsv cmm n cdnn/Submm n Nun (Und Nns), Second Reporton the World Nutrition Situation (gnv: 1992).

7/31/2019 Estado Mundial de las Madres
http://slidepdf.com/reader/full/estado-mundial-de-las-madres 20/70
18 the gloBal MalNUtritioN criS iS
BRRRs BRsFdg
Experts recommend that children be breastfed within one hour of birth,exclusively breastfed for the rst 6 months, and then breastfed until age 2
with age-appropriate, nutritionally adequate and safe complementary foods.Optimal feeding according to these standards can prevent an estimated 19 per-cent of all under-5 deaths, more than any other child survival intervention.
Yet worldwide, the vast majority of children are not breastfed optimally. What are some of the reasons for this? Cultural beliefs, lack of knowledge
and misinformation play major roles. Many women and family members areunaware of the benets of exclusive breastfeeding. New mothers may be toldthey should wait several hours or days after their baby is born to begin breast-feeding. Aggressive marketing of infant formula often gives the impression thathuman milk is less modern and thus less healthy for infants than commercialformula. Or mothers may be told their breast milk is “bad” or does not containsucient nutrients, so they introduce other liquids and solid food too early.
Most breastfeeding problems occur in the rst two weeks of a child’s life. If a mother experiences pain or the baby does not latch, an inexperienced mothermay give up. Support from fathers, mothers-in-law, peer groups and health
workers can help a mother to gain condence, overcome obstacles and prolongexclusive breastfeeding.
Women often stop breastfeeding because they return to work. Many aren’tprovided with paid maternity leave or time and a private place to breastfeedor express their breast milk. Legislation around maternity leave and policiesthat provide time, space, and support for breastfeeding in the workplace couldreduce this barrier. For mothers who work in farming or the informal sector,family and community support can help them to continue breastfeeding, evenafter returning to work. Also many countries need better laws and enforcementto protect women from persecution or harassment for breastfeeding in public.
Riin Foo Price CanRiin Foo Price Canhurt oter an Cilrenhurt oter an Cilren
As global ood prices remain high and As global ood prices remain high and volatile, poor mothers and children in volatile, poor mothers and children indeveloping countries can have little choicedeveloping countries can have little choicebut to cut back on the quantity and qualbut to cut back on the quantity and qual--ity o the ood they eat. Te World Bank ity o the ood they eat. Te World Bank estimates that rising ood prices pushed anestimates that rising ood prices pushed anadditional 44 million people into poverty additional 44 million people into poverty between June 010 and February 011.between June 010 and February 011. Staple ood prices hit record highs inStaple ood prices hit record highs inFebruary 011 and may have put the lives o February 011 and may have put the lives o more than 400,000 more children at risk.more than 400,000 more children at risk.
Poor amilies in developing countriesPoor amilies in developing countriestypically spend between 50 to 70 percenttypically spend between 50 to 70 percento their income on ood.o their income on ood. When meat, When meat,fsh, eggs, ruit and vegetables become toofsh, eggs, ruit and vegetables become tooexpensive, amilies oten turn to cheaperexpensive, amilies oten turn to cheaper
cereals and grains, which oer ewercereals and grains, which oer ewernutrients. Studies show that women tendnutrients. Studies show that women tendto cut their ood consumption frst, and asto cut their ood consumption frst, and asa crisis deepens, other adults and eventually a crisis deepens, other adults and eventually children cut back.children cut back.
When pregnant mothers and young When pregnant mothers and youngchildren are deprived o essential nutrientschildren are deprived o essential nutrientsduring a critical period in their developduring a critical period in their develop--ment, the results are oten devastating.ment, the results are oten devastating.Mothers experience higher rates o anemia Mothers experience higher rates o anemia and chronic energy defciency. Childbirthand chronic energy defciency. Childbirthbecomes more risky, and babies are morebecomes more risky, and babies are morelikely to be born at low birthweight.likely to be born at low birthweight.
Children ace increased risk o stunting,Children ace increased risk o stunting,acute malnutrition and death.acute malnutrition and death. Countrie akin te Fatet an slowet gain aintCountrie akin te Fatet an slowet gain aintCil alnutrition, ~1990-2010Cil alnutrition, ~1990-2010
-8% -6% -4% -2% 0% 2% 4% 6% 8%
Uzbksn 6.7%an 6.6%cn 6.3%
Kyyzsn 6.3%tukmnsn 6.3%
Dpr K 5.6%Bz 5.5%
Mun 4.6%e 4.4%
nm 4.3%Mx 3.1%
Bnds 2.9%N 2.6%
indns 2.6%cmbd 2.5%
S ln 0.0%N -0.2%Djbu -0.4%Zmbbw -0.5%ls -0.5%Buund -0.5%gun -0.8%M -0.9%mn -1.0%cn afn rub -1.4%afnsn -1.6%cms -2.3%cô d'iv -2.6%Bnn -2.6%Sm -6.3%
verae annual rate of reuction in cil tuntin (%), ~1990-2010
—
N: tnd nyss nudd 71 f 75 Countdown uns w vb d f xm d 1990-2010.
F uny-v d, s Mdy nd rs Ns. D Sus: Who gb Db s n cd gwnd Mnun (w.n/nuwdb/); UNiceF gb Dbss (dnf.); cundwn 2015. Account abili ty for
Maternal , Newborn & Child Sur vival : An Update on Progre ss in Priori ty Countri es. (Who : 2012); n DhS nd MicS suvys (sf a 2012)
op 15 countrie wit fatet prore(nnu % ds n sunn)
Bottom 15 countrie wit no prore(nnu % ns n sunn)
7/31/2019 Estado Mundial de las Madres
http://slidepdf.com/reader/full/estado-mundial-de-las-madres 21/70
Sae the chilDre N · State oF the WorlD’S MotherS 2012 19
sUFFC PRgRss
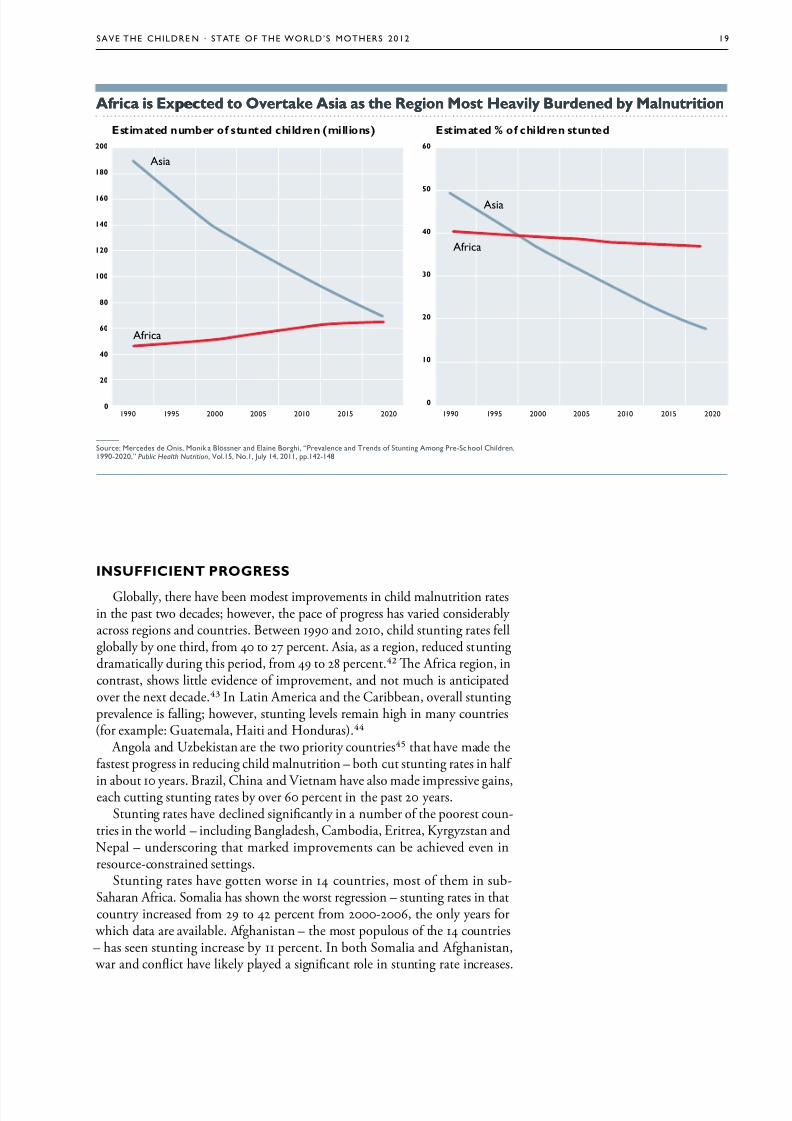
Globally, there have been modest improvements in child malnutrition ratesin the past two decades; however, the pace of progress has varied considerably across regions and countries. Between 1990 and 2010, child stunting rates fellglobally by one third, from 40 to 27 percent. Asia, as a region, reduced stuntingdramatically during this period, from 49 to 28 percent. Te Africa region, incontrast, shows little evidence of improvement, and not much is anticipatedover the next decade. In Latin America and the Caribbean, overall stuntingprevalence is falling; however, stunting levels remain high in many countries(for example: Guatemala, Haiti and Honduras).
Angola and Uzbekistan are the two priority countries that have made thefastest progress in reducing child malnutrition – both cut stunting rates in half
in about 10 years. Brazil, China and Vietnam have also made impressive gains,each cutting stunting rates by over 60 percent in the past 20 years.Stunting rates have declined signicantly in a number of the poorest coun-
tries in the world – including Bangladesh, Cambodia, Eritrea, Kyrgyzstan andNepal – underscoring that marked improvements can be achieved even inresource-constrained settings.
Stunting rates have gotten worse in 14 countries, most of them in sub-Saharan Africa. Somalia has shown the worst regression – stunting rates in thatcountry increased from 29 to 42 percent from 2000-2006, the only years for
which data are available. Afghanistan – the most populous of the 14 countries– has seen stunting increase by 11 percent. In both Somalia and Afghanistan, war and conict have likely played a signicant role in stunting rate increases.
frica i xpecte to vertake ia a te Reion ot heavil Burene b alnutritionfrica i xpecte to vertake ia a te Reion ot heavil Burene b alnutrition
—
Su: Mds d ons, Mnk Bössn nd en B, “pvn nd tnds f Sunn amn p-S cdn,1990-2020,” Public Health Nutrition, .15, N.1, Juy 14, 2011, .142-148
200
180
160
140
120
100
80
60
40
20
01990 1995 2000 2005 2010 2015 2020
as
af
60
50
40
30
20
10
0
1990 1995 2000 2005 2010 2015 2020
as
af
timate number of tunte cilren (million) timate % of cilren tunte

7/31/2019 Estado Mundial de las Madres
http://slidepdf.com/reader/full/estado-mundial-de-las-madres 22/70
20 the gloBal MalNUtritioN criS iS
CC gRh s’ Ugh
While children who live in impoverished countries are at higher risk formalnutrition and stunting, poverty alone does not explain high malnutritionrates for children. A number of relatively poor countries are doing an admirable
job of tackling this problem, while other countries with greater resources arenot doing so well.
Political commitment, supportive policies and eective strategies have a lotto do with success in ghting child malnutrition. Tis is demonstrated by ananalysis of stunting rates and gross domestic product (GDP) in 127 developedand developing countries. For example: India has a GDP per capita of $1,500and 48 percent of its children are stunted. Compare this to Vietnam where theGDP per capita is $1,200 and the child stunting rate is 23 percent. Nigeria andGhana both have a GDP per capita around $1,250, but Nigeria’s child stuntingrate is 41 percent, while Ghana’s is 29 percent.
Countries that are performing better on child nutrition than their national wealth might suggest include: Brazil, Chile, Costa Rica, Kyrgyzstan, Mongolia,Senegal and unisia. Countries that are underperforming relative to their GDPinclude: Botswana, Equatorial Guinea, Guatemala, Indonesia, Mexico, Panama,
Peru, South Africa and Venezuela.
Countrie Fallin bove an Below xpectation Bae on gdPCountrie Fallin bove an Below xpectation Bae on gdP
$0 $10,000 $20,000 $30,000 $40,000 $50,000
afnsn
gum
indns
S ln
Kny
gn
h
Bvgmbnm
Kyyzsn
Mn
Mdv
tuns
cn
Ukn Jm
cs r
c
Bz
Uuuy
nzuMx
pnmpu lby
Su af
gbn
azbjn
BswnNmb
equ gun
cz rubr2=0.61
Unerperformin relative to gdP
verperformin relative to gdP
SnKuw USa
gmny
Mds
indMw
N
e
tnzn
N
Und
M
Bnds
pksn
N
cmbd
cô d’iv
gdP per capita (2010 Us$)
% C h i
l d r e n u n d e r - 5 m o d e r a t e l y o r e v e r e
l y t u n t e d
60
50
40
30
20
10
0
50%
40%
Sn
—
N: a 127 uns w vb d w nudd n s nyss. Sunn s f s vb y 2 000-2010. D sus: Who gb Dbs n cd gw nd Mnun (w.n/nuwdb/) ; UNiceF gb
Dbss (dnf.); n Dh S nd MicS (s f M 2012) nd t Wd Bnk, Wd Dvmn inds(d.wdbnk./nd)
7/31/2019 Estado Mundial de las Madres
http://slidepdf.com/reader/full/estado-mundial-de-las-madres 23/70
Sae the chilDre N · State oF the WorlD’S MotherS 2012 21
LUR g h PR
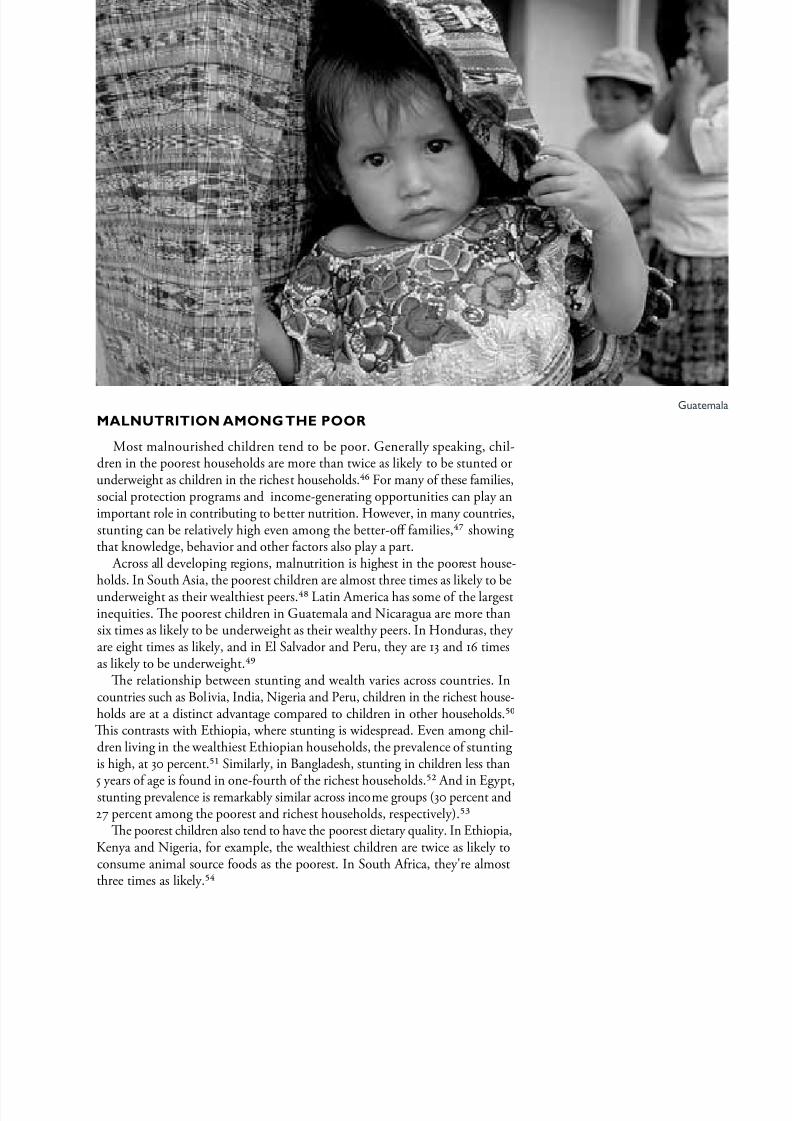
Most malnourished children tend to be poor. Generally speaking, chil-dren in the poorest households are more than twice as likely to be stunted orunderweight as children in the richest households. For many of these families,social protection programs and income-generating opportunities can play animportant role in contributing to better nutrition. However, in many countries,stunting can be relatively high even among the better-o families, showingthat knowledge, behavior and other factors also play a part.
Across all developing regions, malnutrition is highest in the poorest house-holds. In South Asia, the poorest children are almost three times as likely to beunderweight as their wealthiest peers. Latin America has some of the largestinequities. Te poorest children in Guatemala and Nicaragua are more thansix times as likely to be underweight as their wealthy peers. In Honduras, they are eight times as likely, and in El Salvador and Peru, they are 13 and 16 timesas likely to be underweight.
Te relationship between stunting and wealth varies across countries. Incountries such as Bolivia, India, Nigeria and Peru, children in the richest house-holds are at a distinct advantage compared to children in other households.Tis contrasts with Ethiopia, where stunting is widespread. Even among chil-dren living in the wealthiest Ethiopian households, the prevalence of stuntingis high, at 30 percent. Similarly, in Bangladesh, stunting in children less than
5 years of age is found in one-fourth of the richest households. And in Egypt,stunting prevalence is remarkably similar across income groups (30 percent and27 percent among the poorest and richest households, respectively).
Te poorest children also tend to have the poorest dietary quality. In Ethiopia,Kenya and Nigeria, for example, the wealthiest children are twice as likely toconsume animal source foods as the poorest. In South Africa, they're almostthree times as likely.
gum
7/31/2019 Estado Mundial de las Madres
http://slidepdf.com/reader/full/estado-mundial-de-las-madres 24/70
22 chapter title goeS here
Su Sudn

7/31/2019 Estado Mundial de las Madres
http://slidepdf.com/reader/full/estado-mundial-de-las-madres 25/70

7/31/2019 Estado Mundial de las Madres
http://slidepdf.com/reader/full/estado-mundial-de-las-madres 26/70
24 SaiNg lieS aND BUilDiNg a Better FUtUre : loW-coSt SolUt ioNS that WorK
Breasteeding – Human breast milk provides all the nutrients newborns
need for healthy development and also provides important antibodies againstcommon childhood illnesses. Exclusive breastfeeding prevents babies fromingesting contaminated water that could be mixed with infant formula. Teprotective benets of breastfeeding have been shown to be most signicant with6 months of exclusive breastfeeding and with continuation after 6 months, incombination with nutritious complementary foods (solids), up to age 2. Inconditions that normally exist in developing countries, breastfed children areat least 6 times more likely to survive in the early months than non-breastfedchildren.
Complementary eeding – When breast milk alone is no longer sucientto meet a child’s nutritional needs, other foods and liquids must be addedto a child’s diet in addition to breast milk. Optimal complementary feed-
ing involves factors such as the quantity and quality of food, frequency andtimeliness of feeding, food hygiene, and feeding during/after illnesses. Tetarget range for complementary feeding is 6-23 months. WHO notes thatbreastfeeding should not be decreased when starting complementary feeding;complementary foods should be given with a spoon or a cup, not in a bottle;foods should be clean, safe and locally available; and ample time should be givenfor young children to learn to eat solid foods. Rates of malnutrition amongchildren usually peak during the time of complementary feeding. Growthfaltering is most evident between 6-12 months, when foods of low nutrientdensity begin to replace breast milk and rates of diarrheal illness due to foodcontamination are at their highest. During the past decade, there has beenconsiderable improvement in breastfeeding practices in many countries; how-ever, similar progress has not been made in the area of complementary feeding.Complementary feeding is a proven intervention that can signicantly reducestunting during the rst two years of life. If all children in the developing
world received adequate complementary feeding, stunting rates at 12 monthscould be cut by 20 percent.
Vitamin A supplements – Roughly a third of all preschool-age children(190 million) and 15 percent of pregnant women (19 million) do not haveenough vitamin A in their daily diet. Vitamin A deciency is a contributingfactor in the 1.3 million deaths each year from diarrhea among children and thenearly 118,000 deaths from measles. Severe deciency can also cause irrevers-ible corneal damage, leading to partial or total blindness. Vitamin A capsules
given to children twice a year can prevent blindness and lower a child’s risk of death from common childhood diseases – at a cost of only 2 cents per capsule.It is estimated that at least 2 percent of child deaths could be prevented if allchildren under age 5 received two doses of vitamin A each year.
Zinc for diarrhea – Diarrhea causes the death of 1.3 million children eachyear, most of them between the ages of 6 months and 2 years. Young childrenare especially vulnerable because a smaller amount of uid loss causes sig-nicant dehydration, because they have fewer internal resources, and becausetheir energy requirements are higher. Children in developing nations suer anaverage of three cases of diarrhea a year. Diarrhea robs a child’s body of vitalnutrients, causing malnutrition. Malnutrition, in turn, decreases the ability of the immune system to ght further infections, making diarrheal episodes
more frequent. Repeated bouts of diarrhea stunt children’s growth and keepthem out of school, which further limits their chances for a successful future.
Promotin an supportinPromotin an supportin
arl nitiation of arl nitiation of BreatfeeinBreatfeein
Despite its benefts, many women delay Despite its benefts, many women delay initiation o breasteeding. Only 43 percentinitiation o breasteeding. Only 43 percento newborns in developing countries areo newborns in developing countries areput to the breast within one hour o birth.put to the breast within one hour o birth.Establishing good breasteeding practicesEstablishing good breasteeding practicesin the frst days is critical to the health o in the frst days is critical to the health o the inant and to breasteeding success.the inant and to breasteeding success.Initiating breasteeding is easiest and mostInitiating breasteeding is easiest and mostsuccessul when a mother is physically successul when a mother is physically and psychologically prepared or birth andand psychologically prepared or birth and
breasteeding and when she is inormed,breasteeding and when she is inormed,supported, and confdent o her ability tosupported, and confdent o her ability tocare or her newborn. Te ollowing actionscare or her newborn. Te ollowing actionscan increase rates o early initiation o can increase rates o early initiation o breasteeding:breasteeding:
•• Identiy the practices, belies, concernsIdentiy the practices, belies, concernsand constraints to early and exclusiveand constraints to early and exclusivebreasteeding and address them throughbreasteeding and address them throughappropriate messages and changes inappropriate messages and changes indelivery and postnatal proceduresdelivery and postnatal procedures
•• Counsel women during prenatal care onCounsel women during prenatal care onearly initiation and exclusive breasteedingearly initiation and exclusive breasteeding
•• Upgrade the skills o birth attendants toUpgrade the skills o birth attendants tosupport early and exclusive breasteedingsupport early and exclusive breasteeding
•• Make skin-to-skin contact and initiationMake skin-to-skin contact and initiationo breasteeding the frst routine atero breasteeding the frst routine aterdelivery delivery
•• Praise the mother or giving colostrumPraise the mother or giving colostrum(the “frst milk”), provide ongoing(the “frst milk”), provide ongoingencouragement, and assist with positionencouragement, and assist with position--ing and attachmenting and attachment

7/31/2019 Estado Mundial de las Madres
http://slidepdf.com/reader/full/estado-mundial-de-las-madres 27/70
Sae the chilDre N · State oF the WorlD’S MotherS 2012 25
N
—
* D f Sudn ssn f rub f Su S udn n Juy 2011.
Te annual estimated number o under-5 lives saved represents the potential combinedTe annual estimated number o under-5 lives saved represents the potential combinedeect o scaling up the ollowing “liesaving six” interventions to universal coverage (seteect o scaling up the ollowing “liesaving six” interventions to universal coverage (setat 99%) by 00: iron olate supplementation during pregnancy, breasteeding (includingat 99%) by 00: iron olate supplementation during pregnancy, breasteeding (including
exclusive breasteeding or the frst six months and any breasteeding until 4 months),exclusive breasteeding or the frst six months and any breasteeding until 4 months),counseling on complementary eeding, vitamin A supplementation, zinc or treatment o counseling on complementary eeding, vitamin A supplementation, zinc or treatment o diarrhea and improved hygiene practices (i.e. access to sae drinking water, use o improveddiarrhea and improved hygiene practices (i.e. access to sae drinking water, use o improvedsanitation acilities, sae disposal o children's stool, handwashing with soap). In the ew sanitation acilities, sae disposal o children's stool, handwashing with soap). In the ew instances where intervention coverage data was missing, developing world averages wereinstances where intervention coverage data was missing, developing world averages wereused. LiS analysis was done by Save the Children, with support rom Johns Hopkinsused. LiS analysis was done by Save the Children, with support rom Johns HopkinsUniversity Bloomberg School o Public Health. Estimates or the number o stunted chilUniversity Bloomberg School o Public Health. Estimates or the number o stunted chil--dren in country were calculated by Save the Children.dren in country were calculated by Save the Children.
—
D sus: My nd und-5 un, UNice F. The State of the World’s Children 2012 . tbs 1 nd 6; Sunn, Whogb Dbs n cd gw nd Mnun (us.n/nuwb /.), UNiceF gb Dbs s (dnf.) ndn DhS nd MicS suvys (s f a 2012)
When children with diarrhea are given zinc tablets along with oral rehydration
solution, they recover more quickly from diarrhea and they are protected fromrecurrences. At 2 cents a tablet, a full lifesaving course of zinc treatment fordiarrhea costs less than 30 cents. It is estimated that 4 percent of child deathscould be prevented if all young children with diarrhea were treated with zinc.
Water, sanitation and hygiene – Poor access to safe water and sanitationservices, coupled with poor hygiene practices, kills and sickens millions of children each year. Hand washing with soap is one of the most eective andinexpensive ways to prevent diarrheal disease and pneumonia, which togetherare responsible for approximately 2.9 million child deaths every year. It isestimated that 3 percent of child deaths could be prevented with access tosafe drinking water, improved sanitation facilities and good hygiene practices,especially hand washing.
e Can save 1.3 illion Live in ee 12 Countrie e Can save 1.3 illion Live in ee 12 Countrie
UNDer-5 DeathS chilD StUNtiNg lieS SaeD
# (1,000s) rnk cuny % # (1,000s) rnk # (1,000s)
1,696 1 ind 48% 61,300 1 326
861 2 N 41% 10,900 2 308
465 3 Dr cn 43% 5,100 8 145
423 4 pksn 42% 8,900 3 100
315 5 cn 9% 7,700 5 22
271 6 e 44% 5,300 7 73
191 7 afnsn 59% 3,300 11 125
151 8 indns 40% 8,700 4 36
143 9 Sudn nd Su Sudn* 35% 2,200 16 31
141 10 Und 39% 2,500 13 51
140 11 Bnds 41% 6,100 6 22
133 12 tnzn 43% 3,400 10 45
otal live ave: 1.3 million
7/31/2019 Estado Mundial de las Madres
http://slidepdf.com/reader/full/estado-mundial-de-las-madres 28/70
26 SaiNg lieS aND BUilDiNg a Better FUtUre : loW-coSt SolUt ioNS that WorK
F d ddLR Fdg sCRCRd
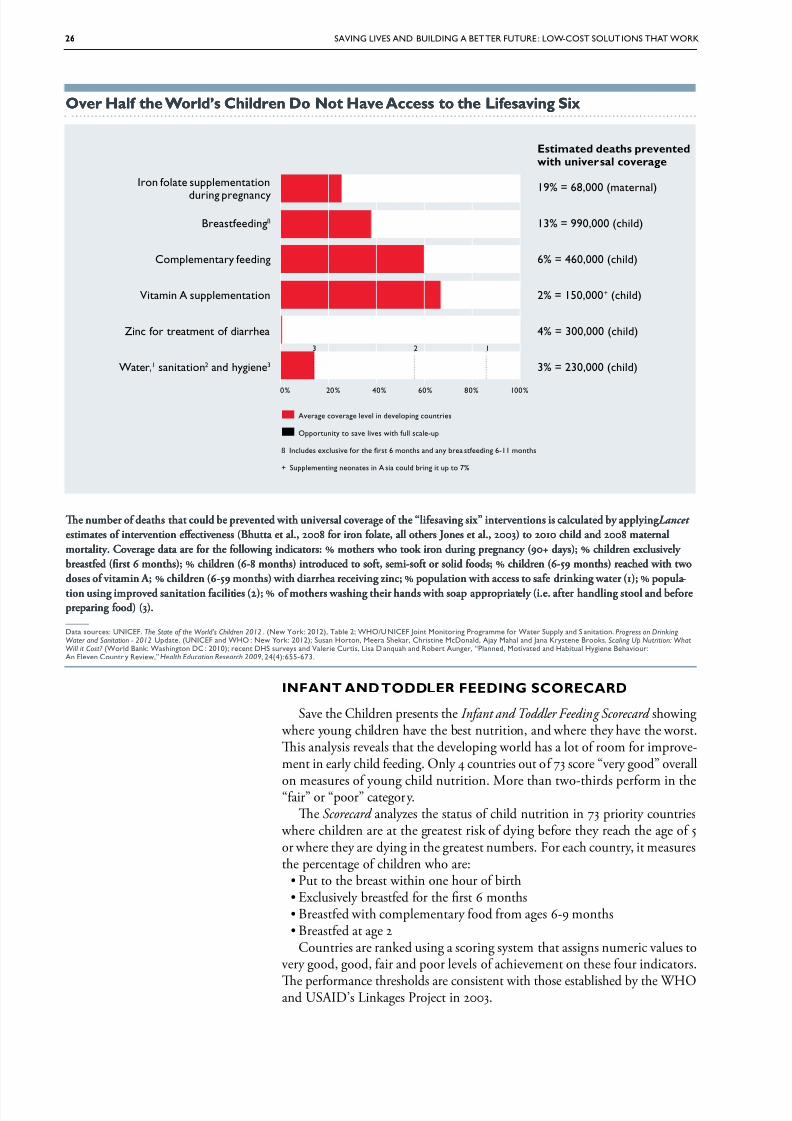
Save the Children presents the Infant and Toddler Feeding Scorecard showing where young children have the best nutrition, and where they have the worst.Tis analysis reveals that the developing world has a lot of room for improve-ment in early child feeding. Only 4 countries out of 73 score “very good” overall
on measures of young child nutrition. More than two-thirds perform in the“fair” or “poor” category.Te Scorecard analyzes the status of child nutrition in 73 priority countries
where children are at the greatest risk of dying before they reach the age of 5or where they are dying in the greatest numbers. For each country, it measuresthe percentage of children who are:
• Put to the breast within one hour of birth • Exclusively breastfed for the rst 6 months • Breastfed with complementary food from ages 6-9 months • Breastfed at age 2Countries are ranked using a scoring system that assigns numeric values to
very good, good, fair and poor levels of achievement on these four indicators.
Te performance thresholds are consistent with those established by the WHOand USAID’s Linkages Project in 2003.
ver half te orl’ Cilren do ot have cce to te Lifeavin sixver half te orl’ Cilren do ot have cce to te Lifeavin six
in f sumnn
dun nny
Bsfdnß
cmmny fdn
mn a sumnn
Zn f mn f d
W,1 snn2 nd yn3
timate eat prevente wit univeral coverae
19% = 68,000 (mn)
13% = 990,000 (d)
6% = 460,000 (d)
2% = 150,000+ (d)
4% = 300,000 (d)
3% = 230,000 (d)
■ av v v n dvn uns
■ ouny sv vs w fu s-u
ß inuds xusv f s 6 mns nd ny b sfdn 6-11 mns
+ Sumnn nns n a s ud bn u 7%
0% 20% 40% 60% 80% 100%
3 2 1
Te number o deaths that could be prevented with universal coverage o the “liesaving six” interventions is calculated by applyingTe number o deaths that could be prevented with universal coverage o the “liesaving six” interventions is calculated by applying Lancet Lancet estimates o intervention eectiveness (Bhutta et al., 008 or iron olate, all others Jones et al., 003) to 010 child and 008 maternalestimates o intervention eectiveness (Bhutta et al., 008 or iron olate, all others Jones et al., 003) to 010 child and 008 maternalmortality. Coverage data are or the ollowing indicators: % mothers who took iron during pregnancy (90+ days); % children exclusively mortality. Coverage data are or the ollowing indicators: % mothers who took iron during pregnancy (90+ days); % children exclusively breasted (frst 6 months); % children (6-8 months) introduced to sot, semi-sot or solid oods; % children (6-59 months) reached with twobreasted (frst 6 months); % children (6-8 months) introduced to sot, semi-sot or solid oods; % children (6-59 months) reached with twodoses o vitamin A; % children (6-59 months) with diarrhea receiving zinc; % population with access to sae drinking water (1); % popula doses o vitamin A; % children (6-59 months) with diarrhea receiving zinc; % population with access to sae drinking water (1); % popula --
tion using improved sanitation acilities (); % o mothers washing their hands with soap appropriately (i.e. ater handling stool and beoretion using improved sanitation acilities (); % o mothers washing their hands with soap appropriately (i.e. ater handling stool and beorepreparing ood) (3).preparing ood) (3).
—
D sus: UNiceF. The State of the World’s Children 2012 . (Nw k: 2012), tb 2; Who/U NiceF Jn Mnn pmm f W Suy nd S nn. Progress on Drinking Water and Sanitation - 2012 Ud. (UNiceF nd Who : Nw k: 2012); Susn hn, M Sk, csn MDnd, ajy M nd Jn Kysn Bks, Scaling Up Nutrition: WhatWill it Cost? (Wd Bnk: Wsnn Dc : 2010); n DhS suvys nd cus, ls D nqu nd rb aun, “pnnd, Mvd nd hbu hyn Bvu:an evn cun y rvw,” Health Education Research 2009, 24(4):655-673.
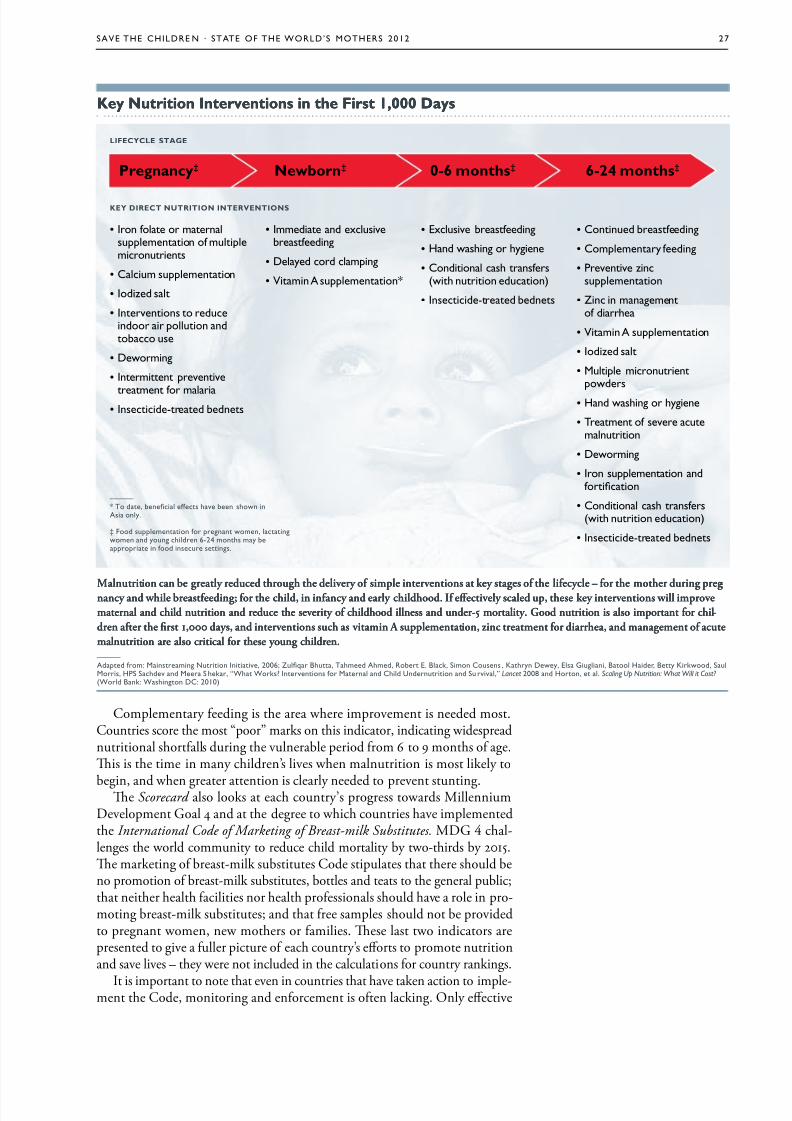
7/31/2019 Estado Mundial de las Madres
http://slidepdf.com/reader/full/estado-mundial-de-las-madres 29/70
Sae the chilDre N · State oF the WorlD’S MotherS 2012 27
Complementary feeding is the area where improvement is needed most.Countries score the most “poor” marks on this indicator, indicating widespreadnutritional shortfalls during the vulnerable period from 6 to 9 months of age.Tis is the time in many children’s lives when malnutrition is most likely to
begin, and when greater attention is clearly needed to prevent stunting.Te Scorecard also looks at each country’s progress towards MillenniumDevelopment Goal 4 and at the degree to which countries have implementedthe International Code of Marketing of Breast-milk Substitutes. MDG chal-lenges the world community to reduce child mortality by two-thirds by 2015.Te marketing of breast-milk substitutes Code stipulates that there should beno promotion of breast-milk substitutes, bottles and teats to the general public;that neither health facilities nor health professionals should have a role in pro-moting breast-milk substitutes; and that free samples should not be providedto pregnant women, new mothers or families. Tese last two indicators arepresented to give a fuller picture of each country’s eorts to promote nutritionand save lives – they were not included in the calculations for country rankings.
It is important to note that even in countries that have taken action to imple-ment the Code, monitoring and enforcement is often lacking. Only eective
Malnutrition can be greatly reduced through the delivery o simple interventions at key stages o the liecycle – or the mother during pregMalnutrition can be greatly reduced through the delivery o simple interventions at key stages o the liecycle – or the mother during preg--nancy and while breasteeding; or the child, in inancy and early childhood. I eectively scaled up, these key interventions will improvenancy and while breasteeding; or the child, in inancy and early childhood. I eectively scaled up, these key interventions will improvematernal and child nutrition and reduce the severity o childhood illness and under-5 mortality. Good nutrition is also important or chilmaternal and child nutrition and reduce the severity o childhood illness and under-5 mortality. Good nutrition is also important or chil--dren ater the frst 1,000 days, and interventions such as vitamin A supplementation, zinc treatment or diarrhea, and management o acutedren ater the frst 1,000 days, and interventions such as vitamin A supplementation, zinc treatment or diarrhea, and management o acutemalnutrition are also critical or these young children.malnutrition are also critical or these young children. —
add fm: Mnsmn Nun inv, 2006; Zuq Bu, tmd amd, rb e. Bk, Smn cusns , Kyn Dwy, es gun, B hd, By Kkwd, SuMs, hpS Sdv nd M S k, “W Wks? invnns f Mn nd cd Undnun nd Su vv,” Lancet 2008 nd hn, . Scaling Up Nutrition: What Will it Cost? (Wd Bnk: Wsnn Dc: 2010)
• in f mnsumnn f mumnuns
• cum sumnn
• idzd s
• invnns dund un ndb us
• Dwmn
• inmn vnv
mn f m • insd-d bdns
• immd nd xusvbsfdn
• Dyd d mn
• mn a sumnn*
• exusv bsfdn
• hnd wsn yn
• cndn s nsfs(w nun dun)
• insd-d bdns
• cnnud bsfdn
• cmmny fdn
• pvnv znsumnn
• Zn n mnmnf d
• mn a sumnn
• idzd s
• Mu mnunwds
• hnd wsn yn
• tmn f sv umnun
• Dwmn
• in sumnn ndfn
• cndn s nsfs(w nun dun)
• insd-d bdns
Ke utrition ntervention in te Firt 1,000 daKe utrition ntervention in te Firt 1,000 da
—
* t d, bn ffs v bn swn nas ny.
‡ Fd sumnn f nn wmn, nwmn nd yun dn 6-24 mns my b n fd nsu sns.
Ky dRC UR RVs
LFCyCL sg
Prenanc‡ ewborn‡ 0-6 mont‡ 6-24 mont‡

7/31/2019 Estado Mundial de las Madres
http://slidepdf.com/reader/full/estado-mundial-de-las-madres 30/70
28 SaiNg lieS aND BUilDiNg a Better FUtUre : loW-coSt SolUt ioNS that WorK
national laws that are properly enforced can stop baby food companies fromcompeting with breastfeeding. In fact, a recent WHO review of global nutritionpolicies found that only a third of the 96 countries reported to have enactedCode legislation also had eective monitoring mechanisms in place.
Te op 4 countries on the Scorecard – Malawi, Madagascar, Peru and theSolomon Islands – are also regional leaders in terms of child survival. Malawiand Madagascar have made more progress in reducing under-5 mortality thanany other countries in sub-Saharan Africa. Peru has made the most progressof any country in Latin America. And Solomon Islands has one of the lowestrates of child mortality in the East Asia and Pacic region. Tese countries havealso made improvements in early initiation of breastfeeding and other feedingpractices in recent years.
Te Bottom 4 countries – Somalia, Côte d’Ivoire, Botswana and EquatorialGuinea – have made little to no progress in early feeding or in saving children’slives. Somalia, the lowest-ranked country on the Scorecard , has made no progresssince 1990 in reducing under-5 mortality, and in recent years the prevalence of underweight and stunted children in Somalia has risen by at least 10 percent-age points.
CMalawi tops the Infant and Toddler Feeding Scorecard ranking, demonstrat-
ing impressive achievements in child nutrition. Overall, Malawi is doing avery good job of feeding young children according to recommended stan-dards, and this is saving many lives. Within an hour after birth, 95 percent of babies in Malawi are put to the breast. At 6 months, 71 percent are still beingexclusively breastfed, and between 6-9 months, 87 percent are breastfed withcomplementary foods. At age 2, 77 percent of children are still getting some of their nutrition from breast milk. Malawi has enacted many provisions of theInternational Code of Marketing of Breast-milk Substitutes into law and has putsignicant energy and resources into improving health services for its people.
Many improvements can be attributed in part to the work of 10,000 healthsurveillance assistants who are deployed in rural areas. Tese trained, salariedfrontline workers deliver preventative health care and counsel families abouthealthy behaviors such as hygiene, nutrition and breastfeeding (see the story of one health worker on page 35). Malawi is an African success story, having reducedits under-5 mortality rate by 59 percent since 1990. It is one of a handful of sub-Saharan African countries that are on track to achieve MDG . While Malawiis to be applauded for its results in promoting breastfeeding and saving lives,the country still has one of the highest percentages of stunted children in the world (48 percent). Tis paradox indicates that additional eorts are needed toensure children get good nutrition as they are weaned o breast milk.
Madagascar is another African success story, on track to achieve MDG ,
with a 61 percent reduction in child mortality since 1990. Strong performanceon infant and young child feeding indicators has contributed to Madagascar’ssuccess in saving hundreds of thousands of lives. Madagascar’s Ministry of Health, in partnership with the AED/Linkages Project (funded by USAID),launched a major eort in 1999 to raise public awareness of the benets of breastfeeding. Te campaign used interpersonal communications, commu-nity mobilization events and local mass media to reach 6.3 million people
with positive messages about breastfeeding. Since the launch of the project,exclusive breastfeeding rates have increased from 41 to 51 percent and timely initiation of breastfeeding within an hour of birth has risen from 34 to 72percent. Madagascar also does well on measures of complementary feeding(89 percent) and breastfeeding at age 2 (61 percent). Madagascar has enactedmost provisions of the breast-milk substitutes Code into law. As in Malawi,
Mw
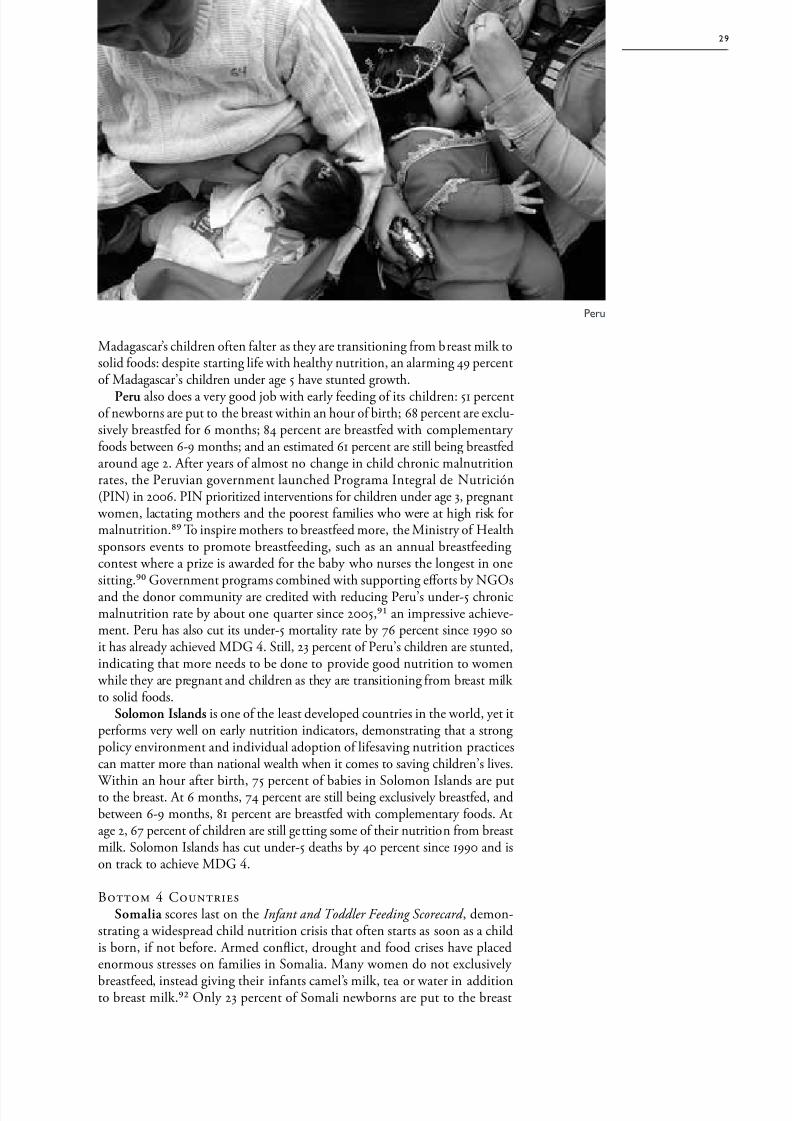
7/31/2019 Estado Mundial de las Madres
http://slidepdf.com/reader/full/estado-mundial-de-las-madres 31/70
Sae the chilDre N · State oF the WorlD’S MotherS 2012 29
Madagascar’s children often falter as they are transitioning from breast milk tosolid foods: despite starting life with healthy nutrition, an alarming 49 percentof Madagascar’s children under age 5 have stunted growth.
Peru also does a very good job with early feeding of its children: 51 percentof newborns are put to the breast within an hour of birth; 68 percent are exclu-sively breastfed for 6 months; 84 percent are breastfed with complementary foods between 6-9 months; and an estimated 61 percent are still being breastfedaround age 2. After years of almost no change in child chronic malnutritionrates, the Peruvian government launched Programa Integral de Nutrición(PIN) in 2006. PIN prioritized interventions for children under age 3, pregnant
women, lactating mothers and the poorest families who were at high risk formalnutrition. o inspire mothers to breastfeed more, the Ministry of Healthsponsors events to promote breastfeeding, such as an annual breastfeedingcontest where a prize is awarded for the baby who nurses the longest in onesitting. Government programs combined with supporting eorts by NGOsand the donor community are credited with reducing Peru’s under-5 chronicmalnutrition rate by about one quarter since 2005, an impressive achieve-ment. Peru has also cut its under-5 mortality rate by 76 percent since 1990 soit has already achieved MDG . Still, 23 percent of Peru’s children are stunted,indicating that more needs to be done to provide good nutrition to women while they are pregnant and children as they are transitioning from breast milk to solid foods.
Solomon Islands is one of the least developed countries in the world, yet itperforms very well on early nutrition indicators, demonstrating that a strongpolicy environment and individual adoption of lifesaving nutrition practicescan matter more than national wealth when it comes to saving children’s lives.
Within an hour after birth, 75 percent of babies in Solomon Islands are putto the breast. At 6 months, 74 percent are still being exclusively breastfed, andbetween 6-9 months, 81 percent are breastfed with complementary foods. Atage 2, 67 percent of children are still getting some of their nutrition from breastmilk. Solomon Islands has cut under-5 deaths by 40 percent since 1990 and ison track to achieve MDG .
B CSomalia scores last on the Infant and Toddler Feeding Scorecard , demon-
strating a widespread child nutrition crisis that often starts as soon as a childis born, if not before. Armed conict, drought and food crises have placedenormous stresses on families in Somalia. Many women do not exclusively
breastfeed, instead giving their infants camel’s milk, tea or water in additionto breast milk. Only 23 percent of Somali newborns are put to the breast
pu

7/31/2019 Estado Mundial de las Madres
http://slidepdf.com/reader/full/estado-mundial-de-las-madres 32/70
30 SaiNg lieS aND BUilDiNg a Better FUtUre : loW-coSt SolUt ioNS that WorK
within an hour of birth; only 5 percent are exclusively breastfed for 6 monthsand 15 percent are breastfed with complementary foods between 6-9 months. At age 2, it is estimated that 27 percent of children are still getting some breastmilk. Somalia has the lowest complementary feeding rate and the highest childmortality rate in the world. ragically, 1 child in 6 dies before reaching age 5.
Years of political and economic instability in Somalia have also contributedto severe increases in stunting – up from 29 percent in 2000 to 42 percent in2006. Somalia has made no progress towards MDG .
Côte d'Ivoire is another country where conict and instability have created adire situation for mothers and children. Only 25 percent of Ivorian newborns areput to the breast within an hour of birth; only 4 percent are exclusively breastfedfor 6 months; and 54 percent are breastfed with complementary foods between6-9 months. At age 2, it is estimated that 37 percent of children are still gettingsome breast milk. One child in 12 dies before reaching age 1 and 39 percentof children are stunted. Côte d'Ivoire has made insucient progress towardsMDG , and has taken little action on the International Code of Marketing of Breast-milk Substitutes .
In Botswana , breastfeeding was once widely practiced but today, only
20 percent of infants are exclusively breastfed. Botswana has been hard hit by AIDS, and many infected mothers likely do not breastfeed for fear they mightpass along the disease to their babies. However, if given the right treatment withantiretrovirals (ARVs), HIV-positive mothers can safely breastfeed. And even without ARVs, in places where there is little access to clean water, sanitation orhealth services, the risk that a child will die of diarrhea or another childhooddisease outweighs the risk of contracting HIV through breast milk, at leastduring the early months. Most HIV-positive mothers in developing countriesare advised to exclusively breastfeed, but this message has met resistance inBotswana. Poorly trained health workers often do not encourage this recom-mended practice. And despite good eorts by the government to discourageformula feeding by enacting most of the Code into law, the policies and pro-
grams to ensure that HIV-positive mothers are informed about the risks andbenets of dierent infant feeding options – and are supported in carrying outtheir infant feeding decisions – remain inadequate. Largely as a result, only 20percent of Botswana’s newborns are put to the breast within an hour of birth. Atages 6-9 months, 46 percent are breastfed with complementary foods and at age2, only 6 percent of children are getting any breast milk at all. Botswana’s infantmortality rate is 36 per 1,000 live births and 31 percent of children are stunted.
Equatorial Guinea is the highest income country in Africa, demonstratingthat national wealth alone is not sucient to prevent malnutrition. Only 24percent of babies in Equatorial Guinea are exclusively breastfed for 6 monthsand 48 percent are breastfed with complementary foods between 6-9 months.
At age 2, it is estimated that just 10 percent of children are still getting some
breast milk. Equatorial Guinea has made insucient progress towards MDG ,and has taken no action on the International Code of Marketing of Breast-milk Substitutes . One child in 12 dies before reaching age 1 and 35 percent of chil-dren have stunted growth.
cô d’iv
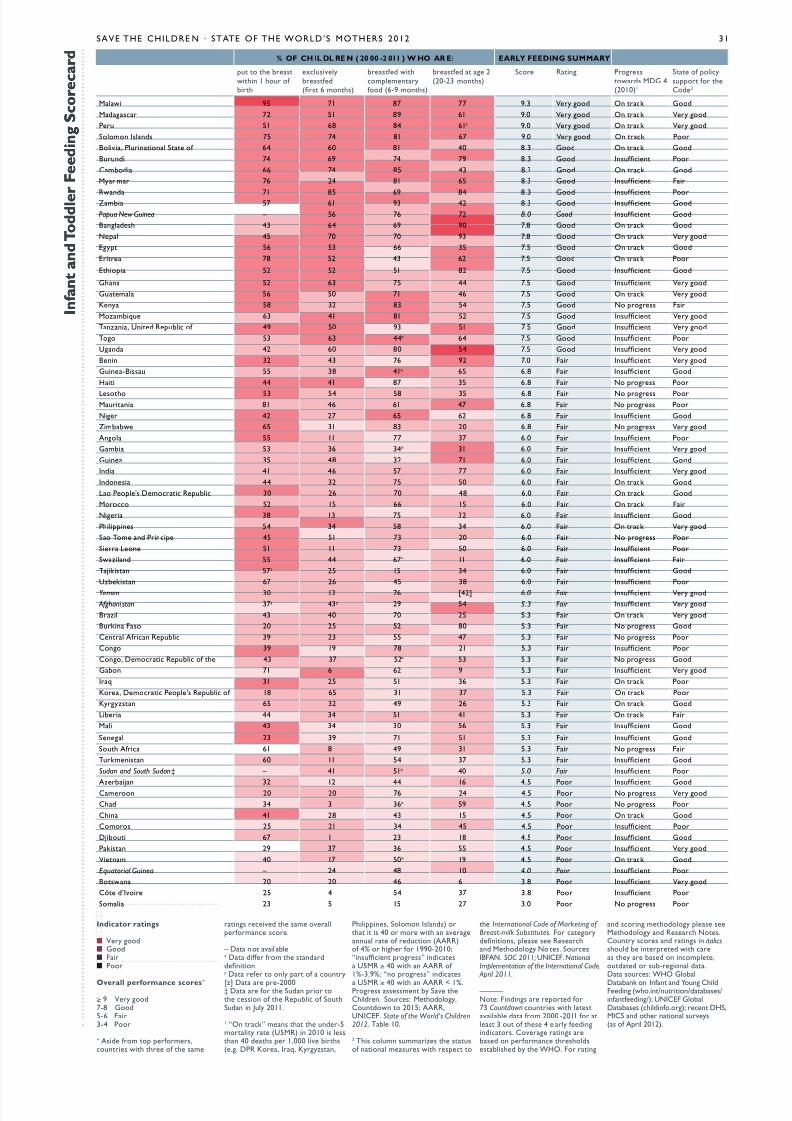
7/31/2019 Estado Mundial de las Madres
http://slidepdf.com/reader/full/estado-mundial-de-las-madres 33/70
Sae the chilDre N · State oF the WorlD’S MotherS 2012 31
n f a n t a n d o d d l e r F e e d i n g s c o r e c a r d
n f a n t a n d o d d l e r F e e d i n g s c o r e c a r d
nicator ratin
■ y d■ gd■ F■ p
verall performance core+
≥ 9 y d7-8 gd5-6 F3-4 p
+ asd fm fms,uns w f sm
ns vd sm vfmn s.
– D n v bx D dff fm sndddnny D f ny f uny
[z] D -2000‡ D f Sudn ssn f rub f SuSudn n Juy 2011.
1 “on k” mns und-5my (U5Mr) n 2010 s ssn 40 ds 1,000 v bs(.. Dpr K, iq, Kyyzsn,
pns, Smn isnds) s 40 m w n vnnu f dun (aarr)f 4% f 1990-2010;“nsufn ss” nds U5Mr ≥ 40 w n aarr f 1%-3.9%; “n ss” nds
U5Mr ≥ 40 w n aarr < 1%.pss ssssmn by Sv cdn. Sus: Mdy,cundwn 2015; aarr,UNiceF. State of the World’s Children2012. tb 10.
2 ts umn summzs susf nn msus w s
International Code of Marketing of Breast-milk Substitutes. F ydnns, s s rsnd Mdy N s. Sus:iBFaN. SOC 2011; UNiceF. National Implementation of the International Code.
April 2011.
—
N: Fndns d f73 Countdown uns w svb d fm 2000 -2011 f s 3 u f s 4 y fdnnds. cv ns bsd n fmn sdssbsd by Who. F n
nd sn mdy s sMdy nd rs Ns.cuny ss nd ns n italics sud b nd w s y bsd n nm,udd sub-n d.D sus: Who gb
Dbnk n infn nd un cdFdn (w.n/nun/dbss/nfnfdn/); UNiceF gbDbss (dnf.); n DhS,MicS nd nn suvys(s f a 2012).
% F Ch L dL R ( 20 00 -2 011 ) h R : RLy Fdg sURy
u bswn 1 u f b
xusvybsfd(s 6 mns)
bsfd wmmnyfd (6-9 mns)
bsfd 2(20-23 mns)
S rn psswds MDg 4(2010)1
S f ysu f cd2
Mw 95 71 87 77 9.3 y d on k gd
Mds 72 51 89 61 9.0 y d on k y d
pu 51 68 84 61z 9.0 y d on k y d
Smn isnds 75 74 81 67 9.0 y d on k p
Bv, punn S f 64 60 81 40 8.3 gd on k gd
Buund 74 69 74 79 8.3 gd insufn p
cmbd 66 74 85 43 8.3 gd on k gd
Mynm 76 24 81 65 8.3 gd insufn F
rwnd 71 85 69 84 8.3 gd insufn pZmb 57 61 93 42 8.3 gd insufn gd
Papua New Guinea – 56 76 72 8.0 Good insufn gd
Bnds 43 64 69 90 7.8 gd on k gd
N 45 70 70 93 7.8 gd on k y d
ey 56 53 66 35 7.5 gd on k gd
e 78 52 43 62 7.5 gd on k p
e 52 52 51 82 7.5 gd insufn gd
gn 52 63 75 44 7.5 gd insufn y d
gum 56 50 71 46 7.5 gd on k y d
Kny 58 32 83 54 7.5 gd N ss F
Mzmbqu 63 41 81 52 7.5 gd insufn y d
tnzn, Und rub f 49 50 93 51 7.5 gd insufn y d
t 53 63 44x 64 7.5 gd insufn p
Und 42 60 80 54 7.5 gd insufn y d
Bnn 32 43 76 92 7.0 F insufn y d
gun-Bssu 55 38 41x 65 6.8 F insufn gd
h 44 41 87 35 6.8 F N ss p
ls 53 54 58 35 6.8 F N ss pMun 81 46 61 47 6.8 F N ss p
N 42 27 65 62 6.8 F insufn gd
Zmbbw 65 31 83 20 6.8 F N ss y d
an 55 11 77 37 6.0 F insufn p
gmb 53 36 34x 31 6.0 F insufn y d
gun 35 48 32 71 6.0 F insufn gd
ind 41 46 57 77 6.0 F insufn y d
indns 44 32 75 50 6.0 F on k gd
l p’s Dm rub 30 26 70 48 6.0 F on k gd
M 52 15 66 15 6.0 F on k F
N 38 13 75 32 6.0 F insufn gd
pns 54 34 58 34 6.0 F on k y d
S tm nd pn 45 51 73 20 6.0 F N ss p
S ln 51 11 73 50 6.0 F insufn p
Swznd 55 44 67x 11 6.0 F insufn F
tjksn 57z 25 15 34 6.0 F insufn gd
Uzbksn 67 26 45 38 6.0 F insufn p
Yemen 30 12 76 [42] 6.0 Fair insufn y d
Afghani stan 37y 43y 29 54 5.3 Fair insufn y d
Bz 43 40 70 25 5.3 F on k y d
Bukn Fs 20 25 52 80 5.3 F N ss gd
cn afn rub 39 23 55 47 5.3 F N ss p
cn 39 19 78 21 5.3 F insufn p
cn, Dm rub f 43 37 52x 53 5.3 F N ss gd
gbn 71 6 62 9 5.3 F insufn y d
iq 31 25 51 36 5.3 F on k p
K, Dm p’s rub f 18 65 31 37 5.3 F on k p
Kyyzsn 65 32 49 26 5.3 F on k gd
lb 44 34 51 41 5.3 F on k F
M 43 34 30 56 5.3 F insufn gd
Sn 23 39 71 51 5.3 F insufn gd
Su af 61 8 49 31 5.3 F N ss F
tukmnsn 60 11 54 37 5.3 F insufn gd
Sudan and South Sudan‡ – 41 51x 40 5.0 Fair insufn p
azbjn 32 12 44 16 4.5 p insufn gdcmn 20 20 76 24 4.5 p N ss y d
cd 34 3 36x 59 4.5 p N ss p
cn 41 28 43 15 4.5 p on k gd
cms 25 21 34 45 4.5 p insufn p
Djbu 67 1 23 18 4.5 p insufn gd
pksn 29 37 36 55 4.5 p insufn y d
nm 40 17 50x 19 4.5 p on k gd
Equatorial Guinea – 24 48 10 4.0 Poor insufn p
Bswn 20 20 46 6 3.8 p insufn y d
cô d’iv 25 4 54 37 3.8 p insufn p
Sm 23 5 15 27 3.0 p N ss p
7/31/2019 Estado Mundial de las Madres
http://slidepdf.com/reader/full/estado-mundial-de-las-madres 34/70
hLh RKRs R Ky sUCCss
Frontline health workers have a vital role to play in ensuring good nutritionin the rst 1,000 days. In impoverished communities in the developing world where malnutrition is most common, doctors and hospitals are often unavail-able, too far away, or too expensive. Frontline health workers meet critical needsin these communities by supporting and promoting breastfeeding, distributingvitamins and other micronutrients, counseling mothers about balanced diet andimproved complementary feeding, promoting hygiene and sanitation, screeningchildren for malnutrition, and treating diarrhea and pneumonia.
Frontline health workers deliver advice and services to families in theirhomes and in clinics, serving as counselors, educators and treatment provid-ers. Because they often come from the communities they serve, community
health workers and midwives understand the beliefs, practices and norms of thepeople, allowing them to provide health care that is more culturally appropriate,and often highly eective.
Te “lifesaving six” interventions highlighted in this report can all be deliv-ered in remote, impoverished places by well-trained and well-equipped localhealth workers. In a number of countries, these health workers have contrib-uted to broad-scale success in ghting malnutrition and saving lives. Someexamples follow.
• In Cambodia , exclusive breastfeeding rates climbed dramatically from 11percent in 2000 to 74 percent in 2010. Much of the credit goes to eortssuch as the Baby-Friendly Community Initiative, which organized “MotherSupport Groups” to provide education and individual counseling on infantand young child feeding. Tese volunteer-led groups have reached approxi-mately 517,000 women in 2,675 villages, promoting early and exclusivebreastfeeding, continued nursing to 2 years or beyond, and appropriatecomplementary feeding starting at 6 months of age.
• Nepal has 50,000 female community health volunteers, 97 percent of whomare in rural areas. Tese volunteers are chosen from and work for the com-munity. Tey play an important role in contributing to a variety of publichealth programs, including family planning, maternal care, child health,vitamin A supplementation and immunization coverage. Anemia was aserious public health problem in Nepal for many years, but now the healthvolunteers have helped increase iron folate supplementation to 81 percent
(up from 23 percent in 2001). At the national level, the prevalence of anemia in women of reproductive age decreased from 68 percent in 1998to 35 percent in 2011. Trough this and other eorts, Nepal succeededin cutting its maternal mortality rate in half – from 539 deaths per 100,000live births in 1996 to 281 in 2006.
• India ’s Bihar State – one of the poorest in the nation – is at the forefrontof the battle against vitamin A deciency, which aicts up to 62 percentof preschool-aged children in rural India. Te state set the ambitious goalof reaching out to all children, beginning with those traditionally excludedfrom services – children from the lower castes and minority groups – in which malnutrition and mortality rates are often highest. More than 11,000
health centers and 80,000 anganwadis , or child development centers, serveas core distribution sites for vitamin A supplements in Bihar. In addition,
o mprove Cil utrition,o mprove Cil utrition,
ucate girlucate girl
Te evidence is clear: When better-educatedTe evidence is clear: When better-educatedgirls grow up and become mothers, they girls grow up and become mothers, they tend to have ewer, healthier and better-tend to have ewer, healthier and better-nourished children. Educating girls is onenourished children. Educating girls is oneo the most eective ways there is to fghto the most eective ways there is to fghtmalnutrition and break the intergenera malnutrition and break the intergenera --tional cycle o malnutrition.tional cycle o malnutrition.
Studies the world over have linkedStudies the world over have linkedmaternal education with improved nutrimaternal education with improved nutri--tion status o children. For example, a 003tion status o children. For example, a 003analysis by the International Food Policy analysis by the International Food Policy
Research Institute estimated that improvedResearch Institute estimated that improvedemale education was “responsible oremale education was “responsible oralmost 43 percent o the total reduction inalmost 43 percent o the total reduction inundernutrition across 63 countries betweenundernutrition across 63 countries between1971 and 1995.”1971 and 1995.”
Improvements in maternal educa Improvements in maternal educa --tion also lead to lower mortality rates intion also lead to lower mortality rates inchildren. UNESCO has estimated thatchildren. UNESCO has estimated thateach additional year o girls’ education caneach additional year o girls’ education canreduce child mortality by 9 percent and thatreduce child mortality by 9 percent and thatuniversal secondary education could saveuniversal secondary education could save1.8 million children's lives in sub-Saharan1.8 million children's lives in sub-Saharan Arica alone. Arica alone.
Te “Copenhagen Consensus 008” (a Te “Copenhagen Consensus 008” (a
panel o eight distinguished economists,panel o eight distinguished economists,including fve Nobel Laureates) rankedincluding fve Nobel Laureates) rankedinvestments in education, especially orinvestments in education, especially orgirls, as providing some o the best returnsgirls, as providing some o the best returnso all development interventions. Loweringo all development interventions. Loweringthe price o schooling and increasing andthe price o schooling and increasing andimproving girls’ education ranked 7th andimproving girls’ education ranked 7th and8th out o their top 10 best investments in8th out o their top 10 best investments indevelopment.development.
Despite the many benefts to individualsDespite the many benefts to individualsand society, ar too many girls in developingand society, ar too many girls in developingcountries are still deprived o an educa countries are still deprived o an educa --tion. Worldwide, an estimated 36 milliontion. Worldwide, an estimated 36 million
primary-school-aged girls are not enrolledprimary-school-aged girls are not enrolledin school.in school.
32 SaiNg lieS aND BUilDiNg a Better FUtUre : loW-coSt SolUt ioNS that WorK

7/31/2019 Estado Mundial de las Madres
http://slidepdf.com/reader/full/estado-mundial-de-las-madres 35/70
Sae the chilDre N · State oF the WorlD’S MotherS 2012 33
h, 30, m n N, sw w mu f dffn md wn s bsfd d d xusvy f s sx mns. Snds s mu n s w dbs. Photo by Honey Malla
N
ere’ otin Better an oter’ ilkere’ otin Better an oter’ ilk
Like mothers everywhere, Hira has a lot o Like mothers everywhere, Hira has a lot o demands on her time and energy. She hasdemands on her time and energy. She hasthree small boys to look ater and her husthree small boys to look ater and her hus--band is away or months at a time workingband is away or months at a time workingoutside the country, so Hira has to manageoutside the country, so Hira has to manageon her own.on her own.
Hira started breasteeding all three o Hira started breasteeding all three o her children as soon as they were born, buther children as soon as they were born, butshe had diculty continuing with the frstshe had diculty continuing with the frsttwo. With her husband away, she had totwo. With her husband away, she had totend to their small arm, so she couldn’ttend to their small arm, so she couldn’tbreasteed as requently as she wanted to.breasteed as requently as she wanted to.
Ater about three months, she did not think Ater about three months, she did not think she had enough o her own milk to eedshe had enough o her own milk to eedthe boys, so she started giving themthe boys, so she started giving them leetoleeto (a (a porridge made o wheat and soy). Both boysporridge made o wheat and soy). Both boyssuered requent ailments such as comsuered requent ailments such as com--mon colds, coughs, ever, pneumonia andmon colds, coughs, ever, pneumonia anddiarrhea.diarrhea.
When Hira became pregnant with her When Hira became pregnant with herthird child, she started getting help romthird child, she started getting help romthe emale community health volunteer inthe emale community health volunteer inher village, a woman named Bhagawati,her village, a woman named Bhagawati, who was trained by Save the Children. who was trained by Save the Children.Bhagawati counseled Hira about improvingBhagawati counseled Hira about improvingher diet, and taking vitamins and iron, soher diet, and taking vitamins and iron, so
she could be stronger. She also explainedshe could be stronger. She also explained
why it is important to breasteed exclusively why it is important to breasteed exclusively or the frst six months o a child’s lie, thenor the frst six months o a child’s lie, thento start introducing oods liketo start introducing oods like leetoleeto ater six ater six months. “I was not aware that the mother’smonths. “I was not aware that the mother’smilk is so good or the child,” said Hira.milk is so good or the child,” said Hira.“Tat it protects children rom disease and“Tat it protects children rom disease andinection.”inection.”
Hira’s third son, Sandesh, got nothingHira’s third son, Sandesh, got nothingbut breast milk or his frst six months.but breast milk or his frst six months.“Not even water,” Hira says proudly. “It is“Not even water,” Hira says proudly. “It is very easy to breasteed. It doesn’t take any very easy to breasteed. It doesn’t take any preparation time. It is hygienic, and I eedpreparation time. It is hygienic, and I eed
anytime the baby needs it. My two olderanytime the baby needs it. My two oldersons could not digest thesons could not digest the leetoleeto so early.so early.Sandesh is much healthier. He has only Sandesh is much healthier. He has only been sick once. I took him to be weighedbeen sick once. I took him to be weighedlast week – he is up to 16.5 pounds.”last week – he is up to 16.5 pounds.”
Hira started complementary eedingHira started complementary eedingSandesh when he reached 6 months o age.Sandesh when he reached 6 months o age.“Right now, I breasteed him frst thing in“Right now, I breasteed him frst thing inthe morning. I just started eeding himthe morning. I just started eeding him leetoleeto three times a day and he is able to digest it. Ithree times a day and he is able to digest it. Istill breasteed him at least six times a day.”still breasteed him at least six times a day.”Hira says she plans to continue breasteedHira says she plans to continue breasteed--ing Sandesh or a ew more years.ing Sandesh or a ew more years.

7/31/2019 Estado Mundial de las Madres
http://slidepdf.com/reader/full/estado-mundial-de-las-madres 36/70
34 SaiNg lieS aND BUilDiNg a Better FUtUre : loW-coSt SolUt ioNS that WorK
more than 3,400 temporary sites were organized to deliver vitamin A withinsmall, isolated communities. Frontline health and nutrition workers andcommunity volunteers in the 38 districts of Bihar were trained to adminis-ter preventive vitamin A syrup to children and to counsel mothers on how to improve the vitamin A content of their children’s diet. In 2009, Bihar’svitamin A supplementation program reached 13.4 million children under 5,protecting 95 percent of children in this age group against the devastatingconsequences of vitamin A deciency. In 2010, national coverage for Indiaas a whole was estimated at only 34 percent.
• Vietnam has a strong public health system at all levels that includes over100,000 community health workers and a specic cadre called “nutritioncollaborators” who sta clinics and do home visits. Tese health workersscreen children for malnutrition, treat diarrhea and counsel mothers aboutbreastfeeding, balanced diet, hygiene and sanitation. With the help of thesehealth workers, Vietnam is making promising progress toward the MDGs.By 2015 the country is almost certain to reach MDGs and related tochild and maternal mortality. Since 1990, Vietnam has cut child mortality by 55 percent and maternal mortality by 66 percent. Over the past
two decades Vietnam has also cut child stunting by over 60 percent (from61 percent in 1989 to 23 percent in 2010) and since 2005, the country hasnearly eliminated iodine deciency in pregnant women and children.
• In Mali, community health workers in one program helped ensure morethan 90 percent of mothers took daily doses of iron-folic acid and multiplemicronutrients. In nationwide eorts from 2002-2007, Mali’s govern-ment trained 22,000 community health workers on several nutrition-relatedinterventions to improve child survival. Each health worker was responsiblefor 35 households and was expected to visit each household monthly. Tehealth workers delivered vitamin A to women and children under 5. Tey also discussed the benets of exclusive breastfeeding in the rst 6 months of
life and the risks of giving water instead of breast milk. Program-specicresults are not available, but national-level surveys have reported early initia-tion of breastfeeding increased from 10 percent in 1995/96, to 43 percent in2007. Exclusive breastfeeding rose from 8 to 34 percent.
• In Mongolia , community health volunteers deliver multiple micronutrientpowders – known as “Sprinkles” – that can improve vitamin and mineralintake among children over 6 months old. Te powders contain up to 15vitamins and minerals (such as iron, and vitamins A and D), are relatively tasteless, odorless, colorless, and are safe and easy to use. Tey cost about 3cents per sachet (one child typically gets 60 to 90 sachets per year). Mongoliais introducing Sprinkles as part of an integrated approach to improve young
child feeding and reduce anemia and stunting. In 2001, when the country began distributing Sprinkles as part of a pilot program, around 42 percent of preschool-age children were anemic. Public health workers and community volunteers gave 30 sachets monthly to children. One year into the program,13,000 children, or more than 80 percent of those targeted, had receivedmulti-micronutrient powders, and anemia was reduced to half of baselinelevels. Mongolia is currently scaling-up the program nationally, aimingto reach 49,480 children under age 2. Nurses, public health workers andcommunity volunteers are distributing sachets at health posts.
nm

7/31/2019 Estado Mundial de las Madres
http://slidepdf.com/reader/full/estado-mundial-de-las-madres 37/70
Sae the chilDre N · State oF the WorlD’S MotherS 2012 35
csm Bx xmns anny’s f k f dm.csm ws nd by Sv cdn dv my n n sd u mmuny n Mw. anny’sm My s fu s ds n v wk 14 msss ud, munnus n ns fy wn dn sk. Photo by Amos Gumulira
Chisomo, the village heath worker, visitedChisomo, the village heath worker, visitedMercy Benson and her children as oten asMercy Benson and her children as oten ashe could because he noticed a lot o healthhe could because he noticed a lot o healthproblems in the household. Te amily problems in the household. Te amily couldn’t aord much ood, they were drink couldn’t aord much ood, they were drink --ing unsae water and cooking in unsanitary ing unsae water and cooking in unsanitary conditions. Chisomo was especially worriedconditions. Chisomo was especially worriedabout Anthony, the youngest child, whoabout Anthony, the youngest child, whohad been sick with malaria, diarrhea andhad been sick with malaria, diarrhea andother ailments.other ailments.
Anthony’s health problems intensifed Anthony’s health problems intensifed
when he was about a year old and Mercy when he was about a year old and Mercy stopped breasteeding him. Mercy was pregstopped breasteeding him. Mercy was preg--nant again, and she mistakenly believed shenant again, and she mistakenly believed sheshouldn’t breasteed because it would takeshouldn’t breasteed because it would takenutrition away rom the baby in her womb.nutrition away rom the baby in her womb. Anthony started getting diarrhea more Anthony started getting diarrhea morerequently, and a ew months later Chisomorequently, and a ew months later Chisomodiscovered Anthony was malnourished,discovered Anthony was malnourished,and getting worse.and getting worse.
Chisomo treated Anthony’s diarrhea Chisomo treated Anthony’s diarrhea with oral rehydration solution and zinc. with oral rehydration solution and zinc.He explained to Mercy that she shouldHe explained to Mercy that she shouldresume breasteeding, because it would helpresume breasteeding, because it would help
Anthony get better and it would not harm Anthony get better and it would not harmher pregnancy. “I advised Mercy to prepareher pregnancy. “I advised Mercy to prepare
ood or Anthony and the rest o the amily ood or Anthony and the rest o the amily using multi-mix ood principles. Tis meansusing multi-mix ood principles. Tis meansstaple oods, legumes, resh vegetables andstaple oods, legumes, resh vegetables andoils should all be eaten as a single meal,”oils should all be eaten as a single meal,”said Chisomo. “I also taught her aboutsaid Chisomo. “I also taught her abouthygienic ood handling practices and envihygienic ood handling practices and envi--ronmental sanitation. Better reuse disposalronmental sanitation. Better reuse disposal would fx their condition once and or all. I would fx their condition once and or all. Idislike crude dumping. It contributes to thedislike crude dumping. It contributes to thespread o diarrheal disease.”spread o diarrheal disease.”
Chisomo checked in on the Bensons a Chisomo checked in on the Bensons a
ew weeks later. “I noticed great improveew weeks later. “I noticed great improve--ments!” he said. “Te amily responded toments!” he said. “Te amily responded tomy advice. Tey improved their hygiene tomy advice. Tey improved their hygiene toprevent diarrhea. Anthony no longer hadprevent diarrhea. Anthony no longer hadedema due to malnutrition. And I was very edema due to malnutrition. And I was very pleased to see Mercy breasteeding duringpleased to see Mercy breasteeding duringmy visit.”my visit.”
Save the Children sta visited Anthony Save the Children sta visited Anthony in March 01, and ound him healthy,in March 01, and ound him healthy,playul and laughing with his sisters andplayul and laughing with his sisters andbrothers. “Anthony is no longer malnourbrothers. “Anthony is no longer malnour--ished,” said Chisomo. “He is ully recoveredished,” said Chisomo. “He is ully recoveredand he is even picking up weight.”and he is even picking up weight.”
Peronal pproac to Fitin alnutrition Peronal pproac to Fitin alnutrition
Mw

7/31/2019 Estado Mundial de las Madres
http://slidepdf.com/reader/full/estado-mundial-de-las-madres 38/70
36 SaiNg lieS aND BUilDiNg a Better FUtUre : loW-coSt SolUt ioNS that WorK
• Brazil has more than 246,000 community health agents serving 120 millionpeople (63 percent of the population). Te health agents make home visits
where they promote healthy practices such as breastfeeding, monitor thegrowth of children and counsel on follow up, and provide simple treatmentssuch as oral rehydration solution for diarrhea. Tese health workers areresidents of the communities they serve and are selected in a public process with strong community engagement. Te health worker program has beenin place nationally since the early 1990s. Since that time there has beenover a 90 percent decline in diarrhea-related mortality, and stunting hasbeen reduced from 19 to 7 percent.
• Pakistan began training and deploying “Lady Health Workers” in 1994.Tere are now more than 90,000 female health workers throughout thecountry, serving 70 percent of the rural population. Lady Health Workersfocus largely on essential maternal and newborn care. Teir training empha-sizes maternal nutrition, iron and folate use, rest during pregnancy and
promotion of breastfeeding. EachLady Health Worker looks aftera population of about 1,000 indi-
viduals. At group meetings, she willdiscuss issues related to better health,hygiene, nutrition, sanitation andfamily planning, emphasizing theirbenefits towards improved qual-ity of life. In household visits, she
will treat iron deciency anemia in women and young chi ldren, andprovide nutritional education withemphasis on breastfeeding and com-plementary feeding practices, andmaternal nutrition, including waysto reduce micronutrient malnutri-tion. Pakistan still does poorly onbreastfeeding indicators, but trendsare moving in the right direction.Exclusive breastfeeding rates increasedfrom 23 percent in 1990/91 to 37 per-cent in 2006/07. During that sameperiod, rates of early initiation rosethree-fold, from 9 to 29 percent.Over roughly the same period (1990-2008), maternal mortality dropped by
nearly half.
Greater investments are needed torecruit, train and supervise/supportmore frontline health workers to buildon these successes. WHO estimatesthere is a shortage of at least 1 mil-lion frontline health workers in thedeveloping world. And many exist-ing health workers could do more toght malnutrition if they had bettertraining, equipment and support.
Bz
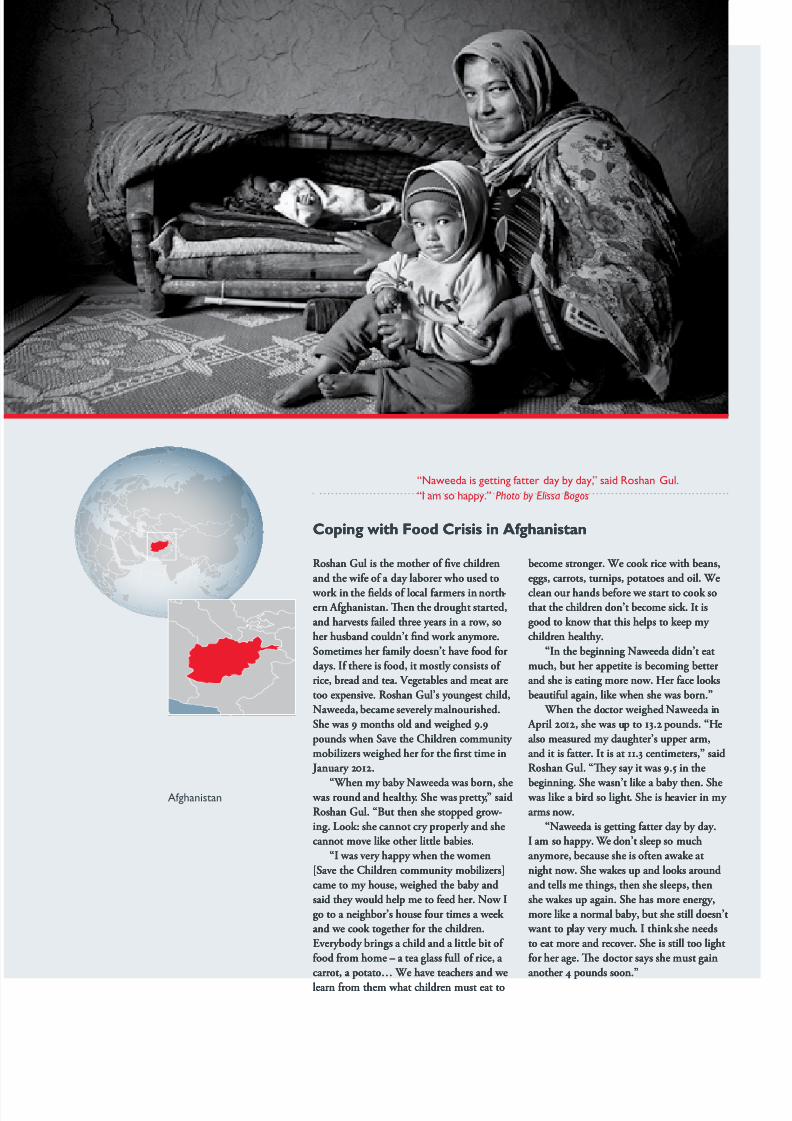
7/31/2019 Estado Mundial de las Madres
http://slidepdf.com/reader/full/estado-mundial-de-las-madres 39/70
Sae the chilDre N · State oF the WorlD’S MotherS 2012 37
“Nwd s n f dy by dy,” sd rsn gu.“i m s y.” Photo by Elissa Bogos
Roshan Gul is the mother o fve childrenRoshan Gul is the mother o fve childrenand the wie o a day laborer who used toand the wie o a day laborer who used to
work in the felds o local armers in north work in the felds o local armers in north--ern Aghanistan. Ten the drought started,ern Aghanistan. Ten the drought started,and harvests ailed three years in a row, soand harvests ailed three years in a row, soher husband couldn’t fnd work anymore.her husband couldn’t fnd work anymore.Sometimes her amily doesn’t have ood orSometimes her amily doesn’t have ood ordays. I there is ood, it mostly consists o days. I there is ood, it mostly consists o rice, bread and tea. Vegetables and meat arerice, bread and tea. Vegetables and meat aretoo expensive. Roshan Gul’s youngest child,too expensive. Roshan Gul’s youngest child,Naweeda, became severely malnourished.Naweeda, became severely malnourished.She was 9 months old and weighed 9.9She was 9 months old and weighed 9.9pounds when Save the Children community pounds when Save the Children community mobilizers weighed her or the frst time inmobilizers weighed her or the frst time in January 01. January 01.
“When my baby Naweeda was born, she“When my baby Naweeda was born, she was round and healthy. She was pretty,” said was round and healthy. She was pretty,” saidRoshan Gul. “But then she stopped grow Roshan Gul. “But then she stopped grow --ing. Look: she cannot cry properly and sheing. Look: she cannot cry properly and shecannot move like other little babies.cannot move like other little babies.
“I was very happy when the women“I was very happy when the women[Save the Children community mobilizers][Save the Children community mobilizers]came to my house, weighed the baby andcame to my house, weighed the baby andsaid they would help me to eed her. Now Isaid they would help me to eed her. Now Igo to a neighbor’s house our times a week go to a neighbor’s house our times a week and we cook together or the children.and we cook together or the children.Everybody brings a child and a little bit o Everybody brings a child and a little bit o ood rom home – a tea glass ull o rice, a ood rom home – a tea glass ull o rice, a carrot, a potato… We have teachers and wecarrot, a potato… We have teachers and welearn rom them what children must eat tolearn rom them what children must eat to
become stronger. We cook rice with beans,become stronger. We cook rice with beans,eggs, carrots, turnips, potatoes and oil. Weeggs, carrots, turnips, potatoes and oil. We
clean our hands beore we start to cook soclean our hands beore we start to cook sothat the children don’t become sick. It isthat the children don’t become sick. It isgood to know that this helps to keep my good to know that this helps to keep my children healthy.children healthy.
“In the beginning Naweeda didn’t eat“In the beginning Naweeda didn’t eatmuch, but her appetite is becoming bettermuch, but her appetite is becoming betterand she is eating more now. Her ace looksand she is eating more now. Her ace looksbeautiul again, like when she was born.”beautiul again, like when she was born.”
When the doctor weighed Naweeda in When the doctor weighed Naweeda in April 01, she was up to 13. pounds. “He April 01, she was up to 13. pounds. “Healso measured my daughter’s upper arm,also measured my daughter’s upper arm,and it is atter. It is at 11.3 centimeters,” saidand it is atter. It is at 11.3 centimeters,” saidRoshan Gul. “Tey say it was 9.5 in theRoshan Gul. “Tey say it was 9.5 in the
beginning. She wasn’t like a baby then. Shebeginning. She wasn’t like a baby then. She was like a bird so light. She is heavier in my was like a bird so light. She is heavier in my arms now.arms now.
“Naweeda is getting atter day by day.“Naweeda is getting atter day by day.I am so happy. We don’t sleep so muchI am so happy. We don’t sleep so muchanymore, because she is oten awake atanymore, because she is oten awake atnight now. She wakes up and looks aroundnight now. She wakes up and looks aroundand tells me things, then she sleeps, thenand tells me things, then she sleeps, thenshe wakes up again. She has more energy,she wakes up again. She has more energy,more like a normal baby, but she still doesn’tmore like a normal baby, but she still doesn’t want to play very much. I think she needs want to play very much. I think she needsto eat more and recover. She is still too lightto eat more and recover. She is still too lightor her age. Te doctor says she must gainor her age. Te doctor says she must gainanother 4 pounds soon.”another 4 pounds soon.”
Copin wit Foo Crii in fanitanCopin wit Foo Crii in fanitan
afnsn
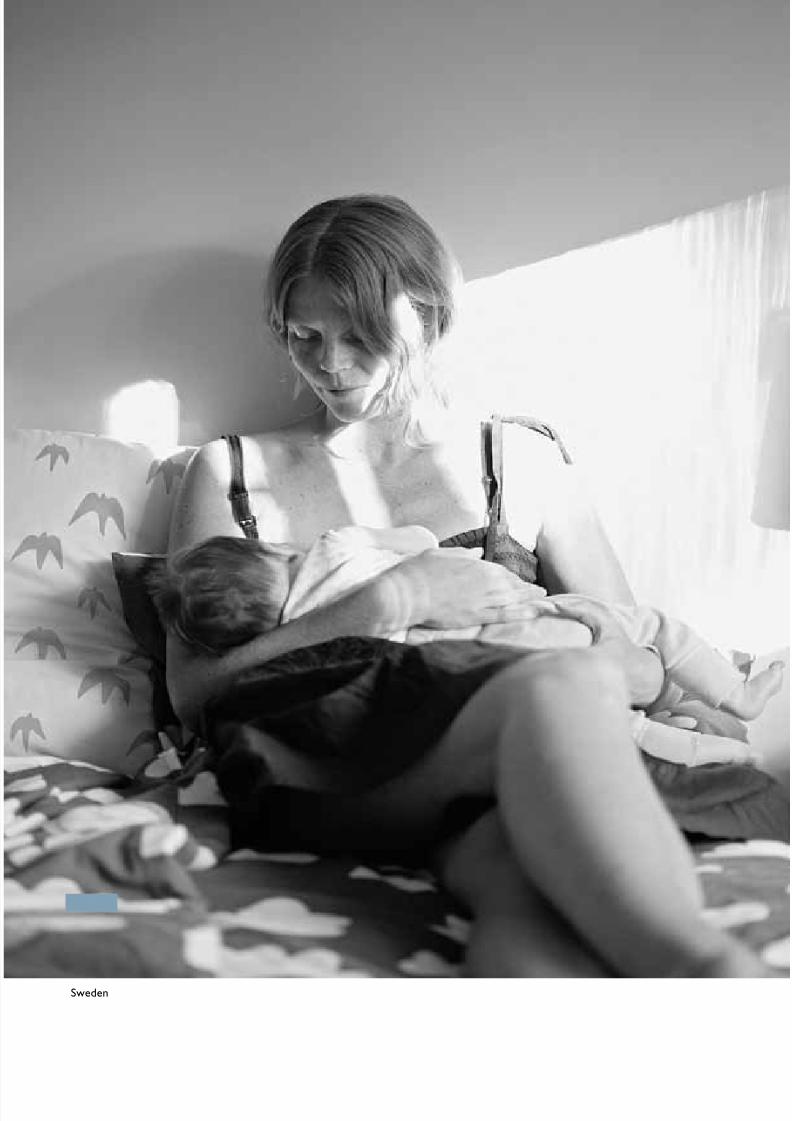
7/31/2019 Estado Mundial de las Madres
http://slidepdf.com/reader/full/estado-mundial-de-las-madres 40/70
38 chapter title goeS here
Swdn

7/31/2019 Estado Mundial de las Madres
http://slidepdf.com/reader/full/estado-mundial-de-las-madres 41/70
Sae the chilDre N · State oF the WorlD’S MotherS 2012 39
In developed countries, breastfeeding usually is not critical to an infant’s sur-
vival, as it often is in impoverished developing countries. Uncontaminated,nutritious alternatives to breast milk are readily available in wealthier countries,and while malnutrition does exist, it is relatively uncommon. Still, breastfeedinghas many benets for mothers and babies, and more can be done to supportmothers who want to breastfeed.
According the World Health Organization, exclusive breastfeeding for therst six months is best for babies everywhere . Babies who are fed formula andstop breastfeeding early have higher risks of illness, obesity, allergies and sud-den infant death syndrome (SIDS). Tey tend to require more doctor visits,hospitalizations and prescriptions. Various studies also suggest breastfeedingenhances a child’s cognitive development. While health professionals agreethat human milk provides the most complete form of nutrition for infants,
there are a few exceptions when breastfeeding is not advised, such as whenthe mother is taking certain drugs or is infected with HIV or tuberculosis.
Mothers who breastfeed have lower risks of breast and ovarian cancers.Breastfeeding delays the return to fertility and helps a mother lose the weightshe gained while pregnant. In the long term, breastfeeding reduces the risk of type 2 diabetes. It also increases the physical and emotional bond betweena mother and her child.
In all countries of the world, it is cheaper to breastfeed than to feed a baby formula or other milk. Breastfeeding is also the most environment-friendly way to feed a baby. Breast milk does not require packaging, storage, transportationor refrigeration. It generates no waste, is a renewable resource, and requires noenergy to produce (except of course, the calories burned by the mother’s body).
Opinions vary on the benets of breastfeeding mixed with other foods inthe early months of a baby’s life. While some breast milk is seen as better thannone, a number of recent studies have suggested that the immunity benetsfor babies come only with exclusive breastfeeding.
Despite these many known benets of breastfeeding for mothers and theirchildren, signicant percentages of women in developed countries do notbreastfeed optimally.
In Belgium and the United Kingdom, only about 1 percent of children areexclusively breastfed for the rst 6 months. In Australia, Canada, Finland, Italy,Norway, Sweden, the United States and several other countries, 15 percent orfewer of children have 6 months of exclusive breastfeeding. Even the “best”
countries in the industrialized world have exclusive breastfeeding rates wellbelow 50 percent.Poor compliance with breastfeeding recommendations costs the world econ-
omy billions of dollars each year. In the United States alone, it is estimated thatlow rates of breastfeeding add $13 billion to medical costs and lead to 911 excessdeaths every year. In the United Kingdom, it was estimated in 1995 that theNational Health Service spent £35 million per year in England and Wales treat-ing gastroenteritis in formula-fed infants and that, for every 1 percent increasein breastfeeding at 13 weeks, £500,000 would be saved.
Te reasons why women don’t breastfeed are varied and complex. In mostdeveloped countries, the majority of women report they try to breastfeed, butthen at 3 months a signicant percentage are not breastfeeding exclusively, and
at 6 months many have stopped nursing (see table on p.43). Mothers who wantto breastfeed may become frustrated by physical challenges or the amount of
BreaStFeeDiNg iN the iNDUStrialiZeD WorlD
e double Buren:e double Buren:
huner an beithuner an beit
Childhood overweight and obesity are onChildhood overweight and obesity are onthe rise the world over. Tis is a growingthe rise the world over. Tis is a growingproblem in both rich and poor countriesproblem in both rich and poor countriesalike, with the poorest people in bothalike, with the poorest people in bothaected most. People with lower incomesaected most. People with lower incomestend to consume more at, meat and sugar,tend to consume more at, meat and sugar, while those with higher incomes consume while those with higher incomes consumemore ruit and vegetables. Children who aremore ruit and vegetables. Children who arenot breasted are at higher risk o obesity.not breasted are at higher risk o obesity.In addition, breasteeding or at least theIn addition, breasteeding or at least thefrst six months o lie appears to be a actorfrst six months o lie appears to be a actor
protecting against obesity.protecting against obesity.In the United States, 10 percent o In the United States, 10 percent o children under age 5 are overweight and anchildren under age 5 are overweight and anadditional 10 percent o - to 5-year-oldsadditional 10 percent o - to 5-year-oldsare at risk o overweight.are at risk o overweight. Among other Among otherdeveloped countries with available data, thedeveloped countries with available data, thehighest levels o child overweight (aroundhighest levels o child overweight (around0 percent or more) are ound in Albania,0 percent or more) are ound in Albania,Bosnia and Herzegovina, Georgia andBosnia and Herzegovina, Georgia andSerbia.Serbia.
Some o these countries also have largeSome o these countries also have largenumbers or high percentages o stuntednumbers or high percentages o stuntedchildren. In the United States, or example,children. In the United States, or example,4 percent o young children are estimated to4 percent o young children are estimated to
be stunted, which translates into 840,000be stunted, which translates into 840,000stunted children.stunted children. Stunting rates are overStunting rates are over10 percent in Bosnia and Herzegovina and10 percent in Bosnia and Herzegovina andGeorgia. In Albania, the rate is over 0Georgia. In Albania, the rate is over 0percent.percent.
Although being overweight is a problem Although being overweight is a problemmost oten associated with industrializedmost oten associated with industrializedcountries, obesity has been on the rise incountries, obesity has been on the rise indeveloping countries in recent years asdeveloping countries in recent years as well. Tis has lead to a “double burden” o well. Tis has lead to a “double burden” o malnutrition, where countries have highmalnutrition, where countries have highrates o both stunting and overweight. Inrates o both stunting and overweight. InComoros, or example, percent o youngComoros, or example, percent o young
children are overweight, while around hal children are overweight, while around hal are stunted. In Egypt, 1 percent o childrenare stunted. In Egypt, 1 percent o childrenunder 5 are overweight while 31 percent areunder 5 are overweight while 31 percent arestunted. Libya has stunting and overweightstunted. Libya has stunting and overweightrates above 0 percent. Other countriesrates above 0 percent. Other countries with serious levels o both extremes o with serious levels o both extremes o malnutrition include: Azerbaijan, Belize,malnutrition include: Azerbaijan, Belize,Benin, Botswana, Central Arican Republic,Benin, Botswana, Central Arican Republic,Djibouti, Indonesia, Iraq, Malawi,Djibouti, Indonesia, Iraq, Malawi,Mongolia, Morocco, Nigeria, Peru, Sierra Mongolia, Morocco, Nigeria, Peru, Sierra Leone and Syria.Leone and Syria.

7/31/2019 Estado Mundial de las Madres
http://slidepdf.com/reader/full/estado-mundial-de-las-madres 42/70
40 BreaStFeeDiNg iN the iNDUStrial iZeD WorlD
time required. Tey may lose condence if their baby has diculty latchingand there is not a lactation consultant or support group they can turn to foradvice. If she has a demanding work schedule, or lack of support at home, amother may be forced to stop breastfeeding or start using formula sooner thanshe would like.
Breastfeeding practices tend to vary widely across race, ethnicity, educationand income levels. Often, disadvantaged mothers breastfeed less that their moreprivileged counterparts.
In the United States, more than 80 percent of Hispanics and Asians beginbreastfeeding, but only 74 percent of whites and 54 percent of blacks do so.
Women with higher levels of education are more likely to breastfeed, but racialdierences are apparent across education levels. For example, even among wom-en with a college degree, blacks are less likely to breastfeed than whites. Tereare sharp geographical dierences as well: in eight states, most in the Southeast,less than 10 percent of infants are exclusively breastfed at 6 months.
Similar trends are found in Australia, where Aboriginal mothers are lesslikely to breastfeed than non-Aboriginal mothers. Poorer, less educated, womenbreastfeed less than women with post-school qualications. And mothers over30 are twice as likely to be breastfeeding their babies at 12 months of age (28percent) compared with mothers aged 18-29 years (14 percent).
In the United Kingdom, the highest incidences of breastfeeding are foundamong mothers from managerial and professional occupations, those withthe highest education levels and those age 30 and older. South Asian andblack mothers are more likely than white mothers to breastfeed initially, andto continue breastfeeding through six months. However, among mothers whobreastfeed exclusively at birth, the fall-o is greater among South Asian andblack mothers than among white mothers. For example, 70 percent of whitemothers who nursed exclusively at birth were still exclusive at one week, com-pared with 62 percent of South Asian and 52 percent of black mothers. Atfour months, 12 percent of white mothers were still exclusively breastfeeding,compared with 7 percent of South Asians and 5 percent of blacks.
aus
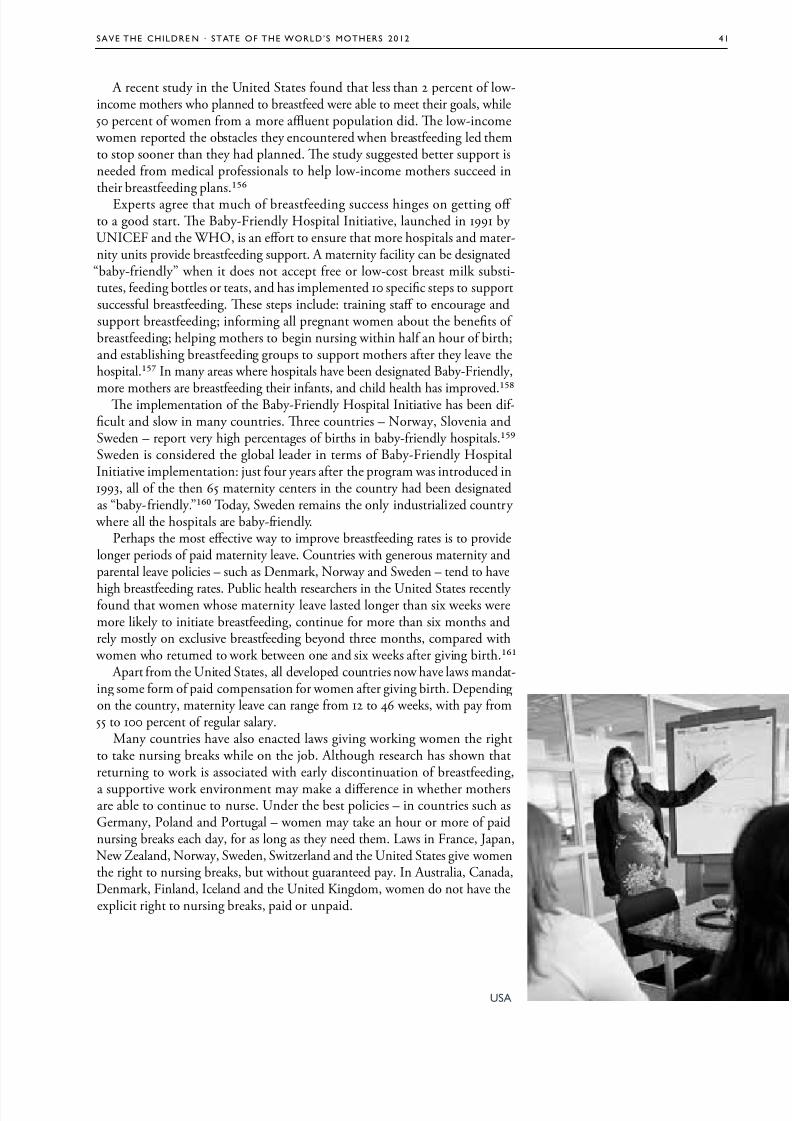
7/31/2019 Estado Mundial de las Madres
http://slidepdf.com/reader/full/estado-mundial-de-las-madres 43/70
Sae the chilDre N · State oF the WorlD’S MotherS 2012 41
A recent study in the United States found that less than 2 percent of low-income mothers who planned to breastfeed were able to meet their goals, while50 percent of women from a more auent population did. Te low-income women reported the obstacles they encountered when breastfeeding led themto stop sooner than they had planned. Te study suggested better support isneeded from medical professionals to help low-income mothers succeed intheir breastfeeding plans.
Experts agree that much of breastfeeding success hinges on getting o to a good start. Te Baby-Friendly Hospital Initiative, launched in 1991 by UNICEF and the WHO, is an eort to ensure that more hospitals and mater-nity units provide breastfeeding support. A maternity facility can be designated
“baby-friendly” when it does not accept free or low-cost breast milk substi-tutes, feeding bottles or teats, and has implemented 10 specic steps to supportsuccessful breastfeeding. Tese steps include: training sta to encourage andsupport breastfeeding; informing all pregnant women about the benets of breastfeeding; helping mothers to begin nursing within half an hour of birth;and establishing breastfeeding groups to support mothers after they leave thehospital. In many areas where hospitals have been designated Baby-Friendly,
more mothers are breastfeeding their infants, and child health has improved.Te implementation of the Baby-Friendly Hospital Initiative has been dif-cult and slow in many countries. Tree countries – Norway, Slovenia andSweden – report very high percentages of births in baby-friendly hospitals.Sweden is considered the global leader in terms of Baby-Friendly HospitalInitiative implementation: just four years after the program was introduced in1993, all of the then 65 maternity centers in the country had been designatedas “baby-friendly.” oday, Sweden remains the only industrialized country
where all the hospitals are baby-friendly.Perhaps the most eective way to improve breastfeeding rates is to provide
longer periods of paid maternity leave. Countries with generous maternity andparental leave policies – such as Denmark, Norway and Sweden – tend to have
high breastfeeding rates. Public health researchers in the United States recently found that women whose maternity leave lasted longer than six weeks weremore likely to initiate breastfeeding, continue for more than six months andrely mostly on exclusive breastfeeding beyond three months, compared with
women who returned to work between one and six weeks after giving birth. Apart from the United States, all developed countries now have laws mandat-
ing some form of paid compensation for women after giving birth. Dependingon the country, maternity leave can range from 12 to 46 weeks, with pay from55 to 100 percent of regular salary.
Many countries have also enacted laws giving working women the rightto take nursing breaks while on the job. Although research has shown thatreturning to work is associated with early discontinuation of breastfeeding,
a supportive work environment may make a dierence in whether mothersare able to continue to nurse. Under the best policies – in countries such asGermany, Poland and Portugal – women may take an hour or more of paidnursing breaks each day, for as long as they need them. Laws in France, Japan,New Zealand, Norway, Sweden, Switzerland and the United States give womenthe right to nursing breaks, but without guaranteed pay. In Australia, Canada,Denmark, Finland, Iceland and the United Kingdom, women do not have theexplicit right to nursing breaks, paid or unpaid.
USa
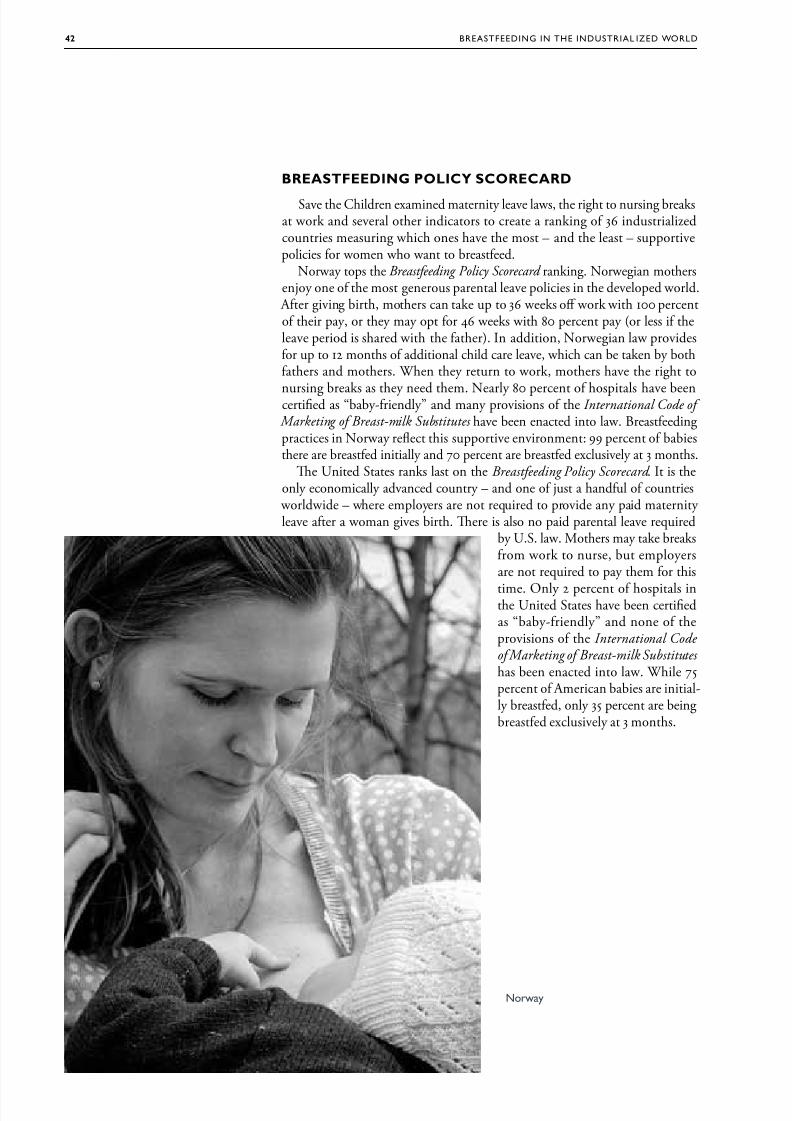
7/31/2019 Estado Mundial de las Madres
http://slidepdf.com/reader/full/estado-mundial-de-las-madres 44/70
42 BreaStFeeDiNg iN the iNDUStrial iZeD WorlD
BRsFdg PLCy sCRCRd
Save the Children examined maternity leave laws, the right to nursing breaksat work and several other indicators to create a ranking of 36 industrializedcountries measuring which ones have the most – and the least – supportivepolicies for women who want to breastfeed.
Norway tops the Breastfeeding Policy Scorecard ranking. Norwegian mothersenjoy one of the most generous parental leave policies in the developed world.
After giving birth, mothers can take up to 36 weeks o work with 100 percentof their pay, or they may opt for 46 weeks with 80 percent pay (or less if theleave period is shared with the father). In addition, Norwegian law providesfor up to 12 months of additional child care leave, which can be taken by bothfathers and mothers. When they return to work, mothers have the right to
nursing breaks as they need them. Nearly 80 percent of hospitals have beencertied as “baby-friendly” and many provisions of the International Code of Marketing of Breast-milk Substitutes have been enacted into law. Breastfeedingpractices in Norway reect this supportive environment: 99 percent of babiesthere are breastfed initially and 70 percent are breastfed exclusively at 3 months.
Te United States ranks last on the Breastfeeding Policy Scorecard . It is theonly economically advanced country – and one of just a handful of countries
worldwide – where employers are not required to provide any paid maternity leave after a woman gives birth. Tere is also no paid parental leave required
by U.S. law. Mothers may take breaksfrom work to nurse, but employersare not required to pay them for this
time. Only 2 percent of hospitals inthe United States have been certiedas “baby-friendly” and none of theprovisions of the International Code of Marketing of Breast-milk Substitutes has been enacted into law. While 75percent of American babies are initial-ly breastfed, only 35 percent are beingbreastfed exclusively at 3 months.
Nwy
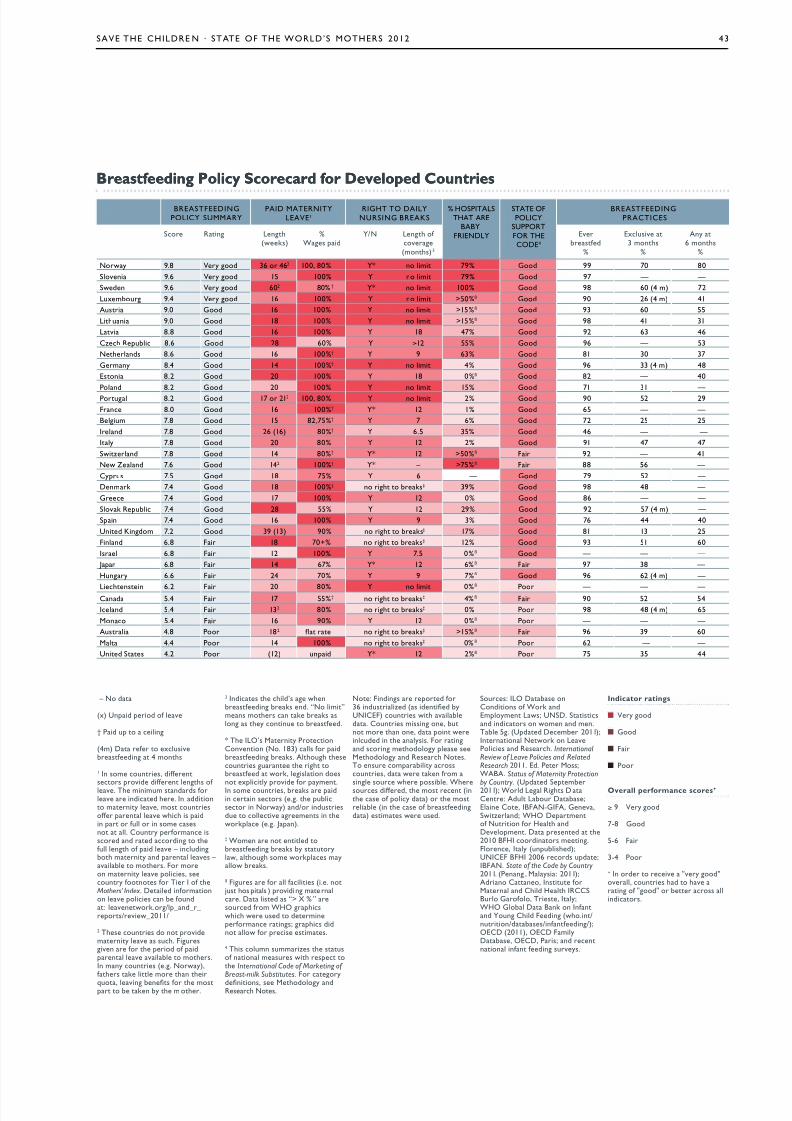
7/31/2019 Estado Mundial de las Madres
http://slidepdf.com/reader/full/estado-mundial-de-las-madres 45/70
Sae the chilDre N · State oF the WorlD’S MotherS 2012 43
Breatfeein Polic scorecar for develope CountrieBreatfeein Polic scorecar for develope Countrie
‐– N d
(x) Und d f v
† pd u n
(4m) D f xusvbsfdn 4 mns
1 in sm uns, dffn
ss vd dffn ns f v. t mnmum sndds fv ndd . in ddn mny v, ms unsff n v w s dn fu n sm ssn . cuny fmn ssd nd d dn fu n f d v‐– nudnb mny nd n vs – vb ms. F mn mny v s, suny fns f t i f
Mothers’ Index . Dd nfmnn v s n b fund: vnwk./_nd__ s/vw_2011/
2 ts uns d n vdmny v s su. Fusvn f d f dn v vb ms.in mny uns (.. Nwy),fs k m n
qu, vn bns f ms b kn by m .
3 inds d’s wnbsfdn bks nd. “N m”mns ms n k bks sn s y nnu bsfd.
* t ilo’s Mny pncnvnn (N. 183) s f dbsfdn bks. au suns un bsfd wk, sn ds
n xy vd f ymn.in sm uns, bks dn n ss (.. ubs n Nwy) nd/ ndussdu v mns n wk (.. Jn).
‡ Wmn n nd bsfdn bks by suyw, u sm wks myw bks.
ß Fus f fs (.. n jus s s ) vd n m n. D sd s “> % ” sud fm Who sw w usd dmnfmn ns; s ddn w f s sms.
4 ts umn summzs susf nn msus w s International Code of Marketing of Breast-milk Substitutes. F y
dnns, s Mdy ndrs Ns.
N: Fndns d f36 nduszd (s dnd byUNiceF) uns w vbd. cuns mssn n, bun m n n, d n wnudd n nyss. F nnd sn mdy s sMdy nd rs Ns.t nsu mby ssuns, d w kn fm
sn su w ssb. Wsus dffd, ms n (n s f y d) msb (n s f bsfdnd) sms w usd.
Sus: ilo Dbs ncndns f Wk ndemymn lws; UNSD. Sssnd nds n wmn nd mn.tb 5. (Udd Dmb 2011);innn Nwk n lvps nd rs. International Review of Leave Policies and Related Research 2011. ed. p Mss;WaBa. Status of Maternity Protection
by Country . (Udd Smb2011); Wd l rs D cn: adu lbu Dbs;en c, iBFaN-giFa, gnv,Swznd; Who Dmnf Nun f h ndDvmn. D snd 2010 BFhi dns mn.Fn, iy (unubsd);UNiceF BFhi 2006 ds ud;iBFaN. State of the Code by Country 2011. (pnn , Mys: 2011);adn cn, insu fMn nd cd h irccSBu gf, ts, iy;Who gb D Bnk n infnnd un cd Fdn (w.n/nun/dbss/nfnfdn/);oecD (2011), oecD FmyDbs, oecD, ps; nd nnn nfn fdn suvys.
nicator ratin
■ y d
■ gd
■ F
■ p
verall performance core+
≥ 9 y d
7-8 gd
5-6 F
3-4 p
+ in d v "vy d"v, uns d v n f "d" b ss nds.
BreaStFeeDiNgpolic SUMMar
paiD MaterNitleae¹
right to DailNUrSiNg BreaKS
% hoSpitalSthat are
BaB‐FrieNDl
State oFpolic
SUpportFor thecoDe4
BreaStFeeDiNgpracticeS
S rn ln(wks)
%Ws d
/N ln f v(mns) 3
evbsfd
%
exusv 3 mns
%
any 6 mns
%
Nwy 9.8 y d 36 462 100, 80% * n m 79% gd 99 70 80
Svn 9.6 y d 15 100% n m 79% gd 97 —‐ —‐
Swdn 9.6 y d 602 80% † * n m 100% gd 98 60 (4 m) 72
luxmbu 9.4 y d 16 100% n m >50%ß gd 90 26 (4 m) 41
aus 9.0 gd 16 100% n m >15%ß gd 93 60 55
lun 9.0 gd 18 100% n m >15%ß gd 98 41 31
lv 8.8 gd 16 100% 18 47% gd 92 63 46
cz rub 8.6 gd 28 60% ≥12 55% gd 96 —‐ 53
Nnds 8.6 gd 16 100%† 9 63% gd 81 30 37
gmny 8.4 gd 14 100%† n m 4% gd 96 33 (4 m) 48
esn 8.2 gd 20 100% 18 0%ß gd 82 —‐ 40
pnd 8.2 gd 20 100% n m 15% gd 71 31 —‐
pu 8.2 gd 17 212 100, 80% n m 2% gd 90 52 29
Fn 8.0 gd 16 100%† * 12 1% gd 65 —‐ —‐
Bum 7.8 gd 15 82,75%† 7 6% gd 72 25 25
ind 7.8 gd 26 (16) 80%† 6.5 35% gd 46 —‐ ‐—
iy 7.8 gd 20 80% 12 2% gd 91 47 47
Swznd 7.8 gd 14 80%† * 12 >50%ß F 92 —‐ 41
Nw Znd 7.6 gd 142 100%† * – >75%ß F 88 56 —‐
cyus 7.5 gd 18 75% 6 — gd 79 52 —‐
Dnmk 7.4 gd 18 100%† n bks‡ 39% gd 98 48 —‐
g 7.4 gd 17 100% 12 0% gd 86 —‐ —‐
Svk rub 7.4 gd 28 55% 12 29% gd 92 57 (4 m) —‐
Sn 7.4 gd 16 100% 9 3% gd 76 44 40
Und Kndm 7.2 gd 39 (13) 90% n bks‡ 17% gd 81 13 25
Fnnd 6.8 F 18 70+% n bks‡ 12% gd 93 51 60
is 6.8 F 12 100% 7.5 0%ß gd —‐ —‐ —‐
Jn 6.8 F 14 67% * 12 6% ß F 97 38 —‐
huny 6.6 F 24 70% 9 7%ß gd 96 62 (4 m) —‐
lnsn 6.2 F 20 80% n m 0%ß
p —‐ —‐ —‐cnd 5.4 F 17 55%† n bks‡ 4% ß F 90 52 54
ind 5.4 F 132 80% n bks‡ 0% p 98 48 (4 m) 65
Mn 5.4 F 16 90% 12 0%ß p —‐ —‐ —‐
aus 4.8 p 182 n bks‡ >15% ß F 96 39 60
M 4.4 p 14 100% n bks‡ 0% ß p 62 ‐—‐ —‐
Und Ss 4.2 p (12) und * 12 2%ß p 75 35 44
7/31/2019 Estado Mundial de las Madres
http://slidepdf.com/reader/full/estado-mundial-de-las-madres 46/70
44 chapter title goeS here
N

7/31/2019 Estado Mundial de las Madres
http://slidepdf.com/reader/full/estado-mundial-de-las-madres 47/70
Sae the chilDre N · State oF the WorlD’S MotherS 2012 45
taKe actioN NoW to eNSUre eer chilD getS theNUtritioN the NeeD For the right Start iN liFe
Children who get the right nutrition in their rst 1,000
days – from pregnancy to age 2 – have a foundation thatlasts their entire lives. Teir bodies and brains develop,they do better in school, and they even have higher lifelongearnings.
For children who don’t get this adequate investment,the opposite is true; the impacts are often irreversible. Even worse, malnutrition is an underlying cause of more than athird of child deaths before the age of 5.
Every child deserves a fair start in life. Getting childrenthe right nutrition – especially in this 1,000 day window – pays for itself and is one of the most cost-eective devel-opment interventions.
A C :
• Malnutrition impacts both wealthy and developingcountries in serious ways. All governments must makeghting malnutrition and stunting a priority, settingtargets for progress in their own countries and aroundthe world. ogether, countries should set and monitor aglobal target for reducing stunting as a key way to accel-erate investment and accountability for malnutrition.
• Countries should endorse and support the ScalingUp Nutrition (SUN) movement, which provides aframework for donor and developing countries, multi-lateral agencies and NGOs to work together to advancenutrition.
• Leaders attending the Call to Action forum, A Promise to Keep: Ending Preventable Child Deaths in Washingtonin June should commit to ending preventable childdeaths and focusing on nutrition as an underlying causeof a third of child deaths.
• Governments, donors and international agencies shouldprioritize investing in frontline health workers and girls’
education. Both of these are essential to breaking thecycle of malnutrition.
D C:
• Developing country governments must commit andfund national nutrition plans of action that are inte-grated with plans for maternal and child health. Again,the SUN movement provides a framework for develop-ing country leadership.
• African governments must invest in health by meet-ing the Abuja target set in 2001 to devote at least 15
percent of government spending to the health sector.Tis must include resources for the implementation
of a national action plan for nutrition which is sup-
ported by accountable leadership and good stewardshipof resources.
D C:
• With global economic turmoil, many internationalassistance budgets are under pressure. However, mostcountries spend less than 1 percent of their GDP oninternational assistance. Citizens in developed countriesneed to tell their governments to continue to invest inglobal health and development – including nutrition.
• Donor countries and international agencies must keep
their funding commitments to achieving MDGs , and . Tey should endorse the SUN movement andsupport country plans to reduce malnutrition.
• Nations participating in the G-8 Summit in May 2012at Camp David in the United States must set a globaltarget for preventing stunting and, at a minimum, con-tinue support for food security at levels agreed to underthe L’Aquila Food Security Initiative.
• Nations attending the G20 in Mexico in June mustendorse the SUN movement, direct their AgricultureMinisters to identify policies and practices that maxi-mize the impact on nutrition; and support low-incomecountries to establish, develop and nance social protec-tion systems that can be scaled up to protect poor andvulnerable populations.
I:
• Citizens everywhere should urge their governments –national governments and donors alike – to invest innutrition for mothers and all children, especially in therst 1,000 days, and live up to the commitments madeto achieve Millennium Development Goals 1, 4 and 5.
• Join Save the Children’s newborn and child survivalcampaign. Visit www.savethechildren.net to nd thecampaign in your country, take action to let your leadersknow that preventable child deaths and malnutritionare unacceptable, and join our movement.
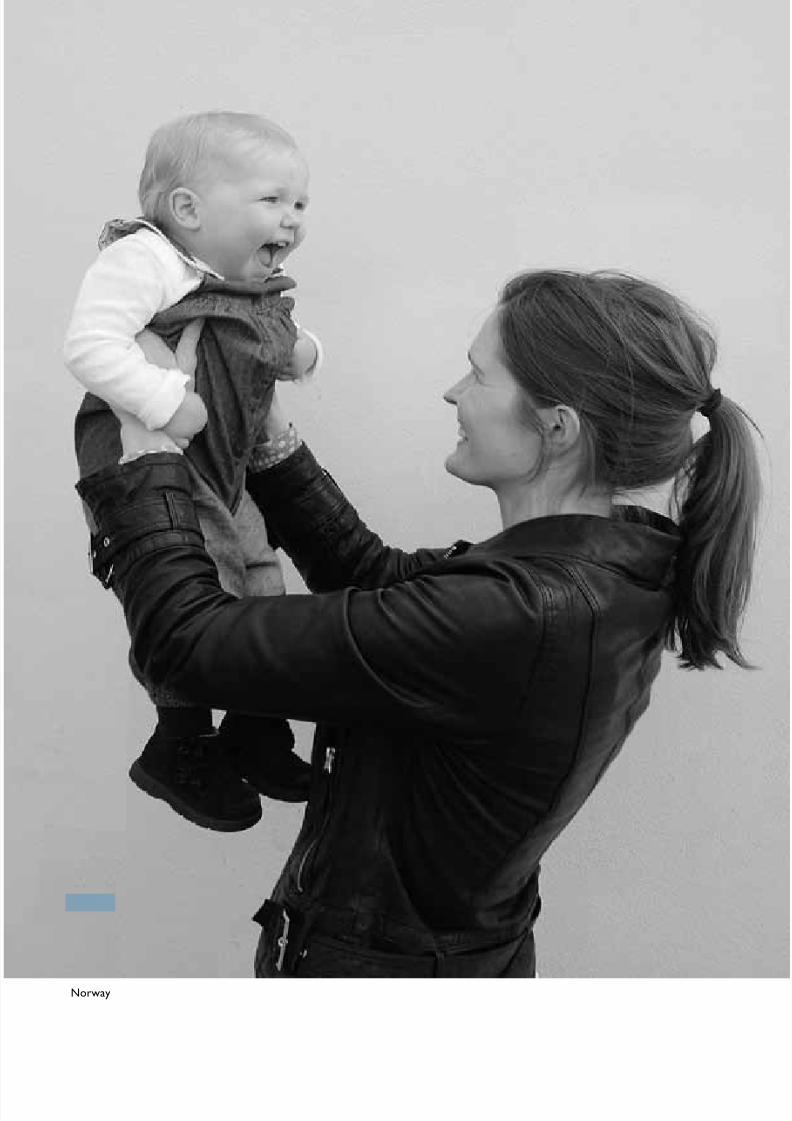
7/31/2019 Estado Mundial de las Madres
http://slidepdf.com/reader/full/estado-mundial-de-las-madres 48/70
46 chapter title goeS here
Nwy
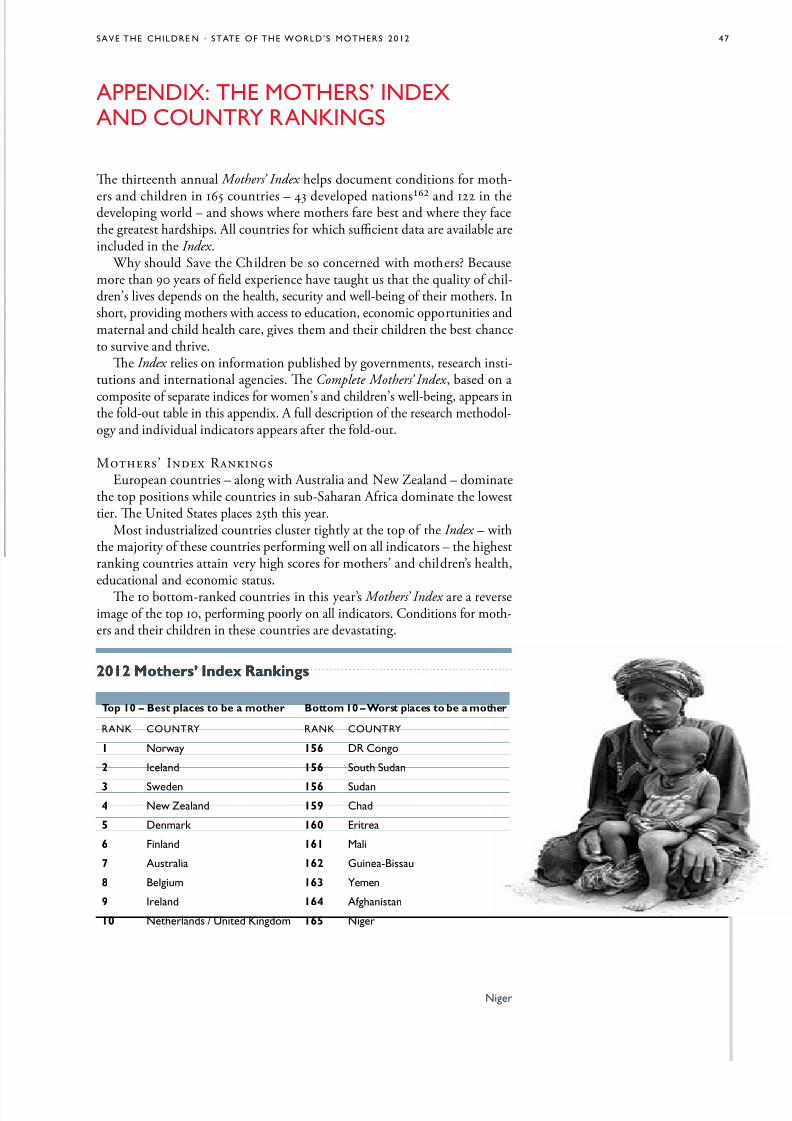
7/31/2019 Estado Mundial de las Madres
http://slidepdf.com/reader/full/estado-mundial-de-las-madres 49/70
Sae the chilDre N · State oF the WorlD’S MotherS 2012 47
appeNDi: the MotherS’ iNDeaND coUNtr raNKiNgS
N
Te thirteenth annual Mothers’ Index helps document conditions for moth-
ers and children in 165 countries – 43 developed nations and 122 in thedeveloping world – and shows where mothers fare best and where they facethe greatest hardships. All countries for which sucient data are available areincluded in the Index .
Why should Save the Children be so concerned with mothers? Becausemore than 90 years of eld experience have taught us that the quality of chil-dren’s lives depends on the health, security and well-being of their mothers. Inshort, providing mothers with access to education, economic opportunities andmaternal and child health care, gives them and their children the best chanceto survive and thrive.
Te Index relies on information published by governments, research insti-tutions and international agencies. Te Complete Mothers’ Index , based on a
composite of separate indices for women’s and children’s well-being, appears inthe fold-out table in this appendix. A full description of the research methodol-ogy and individual indicators appears after the fold-out.
M’ I REuropean countries – along with Australia and New Zealand – dominate
the top positions while countries in sub-Saharan Africa dominate the lowesttier. Te United States places 25th this year.
Most industrialized countries cluster tightly at the top of the Index – withthe majority of these countries performing well on all indicators – the highestranking countries attain very high scores for mothers’ and children’s health,educational and economic status.
Te 10 bottom-ranked countries in this year’s Mothers’ Index are a reverseimage of the top 10, performing poorly on all indicators. Conditions for moth-ers and their children in these countries are devastating.
2012 oter’ nex Rankin2012 oter’ nex Rankin
op 10 – Bet place to be a moter Bottom 10 – ort place to be a moter
raNK coUNtr raNK coUNtr
1 Nwy 156 Dr cn
2 ind 156 Su Sudn
3 Swdn 156 Sudn4 Nw Znd 159 cd
5 Dnmk 160 e
6 Fnnd 161 M
7 aus 162 gun-Bssu
8 Bum 163 mn
9 ind 164 afnsn
10 Nnds / Und Kndm 165 N

7/31/2019 Estado Mundial de las Madres
http://slidepdf.com/reader/full/estado-mundial-de-las-madres 50/70
48 appeNDi : the MotherS ’ iNDe aND coUNtr raNKiNgS
• Over half of all births are not attended by skilled health personnel.
• On average, 1 in 30 women will die from pregnancy-related causes.
• 1 child in 7 dies before his or her fth birthday.
• Nearly a third of all children suer from malnutrition.
• 1 child in 6 is not enrolled in primary school.
• Fewer than 4 girls are enrolled in primary school for every 5 boys.
• On average, females receive about 6 years of formal education.
• Women earn less than 40 percent of what men do.
• 8 out of 10 women are likely to suer the loss of a child in their lifetime.
Te contrast between the top-ranked country, Norway, and the lowest-ranked country, Niger, is striking. Skilled health personnel are present atvirtually every birth in Norway, while only 1 in 3 births are attended in Niger.In Norway, nearly 40 percent of parliamentary seats are held by women; inNiger only 13 percent are. A typical Norwegian girl can expect to receive 18 yearsof formal education and will live to be over 83 years old. Eighty-two percent of women are using some modern method of contraception, and only 1 mother in175 is likely to lose a child before his or her fth birthday. At the opposite endof the spectrum, in Niger, a typical girl receives only 4 years of education andlives to only 56. Only 5 percent of women are using modern contraception, and1 child in 7 dies before his or her fth birthday. Tis means that every motherin Niger is likely to suer the loss of a child.
at te umber don’t at te umber don’t
ell youell you
Te national-level data presented in theTe national-level data presented in the Mothers’ Index Mothers’ Index provide an overview o many provide an overview o many countries. However, it is important tocountries. However, it is important toremember that the condition o geographicremember that the condition o geographicor ethnic sub-groups in a country may vary or ethnic sub-groups in a country may vary greatly rom the national average. Remotegreatly rom the national average. Remoterural areas tend to have ewer services andrural areas tend to have ewer services andmore dire statistics. War, violence and law more dire statistics. War, violence and law --lessness also do great harm to the well-beinglessness also do great harm to the well-beingo mothers and children, and oten aecto mothers and children, and oten aectcertain segments o the population disprocertain segments o the population dispro--
portionately. Tese details are hidden whenportionately. Tese details are hidden whenonly broad national-level data are available.only broad national-level data are available.
cd

7/31/2019 Estado Mundial de las Madres
http://slidepdf.com/reader/full/estado-mundial-de-las-madres 51/70
Sae the chilDre N · State oF the WorlD’S MotherS 2012 49
Te data collected for the Mothers’ Index document the tremendous gapsbetween rich and poor countries and the urgent need to accelerate progress inthe health and well-being of mothers and their children. Te data also highlightthe regional dimension of this tragedy. Eight of the bottom 10 countries are insub-Saharan Africa. Sub-Saharan Africa also accounts for 18 of the 20 lowest-ranking countries.
Individual country comparisons are especially startling when one considersthe human suering behind the statistics:
• Less than 25 percent of births are attended by skilled health personnel in Afghanistan, Chad, Lao PDR and Nepal. In Ethiopia only 6 percent of
births are attended. Compare that to 99 percent in Sri Lanka and 95 percentin Botswana.
• According to the most recent estimates, 1 woman in 11 dies in pregnancy orchildbirth in Afghanistan. Te risk is 1 in 14 in Chad and Somalia. In Italy and Ireland the risk of maternal death is less than 1 in 15,000 and in Greeceit’s 1 in 31,800.
• A girl born today isn’t likely to live much past the age of 50 in Botswana,Central African Republic, Democratic Republic of the Congo, Guinea-Bissau and Zambia. In Afghanistan, Lesotho, Sierra Leone and Swaziland,the average girl won’t live to see her 50th birthday, while in Japan female lifeexpectancy is over 87 years old.
• In Somalia, only 1 percent of women use modern contraception. Rates are5 percent or less in Angola, Chad, Eritrea, Guinea and Niger. And less than10 percent of women use modern contraception in 13 other developingcountries. By contrast, at least 80 percent of women in Norway, Portugaland Tailand and 84 percent of women in China and the United Kingdomuse some form of modern contraception.
• In Afghanistan, Jordan, Lebanon, Libya, Morocco, Oman, Pakistan, Syriaand Yemen, women earn 25 cents or less for every dollar men earn. Saudiand Palestinian women earn only 16 and 12 cents respectively to the maledollar. In Mongolia, women earn 87 cents for every dollar men earn and inMozambique they earn 90 cents.
Prore in fanitanProre in fanitan
Ater two years as the worst place in the Ater two years as the worst place in the world to be a mother, Aghanistan has world to be a mother, Aghanistan hasmoved up one notch on themoved up one notch on the Mothers’ Index Mothers’ Index this year. Aghanistan has made notethis year. Aghanistan has made note-- worthy improvements in maternal and worthy improvements in maternal andchild health and well-being. Skilled birthchild health and well-being. Skilled birthattendance has risen rom 14 to 4 percent.attendance has risen rom 14 to 4 percent.Female lie expectancy is up by almost 5Female lie expectancy is up by almost 5 years. Te average number o years girls years. Te average number o years girlsare in school has increased by a year andare in school has increased by a year anda hal. Child mortality has dropped roma hal. Child mortality has dropped romaround 00 deaths per 1,000 live births toaround 00 deaths per 1,000 live births to149. And enrollment in primary school has149. And enrollment in primary school hasbeen climbing steadily. In 000, only 0been climbing steadily. In 000, only 0percent o primary-school-age children werepercent o primary-school-age children wereenrolled in school, and twice as many boysenrolled in school, and twice as many boysas girls were in school. oday, enrollment inas girls were in school. oday, enrollment inprimary school is at 97 percent.primary school is at 97 percent.
What explains Aghanistan’s progress? What explains Aghanistan’s progress?One answer is that it has invested in trainOne answer is that it has invested in train--ing and deploying more rontline healthing and deploying more rontline health workers. With support rom international workers. With support rom internationalpartners, Aghanistan increased its cadre o partners, Aghanistan increased its cadre o community health workers rom ,500 incommunity health workers rom ,500 in004 to about ,000 today. And there are004 to about ,000 today. And there arenow 3,000 trained midwives, up rom aboutnow 3,000 trained midwives, up rom about
500 in 003.500 in 003.Despite this progress, Aghanistan stillDespite this progress, Aghanistan still
has a long way to go. Hal o the populationhas a long way to go. Hal o the populationdoes not have access to sae drinking water.does not have access to sae drinking water.Only 7 girls or every 10 boys are enrolled inOnly 7 girls or every 10 boys are enrolled inprimary school – the second largest genderprimary school – the second largest genderdisparity in education in the world. Onedisparity in education in the world. Onechild in 3 is underweight. One child in 7child in 3 is underweight. One child in 7dies beore reaching age 5. Only 1 in 4 birthsdies beore reaching age 5. Only 1 in 4 birthsis attended by skilled personnel. Just 1is attended by skilled personnel. Just 1 woman in 6 is using modern contraception. woman in 6 is using modern contraception. And, according to the latest international And, according to the latest internationalestimates, 1 woman in 11 will die o a pregestimates, 1 woman in 11 will die o a preg--
nancy-related cause – the highest lietimenancy-related cause – the highest lietimerisk o maternal mortality in the world.risk o maternal mortality in the world.Results rom a recent national survey Results rom a recent national survey
suggest that Aghanistan’s maternal mortalsuggest that Aghanistan’s maternal mortal--ity rate is on the decline, but Aghanistanity rate is on the decline, but Aghanistanstill has the highest lietime risk o maternalstill has the highest lietime risk o maternalmortality in the world. It also places secondmortality in the world. It also places secondto last on emale lie expectancy and genderto last on emale lie expectancy and genderdisparity in primary education.disparity in primary education.
afnsn

7/31/2019 Estado Mundial de las Madres
http://slidepdf.com/reader/full/estado-mundial-de-las-madres 52/70
50 appeNDi : the MotherS ’ iNDe aND coUNtr raNKiNgS
• In Qatar, Saudi Arabia and the Solomon Islands, not one parliamentary
seat is occupied by a woman. In Comoros and Papua New Guinea, womenhave only 1 seat. Compare that to Rwanda, where women hold over half of all seats in parliament.
• A typical female in Central African Republic, Côte d’Ivoire, Djibouti,Guinea-Bissau, Papua New Guinea and anzania receives only 5 years of formal education. In Eritrea and Niger, it’s 4 years and in Somalia, girlsreceive less than 2 years of education. In Australia, Iceland and New Zealand,however, the average woman stays in school for 20 years.
• In Somalia, 2 out of 3 children are not enrolled in primary school. Morethan half (55 percent) of all children in Eritrea are not in school. In Djiboutiand Papua New Guinea, out-of-school rates are 40 percent. In comparison,
nearly all children in France, Norway, Spain and Sweden make it frompreschool all the way to high school.
• In Central African Republic and Chad, fewer than 3 girls for every 4 boysare enrolled in primary school. In Afghanistan, it’s close to 2 girls for every 3 boys. And in Somalia, boys outnumber girls by almost 2 to 1.
• More than 1 child in 6 does not reach his or her fth birthday in BurkinaFaso, Chad, Democratic Republic of the Congo, Mali,Sierra Leone and Somalia. In Iceland only 1 child in 500dies before age 5.
• Over 40 percent of children under age 5 suer from mal-
nutrition in Bangladesh, India, Madagascar, Niger and Yemen. In imor-Leste, 45 percent of children are mod-erately or severely underweight.
• More than half of the population in Democratic Republicof the Congo, Equatorial Guinea, Ethiopia, Madagascar,Mozambique, Niger and Papua New Guinea lack accessto safe drinking water. In Somalia, 70 percent of peoplelack access to safe water.
Statistics are far more than numbers. It is the humandespair and lost opportunities behind these numbers that
call for changes to ensure that mothers everywhere havethe basic tools they need to break the cycle of poverty andimprove the quality of life for themselves, their children,and for generations to come.
ind
7/31/2019 Estado Mundial de las Madres
http://slidepdf.com/reader/full/estado-mundial-de-las-madres 53/70
Sae the chilDre N · State oF the WorlD’S MotherS 2012 51
Why doesn’t the United States do better in
the rankings?
Tis year the United States moved up six spots, romTis year the United States moved up six spots, rom31st to 5th place. Improvements across education indi31st to 5th place. Improvements across education indi--cators are largely responsible or the movement. Despitecators are largely responsible or the movement. Despitethese gains, however, the U.S. still perorms below averthese gains, however, the U.S. still perorms below aver--age overall and quite poorly on a number o measures:age overall and quite poorly on a number o measures:
•• One o the key indicators o maternal well-being isOne o the key indicators o maternal well-being islietime risk o maternal mortality. In the Unitedlietime risk o maternal mortality. In the UnitedStates, mothers ace a 1 in ,100 risk o maternal deathStates, mothers ace a 1 in ,100 risk o maternal death
– the highest o any industrialized nation. In act, only – the highest o any industrialized nation. In act, only three developed countries – Albania, Moldova and thethree developed countries – Albania, Moldova and theRussian Federation – perorm worse than the UnitedRussian Federation – perorm worse than the UnitedStates on this indicator. A woman in the U.S. is moreStates on this indicator. A woman in the U.S. is morethan 7 times as likely as a woman in Ireland or Italy than 7 times as likely as a woman in Ireland or Italy to die rom a pregnancy-related cause and her risk o to die rom a pregnancy-related cause and her risk o maternal death is 15 times that o a woman in Greece.maternal death is 15 times that o a woman in Greece.
•• Similarly, the United States does not do as well asSimilarly, the United States does not do as well asmost other developed countries with regard to under-5most other developed countries with regard to under-5mortality. Te U.S. under-5 mortality rate is 8 permortality. Te U.S. under-5 mortality rate is 8 per1,000 births. Tis is on par with rates in Bosnia and1,000 births. Tis is on par with rates in Bosnia andHerzegovina, Montenegro, Slovakia and Qatar. Forty Herzegovina, Montenegro, Slovakia and Qatar. Forty countries perormed better than the U.S. on thiscountries perormed better than the U.S. on thisindicator. Tis means that a child in the U.S. is ourindicator. Tis means that a child in the U.S. is ourtimes as likely as a child in Iceland to die beore his ortimes as likely as a child in Iceland to die beore his orher 5th birthday.her 5th birthday.
•• Te United States has the least generous maternity Te United States has the least generous maternity leave policy o any wealthy nation. It is the only develleave policy o any wealthy nation. It is the only devel--oped country – and one o only a handul o countriesoped country – and one o only a handul o countriesin the world – that does not guarantee working mothin the world – that does not guarantee working moth--ers paid leave.ers paid leave.
•• Te United States is also lagging behind with regardTe United States is also lagging behind with regardto preschool enrollment and the political status o to preschool enrollment and the political status o women. Perormance in both areas places it among women. Perormance in both areas places it among
the bottom 10 in the developed world.the bottom 10 in the developed world.
Why is Norway number one?
Norway generally perormed as well as or betterNorway generally perormed as well as or betterthan other countries in the rankings on all indicators. Itthan other countries in the rankings on all indicators. Itranks among the very best (i.e. top 5) on contraceptiveranks among the very best (i.e. top 5) on contraceptiveuse, emale education and political representation anduse, emale education and political representation andhas one o the most generous maternity leave policieshas one o the most generous maternity leave policiesin the developed world. It also has the highest ratio o in the developed world. It also has the highest ratio o emale-to-male earned income and the second lowestemale-to-male earned income and the second lowestunder-5 mortality rate (tied with fve other countries) inunder-5 mortality rate (tied with fve other countries) inthe developed world.the developed world.
Why is Niger last?
It is the cumulative eect o underperormance thatIt is the cumulative eect o underperormance thatlands Niger at the bottom o thelands Niger at the bottom o the Index Index . Unlike many . Unlike many other least-developed countries, which perorm “well”other least-developed countries, which perorm “well” with respect to their peers on at least one measure, with respect to their peers on at least one measure,Niger perorms very poorly across all indicators o Niger perorms very poorly across all indicators o maternal and child health and well-being. Levels o maternal and child health and well-being. Levels o maternal mortality and education, contraceptive use,maternal mortality and education, contraceptive use, women’s income relative to men’s, as well as primary women’s income relative to men’s, as well as primary school enrollment and rates o child malnutrition areschool enrollment and rates o child malnutrition areamong the very worst in the world.among the very worst in the world.
Why are some countries not included in the
Mothers’ Index?
Rankings were based on a country's perormanceRankings were based on a country's perormance with respect to a defned set o indicators related with respect to a defned set o indicators relatedprimarily to health, nutrition, education, economicprimarily to health, nutrition, education, economicand political status. Tere were 165 countries orand political status. Tere were 165 countries or which published inormation regarding perormance which published inormation regarding perormanceon these indicators existed. All 165 were included inon these indicators existed. All 165 were included inthe study. Te only basis or excluding countries wasthe study. Te only basis or excluding countries wasinsucient or unavailable data or national populationinsucient or unavailable data or national populationbelow 50,000.below 50,000.
Why can’t country performance be compared across
development tiers?
Indicators or the three tiers were selected to bestIndicators or the three tiers were selected to bestrepresent actors o maternal well-being specifc torepresent actors o maternal well-being specifc toeach level o development. Because the set o indicatorseach level o development. Because the set o indicatorstracked or each tier is dierent, a singletracked or each tier is dierent, a single Index Index rankingrankingcannot be generated and perormance on the rankingscannot be generated and perormance on the rankingsshould not be compared across tiers.should not be compared across tiers.
What should be done to bridge the divide between
countries that meet the needs of their mothers and
those that don’t?
•• Governments and international agencies need toGovernments and international agencies need to
increase unding to improve education levels orincrease unding to improve education levels or women and girls, provide access to maternal and women and girls, provide access to maternal andchild health care and advance women’s economicchild health care and advance women’s economicopportunities.opportunities.
•• Te international community also needs to improveTe international community also needs to improvecurrent research and conduct new studies that ocuscurrent research and conduct new studies that ocusspecifcally on mothers’ and children’s well-being.specifcally on mothers’ and children’s well-being.
•• In the United States and other industrialized nations,In the United States and other industrialized nations,governments and communities need to work togethergovernments and communities need to work togetherto improve education and health care or disadvanto improve education and health care or disadvan--taged mothers and children.taged mothers and children.
Frequentl ke Quetion about teFrequentl ke Quetion about te Mothers’ Index Mothers’ Index
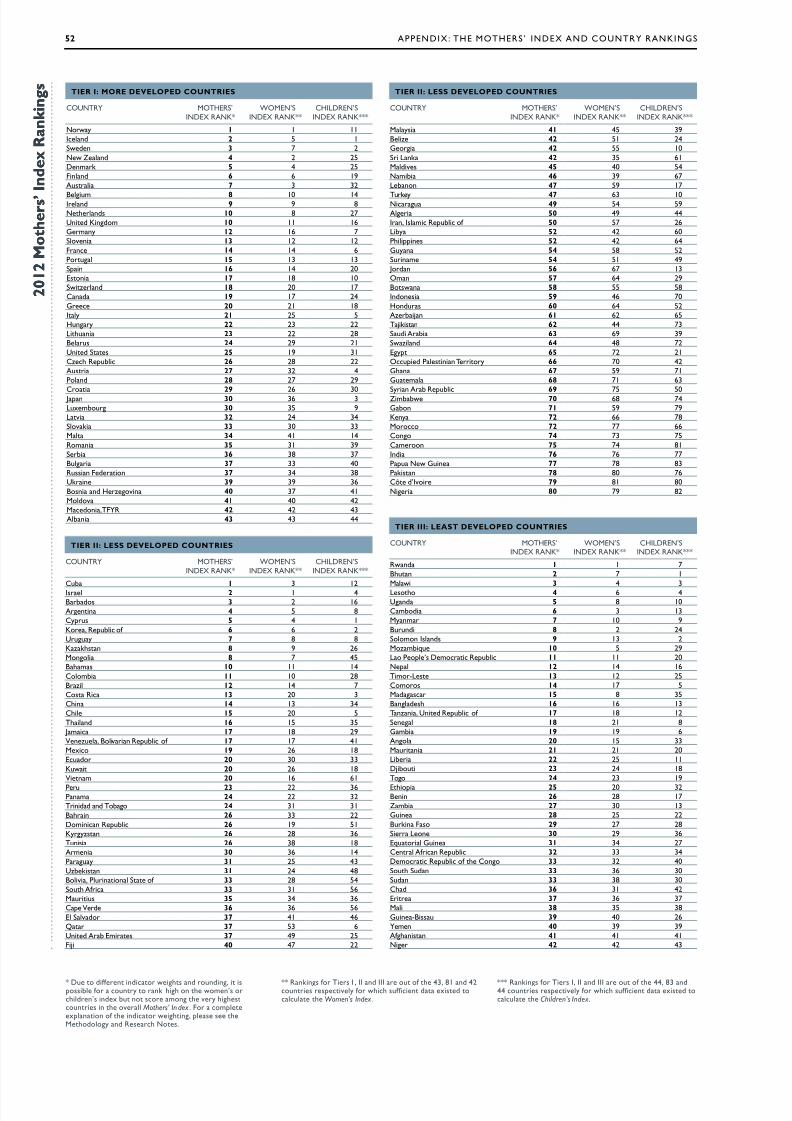
7/31/2019 Estado Mundial de las Madres
http://slidepdf.com/reader/full/estado-mundial-de-las-madres 54/70
52 appeNDi : the MotherS ’ iNDe aND coUNtr raNKiNgS
R : Lss dVLPd CURs
coUNtr MotherS’iNDe raNK*
WoMeN’SiNDe raNK**
chilDreN’SiNDe raNK***
cub 1 3 12is 2 1 4Bbds 3 2 16ann 4 5 8cyus 5 4 1K, rub f 6 6 2Uuuy 7 8 8Kzksn 8 9 26Mn 8 7 45Bms 10 11 14cmb 11 10 28Bz 12 14 7cs r 13 20 3cn 14 13 34c 15 20 5tnd 16 15 35 Jm 17 18 29nzu, Bvn rub f 17 17 41Mx 19 26 18eud 20 30 33Kuw 20 26 18nm 20 16 61
pu 23 22 36pnm 24 22 32tndd nd tb 24 31 31Bn 26 33 22Dmnn rub 26 19 51Kyyzsn 26 28 36tuns 26 38 18amn 30 36 14puy 31 25 43Uzbksn 31 24 48Bv, punn S f 33 28 54Su af 33 31 56Muus 35 34 36c d 36 36 56e Svd 37 41 46Q 37 53 6Und ab ems 37 49 25Fj 40 47 22
R : Ls dVLPd CURs
coUNtr MotherS’iNDe raNK*
WoMeN’SiNDe raNK**
chilDreN’SiNDe raNK***
rwnd 1 1 7Bun 2 7 1Mw 3 4 3ls 4 6 4Und 5 8 10cmbd 6 3 13Mynm 7 10 9Buund 8 2 24Smn isnds 9 13 2Mzmbqu 10 5 29l p’s Dm rub 11 11 20N 12 14 16tm-ls 13 12 25cms 14 17 5Mds 15 8 35Bnds 16 16 13tnzn, Und rub f 17 18 12Sn 18 21 8gmb 19 19 6an 20 15 33Mun 21 21 20lb 22 25 11Djbu 23 24 18t 24 23 19
e 25 20 32Bnn 26 28 17Zmb 27 30 13gun 28 25 22Bukn Fs 29 27 28S ln 30 29 36equ gun 31 34 27cn afn rub 32 33 34Dm rub f cn 33 32 40Su Sudn 33 36 30Sudn 33 38 30cd 36 31 42e 37 36 37M 38 35 38gun-Bssu 39 40 26mn 40 39 39afnsn 41 41 41N 42 42 43
R : R dVLPd CURs
coUNtr MotherS’iNDe raNK*
WoMeN’SiNDe raNK**
chilDreN’SiNDe raNK***
Nwy 1 1 11ind 2 5 1Swdn 3 7 2Nw Znd 4 2 25Dnmk 5 4 25Fnnd 6 6 19aus 7 3 32
Bum 8 10 14ind 9 9 8Nnds 10 8 27Und Kndm 10 11 16gmny 12 16 7Svn 13 12 12Fn 14 14 6pu 15 13 13Sn 16 14 20esn 17 18 10Swznd 18 20 17cnd 19 17 24g 20 21 18iy 21 25 5huny 22 23 22lun 23 22 28Bus 24 29 21Und Ss 25 19 31cz rub 26 28 22aus 27 32 4pnd 28 27 29
c 29 26 30 Jn 30 36 3luxmbu 30 35 9lv 32 24 34Svk 33 30 33M 34 41 14rmn 35 31 39Sb 36 38 37Bu 37 33 40russn Fdn 37 34 38Ukn 39 39 36Bsn nd hzvn 40 37 41Mdv 41 40 42Mdn, tFr 42 42 43abn 43 43 44
R : Lss dVLPd CURs
coUNtr MotherS’iNDe raNK*
WoMeN’SiNDe raNK**
chilDreN’SiNDe raNK***
Mys 41 45 39Bz 42 51 24g 42 55 10S lnk 42 35 61Mdvs 45 40 54Nmb 46 39 67lbnn 47 59 17
tuky 47 63 10Nu 49 54 59a 50 49 44in, ism rub f 50 57 26lby 52 42 60pns 52 42 64guyn 54 58 52Sunm 54 51 49 Jdn 56 67 13omn 57 64 29Bswn 58 55 58indns 59 46 70hndus 60 64 52azbjn 61 62 65tjksn 62 44 73Sud ab 63 69 39Swznd 64 48 72ey 65 72 21oud psnn ty 66 70 42gn 67 59 71gum 68 71 63
Syn ab rub 69 75 50Zmbbw 70 68 74gbn 71 59 79Kny 72 66 78M 72 77 66cn 74 73 75cmn 75 74 81ind 76 76 77pu Nw gun 77 78 83pksn 78 80 76cô d’iv 79 81 80N 80 79 82
* Du dffn nd ws nd undn, sssb f uny nk n wmn’s dn’s ndx bu n s mn vy suns n v Mothers’ In dex . F mxnn f nd wn, s s Mdy nd rs Ns.
** rnkns f ts i , ii nd iii u f 43, 81 nd 42uns svy f w sufn d xsd u Women’s Index .
*** rnkns f ts i, ii nd iii u f 44, 83 nd44 uns svy f w sufn d xsd u Children’s Index .
2 0 1 2 o t h e r ’
n d e x R a n k i n g
2 0 1 2 o t h e r ’
n d e x R a n k i n g
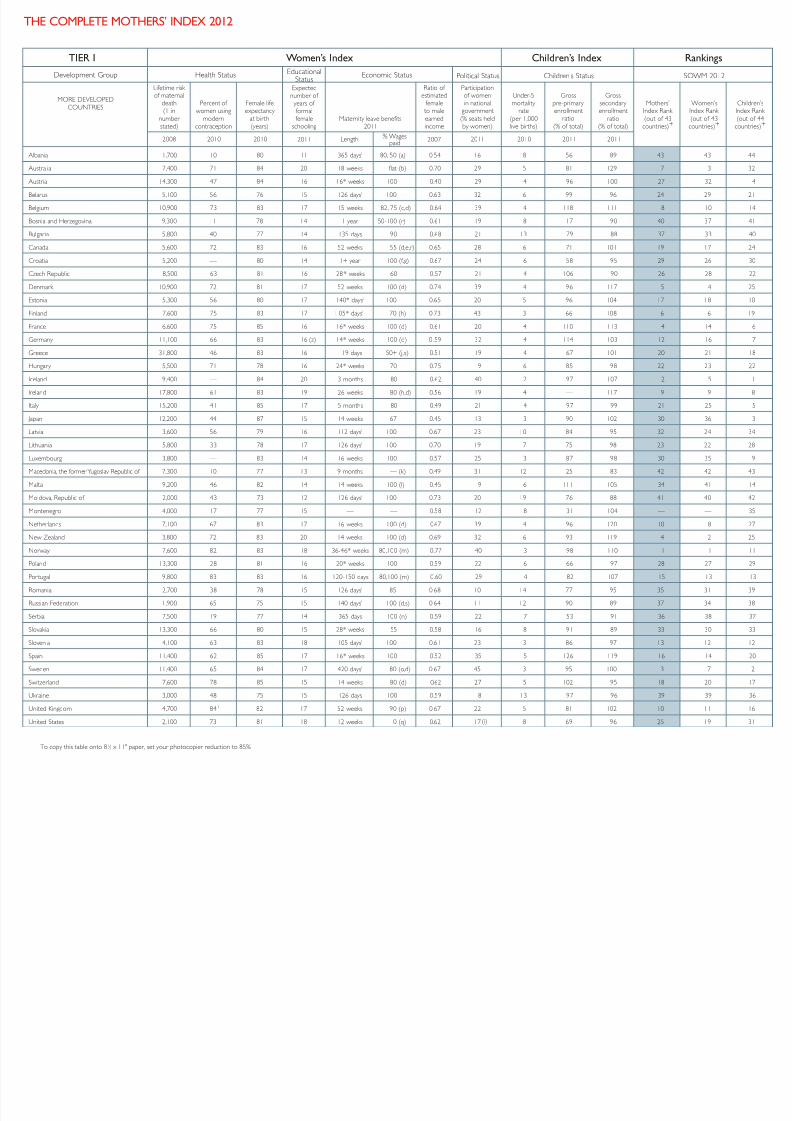
7/31/2019 Estado Mundial de las Madres
http://slidepdf.com/reader/full/estado-mundial-de-las-madres 55/70
To copy this table onto 81 ⁄ 2 x 11" paper, set your photocopier reduction to 85%
HE COMPLETE MOTHERS’ INDEX 2012
Lifetime risk of maternal
death(1 in
number stated)
Percent of women using
moderncontraception
Female lifeexpectancy
at birth(years)
Expectednumber of years of formalfemale
schoolingMaternity leave benefits
2011
Ratio of estimated
female to male
earnedincome
Participationof womenin national
government
(% seats heldby women)
Under-5mortality
rate
(per 1,000live births)
Grosspre-primary enrollment
ratio
(% of total)
Grosssecondary enrollment
ratio(% of total)
Mothers’Index Rank
(out of 43countries)+
Women’sIndex Rank
(out of 43countries)+
Children’sIndex Rank
(out of 44countries)+
bania 1,700 10 80 11 365 days1 80, 50 (a) 0.54 16 18 56 89 43 43 44
ustralia 7,400 71 84 20 18 weeks flat (b) 0.70 29 5 81 129 7 3 32
ustria 14,300 47 84 16 16* weeks 100 0.40 29 4 96 100 27 32 4
larus 5,100 56 76 15 126 days1
100 0.63 32 6 99 96 24 29 21
lgium 10,900 73 83 17 15 weeks 82, 75 (c,d) 0.64 39 4 118 111 8 10 14
snia and Herzegovina 9,300 11 78 14 1 year 50-100 (r) 0.61 19 8 17 90 40 37 41
lgaria 5,800 40 77 14 135 days 90 0.68 21 13 79 88 37 33 40
anada 5,600 72 83 16 52 weeks 55 (d,e,r) 0.65 28 6 71 101 19 17 24
oatia 5,200 –– 80 14 1+ year 100 (f,g) 0.67 24 6 58 95 29 26 30
ech Republic 8,500 63 81 16 28* weeks 60 0.57 21 4 106 90 26 28 22
enmark 10,900 72 81 17 52 weeks 100 (d) 0.74 39 4 96 117 5 4 25
tonia 5,300 56 80 17 140* days1 100 0.65 20 5 96 104 17 18 10
land 7,600 75 83 17 1 05* days11 70 (h) 0.73 43 3 66 108 6 6 19
ance 6,600 75 85 16 16* weeks 100 (d) 0.61 20 4 110 113 14 14 6
ermany 11,100 66 83 16 (z) 14* weeks 100 (d) 0 .59 32 4 114 103 12 16 7
reece 31,800 46 83 16 119 days 50+ (j,s) 0.51 19 4 67 101 20 21 18
ungary 5,500 71 78 16 24* weeks 70 0.75 9 6 85 98 22 23 22
land 9,400 –– 84 20 3 months 80 0.62 40 2 97 107 2 5 1
land 17,800 61 83 19 26 weeks 80 (h,d) 0.56 19 4 — 117 9 9 8
y 15,200 41 85 17 5 months 80 0.49 21 4 97 99 21 25 5
pan 12,200 44 87 15 14 weeks 67 0.45 13 3 90 102 30 36 3
tvia 3,600 56 79 16 112 days1 100 0.67 23 10 84 95 32 24 34
huania 5,800 33 78 17 126 days1 100 0.70 19 7 75 98 23 22 28
xembourg 3,800 –– 83 14 16 weeks 100 0.57 25 3 87 98 30 35 9
acedonia, the former Yugoslav Republic of 7,300 10 77 13 9 months — (k) 0.49 31 12 25 83 42 42 43
alta 9,200 46 82 14 14 weeks 100 (l) 0.45 9 6 111 105 34 41 14
oldova, Republic of 2,000 43 73 12 126 days1 100 0.73 20 19 76 88 41 40 42
ontenegro 4,000 17 77 15 –– –– 0.58 12 8 31 104 — — 35
etherlands 7,100 67 83 17 16 weeks 100 (d) 0.67 39 4 96 120 10 8 27
ew Zealand 3,800 72 83 20 14 weeks 100 (d) 0.69 32 6 93 119 4 2 25
orway 7,600 82 83 18 36-46* weeks 80,100 (m) 0.77 40 3 98 110 1 1 11
land 13,300 28 81 16 20* weeks 100 0.59 22 6 66 97 28 27 29
rtugal 9,800 83 83 16 120-150 days 80,100 (m) 0.60 29 4 82 107 15 13 13
omania 2,700 38 78 15 126 days1 85 0.68 10 14 77 95 35 31 39
ssian Federation 1,900 65 75 15 140 days1 100 (d,s) 0.64 11 12 90 89 37 34 38
rbia 7,500 19 77 14 365 days 100 (n) 0.59 22 7 53 91 36 38 37
ovakia 13,300 66 80 15 28* weeks 55 0.58 16 8 91 89 33 30 33
ovenia 4,100 63 83 18 105 days1 100 0.61 23 3 86 97 13 12 12
ain 11,400 62 85 17 16* weeks 100 0.52 35 5 126 119 16 14 20
weden 11,400 65 84 17 420 days1 80 (o,d) 0.67 45 3 95 100 3 7 2
witzerland 7,600 78 85 15 14 weeks 80 (d) 0.62 27 5 102 95 18 20 17
kraine 3,000 48 75 15 126 days 100 0.59 8 13 97 96 39 39 36
nited Kingdom 4,700 84 1 82 17 52 weeks 90 (p) 0.67 22 5 81 102 10 11 16
nited States 2,100 73 81 18 12 weeks 0 (q) 0.62 17 8 69 96 25 19 31
TIER I Women’s Index Children’s Index Rankings
2008 2010 2010 2007 2011 2010 2011 20112011 Length % Wagespaid
Development Group Health Status EducationalStatus Political Status Children’s Status SOWM 2012Economic Status
MORE DEVELOPED
COUNTRIES
(i)

7/31/2019 Estado Mundial de las Madres
http://slidepdf.com/reader/full/estado-mundial-de-las-madres 56/70
Lifetime risk of maternal
death(1 in
number stated)
Percent of births
attended by skilled health
personnel
Percent of women using
moderncontraception
Female lifeexpectancy
at birth(years)
Expectednumber of years of formalfemale
schooling
Ratio of estimatedfemale to
male earnedincome
Participationof womenin national
government(% seats heldby women)
Under-5mortality
rate(per 1,000live births)
Percent of children under 5 moderately or severely
underweightfor age
Grossprimary
enrollmentratio
(% of total)
Grosssecondary enrollment
ratio(% of total)
Percent of populationwith access
to safedrinking water
Mothers’Index Rank (out of 80
countries)+
Women’sIndex Rank (out of 81countries)+
Children’sIndex Rank (out of 83
countries)+
TIER II Women’s Index Children’s Index Rankings
2008 2010 20112010 2007 2011 2010 2010 2011 2011 20102010
Development Group Health Status EducationalStatus
PoliticalStatus Children’s Status SOWM 2012
EconomicStatus
LESS DEVELOPEDCOUNTRIES and
TERRITORIES
(minus leastdeveloped countries)
eria 340 95 52 75 14 0.36 7 36 3 110 95 83 50 49 44
entina 600 98 64 80 17 0.51 38 14 2 118 89 97 (z) 4 5 8
menia 1,900 100 19 77 13 0.57 8 20 5 103 92 98 30 36 14
rbaijan 1,200 88 13 74 12 0.44 16 46 8 94 85 80 61 62 65
amas 1,000 99 60 79 13 0.72 18 16 –– 114 96 97 (z) 10 11 14
rain 2,200 97 31 2 76 13 0.51 19 10 9 (z) 107 103 94 (z) 26 33 22
bados 1,100 100 53 80 18 0.65 20 20 6 (z) 120 101 100 3 2 16
ze 330 95 31 78 13 0.43 11 17 4 121 75 98 42 51 24
via, Plurinational State of 150 71 34 69 13 0.61 30 54 4 105 80 88 33 28 54
swana 180 95 42 51 12 0.58 8 48 11 108 80 96 58 55 58
zil 860 97 77 77 14 0.60 10 19 2 127 101 98 12 14 7
nei Darussalam 2,000 100 –– 81 15 0.59 –– 7 –– 108 110 –– — 11 —
meroon 35 63 12 54 10 0.53 14 136 16 120 42 77 75 74 81
e Verde 350 78 57 78 13 0.49 21 36 9 (z) 110 88 88 36 36 56
e 2,000 100 58 (y) 82 15 0.42 14 9 1 (z) 106 88 96 15 20 5
na 1,500 99 84 76 12 0.68 21 18 4 111 81 91 14 13 34
ombia 460 98 68 78 14 0.71 14 19 3 115 96 92 11 10 28
ngo 39 83 13 59 10 0.51 10 93 11 115 45 71 74 73 75
ta Rica 1,100 99 72 82 12 0.46 39 10 1 110 100 97 13 20 3
e d’Ivoire 44 57 8 58 5 0.34 11 123 16 88 27 80 79 81 80
a 1,400 100 72 81 17 0.49 45 6 4 (z) 103 89 94 1 3 12
rus 6,600 100 (y) –– 82 15 0.58 11 4 –– 105 98 100 5 4 1
minican Republic 320 98 70 77 13 0.59 19 27 7 108 76 86 26 19 51
ador 270 98 59 79 12 0.51 32 20 6 114 80 94 20 30 33
pt 380 79 58 76 11 0.27 2 22 6 106 85 99 65 72 21
alvador 350 96 66 77 12 0.46 19 16 6 114 65 88 37 41 46
1,300 99 –– 72 14 0.38 –– 17 8 (z) 105 86 98 40 47 22
on 110 86 12 64 11 0.59 16 74 12 (z) 182 53 87 71 59 79
orgia 1,300 100 27 77 13 0.38 7 22 1 109 86 98 42 55 10
na 66 57 17 66 10 0.74 8 74 14 107 58 86 67 59 71
temala 210 51 34 75 10 0.42 18 32 13 116 59 92 68 71 63
ana 150 92 40 73 11 0.41 31 30 11 85 91 94 54 58 52
nduras 240 67 56 76 12 0.34 20 24 8 116 73 87 60 64 52
a 140 53 49 68 10 0.32 11 63 43 118 60 92 76 76 77
onesia 190 79 57 72 13 0.44 18 35 18 118 77 82 59 46 70
Islamic Republic of 1,500 97 59 75 13 0.32 3 26 5 (z) 108 84 96 50 57 26
300 80 33 73 9 –– 25 39 6 105 53 79 — — 67
el 5,100 99 52 3 84 16 0.64 20 5 –– 113 91 100 2 1 4
aica 450 98 66 76 13 0.58 15 24 2 89 93 93 17 18 29
an 510 99 41 75 14 0.19 11 22 2 97 91 97 56 67 13
akhstan 950 100 49 73 16 0.68 14 33 4 111 100 95 8 9 26
ya 38 44 39 59 11 0.65 10 85 16 113 60 59 72 66 78
ea, Democratic People’s Republic of 230 100 58 72 –– –– 16 33 19 –– 98 98 — — 47
ea, Republic of 4,700 100 (y) 70 84 16 0.52 15 5 –– 104 97 98 6 6 2
wait 4,500 100 39 2 76 15 0.36 8 11 10 (z) 106 101 99 20 26 18
(y)
(ii)
(iii)
(iv)
(z)
(z)
(z)
(z)
(z)
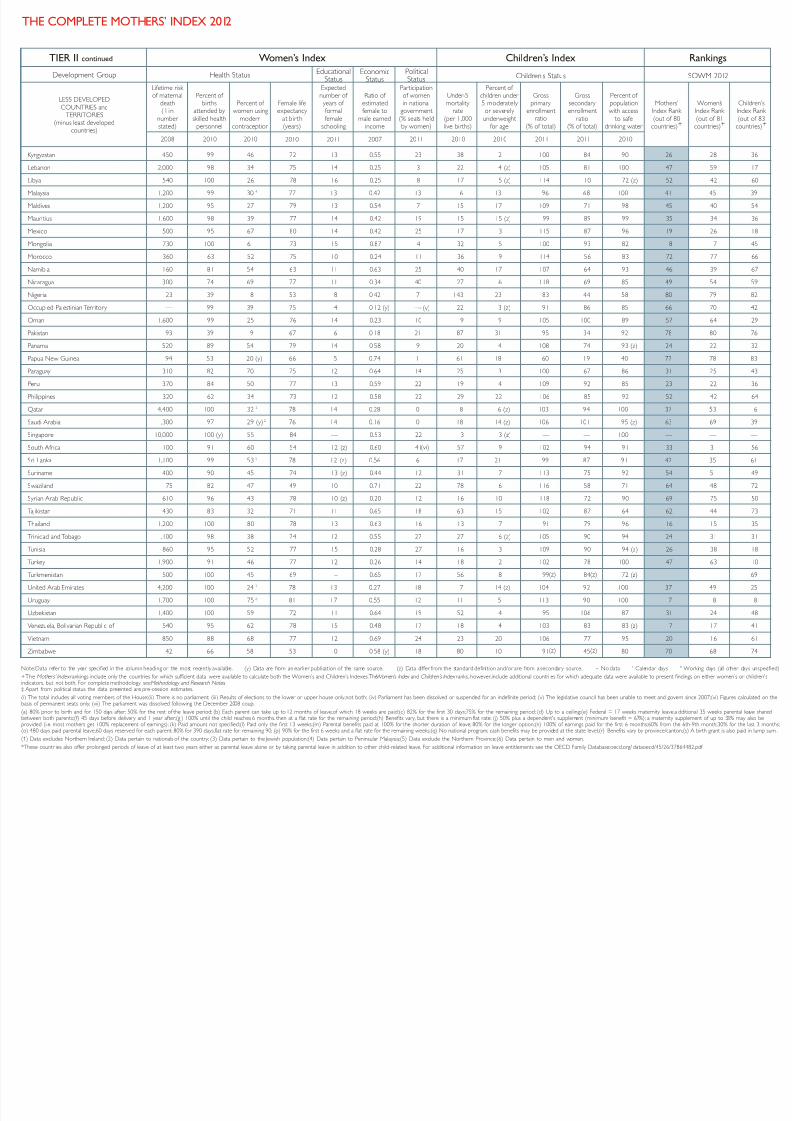
7/31/2019 Estado Mundial de las Madres
http://slidepdf.com/reader/full/estado-mundial-de-las-madres 57/70
HE COMPLETE MOTHERS’ INDEX 2012
Lifetime risk of maternal
death(1in
number stated)
Percent of births
attended by
skilled healthpersonnel
Percent of women using
moderncontraception
Female lifeexpectancy
at birth(years)
Expectednumber of years of formal
femaleschooling
Ratio of estimatedfemale to
male earnedincome
Participationof womenin national
government
(% seats heldby women)
Under-5mortality
rate
(per 1,000live births)
Percent of children under 5 moderately or severely
underweightfor age
Grossprimary
enrollmentratio
(% of total)
Grosssecondary enrollment
ratio(% of total)
Percent of populationwith access
to safedrinking water
Mothers’Index Rank
(out of 80countries)+
Women’sIndex Rank
(out of 81countries)+
Children’sIndex Rank
(out of 83countries)+
TIER II continued Women’s Index Children’s Index Rankings
2008 2010 20112010 2007 2011 2010 2010 2011 2011 20102010
Development Group Health Status EducationalStatus
PoliticalStatus Children’s Status SOWM 2012
EconomicStatus
LESS DEVELOPED
COUNTRIES andTERRITORIES
(minus least developedcountries)
rgyzstan 450 99 46 72 13 0.55 23 38 2 100 84 90 26 28 36
banon 2,000 98 34 75 14 0.25 3 22 4 (z) 105 81 100 47 59 17
ya 540 100 26 78 16 0.25 8 17 5 (z) 114 110 72 (z) 52 42 60
laysia 1,200 99 304
77 13 0.42 13 6 13 96 68 100 41 45 39
ldives 1,200 95 27 79 13 0.54 7 15 17 109 71 98 45 40 54
uritius 1,600 98 39 77 14 0.42 19 15 15 (z) 99 89 99 35 34 36
exico 500 95 67 80 14 0.42 25 17 3 115 87 96 19 26 18
ongolia 730 100 61 73 15 0.87 4 32 5 100 93 82 8 7 45
orocco 360 63 52 75 10 0.24 11 36 9 114 56 83 72 77 66
mibia 160 81 54 63 11 0.63 25 40 17 107 64 93 46 39 67
caragua 300 74 69 77 11 0.34 40 27 6 118 69 85 49 54 59
geria 23 39 8 53 8 0.42 7 143 23 83 44 58 80 79 82
ccupied Palestinian Territory — 99 39 75 14 0.12 (y) –– 22 3 (z) 91 86 85 66 70 42
man 1,600 99 25 76 14 0.23 10 9 9 105 100 89 57 64 29
kistan 93 39 19 67 6 0.18 21 87 31 95 34 92 78 80 76
nama 520 89 54 79 14 0.58 9 20 4 108 74 93 (z) 24 22 32
pua New Guinea 94 53 20 (y) 66 5 0.74 1 61 18 60 19 40 77 78 83
raguay 310 82 70 75 12 0.64 14 25 3 100 67 86 31 25 43
ru 370 84 50 77 13 0.59 22 19 4 109 92 85 23 22 36
lippines 320 62 34 73 12 0.58 22 29 22 106 85 92 52 42 64
atar 4,400 100 32 2 78 14 0.28 0 8 6 (z) 103 94 100 37 53 6
udi Arabia 1,300 97 29 (y) 2 76 14 0.16 0 18 14 (z) 106 101 95 (z) 63 69 39
gapore 10,000 100 (y) 55 84 –– 0.53 22 3 3 (z) — — 100 — — —
uth Africa 100 91 60 54 12 (z) 0.60 41 57 9 102 94 91 33 31 56
Lanka 1,100 99 53 5 78 12 (z) 0.56 6 17 21 99 87 91 42 35 61
riname 400 90 45 74 13 (z) 0.44 12 31 7 113 75 92 54 51 49
aziland 75 82 47 49 10 0.71 22 78 6 116 58 71 64 48 72
rian Arab Republic 610 96 43 78 10 (z) 0.20 12 16 10 118 72 90 69 75 50
kistan 430 83 32 71 11 0.65 18 63 15 102 87 64 62 44 73
ailand 1,200 100 80 78 13 0.63 16 13 7 91 79 96 16 15 35
nidad and Tobago 1,100 98 38 74 12 0.55 27 27 6 (z) 105 90 94 24 31 31
nisia 860 95 52 77 15 0.28 27 16 3 109 90 94 (z) 26 38 18
rkey 1,900 91 46 77 12 0.26 14 18 2 102 78 100 47 63 10
rkmenistan 500 100 45 69 –– 0.65 17 56 8 99 84 72 (z) — — 69
ited Arab Emirates 4,200 100 24 2 78 13 0.27 18 7 14 (z) 104 92 100 37 49 25
uguay 1,700 100 75 6 81 17 0.55 12 11 5 113 90 100 7 8 8
bekistan 1,400 100 59 72 11 0.64 19 52 4 95 106 87 31 24 48
nezuela, Bolivarian Republic of 540 95 62 78 15 0.48 17 18 4 103 83 83 (z) 17 17 41
etnam 850 88 68 77 12 0.69 24 23 20 106 77 95 20 16 61
mbabwe 42 66 58 53 10 0.58 (y) 18 80 10 91 45 80 70 68 74
Data refer to the year specified in the column heading or the most recently available. (y) Data are from an earlier publication of the same source. (z) Data differ from the standard definition and/or are from a secondary source. – No data ' Calendar days '' Working days (all other days unspecified)
Mothers’ Index rankings include only the countries for which sufficient data were available to calculate both the Women’s and Children’s Indexes.The Women’s Index and Children’s Index ranks, however,include additional countri es for which adequate data were available to present findings on either women’s or children'sors, but not both. For complete methodology see Methodology and Research Notes .rt from political status, the data presented are pre-cession estimates.
e total includes all voting members of the House;(ii) There is no parliament; (iii) Results of elections to the lower or upper house only,not both; (iv) Parliament has been dissolved or suspended for an indefinite period; (v) The legislative council has been unable to meet and govern since 2007;(vi) Figures calculated on theof permanent seats only; (vii) The parliament was dissolved following the December 2008 coup.
% prior to birth and for 150 days after; 50% for the rest of the leave period; (b) Each parent can take up to 12 months of leave,of which 18 weeks are paid;(c) 82% for the first 30 days;75% for the remaining period; (d) Up to a ceiling;(e) Federal = 17 weeks maternity leave,a dditional 35 weeks parental leave shareden both parents;(f) 45 days before delivery and 1 year after;(g ) 100% until the child reaches 6 months, then at a flat rate for the remaining period;(h) Benefits vary, but there is a minimum flat rate; (j) 50% plus a dependent's supplement (minimum benefit = 67%); a maternity supplement of up to 33% may also beed (i.e. most mothers get 100% replacement of earnings); (k) Paid amount not specified;(l) Paid only the first 13 weeks;(m) Parental benefits paid at 100% for the shorter duration of leave; 80% for the longer option;(n) 100% of earnings paid for the first 6 months;60% from the 6th-9th month;30% for the last 3 months;0 days paid parental leave,60 days reserved for each parent: 80% for 390 days,flat rate for remaining 90; (p) 90% for the first 6 weeks and a flat rate for the remaining weeks;(q) No national program; cash benefits may be provided at the state level;(r) Benefits vary by province/canton;(s) A birth grant is also paid in lump sum .
ata excludes Northern Ireland; (2) Data pertain to nationals of the country; (3) Data pertain to the Jewish population;(4) Data pertain to Peninsular Malaysia;(5) Data exclude the Northern Province;(6) Data pertain to men and women.
e countr ies also offer prolonged periods of leave of at least two years either as parental leave alone or by taking parental leave in addition to other child-related leave. For additional information on leave entitlements see the OECD Family Database:oecd.org/ dataoecd/45/26/37864482.pdf
(vi)
(v)
(z)
(z)
(z)
(z)

7/31/2019 Estado Mundial de las Madres
http://slidepdf.com/reader/full/estado-mundial-de-las-madres 58/70
To copy this table onto 81 ⁄ 2 x 11" paper, set your photocopier reduction to 85%
Lifetime risk of maternal
death(1in
number stated)
Percent of
birthsattended by skilled health
personnel
Percent of women using
moderncontraception
Female lifeexpectancy
at birth(years)
Expectednumber of
years of formalfemale
schooling
Ratio of
estimatedfemale to
male earnedincome
Participationof women
in nationalgovernment(% seats heldby women)
Under-5
mortality rate
(per 1,000live births)
Percent of children under
5 moderately or severely
underweightfor age
Grossprimary
enrollmentratio
(% of total)
Ratio of
girls to boysenrolled inprimary school
Percent of
populationwith access
to safedrinking water
Mothers’Index Rank (out of 42
countries)+
Women’sIndex Rank (out of 42
countries)+
Children’sIndex Rank (out of 44
countries)+
TIER III Women’s Index Children’s Index Rankings
2008 2010 20112010 2007 2011 2010 2010 2011 2011 20102010
Development Group Health Status EducationalStatus
PoliticalStatus Children’s Status SOWM 2012
EconomicStatus
LEAST DEVELOPEDCOUNTRIES
ghanistan 11 24 16 49 6 0.24 28 149 33 97 0.69 50 41 41 41
gola 29 47 5 53 9 0.64 38 161 16 124 0.81 51 20 15 33
ngladesh 110 27 48 70 8 (y) 0.51 20 48 41 95 1.04 81 16 16 13
nin 43 74 6 59 7 0.52 8 115 18 126 0.87 75 26 28 17
utan 170 65 31 70 12 0.39 14 56 13 111 1.01 96 2 7 1
rkina Faso 28 54 13 57 6 0.66 15 176 26 79 0.93 79 29 27 28
rundi 25 60 8 53 11 0.77 35 142 29 156 0.99 72 8 2 24
mbodia 110 71 27 65 10 0.68 18 51 28 127 0.95 64 6 3 13
ntral African Republic 27 44 9 51 5 0.59 13 159 24 93 0.71 67 32 33 34
ad 14 23 2 52 6 0.70 13 173 30 90 0.73 51 36 31 42
omoros 71 62 19 63 9 0.58 3 86 25 (z) 104 0.92 95 14 17 5
ongo, Democratic Republic of the 24 74 6 51 7 0.46 5 170 24 94 0.87 45 33 32 40
bouti 93 93 17 60 5 0.57 14 91 23 59 0.90 88 23 24 18
uatorial Guinea 73 65 6 53 7 0.36 10 121 19 (z) 87 0.97 43 (z) 31 34 27
trea 72 28 5 64 4 0.50 22 61 35 45 0.84 61 (z) 37 36 37
hiopia 40 6 14 62 8 0.67 26 106 33 102 0.91 44 25 20 32
ambia 49 57 13 60 8 0.63 8 98 18 83 1.02 89 19 19 6
uinea 26 46 4 56 7 0.68 — 130 21 94 0.84 74 28 25 22
uinea-Bissau 18 44 6 50 5 0.46 10 150 18 123 0.94 64 39 40 26
aiti 93 26 24 64 –– 0.37 4 165 18 111 0.98 69 — — 23
o People’s Democratic Republic 49 20 29 69 9 0.76 25 54 31 121 0.90 67 11 11 20
sotho 62 62 46 48 10 0.73 24 85 13 103 0.98 78 4 6 4
eria 20 46 10 59 9 0.50 11 103 15 96 0.91 73 22 25 11
adagascar 45 44 28 69 10 0.71 12 62 42 (z) 149 0.98 46 15 8 35
alawi 36 54 38 55 10 0.74 22 92 13 135 1.04 83 3 4 3
ali 22 49 6 53 6 0.44 10 178 27 82 0.88 64 38 35 38
auritania 41 61 8 61 8 0.58 19 111 15 102 1.05 50 21 21 20
ozambique 37 55 12 52 8 0.90 39 135 18 115 0.90 47 10 5 29
yanmar 180 64 38 68 10 0.61 3 66 23 126 1.00 83 7 10 9
epal 80 19 44 70 8 0.61 33 50 39 115 0.86 89 12 14 16
ger 16 33 5 56 4 0.34 13 143 40 71 0.84 49 42 42 43
wanda 35 69 26 57 11 0.79 52 91 11 143 1.02 65 1 1 7
negal 46 52 10 61 8 0.55 30 75 14 87 1.06 72 18 21 8
rra Leone 21 42 6 49 6 0.74 13 174 21 125 0.93 55 30 29 36
lomon Islands 230 70 27 70 9 0.51 0 27 12 109 0.97 70 (z) 9 13 2
malia 14 33 1 53 2 –– 7 180 32 32 0.55 29 — — 44
uth Sudan‡
32 49 (y) 6 64 6 0.33 24 103 31 (z) 73 0.90 58 33 36 30
dan‡ 32 49 (y) 6 64 6 0.33 24 103 31 (z) 73 0.90 58 33 38 30
nzania, United Republic of 23 49 26 60 5 (z) 0.74 36 76 16 102 1.02 53 17 18 12
mor-Leste 44 29 21 64 11 0.53 32 55 45 117 0.96 69 13 12 25
go 67 60 11 59 9 0.45 11 103 17 140 0.90 61 24 23 19
anda 35 42 18 55 11 0.69 35 99 16 121 1.01 72 5 8 10
men 91 36 19 68 7 0.25 1 77 43 87 0.82 55 40 39 39
mbia 38 47 27 50 7 (y) 0.56 12 111 15 115 1.01 61 27 30 13
(vii)
(iii)
(z)
(z)
(z)
(z)

7/31/2019 Estado Mundial de las Madres
http://slidepdf.com/reader/full/estado-mundial-de-las-madres 59/70
Sae the chilDre N · State oF the WorlD’S MotherS 2012 53
MethoDolog aND reSearch NoteS
COMPLEE MOHERS’ INDE
1. In the rst year of the Mothers’ Index (2000), a review of literature and consultation with members of theSave the Children sta identied health status, educa-tional status, political status and children’s well-being askey factors related to the well-being of mothers. In 2007,the Mothers’ Index was revised to include indicators of eco-nomic status. All countries with populations over 250,000
were placed into one of three tiers according to UnitedNations regional development groups: more developedcountries, less developed countries and least developedcountries. Indicators for each development group were
selected to best represent factors of maternal well-beingspecic to that group, and published data sources for eachindicator were then identied. o facilitate internationalcomparisons, in addition to reliability and validity, indica-tors were selected based on inclusivity (availability acrosscountries) and variability (ability to dierentiate betweencountries). o adjust for variations in data availability,
when calculating the nal index, indicators for maternalhealth and children’s well-being were grouped into sub-indices (see step 7). Tis procedure allowed researchers todraw on the wealth of useful information on those topics without giving too little weight to the factors for which less
abundant data were available. Data presented in this reportincludes information available through 01 April 2012.Sources: 2 Population: United Nations Population Fund (UNFPA). e State of World Population2011 . (New York: 2); Classifcation o development regions: United Nations Population Division.World Population Prospects: Te 2008 Revision. (New York: 009)
2. In ier I, data were gathered for seven indicators of wom-en’s status and three indicators of children’s status. Sucientdata existed to include analyses of two additional indicatorsof children’s well-being in iers II and III. Indicators uniqueto specic development groups are noted below.
’
:
Lifetime risk of maternal death A woman’s risk of death in childbirth is a function of
many factors, including the number of children she hasand the spacing of births as well as the conditions under
which she gives birth and her own health and nutritionalstatus. Te lifetime risk of maternal mortality is the prob-ability that a 15-year-old female will die eventually from amaternal cause. Tis indicator reects not only the risk of maternal death per pregnancy or per birth, but also the levelof fertility in the population. Competing causes of maternal
death are also taken into account. Estimates are periodi-
cally calculated by an inter-agency group including WHO,UNICEF, UNFPA and the World Bank. Data are for 2008and represent the most recent of these estimates available atthe time of this analysis.Source: WHO, UNICEF, UNFPA and the World Bank. Trends in Maternal Mortality: 1990 to 2008. (Geneva: 010) Available online at: whqlibdoc.who.int/publications/010/97894150065_eng.pd
Percent of women using modern contraception Access to family planning resources, including modern
contraception, allows women to plan their pregnancies.Tis helps ensure that a mother is physically and psycho-logically prepared to give birth and care for her child.
Data are derived from sample survey reports and estimatethe proportion of married women (including womenin consensual unions) currently using modern methodsof contraception, which include: male and female ster-ilization, IUD, the pill, injectables, hormonal implants,condoms and female barrier methods. Contraceptive prev-alence data are the most recent available as of April 2011.Source: United Nations Population Division. World Contraceptive Use 2011 . Available online at: un.org/esa/population/publications/contraceptive011/contraceptive011.htm
Skilled attendant at delivery Te presence of a skilled attendant at birth reduces
the likelihood of both maternal and infant mortality. Teattendant can help create a hygienic environment andrecognize complications that require urgent medical care.Skilled attendance at delivery is dened as those birthsattended by physicians, nurses or midwives. Data are from2006-2010. As nearly every birth is attended in the moredeveloped countries, this indicator is not included in ier I.Source: United Nations Children’s Fund (UNICEF). e State of the World’s Children 2012 . (New York: 22) Table 8, pp.6-9 Available online at: unice.org/sowc22/pds/SOWC-22-TABLE-8-WOMEN.pd
Female life expectancy Children benet when mothers live longer, healthier
lives. Life expectancy reects the health, social and eco-nomic status of a mother and captures trends in fallinglife expectancy associated with the feminization of HIV and AIDS. Female life expectancy is dened as the averagenumber of years of life that a female can expect to live if sheexperiences the current mortality rate of the population ateach age. Data estimates are for 2010-2015.Source: UNFPA. e State of World Population 2011 . (New York: 2) pp. 6-2. Available onlineat: unpa.org/swp/

7/31/2019 Estado Mundial de las Madres
http://slidepdf.com/reader/full/estado-mundial-de-las-madres 60/70
54 MethoDolog aND reSearch NoteS
’ :
Expected number of years of formal female schooling Education is singularly eective in enhancing maternal
health, women’s freedom of movement and decision-mak-ing power within households. Educated women are morelikely to be able to earn a livelihood and support theirfamilies. Tey are also more likely than uneducated womento ensure that their children eat well, nish school andreceive adequate health care. Female school life expectancy is dened as the number of years a female child of schoolentrance age is expected to spend at school or university,including years spent on repetition. It is the sum of theage-specic enrollment ratios for primary, secondary, post-secondary non-tertiary and tertiary education. Primary tosecondary estimates are used where primary to tertiary are not available. Data are from 2011 or the most recent
year available.Sources: UNESCO Institute for Statistics (UIS). Data Centre. s tats.uis.unesco.org, supplemented withdata rom UNESCO. Global Education Digest 2011 . (Montreal: 2) Table , pp.26-22. Availableonline at: uis.unesco.org/Education/Documents/ged-011-en.pd
’ :
Ratio of estimated female to male earned incomeMothers are likely to use their inuence and the resourc-
es they control to promote the needs of their children. Where mothers are able to earn a decent standard of livingand wield power over economic resources, children survive
and thrive. Te ratio of estimated female earned income toestimated male earned income – how much women earnrelative to men for equal work – reveals gender inequal-ity in the workplace. Female and male earned income arecrudely estimated based on the ratio of the female nonagri-cultural wage to the male nonagricultural wage, the femaleand male shares of the economically active population, thetotal female and male population, and GDP per capita inpurchasing power parity terms in US dollars. Estimates arebased on data for the most recent year available between1996 and 2007.Source: United Nations Development Programme (UNDP). Human Development Report 2009.
(New York: 009) able K, pp.186-189. Available online at: hdrst ats.undp.org/en/indicators/130.html
Maternity leave benetsTe maternity leave indicator includes both the length
of time for which benets are provided and the extent of compensation. Te data are compiled by the InternationalLabour Office and the United States Social Security Administration from a variety of legislative and non-legis-lative sources as of December 2011. Where parental leaveentitlements are paid at the same level, the total length of leave available to mothers is reported. Data on maternity leave benets are reported for only ier I countries, where
women comprise a considerable share of the non-agricul-
tural workforce and thus most working mothers are free toenjoy the benets of maternity leave.Sources:ILO Database on Conditions of Work and Employment Laws , ilo.org/dyn/travail/travmain.home;United Nations Statistics Division. Statistics and Indicators on Women and Men. Table g. UpdatedDecember 011. Available online at: unstats.un.org/unsd/demographic/products/indwm/
’ :
Participation of women in national government When women have a voice in public institutions, they
can participate directly in governance processes and advo-cate for issues of particular importance to women andchildren. Tis indicator represents the percentage of seatsoccupied by women in single or, in the case of bicamerallegislatures, upper and lower houses of national parlia-ments. Data are as of 31 December 2011.Source: Inter-Parliamentary Union (IPU). Women in National Parliaments. Available online at:ipu.org/wmn-e/classi.htm
’ - :
Under-5 mortality rateUnder-ve mortality rates are likely to increase dramati-
cally when mothers receive little or no prenatal care andgive birth under dicult circumstances, when infants arenot exclusively breastfed, when few children are immunizedand when fewer receive preventive or curative treatmentfor common childhood diseases. Under-ve mortality rateis the probability of dying between birth and exactly veyears of age, expressed per 1,000 live births. Estimates arefor 2010.Source: UNICEF. Te State of the World’s Children 2012 . (New York: 01) able 1, pp.88-91 Availableonline at: unice.org/sowc01/pds/SOWC-01-ABLE-1-BASIC-INDICAORS.pd
Percentage of children under age 5 moderately orseverely underweight
Poor nutrition aects children in many ways, includ-ing making them more susceptible to a variety of illnessesand impairing their physical and cognitive development.Children moderately or severely underweight are more thantwo and three standard deviations below median weight-for-age of the WHO Child Growth Standards respectively.
Data are for the most recent year available between 2006and 2010. Where WHO data are not available, estimatesbased on the NCHS/WHO reference population are used.Please note that in years past NCHS/WHO data were theprimary source; these estimates are no longer reported. Dueto this change, these underweight data are not comparableto estimates included in previous editions of the Mothers’ Index . Tis indicator is included in ier II and ier IIIonly, as few more developed countries have available data.Source: UNICEF. Te State of the World’s Children 2012. (New York: 01) able , pp.9-95 Availableonline at: unice.org/sowc01/pds/SOWC-01-ABLE--NURIION.pd
7/31/2019 Estado Mundial de las Madres
http://slidepdf.com/reader/full/estado-mundial-de-las-madres 61/70
Sae the chilDre N · State oF the WorlD’S MotherS 2012 55
Gross pre-primary enrollment ratioEarly childhood care and education, including pre-pri-
mary schooling, supports children’s growth, development,learning and survival. It also contributes to proper healthand poverty reduction and can provide essential supportfor working parents, particularly mothers. Te pre-prima-ry gross enrollment ratio is the total number of childrenenrolled in pre-primary education, regardless of age,expressed as a percentage of the total number of childrenof ocial pre-primary school age. Te ratio can be higherthan 100 percent when children enter school later thanthe ocial enrollment age or do not advance throughthe grades at expected rates. Data are for the school yearending in 2011 or the most recently available. Pre-primary enrollment is analyzed across ier I countries only.Source: UNESCO Institute or Statistics (UIS). Data Centre. stats.uis.unesco.org
Gross primary enrollment ratio
Te gross primary enrollment ratio (GER) is the totalnumber of children enrolled in primary school, regardlessof age, expressed as a percentage of the total number of children of ocial primary school age. Where GERs arenot available, net attendance ratios are used. Data are forthe school year ending in 2011 or the most recently avail-able. Tis indicator is not tracked in ier I, where nearly all children complete primary school.Sources: UNESCO Institute for Statistics (UIS). Data Centre. st ats.uis.unesco.org, supplemented withdata from UNESCO. Global Education Digest 2011 . (Montreal: 2011) Table 3, pp.112-121. Available onlineat: uis.unesco.org/Education/Documents/ged-2-en.pd and UNICEF. Primary school enrolment(updated Jan 01), childino.org/education_enrolment.php
Gender parity index Educating girls is one of the most eective means of
improving the well-being of women and children. Te ratioof gross enrollment of girls to boys in primary school – orGender Parity Index (GPI) – measures gender disparities inprimary school participation. It is calculated as the numberof girls enrolled in primary school for every 100 enrolledboys, regardless of age. A score of 1 means equal numbersof girls and boys are enrolled; a score between 0 and 1indicates a disparity in favor of boys; a score greater than1 indicates a disparity in favor of girls. Where GERs arenot available, net attendance ratios are used to calculate
the GPI. Data are for the school year ending in 2011 or themost recently available. GPI is included in ier III, wheregender equity gaps disadvantaging girls in access to educa-tion are the largest in the world.Source: UNESCO Institute or Statistics (UIS). Data Centre. stats.uis.unesco.org, supplemented withdata from UNESCO. Global Education Digest 2011 . (Montreal: 2011) Table 3, pp.112-121. Available onlineat: uis.unesco.org/Education/Documents/ged-011-en.pd
Gross secondary enrollment ratioTe gross secondary enrollment ratio is the total number
of children enrolled in secondary school, regardless of age,expressed as a percentage of the total number of children of ocial secondary school age. Data are for the school year
ending in 2011 or the most recently available. Tis indicator
is not tracked in ier III where many children still do notattend primary school, let alone transition to higher levels.Sources: UNESCO Institute for Statistics (UIS). Data Centre. s tats.uis.unesco.org, supplemented withdata rom UNICEF. Secondary School Participation (updated Jan 22), childino.org/education_sec-ondary.php
Percent of population with access to safe waterSafe water is essential to good health. Families need an
adequate supply for drinking as well as cooking and wash-ing. Access to safe and aordable water also brings gains forgender equity, especially in rural areas where women andyoung girls spend considerable time collecting water. Tisindicator reports the percentage of the population withaccess to an adequate amount of water from an improvedsource within a convenient distance from a user’s dwelling,as dened by country-level standards. “Improved” watersources include household connections, public standpipes,boreholes, protected dug wells, protected springs and rain- water collection. In general, “reasonable access” is dened
as at least 20 liters (5.3 gallons) per person per day, froma source within one kilometer (0.62 miles) of the user’sdwelling. Data are for 2010.Source: WHO/UNICEF Joint Monitoring Programme or Water Supply and Sanitation. Progress on Drinking Water and Sanitation - 2012 Update . (UNICEF and WHO: New York: 01) Available onlineat: childino.org/fles/JMPreport22.pd , supplemented with data rom UNICEF. e State of the World’s Children 2012. (New York: 22) Table , pp.96-99 Available online at: unice.org/sowc22/pds/SOWC-01-ABLE-3-HEALH.pd
3. Missing data were supplemented when possible withdata from the same source published in a previous year, asnoted in the fold-out table in this appendix.
4. Data points expressed as percentages were rounded to
the nearest tenth of one percent for analysis purposes. Dataanalysis was conducted using Microsoft Excel software.
5. Standard scores, or Z-scores, were created for each of theindicators using the following formula: z = (x-x-)/s where:
z = Te standard, or z-scorex = Te score to be convertedx- = Te mean of the distributions = Te standard deviation of the distribution
6. Te standard scores of indicators of ill-being were thenmultiplied by (-1) so that a higher score indicated increased
well-being on all indicators.
Notes on specic indicators
• o facilitate cross-country comparisons, length of maternity leave was converted into days and allowances were averaged over the entire pay period.
• o report ndings for the greatest number of countriespossible, countries without a parliament, or where ithas been dissolved, suspended or otherwise unable tomeet, are given a “” for political representation whencalculating index scores.
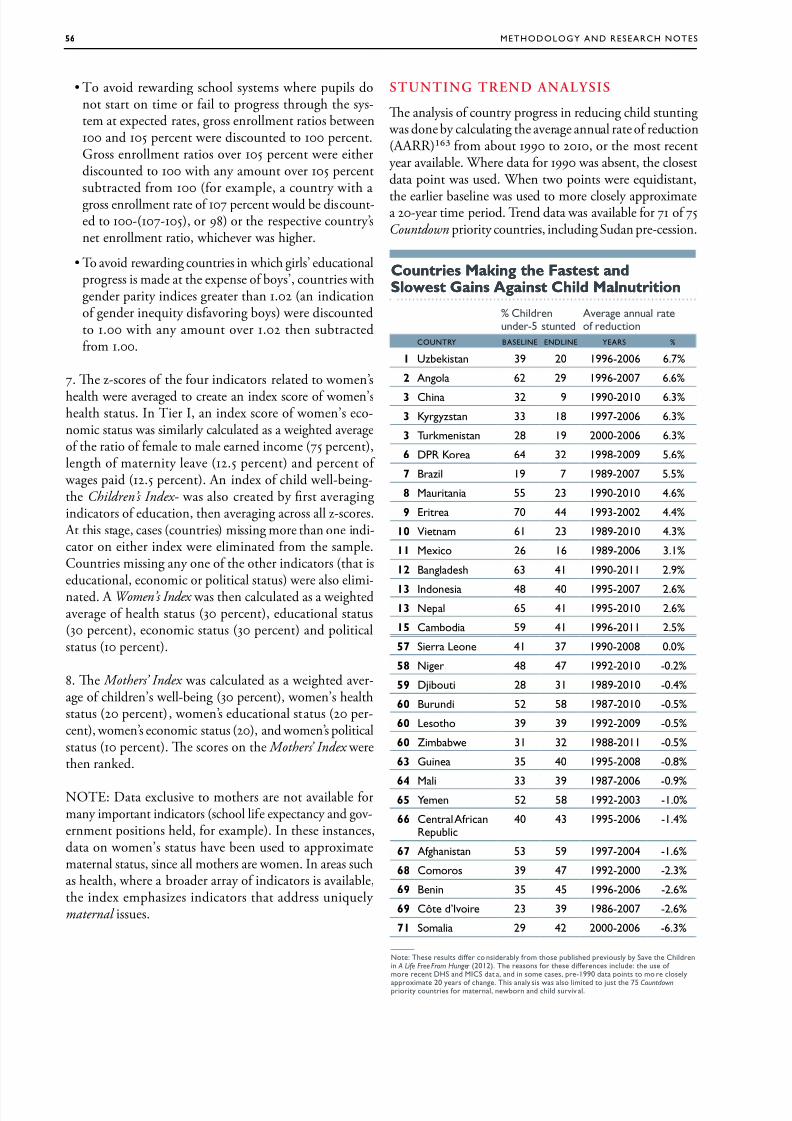
7/31/2019 Estado Mundial de las Madres
http://slidepdf.com/reader/full/estado-mundial-de-las-madres 62/70
56 MethoDolog aND reSearch NoteS
• o avoid rewarding school systems where pupils donot start on time or fail to progress through the sys-tem at expected rates, gross enrollment ratios between100 and 105 percent were discounted to 100 percent.Gross enrollment ratios over 105 percent were eitherdiscounted to 100 with any amount over 105 percentsubtracted from 100 (for example, a country with agross enrollment rate of 107 percent would be discount-ed to 100-(107-105), or 98) or the respective country’snet enrollment ratio, whichever was higher.
• o avoid rewarding countries in which girls’ educationalprogress is made at the expense of boys’, countries withgender parity indices greater than 1.02 (an indicationof gender inequity disfavoring boys) were discountedto 1.00 with any amount over 1.02 then subtractedfrom 1.00.
7. Te z-scores of the four indicators related to women’s
health were averaged to create an index score of women’shealth status. In ier I, an index score of women’s eco-nomic status was similarly calculated as a weighted averageof the ratio of female to male earned income (75 percent),length of maternity leave (12.5 percent) and percent of
wages paid (12.5 percent). An index of child well-being-the Children’s Index - was also created by rst averagingindicators of education, then averaging across all z-scores. At this stage, cases (countries) missing more than one indi-cator on either index were eliminated from the sample.Countries missing any one of the other indicators (that iseducational, economic or political status) were also elimi-nated. A Women’s Index was then calculated as a weightedaverage of health status (30 percent), educational status(30 percent), economic status (30 percent) and politicalstatus (10 percent).
8. Te Mothers’ Index was calculated as a weighted aver-age of children’s well-being (30 percent), women’s healthstatus (20 percent), women’s educational status (20 per-cent), women’s economic status (20), and women’s politicalstatus (10 percent). Te scores on the Mothers’ Index werethen ranked.
NOE: Data exclusive to mothers are not available formany important indicators (school life expectancy and gov-ernment positions held, for example). In these instances,data on women’s status have been used to approximatematernal status, since all mothers are women. In areas suchas health, where a broader array of indicators is available,the index emphasizes indicators that address uniquely maternal issues.
SUNING REND ANALYSIS
Te analysis of country progress in reducing child stunting was done by calculating the average annual rate of reduction(AARR) from about 1990 to 2010, or the most recentyear available. Where data for 1990 was absent, the closestdata point was used. When two points were equidistant,
the earlier baseline was used to more closely approximatea 20-year time period. rend data was available for 71 of 75Countdown priority countries, including Sudan pre-cession.
Countrie akin te Fatet anCountrie akin te Fatet anslowet gain aint Cil alnutritionslowet gain aint Cil alnutrition
% cdnund-5 sund
av nnu f dun
coUNtr BaSeliNe eNDliNe earS %
1 Uzbksn 39 20 1996-2006 6.7%
2 an 62 29 1996-2007 6.6%
3 cn 32 9 1990-2010 6.3%
3 Kyyzsn 33 18 1997-2006 6.3%
3 tukmnsn 28 19 2000-2006 6.3%
6 Dpr K 64 32 1998-2009 5.6%
7 Bz 19 7 1989-2007 5.5%
8 Mun 55 23 1990-2010 4.6%
9 e 70 44 1993-2002 4.4%
10 nm 61 23 1989-2010 4.3%
11 Mx 26 16 1989-2006 3.1%
12 Bnds 63 41 1990-2011 2.9%
13 indns 48 40 1995-2007 2.6%13 N 65 41 1995-2010 2.6%
15 cmbd 59 41 1996-2011 2.5%
57 S ln 41 37 1990-2008 0.0%
58 N 48 47 1992-2010 -0.2%
59 Djbu 28 31 1989-2010 -0.4%
60 Buund 52 58 1987-2010 -0.5%
60 ls 39 39 1992-2009 -0.5%
60 Zmbbw 31 32 1988-2011 -0.5%
63 gun 35 40 1995-2008 -0.8%
64 M 33 39 1987-2006 -0.9%65 mn 52 58 1992-2003 -1.0%
66 cn afnrub
40 43 1995-2006 -1.4%
67 afnsn 53 59 1997-2004 -1.6%
68 cms 39 47 1992-2000 -2.3%
69 Bnn 35 45 1996-2006 -2.6%
69 cô d’iv 23 39 1986-2007 -2.6%
71 Sm 29 42 2000-2006 -6.3%
—
N: ts sus dff nsdby fm s ubsd vusy by Sv cdnn A Life Free From Hunger (2012). t sns f s dffns nud: us f m n DhS nd MicS d , nd n sm ss, -1990 d ns m sy
xm 20 ys f n. ts ny ss ws s md jus 75 Countdown y uns f mn, nwbn nd d suvv .
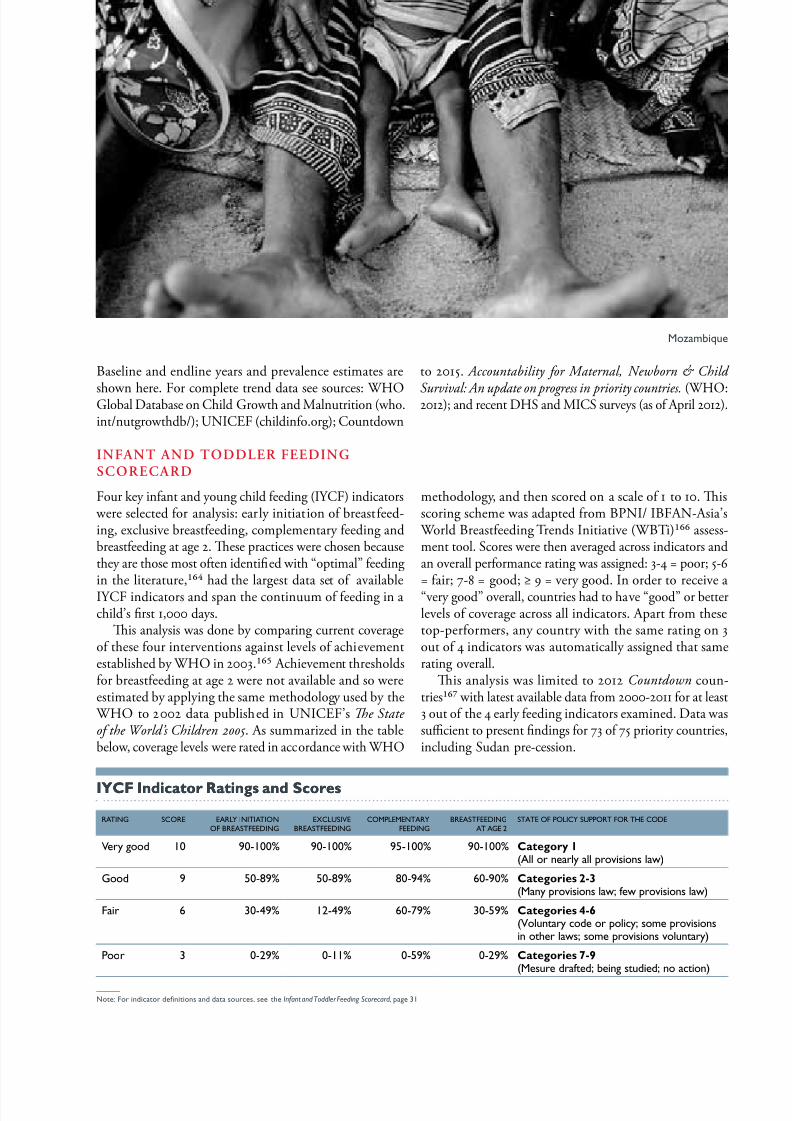
7/31/2019 Estado Mundial de las Madres
http://slidepdf.com/reader/full/estado-mundial-de-las-madres 63/70
Sae the chilDre N · State oF the WorlD’S MotherS 2012 57
Baseline and endline years and prevalence estimates are
shown here. For complete trend data see sources: WHOGlobal Database on Child Growth and Malnutrition (who.int/nutgrowthdb/); UNICEF (childinfo.org); Countdown
to 2015. Accountability for Maternal, Newborn & Child
Survival: An update on progress in priority countries. (WHO:2012); and recent DHS and MICS surveys (as of April 2012).
yCF nicator Ratin an scoreyCF nicator Ratin an score
ratiNg Score earl iNitiatioNoF BreaStFeeDiNg
eclUSieBreaStFeeDiNg
coMpleMeNtarFeeDiNg
BreaStFeeDiNgat age 2
State oF polic SUpport For the coDe
y d 10 90-100% 90-100% 95-100% 90-100% Cateor 1 (a ny vsns w)
gd 9 50-89% 50-89% 80-94% 60-90% Cateorie 2-3 (Mny vsns w; fw vsns w)
F 6 30-49% 12-49% 60-79% 30-59% Cateorie 4-6 (uny d y; sm vsnsn ws; sm vsns vuny)
p 3 0-29% 0-11% 0-59% 0-29% Cateorie 7-9 (Msu dfd; bn sudd; n n)
—
N: F nd dnns nd d sus, s Infant and Toddler Feeding Scorecard , 31
INFAN AND ODDLER FEEDINGSCORECARD
Four key infant and young child feeding (IYCF) indicators were selected for analysis: early initiation of breastfeed-ing, exclusive breastfeeding, complementary feeding andbreastfeeding at age 2. Tese practices were chosen becausethey are those most often identied with “optimal” feedingin the literature, had the largest data set of availableIYCF indicators and span the continuum of feeding in achild’s rst 1,000 days.
Tis analysis was done by comparing current coverageof these four interventions against levels of achievementestablished by WHO in 2003. Achievement thresholdsfor breastfeeding at age 2 were not available and so wereestimated by applying the same methodology used by the
WHO to 2002 data published in UNICEF’s e State of the World’s Children 2005 . As summarized in the tablebelow, coverage levels were rated in accordance with WHO
methodology, and then scored on a scale of 1 to 10. Tisscoring scheme was adapted from BPNI/ IBFAN-Asia’s
World Breastfeeding rends Initiative (WBi) assess-ment tool. Scores were then averaged across indicators andan overall performance rating was assigned: 3-4 = poor; 5-6= fair; 7-8 = good; ≥ 9 = very good. In order to receive a“very good” overall, countries had to have “good” or betterlevels of coverage across all indicators. Apart from thesetop-performers, any country with the same rating on 3out of 4 indicators was automatically assigned that samerating overall.
Tis analysis was limited to 2012 Countdown coun-tries with latest available data from 2000-2011 for at least3 out of the 4 early feeding indicators examined. Data wassucient to present ndings for 73 of 75 priority countries,including Sudan pre-cession.
Mzmbqu

7/31/2019 Estado Mundial de las Madres
http://slidepdf.com/reader/full/estado-mundial-de-las-madres 64/70
58 MethoDolog aND reSearch NoteS
Breatfeein Polic scorecar nicator Ratin an scoreBreatfeein Polic scorecar nicator Ratin an score
pd v fpd v fmsms
ratiNg Score leNgthoF leae
% WageS paiD BreaStFeeDiNg BreaKS at WorK BaB-FrieNDlhoSpitalS (%)
State oF polic SUpport For the coDe
y d 10 ≥ 52wks
100% Bks f dunf bsfdn (.. n m)
≥ 75% Cateor 1 (a ny vsns w)
gd 9 26-51
wks
75-99% Bks wd un d
s ≥ 7 mns d
50-74% Cateorie 2-3
(Mny vsns w; fw vsns w)F 6 14-25
wks50-74% Bks f <1 u/ dy
un d s ≤ 6 mnsd n sfd
15-49% Cateorie 4-6 (uny d y; sm vsnsn ws; sm vsns vuny)
p 3 < 14wks
0-49% f
N bsfdn bks
0-14% Cateorie 7-9 (Msu dfd; bn sudd; n n)
BREASFEEDING POLICY SCORECARD
Te Breastfeeding Policy Scorecard examines informa-tion about the supportive nature of the environment forbreastfeeding in industrialized countries. Te followingset of policy-related indicators were included in the analy-sis: duration and wage replacement of paid leave availablefor mothers (which includes maternity and parental leave, where available), daily length of breastfeeding breaks andlength of breastfeeding break coverage, the percentage of hospitals and maternities that have been designated baby-friendly and the state of policy support for the International Code of the Marketing of Breast-milk Substitutes (akathe Code).
Country performance on each indicator was rated andscored in accordance with the achievement levels outlinedin the table below. Achievement levels for paid leave andbreastfeeding breaks were established by the World Legal
Rights Data Centre: Adult Labour Database. Please notethat although country placement according to these cat-egories was publicly available for these indicators, the raw data (i.e. the total length of paid leave available to mothersand the wage replacement over that period of paid leave)
were not. Information on maternity leave was presentedinstead in the table to illustrate the variation in protectionpolicies across countries, even though countries are scoredand rated according to the entire length of paid leave avail-able to mothers. Due to the nuanced nature of parentalleave policies, which were also examined, this data was notincluded in the table. Similarly, as all countries guarantee-
ing breastfeeding breaks permit them to be taken for at
least 6 months (i.e. the recommended duration of exclu-sive breastfeeding), this indicator, although examined andincluded in country assessments, was not presented in thetable. Achievement levels for baby-friendly hospitals wereadapted from coverage categories reported in Cattaneo etal. in 2004. And those for the Code are where expert
opinion placed natural breaks along IBFAN’s continuumof Code categories. Breastfeeding practices were alsoexamined across countries. However, countries were notscored or rated along these dimensions.
For many indicators, estimates varied across sources.In the case of policy data, the most recent data available was used. For breastfeeding practices, to ensure the great-est degree of comparability, data were taken from a singlesource as much as possible: Adriano Cattaneo (Institutefor Maternal and Child Health IRCCS Burlo Garofolo,rieste, Italy). In some cases, these estimates do not repre-sent the most recent gures, but they are the most reliable.
Cattaneo’s dataset was supplemented by recent nationalinfant and child feeding surveys, the WHO, and in the caseof missing data, the OECD. For a complete list of sources,see the Breastfeeding Policy Scorecard, page 43.
Once each indicator was rated and scored, scores wereaveraged across indicators and an overall performancerating was assigned: 3-4 = poor; 5-6 = fair; 7-8 = good;≥ 9 = very good. In order to receive a “very good” overall,countries had to have “good” or better levels of coverageacross all indicators. Sucient data, dened as missing nomore than one data point, existed to present ndings for36 industrialized countries.

7/31/2019 Estado Mundial de las Madres
http://slidepdf.com/reader/full/estado-mundial-de-las-madres 65/70
Sae the chilDre N · State oF the WorlD’S MotherS 2012 59
eNDNoteS
Calculation by Save the Children. Datasources: Black, Robert E., Lindsay Allen,Zulqar Bhutta, Laura Cauleld, Mercedesde Onis, Majid Ezzati, Colin Mathersand Juan Rivera, “Maternal and ChildUndernutrition: Global and RegionalExposures and Health Consequences,” e Lancet, Vol. , Issue , January ,, pp.-, and UNICEF, e State of the World’s Children (New York:) able. . p.
Alive and Trive. Nutrition and Brain Development in Early Life. (Washington, DC: )
Calculation by Save the Children.UNICEF. e State of the World’s Children
. ables and Grantham-McGregor, Sally, Yin BunCheung, Santiago Cueto, Paul Glewwe,Linda Richter and Barbara Strupp.“Development Potential for the First Yearsfor Children in Developing Countries.”e Lancet .Vol. , Issue . January ,. pp.-
Horton, Susan. “Opportunities forInvestments in Low Income Asia.” AsianDevelopment Review. Vol., Nos.,.pp.-. Horton, Susan, Meera Shekar,Christine McDonald, Ajay Mahal and JanaKrystene Brooks. Scaling Up Nutrition: What
Will It Cost? (World Bank: Washington, DC:)
Food and Agriculture Organization. e State of Food Insecurity in the World .(Rome: )
Hoddinott, John, John Maluccio, JereBehrman, Rafael Flores and ReynaldoMartorell.“Eect of a Nutrition InterventionDuring Early Childhood on EconomicProductivity in Guatemalan Adults.” e Lancet. Vol. , Issue . February ,. pp.-
Save the Children. A Life Free FromHunger. (London: ) Calculated using
stunting prevalence rates from Mercedes deOnis, Monika Blössner and Elaine Borghi,“Prevalence and rends of Stunting AmongPre-School Children, -,” Public Health Nutrition, Vol., No., July ,. pp.-
de Onis, Mercedes, et al. “Prevalence andrends of Stunting Among Pre-SchoolChildren, -,” Public HealthNutrition. p.
Data sources: WHO Global Database onChild Growth and Malnutrition, UNICEFglobal databases, recent MICS and DHSsurveys (as of March )
In Afghanistan, percent of childrenare stunted. In Burundi, imor-Leste and
Yemen, percent of children are stunted.
UNICEF. e State of the World’s Children . able . p.
de Onis, M, et al. “Prevalence and rendsof Stunting Among Pre-School Children,-,” Public Health Nutrition. p.
Ibid.
UNICEF. e State of the World’s Children .
de Onis, Mercedes, et al. “Prevalenceand rends of Stunting Among Pre-SchoolChildren, -,” Public HealthNutrition. p.
UNICEF. e State of the World’s Children . ables and . pp.,
Black, Robert E., et al. “Maternal andChild Undernutrition: Global and RegionalExposures and Health Consequences,” e Lancet.
Ibid.
UNICEF. e State of the World’s Children . able . p.
Black, Robert E. et al. “Maternal andChild Undernutrition: Global and RegionalExposures and Health Consequences,” e Lancet .
Ibid.
Abdallah, Saade and Gilbert Burnham
(editors). Public Health Guide for Emergencies . (Te Johns Hopkins Schoolof Hygiene and Public Health and TeInternational Federation of Red Cross andRed Crescent Societies: Boston: ) p.
WHO. A Review of Nutritional Policies Background Paper (Geneva: ) p.
UNICEF. Undernutrition. Tracking Progress on MDG [Updated Jan ]. childinfo.org/undernutrition_mdgprogress.php
World Bank. Global Monitoring Report . Improving the Odds of Achieving the MDGs . (Washington DC: ) p.
Progress assessment by Save the Children.Sources: Countdown to ; UNICEF. e State of the World’s Children . able
WHO, UNICEF, UNFPA and the WorldBank. Trends in Maternal Mortality: to
8. (WHO: Geneva: ) pp.-
United Nations. e MillenniumDevelopment Goals Report . (New York:) p.
Ibid. p.
United Nations Standing Committee onNutrition (SCN). th Report on the World Nutrition Situation. . p.
Ibid. p.
Ibid.
Black, Robert E. et al, “Maternal andChild Undernutrition: Global and RegionalExposures and Health Consequences,” e Lancet. p. and Dewey, Kathryn andKhadija Begum, “Long-erm Consequencesof Stunting in Early Life,” Maternal & Child Nutrition, Vol., Issue Supplement s,September , . p.
Fishman, Steven, Laura Cauleld,Mercedes de Onis, Monika Blössner, AdnanHyder, Luke Mullany and Robert E. Black.“Childhood and Maternal Underweight.”Childhood and Maternal Undernutrition.(WHO: Geneva)
UNICEF. Low Birthweight. childinfo.org/low_birthweight.html
World Bank. Food Price Watch. February . worldbank.org/foodcrisis/food_price_
watch_report_feb.html
Save the Children. Costing Lives: e Devastating Impact of Rising and Volatile Food Prices. (London: )
IFPRI. Food Crisis and Financial Crisis Present Double Treat for Poor People. ifpri.org/pressrelease/food-price-crisis-and-nancial-crisis-present-double-threat-poor-people
United Nations Standing Committee onNutrition. e Impact of High Food Prices on
Maternal and Child Nutrition, Background
Paper for the SCN Side Event at the thSession of the Committee on World FoodSecurity. (Rome, – October )
Jones, Gareth, Richard Steketee, RobertE. Black, Zulqar Bhutta, and Saul Morris.“How Many Child Deaths Can We PreventTis Year?” e Lancet . Vol. , Issue .
July , . pp.-.
United Nations Standing Committee onNutrition (SCN), th Report on the World Nutrition Situation, p. and de Onis,Mercedes, et al. “Prevalence and rends of Stunting Among Pre-School Children, -,” Public Health Nutrition. p.
de Onis, Mercedes, et al. “Prevalenceand rends of Stunting Among Pre-SchoolChildren, -,” Public HealthNutrition. p.
WHO Global Database on ChildGrowth and Malnutrition, UNICEF globaldatabases, recent MICS and DHS surveys (asof March )
Angola and Uzbekistan are two of countries identied by the Countdown to as priority countries for maternal,newborn and child survival. See: Countdownto . Accountability for Maternal,Newborn & Child Survival: An Update on
Progress in Priority Countries . (WHO: )

7/31/2019 Estado Mundial de las Madres
http://slidepdf.com/reader/full/estado-mundial-de-las-madres 66/70
60 eNDNoteS
UNICEF. Progress for Children: Achieving the MDGs with Equity . (New York: )
Ergo, Alex, Davidson Gwatkin and MeeraShekar. “What Dierence Do the New
WHO Growth Standards Make for thePrevalence and Socioeconomic Distributionof Malnutrition?” Food Nutrition Bulletin.Vol., No.. March . pp.-
UNICEF. Progress for Children: Achieving the MDGs with Equity . (New York: )
Findings based on an analysis of data on underweight disparities for countries. Data source: UNICEF GlobalDatabase: childinfo.org/undernutrition_
weightbackground.php
UNICEF. Tracking Progress on Maternal and Child Nutrition: A Survival and Development Priority . (New York: )
Central Statistical Agency [Ethiopia] andICF International. Ethiopia Demographic and Health Survey . (Addis Ababa and
Calverton, MD: ) p. National Institute of PopulationResearch and raining (NIPOR), Mitraand Associates, & Macro International.Bangladesh Demographic and Health Survey
. (NIPOR, Mitra and Associates andMacro International: Dhaka and Calverton,MD: )
UNICEF. Tracking Progress on Maternal and Child Nutrition: A Survival and Development Priority.
Black, Robert E., et al. “Maternal andChild Undernutrition: Global and RegionalExposures and Health Consequences.” e
Lancet . Figure . p. Tis set of interventions were selectedbased on the potential to save lives under age, as estimated by e Lancet (Jones et al., among others) as well as the feasibility of scale up in the countries mostheavily burdened by child malnutrition, asassessed by the World Bank (Horton et al.). So, for example, while preventivezinc supplementation has been provento save lives, it is an intervention thatis not currently available for large-scaleimplementation.
LiS: Te Lives Saved ool was
created by a consortium of academic andinternational organizations, led by Instituteof International Programs at the JohnsHopkins Bloomberg School, and supportedby a Gates Foundation grant to the US Fundfor UNICEF. It allows users to estimate theimpact of dierent intervention packagesand coverage levels for countries, states ordistricts.
Horton, Susan, et al. Scaling Up Nutrition:What Will It Cost?
Cost estimates for the “lifesaving six”are as follows: iron folate supplementsfor pregnant women: per pregnancy;community nutrition programs for behaviorchange, which include the promotion of
breastfeeding, appropriate complementary feeding practices and proper hygiene,especially hand washing: . per child( per participating mother, who isassumed to have children); vitamin A supplements: . per child per year; zincfor diarrhea: per child per year. Tereforethe cost of delivering these lifesaving six
over the rst , days is estimated at +. + (×.) + (×) = . perchild. (Source: Horton et al. Scaling UpNutrition: What Cost . (World Bank: ))
Jones, Gareth, et al. “How Many ChildDeaths Can We Prevent Tis Year?” e Lancet .
de Benoist, Bruno, Erin McLean, InesEgli and Mary Cogswell (editors). Worldwide Prevalence of Anemia -: WHOGlobal Database on Anemia. (WHO andCenters for Disease Control and Prevention:Geneva and Atlanta: ) p.
Christian, Parul, Laura Murray-Kolb,
Subarna Khatry, Joanne Katz, BarbaraSchaefer, Pamela Cole, Steven LeClerq and James ielsch. “Prenatal MicronutrientSupplementation and Intellectual and MotorFunction in Early School-Aged Childrenin Nepal.” Journal of the American Medical
Association. . Vol., No. . pp.-
Horton, Susan, et al. Scaling Up Nutrition:What Will It Cost? p.
Bhutta, Zulqar, ahmeed Ahmed,Robert E Black, Simon Cousens, KathrynDewey, Elsa Giugliani, Batool Haider, Betty Kirkwood, Saul Morris, HPS Sachdev and
Meera Shekar. “What Works? Interventionsfor Maternal and Child Undernutrition andSurvival.” e Lancet . Volume ,Issue . February , . pp.-
Ibid.
WHO Collaborative Study eam on theRole of Breastfeeding on the Prevention of Infant Mortality. “Eect of Breastfeeding onInfant and Child Mortality Due to InfectiousDiseases in Less Developed Countries: A Pooled Analysis.” e Lancet . Vol. , Issue. February , . pp. –.
UNICEF. Tracking Progress on Maternal and Child Nutrition: A Survival and
Development Priority . WHO. Nutrition: Complementary Feeding .
who.int/nutrition/topics/complementary_feeding/en/index.html
Bhutta, Zulqar, et al. “What Works?Interventions for Maternal and ChildUndernutrition and Survival.” e Lancet.
Web Appendix . p.
Ramakrishnan, Usha, Phuong Nguyen,and Reynaldo Martorell. “Eects of Micronutrients on Growth of ChildrenUnder Years of Age: Meta-Analyses of Single and Multiple Nutrient Interventions.”
American Journal of Clinical Nutrition. Vol.
. January . pp.-.
Bhutta, Zulqar, et al. “What Works?Interventions for Maternal and ChildUndernutrition and Survival.” e Lancet.
United Nations Standing Committee onNutrition (SCN). th Report on the World Nutrition Situation. p.
WHO.Global Prevalence of Vitamin A
Deciency in Populations at Risk: WHOGlobal Database on Vitamin A Deciency .(Geneva: ) p.
Black, Robert E., Simon Cousens, Hope Johnson, Joy Lawn, Igor Rudan, DiegoBassani, Prabhat Jha, Harry Campbell,Christa Fischer Walker, Richard Cibulskis,Tomas Eisele, Li Liu, Colin Mathers.“Global, Regional, and National Causesof Child Mortality in : A Systematic
Analysis.” e Lancet . Vol. , Issue . June , . p.
Micronutrient Initiative. Investing in the Future: A United Call to Action on Vitaminand Mineral Deciencies- Global Report .(Ottawa: )
Jones, Gareth, et al. “How Many ChildDeaths Can We Prevent Tis Year?” andZulqar Bhutta, et al. “What Works?Interventions for Maternal and ChildUndernutrition and Survival.” e Lancet.
Black, Robert E., et al. “Global, Regional,and National Causes of Child Mortality in: A Systematic Analysis.” e Lancet .
WHO. Diarrhoeal Disease . who.int/mediacentre/factsheets/fs/en/index.html
Ibid.
Bhutta, Zulqar, et al. “What Works?Interventions for Maternal and ChildUndernutrition and Survival.” e Lancet .
Micronutrient Initiative. Investing in the Future: A United Call to Action on Vitaminand Mineral Deciencies- Global Report .
Jones, Gareth, et al. “How Many ChildDeaths Can We Prevent Tis Year?” e Lancet .
Bhutta, Zulqar, et al. “What Works?Interventions for Maternal and ChildUndernutrition and Survival.” e Lancet. p. and Webtable
Black, Robert E., et al. “Global, Regional,and National Causes of Child Mortality in: A Systematic Analysis.” e Lancet.
Jones, Gareth, et al. “How Many ChildDeaths Can We Prevent Tis Year?”e Lancet .
WHO. A Review of Nutrition Policies:Draft Report . December , . p.
Countdown to . Somalia. March. who.int/woman_child_accountability/countries/Somalia.pdf
Analysis of birth and child mortality datain UNICEF’s State of the World’s Children -.

7/31/2019 Estado Mundial de las Madres
http://slidepdf.com/reader/full/estado-mundial-de-las-madres 67/70
Sae the chilDre N · State oF the WorlD’S MotherS 2012 61
WHO. Global Data Bank on Infant and Young Child Feeding (Accessed April , )
Aguiar, Christine, Josh Rosenfeld,Beth Stevens, Sup Tanasombat andHarika Masud. An Analysis of NutritionProgramming and Policies in Peru.(University of Michigan: )
See, for example: xnity.comcast.net/slideshow/news-toppix-// and news.xinhuanet.com/english/photo/-//c_.htm
Mejíá Acosta, Andrés. Analysing Success in the Fight against Malnutrition in Peru.(Institute of Development Studies:Brighton, UK: May ) and additionalanalysis by Save the Children, sources:
WHO Global Databank on Child Growthand Malnutrition and Peru DHSFinal Report.
SAACID and Eva Gilliam. UNICEF and SAACID Promote Exclusive Breastfeeding inSomalia’s Drought-Aected Communities .December , . unicef.org/infobycountry/somalia_.html
UNICEF. e State of the World’s Children . able , p.
WHO Global Health Observatory. apps. who.int/ghodata/# (Accessed April )
UNICEF. e State of the World’s Children . able , p.
Government of Botswana. BotswanaFamily Health Survey II 88 .(Gaborone: )
Shapiro, R.L., et al. “Antiretroviral
Regimens in Pregnancy and Breast-Feedingin Botswana.” New England Journal of Medicine . June , . pp.-
Republic of Botswana, Nutrition andFood Control Division, Department of Public Health, Ministry of Health. e World Breastfeeding Trends Initiative (WBTI): Botswana Assessment Report .(Gaborone: ) p.
UNICEF. e State of the World’s Children . able , p.
Smith, Lisa, Usha Ramakrishnan, Aida Ndiaye, Lawrence James Haddadand Reynaldo Martorell. e Importance
of Women’s Status for Child Nutrition inDeveloping Countries. (IFPRI, Departmentof International Health, Emory University:
Washington DC: )
UNESCO. e Hidden Crisis. Armed Conict and Education, EFA Global
Monitoring Report. (Paris: )
Copenhagen Consensus. CopenhagenConsensus 8. copenhagenconsensus.com/Home.aspx
UNESCO Institute for Statistics. Out-of-School Children: New Data Reveal Persistent Challenges. uis.unesco.org/FactSheets/Documents/FS__OOSC_EN.pdf
WHO Global Data Bank on Infant and Young Child Feeding (Accessed March) and National Institute of Statistics,Directorate General for Health, and ICFMacro, . Cambodia Demographic and Health Survey . (Phnom Penh,Cambodia and Calverton, Maryland:National Institute of Statistics, Directorate
General for Health and ICF Macro) WHO. Learning from Large-Scale Community-Based Programmes to Improve Breastfeeding Practices. (Geneva: )pp.-
Global Health Workforce Alliance.Global Experience of Community HealthWorkers for Delivery of Health Related
Millennium Development Goals: ASystematic Review, Country Case Studies, and Recommendations for Integration into National Health Systems. (WHO: Geneva: ).p.
Ibid.
Pokharel, Raj Kumar, M.R. Maharjan,Pragya Mathema and Philip W.J. Harvey.Success in Delivering Interventions to Reduce
Maternal Anemia in Nepal: A Case Study of the Intensication of Maternal and Neonatal Micronutrient Program. (USAID:
Washington, DC: ) pp.-
Ibid., p.
Ibid., p.
UNICEF. Tracking Progress on Maternal and Child Nutrition: A Survival and Development Priority.
UNICEF. e State of the World’s Children
. able , p. United Nations Standing Committeeon Nutrition (SCN), th Report on the World Nutrition Situation.
Analysis by Save the Children. Datasource: UNICEF. e State of the World’s Children . able
WHO, UNICEF, UNFPA and the WorldBank. Trends in Maternal Mortality: to 8.
Analysis by Save the Children: Datasources: WHO Global Database on ChildGrowth and Malnutrition; General Statistical
Oce (GSO), Vietnam Multiple Indicator Cluster Survey –, Final Report ,, Hanoi, Vietnam, p.
Socialist Republic of Vietnam. National Nutrition Strategy for -, With aVision Toward . (Hanoi: ), p.
Aguayo Victor, Diakalia Koné, Sory Ibrahim Bamba, Baba Diallo, YacoubaSidibe, Diakalia raoré, Piere Signe andShawn Baker. “Acceptability of MultipleMicronutrient Supplements by Pregnant andLactating Women in Mali.” Public HealthNutrition, Vol., No.. August , .pp.-
WHO. Learning from Large-Scale Community-Based Programmes to Improve Breastfeeding Practices. (Geneva: )pp.-
WHO Global Data Bank on Infant and Young Child Feeding (AccessedMarch , )
UNICEF. Tracking Progress on Maternal and Child Nutrition: A Survival and Development Priority. p.
MacDonald, Carolyn and Solongo Altengeral. National Scale-up of Micronutrient Powders in MongolianIntegrated Program. World Visionpresentation at IYCN SatelliteMeeting, June , . iycn.org/les/FINALSprinklesGHCJun_v.pdf
Barros, Fernando, Alicia Matijasevich, Jennifer Harris Requejo, Elsa Giugliani, AnaGoretti Maranhão, Carlos Monteiro, Aluísio,
J.D. Barros, Flavia Bustreo, Mario Merialdi,and Cesar G. Victora. “Recent rends inMaternal, Newborn, and Child Healthin Brazil: Progress oward MillenniumDevelopment Goals and .” American
Journal of Public Health. Vol., No..October . pp.-.
Te Earth Institute, Colombia University.One Million Community Health Workers:Technical Task Force Report (New York:) p.
WHO Global Database on Child Growthand Malnutrition (Accessed March , )
Global Health Workforce Alliance.
Global Experience of Community HealthWorkers for Delivery of Health Related Millennium Development Goals: ASystematic Review, Country Case Studies, and Recommendations for Integration into National Health Systems .
Ibid.
WHO Global Data Bank on Infant and Young Child Feeding (Accessed March ,)
WHO, UNICEF, UNFPA and the WorldBank. Trends in Maternal Mortality: to 8.
High Level askforce on InnovativeFinancing for Health Systems. Background Paper for the Global Strategy for Women’s and Children’s Health: Access for All toSkilled, Motivated and Supported HealthWorkers .
World Bank. Repositioning Nutrition as Central to Development: A Strategy for Large-Scale Action. (Washington, DC:) p.and WHO. Global Experience of Community Health Workers for Delivery of HealthRelated Millennium Development Goals: ASystematic Review, Country Case Studies, and Recommendations for Integration into National Health Systems . (Geneva:

7/31/2019 Estado Mundial de las Madres
http://slidepdf.com/reader/full/estado-mundial-de-las-madres 68/70
62
WHO. Exclusive Breastfeeding for Six Months is Best for Babies Everywhere . January , . who.int/mediacentre/news/statements//breastfeeding_/en/index.html
U.S. Department of Health and HumanServices. e Surgeon General’s Call to Actionto Support Breastfeeding . (U.S. Department
of Health and Human Services, Oce of theSurgeon General: Washington DC: )
See, for example: Ladomenou, Fani, Joanna Moschandreas, Anthony Kafatos, Yiannis selentis and Emmanouil Galanakis.“Protective Eect of Exclusive Breastfeeding
Against Infections During Infancy: A Prospective Study.” Archives of Disease inChildhood. Vol. , No.. September ,. pp.-.
See, for example: Iacovou, Mariaand Almudena Sevilla-Sanz. e Eect of Breastfeeding on Children’s Cognitive Development . (Institute for Social &
Economic Research: Essex: December ,)
American Academy of Pediatrics Policy Statement. “Breastfeeding and the Use of Human Milk.” Pediatrics Vol., No. .February , . pp.-
Collaborative Group on HormonalFactors in Breast Cancer. “Breast Cancer andBreastfeeding: Collaborative Reanalysis of Individual Data from EpidemiologicalStudies in Countries, Including ,
Women with Breast Cancer and , Women Without the Disease.” e Lancet .Vol. , Issue . July , .
pp.- . Ip, Stanley, Mei Chung, Gowri Raman,Pricilla Chew, Nombulelo Magula, DeiedreDeVine, Tomas rikalinos and Joseph Lau.Breastfeeding and Maternal and Infant HealthOutcomes in Developed Countries. (Agency forHealthcare Research and Quality: Rockville,MD: )
See, for example: Schwarz, Eleanor Bimla, Jeanette Brown, Jennifer Creasman, AlisonStuebe, Candace McClure, Stephen VanDen Eeden and David Tom. “Lactationand Maternal Risk of ype Diabetes: A Population-Based Study.” American Journal of
Medicine. Vol., Issue . September .
pp.e-.e
See, for example: Ladomenou, Fani, et al.“Protective Eect of Exclusive Breastfeeding
Against Infections During Infancy: A Prospective Study.” Archives of Disease inChildhood.
Data sources: WHO Global DataBank on Infant and Young Child Feeding(Accessed March ), Cattaneo, Adriano,
Agneta Yngve, Berthold Koletzko and LuisRuiz Guzman. “Protection, Promotionand Support of Breast-Feeding in Europe:Progress from to .” Public HealthNutrition. ; OECD Family Database
and other recent national surveys
Bartick Melissa and Arnold Reinhold.“Te Burden of Suboptimal Breastfeeding inthe United States: A Pediatric Cost Analysis”Pediatrics . April , . pp.e–e
Department of Health (UnitedKingdom). Breastfeeding: Good Practice Guidance to the NHS. London: )
WHO Europe Region. Nutrition: Facts and Figures. euro.who.int/en/what-we-do/health-topics/disease-prevention/nutrition/facts-and-gures
Ogden, Cynthia, Margaret Carroll, LesterCurtin, Molly Lamb and Katherine Flegal.“Prevalence of High Body Mass Index inUS Children and Adolescents, -.”
Journal of the American Medical Association.Vol., No. . January , . pp.-
WHO. Te Global Health Observatory Data Repository (Accessed April )
Calculations by Save the Children.
Sources: WHO Global Database on ChildGrowth and Malnutrition (Accessed March) and UNICEF. e State of the World’s Children . able , p.
WHO Global Database on Child Growthand Malnutrition (Accessed March )
WHO. Te Global Health Observatory Data Repository (Accessed April )
Centers for Disease Control andPrevention. “Racial and Ethnic Dierencesin Breastfeeding Initiation and Duration,by State – National Immunization Survey,United States, -,” Morbidity and
Mortality Weekly Report , Vol. , No. ,
March , . pp.-. Ibid.
U.S. Department of Health and HumanServices, Centers for Disease Control andPrevention. Breastfeeding Report Card – United States, . (Atlanta: August )
Australian Health Ministers Conference. Australian National Breastfeeding Strategy - . (Canberra: ) pp.-
NHS Information Centre. Infant Feeding Survey : Early Results. June , .ic.nhs.uk/pubs/infantfeeding
Bolling, Keith, Catherine Grant, Becky
Hamlyn and Alex Tornton. Infant Feeding Survey . NHS Information Centre.. pp.,
Hanna, Jennifer and Mari Douma.Barriers to Breastfeeding in Women of Lower Socioeconomic Status , Michigan StateUniversity. .
UNICEF, e Baby-Friendly Hospital Initiative. unicef.org/programme/breastfeeding/baby.htm#
Ibid.
Cattaneo, Adriano, Agneta Yngve,Berthold Koletzko and Luis Ruiz Guzman.
“Promotion of Breastfeeding in EuropeProject: Protection, Promotion and Support
of Breast-Feeding in Europe: CurrentSituation.” Public Health Nutrition. Vol. ,No.. . pp.-
Hofvander, Yngve. “Breastfeeding and theBaby Friendly Hospitals Initiative (BFHI):Organization, Response and Outcomein Sweden and Other Countries.” ActaPaediatrica. Vol. , No. . August .
pp.–
Ogbuanu, Chinelo, Saundra Glover, Janice Probst, Jihong Liu and James Hussey.“Te Eect of Maternity Leave Length andime of Return to Work on Breastfeeding.”Pediatrics. Vol., Issue: . May , .pp.e-e
Te category “more developed” nationsincludes countries in all regions of Europe,including Central and Eastern Europeancountries as well as the Baltic States, plusNorthern America, Australia, New Zealandand Japan.
Statistics and Monitoring Section/Division of Policy and Practice/UNICEF.echnical Note: How to Calculate Average
Annual Rate of Reduction (AARR) of Underweight Prevalence. Drafted April. childinfo.org/les/echnical_Note_
AARR.pdf
See, for example, UNICEF. Tracking Progress on Child and Maternal Nutrition: ASurvival and Development Priority , p.
WHO and Linkages. Infant and Young Child Feeding: A Tool for Assessing National Practices, Policy and Programs . (WHO:Geneva )
See, for example, BPNI/ IBFAN-Asia,e State of Breastfeeding in Countries (Delhi )
Countdown to . Accountability for Maternal, Newborn & Child Survival: AnUpdate on Progress in Priority Countries. (WHO: )
For a complete list of industrializedcountries considered, see: UNICEF. e State of the World’s Children . p.
Cattaneo, et al. “Protection, Promotionand Support of Breast-Feeding in Europe:Current Situation.” Public HealthNutrition. p.
IBFAN. State of the Code by Country . (Penang, Malaysia: )
7/31/2019 Estado Mundial de las Madres
http://slidepdf.com/reader/full/estado-mundial-de-las-madres 69/70
creDitS
anain itorty gn
Principal vierp hn, Kn ln
Reearc directorNkk g, By lvn
Reearc itant Jnnf hys, My Mcmn,My Mn
Contributoramy anw, adn cn, Wndycsn, en c, t Fs, indFb, r gd, Mnk gusm,
Jss hnss, Bn hw, Db hw,smn ikmu, Mm Jm, tn
Jnsn, amnu Kn, Jy lwn, Msln, Km tj ls, hny M,isq Mnnn, r Mn, DnDs Mn, cyn Ms, c M,cud Mssy, gn Mm,p Mss, Dn Mys, N o’cnn,
Jnn omn, Dvd o, Bn ps,My B pws, t pusk, gumQd, tskn rmn, amy rub, Krdmnd, Susn rd, csn rs,ov Snn, Snjn Ss, eSbuk, cn Bn Sun, eSwdb, py s, Sv W, pk W, tny Wnb
dein
Ss, in.
Poto itorSusn Wn
Poto Creit
page 1 – eileeN BUrKeMzmbqu.Nocta feeds her 10-month-old twins a healthy porridge. At aSave the Children-sponsored weigh-in, thetwins were diagnosed as malnourished and underweight for their age.
page 4 – rachel palMerSm. Seriously malnourished Mayum,age 2, is treated at a Save the Children
stabilization clinic. She is gaining weight and should be discharged in two to three days.
page 6 – traN DUc MaNnm.Ho Thi Nan joined a breastfeeding group when she was pregnant with her fourthchild. Her son got nothing but breast milk for the rst 6 months, and he has been muchhealthier than her other three children.
page 7 – roDrigo orDóñeZKyyzsn. Altyani and her 4-month-old sonIslam have a check-up at a hospital supported by Save the Children.
page 8 – chriStiNe roehrSafnsn. Farzia, age 2, lives with her family
in a refugee camp in Kabul.
page 9 – aM reeDN. Nana and her children cook on an
open re outside their one-room home. They have no running water or sanitation.
page 10 – ShaFiQUl alaM KiroNBnds. Shilpi and her 3-month-old daughter Anika get advice about good nutritionpractices from a community health volunteer trained by Save the Children.
page 11 – JeNN WarreNSu Sudn. Moya hopes her daughter Jacqueline, age 1, will go to school, learn how to use a computer, and have a professional career when she grows up.
page 12 – aMoS gUMUliraMw.Teacher Dyna Nkundika gives alesson on numbers to girls in her rst gradeclass.
page 14 – SeBaStiaN richMzmbqu. Mothers and children receivea community meal and nutrition counseling through a Save the Children program inNamissica village.
page 21 – Michael BiScegliegum. Margarita, age 2, outside a school supported by Save the Children.
page 22 – JeNN WarreNSu Sudn. Lochebe, age 2, eats porridgeat a therapeutic feeding center supported by
Save the Children.page 25 – lUcia ZoroN. Amina, her new baby and her 2-year-old son Jalil are all healthy now. Last year, Jalil was malnourished, but he recovered through aprogram supported by Save the Children.
page 27 – rachel palMerind.Deepak, age 1, gets a dose of vitamin Afrom a community health volunteer in a slumarea of New Delhi.
page 28 – Michael BiSceglieMw. 4-month-old Hanna nurses while her mother, Agness, attends a savings and loan group meeting. Agness is the group’s treasurer.
page 29 – ap photo / Karel Naarropu. 2-month-old Sheyla and 6-month-old Maciel participate in a breastfeeding contest in Lima as part of Peru’s national breastfeeding week.
page 30 – laUreNt DUilliercô d’iv. Mothers and newborns at acamp for internally displaced people.
page 34 – Michael BiSceglienm.New mother Bui Thi Xuan receivesbreastfeeding instruction from midwife Le ThiHong Chau.
page 36 – eDUarDo MartiNoBz. A 2-year-old boy is examined by
a nurse at Carlos Tortelly Hospital in Riode Janeiro. The hospital is supported by Save the Children.
page 38 – gett iMageS / FreDriKNMaNSwdn. A mother breastfeeds her baby.
page 40 – roBert McKechNieaus. A child gets a healthy snack at aSave the Children program for socially isolated and marginalized children.
page 41 – SUSaN WarNerUnd Ss. Amanda is pregnant with her second child and working full-time.
page 46 – Mai SiMoNSeNNwy. Ragnhild breastfeeds her 15-month-old daughter Cornelia.
page 44 – rachel palMerN. Sageirou drinks fortied milk at astabilization center for malnourished childrensupported by Save the Children. He had diarrhea and was sick for four months beforehis mother brought him to the center.
page 46 – Mai SiMoNSeNNwy. Ragnhild plays with her 15-month-old daughter Cornelia.
page 47 – UNhcr / heleNe caUN. Mothers and children wait to receive
food in a refugee camp. Many of the childrenare sick with diarrhea, infections and respiratory problems.
page 48 – aMaDoU MBoDJcd. Fatima, 8 months, was diagnosed asmalnourished. She is being fed a ready-to-use therapeutic food called Plumpy’nut at aSave the Children feeding center.
page 49 – lalage SNoWafnsn. Roya, a midwife in GuldaraDistrict, does a prenatal checkup withPashtoon who is eight months pregnant.
page 50 – SUSaNNah irelaNDind. In the Okhla slum of Dehli, 15-month-old Mahima has never had milk or vegetablesin her lifetime. She is the size of a 6-month-old and is dangerously malnourished.
page 59 – SeBaStiaN richMzmbqu. Joaquim, 2 years and 2 monthsold, weighs 14.5 pounds. A healthy child thisage should weigh about twice as much.
BacK coer – JeNN WarreNSu Sudn. The last harvest was bad and Lochoke does not have enough food to feed her family, including her 18-month-old daughter Narot, who is suffering frompneumonia.
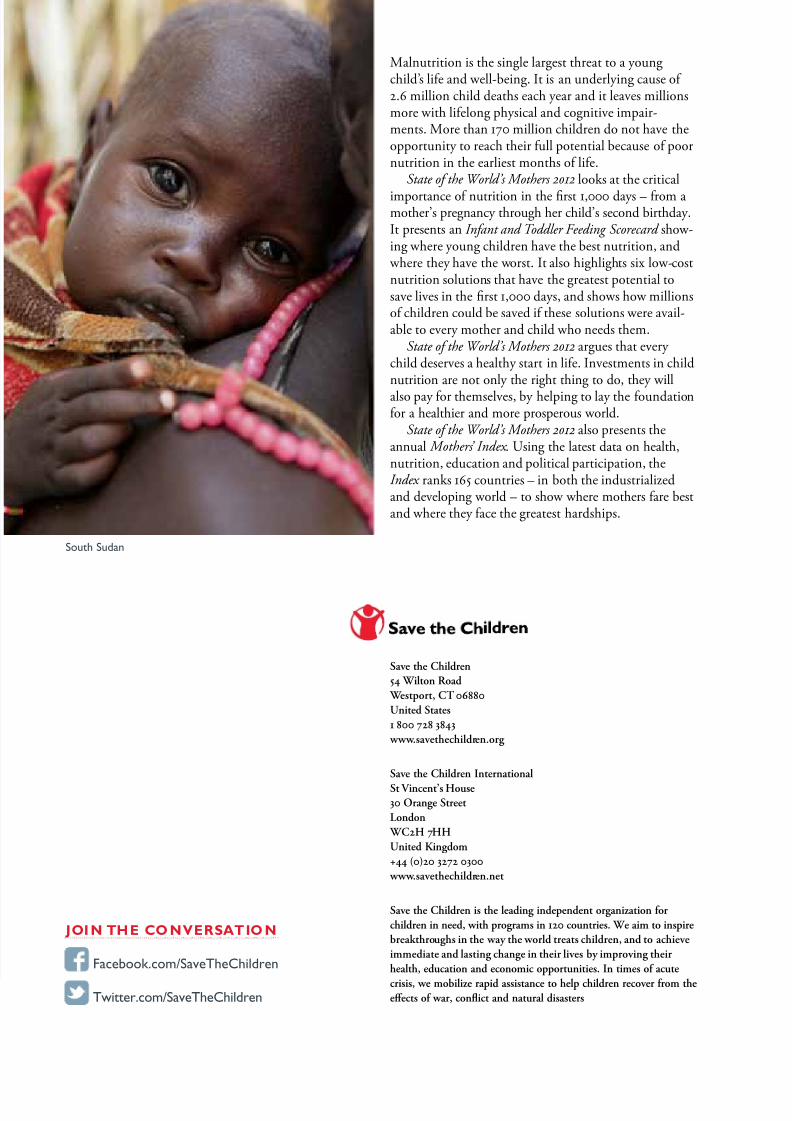
7/31/2019 Estado Mundial de las Madres
http://slidepdf.com/reader/full/estado-mundial-de-las-madres 70/70
Malnutrition is the single largest threat to a youngchild’s life and well-being. It is an underlying cause of 2.6 million child deaths each year and it leaves millionsmore with lifelong physical and cognitive impair-ments. More than 170 million children do not have theopportunity to reach their full potential because of poornutrition in the earliest months of life.
State of the World’s Mothers 01 looks at the critical
importance of nutrition in the rst 1,000 days – from amother’s pregnancy through her child’s second birthday.It presents an Infant and Toddler Feeding Scorecard show-ing where young children have the best nutrition, and where they have the worst. It also highlights six low-costnutrition solutions that have the greatest potential tosave lives in the rst 1,000 days, and shows how millionsof children could be saved if these solutions were avail-able to every mother and child who needs them.
State of the World’s Mothers 01 argues that every child deserves a healthy start in life. Investments in childnutrition are not only the right thing to do, they will
also pay for themselves, by helping to lay the foundationfor a healthier and more prosperous world.
State of the World’s Mothers 01 also presents theannual Mothers’ Index . Using the latest data on health,nutrition, education and political participation, theIndex ranks 165 countries – in both the industrializedand developing world – to show where mothers fare bestand where they face the greatest hardships.
Save the Children54 Wilton Road Westport, C 06880United States1 800 78 3843 www.savethechildren.org
Save the Children International
St Vincent’s House30 Orange StreetLondon WCH 7HHU it d Ki d
Su Sudn


